12
Aviation, jobs and the UK economy Stop Stansted Expansion August 2011 www.stopstanstedexpansion.com
Aviation, jobs and the UK economy Stop Stansted Expansion August 2011 www.stopstanstedexpansion.com
1
1. Introduction
1.1 In March 2011, the Department for Transport (‘DfT’) published ‘Developing a sustainable framework for UK aviation: Scoping document’ for consultation. This is the first formal stage in the process of developing a new policy framework for UK aviation to replace the policies set down in the previous Government’s 2003 ‘Future of Air Transport’ White Paper (‘ATWP’). Simultaneously, Labour is conducting its own Transport Review.
1.2 Under whichever colour of Government, the DfT has generally seen its role as being to support the expansion of UK aviation whilst trying to strike an appropriate balance between what DfT sees as the economic and employment benefits of aviation and its environmental impacts.
1.3 There has been a great deal of analysis of the scale and nature of the environmental impacts of aviation but far less examination of its economic and employment impacts. One of the results of this is that the DfT has tended to accept the aviation industry’s general claims regarding economic and employment benefits and also to accept the conclusions of industry-sponsored studies into the economic and employment benefits of air travel. There has also been inadequate recognition of the widely different nature of the UK’s airports, the different types of passengers that use them and the implications of this in assessing economic benefits and disbenefits. 1.4 Drawing upon evidence from a range of sources, this brief paper questions the widely held view that the expansion of air travel is – almost axiomatically – good for the UK economy and good for UK jobs. It concludes that there can be economic and employment benefits from the expansion of air travel but there can also be adverse economic and employment impacts.
1.5 This paper does not examine either the local or global environmental costs of UK aviation. These are the subject of a separate Stop Stansted Expansion (‘SSE’) research paper.
2. Estimating aviation’s employment impact
2.1 Aviation is defined, according to the UK Standard Industry Classification (‘SIC’) as ‘Air transport’ (SIC 51) and ‘Service activities incidental to air transportation’ (SIC 52.23). For all practical purposes exactly the same definition1 applied at the time of the 2003 ATWP which stated that the UK aviation industry provided 200,000 direct jobs in the UK.
2.2 The DfT’s 2011 Scoping Document states that the air transport sector ‘…provides about 150,000 jobs in the UK and supports many more indirectly.’ At first glance it appears that the DfT, in referring to the ‘air transport sector’ rather than ‘aviation’ is using a narrower definition than before. However, the Scoping Document goes on to explain that ‘…[its] employment figures are from ONS2 2009 Annual Business Survey… adding SIC 51 (air transport) and SIC 52.23 (service activities incidental to air transportation)’. In other words, it is the same definition as has long been used for aviation and it is far wider than ‘air transport’. It includes airport jobs as well as airline jobs.
2.3 Moreover, the aggregate of employment categories SIC 51 and SIC 52.23 was, on average, 120,000 in 2009 (down from 142,000 in 2008). It is not clear why the DfT has rounded the 2009 figure up to 150,000 direct jobs.
1 The relevant SIC groups in 2003 were SIC 62 (‘Air Transport’) and SIC 63.23 (‘Supporting air transport services’).
2 Office of National Statistics.
2
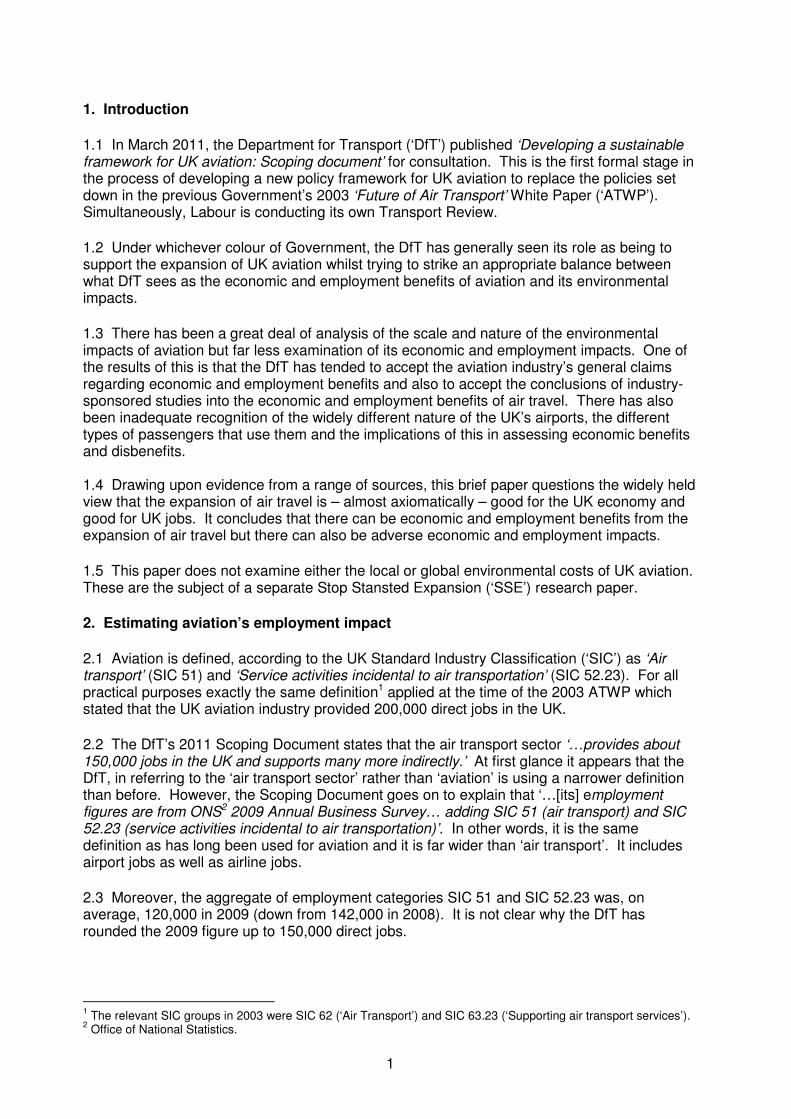
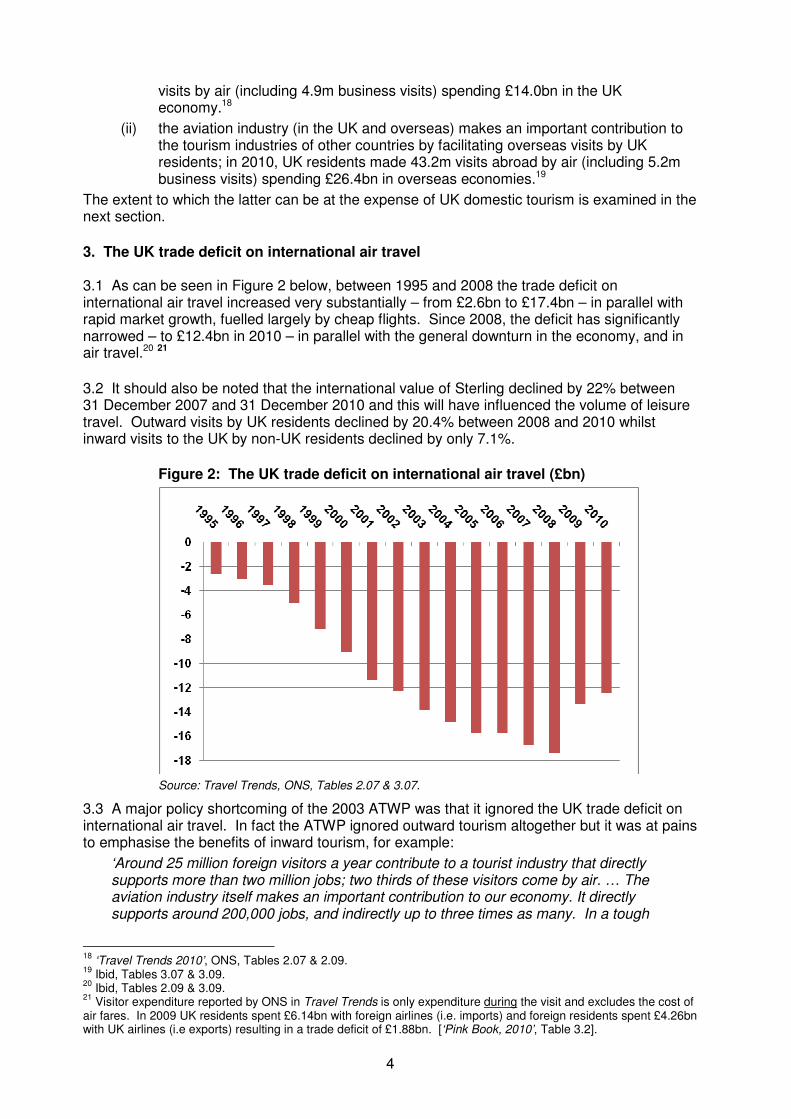
2.4 A 1999 aviation industry-sponsored report by Oxford Economic Forecasting3 (‘OEF’) put the number of direct jobs in UK aviation at 180,000, equivalent to 1,132 jobs for every million passengers carried and, in a 2006 follow-up report4, OEF updated this to 186,000 direct jobs, equivalent to 862 jobs per million passengers. This implies a remarkable 31% productivity improvement in the space of six years, albeit on the basis of the crude productivity measure of jobs per million passengers.
2.5 A third industry-sponsored report, this time by Oxford Economic Research Associates (‘Oxera’)5, published in November 2009, concluded that aviation directly provided 141,000 UK jobs in 2007. This is equivalent to 646 jobs per million passengers, which suggests an even more remarkable 75% improvement in productivity in the space of nine years.
2.6 For the UK aviation industry to achieve a 75% productivity improvement in the space of nine years stretches credulity but it may actually be broadly correct. The period 1998-2009 coincides with rapid growth in the low cost carrier (‘LCC’) sector and one of the side effects of aggressive competition from the LCCs has been to force traditional full service airlines to address their cost base, particularly labour costs. British Airways, for example, shed 42% of its workforce between 1998/99 and 2009/10.6
Figure 1: Jobs and passenger throughput in the UK aviation industry
Source: OEF 1999 and 2006 reports and the 2009 Oxera report.
2.7 Despite substantially pruning its labour force, British Airways had 1,157 employees for every million passengers in the year ended 31 March 2010 whilst Ryanair had just 106 employees per million passengers.7 British Airways and Ryanair are of course two very different types of airlines but this is nevertheless an indication of the way the industry has changed. And Ryanair now handles more than twice as many passengers as British Airways. 2.8 Evidence that today’s aviation industry generates far fewer jobs than the ‘old’ UK aviation industry can also be found by looking at past employment forecasts for Stansted, as shown in Table 1 below.
3 ‘The Contribution of the Aviation Industry to the UK Economy’. Jobs estimates based on 1998 data.
4 ‘The Economic Contribution of the Aviation Industry in the UK’. Jobs estimates based on 2004 data.
5 ‘What is the contribution of aviation to the UK economy?’.
6 British Airways Annual Report.
7 British Airways Annual Report and Ryanair Annual Report.
3
Table 1: BAA’s past employment projections for Stansted – direct jobs
Airport Inquiries 15mppa
8 (1981-83)
Planning Application for 25mppa
9 (2001)
G1 Planning Application for 35mppa
10 (2006)
G2 Planning Application for 68mppa
11 (2008)
Projected 21,000 Projected 16,000 Projected 17,200 Projected 24,800
Actual 14,000 Expected12
12,100 Expected13
15,600 Expected N/A
2.9 It can be seen from the above table that the actual level of employment at Stansted has fallen so far short of BAA’s original projections that, in 2008, when submitting its application for a second runway, BAA projected total direct employment of 24,800 for passenger throughput of 68mppa. This is just 18% more jobs than BAA projected for Stansted’s development to 15mppa. 2.10 Employment over-projections have been a common feature of airport planning applications over the years14 and many have interpreted this as deliberate exaggeration of the benefits, on the part of the applicants, in the hope of improving the likelihood of their expansion plans being approved. There will undoubtedly have been some exaggeration but it would also be fair to acknowledge that airport operators could not reasonably have anticipated the scale of change that has taken place in UK aviation since the late 1990s and the impact this has had in terms of reducing the number of jobs in the industry, seemingly by about a third since 1998, despite the number of passengers carried increasing from 159m in 1998 to 218m in 2009. (Air freight tonnage fell 2% between 1998 and 2009 but this would not have a significant effect upon jobs). 2.11 The old rule of thumb was that airports generated about 1,000 jobs per mppa. The DfT now estimates this to be about 700 jobs per mppa and the ONS statistics suggest it’s about 600 jobs per mppa. If Heathrow – which is a unique international hub operation – is excluded – the reality is that UK airports are, in future, unlikely to generate more than 300–400 jobs per mppa.
Employment in UK tourism
2.12 Depending on which estimates are used, the UK tourism industry directly employs 9–14 times more people than UK aviation. This is derived as follows: in March 2011 DCMS published a figure of 1.4m direct jobs in UK tourism15; in the same month, HM Treasury put the figure at 1.5m16; and in May 2011 the ONS published an estimate of 1.7m people directly employed in the UK as a result of tourism spend17. All of this compares to DfT’s 2009 estimate of 150,000 direct aviation jobs; to Oxera’s 2009 estimate of 141,000 direct aviation jobs; and to the ONS figure of 120,000 direct aviation jobs (2009 average), based on aggregating the two relevant SICs. 2.13 There are two main interactions between the aviation industry and the UK tourism industry:
(i) the aviation industry (in the UK and overseas) makes an important contribution to UK tourism by facilitating visits to the UK; in 2010, overseas residents made 21.4m
8 'The Airport Inquiries 1981-83', Inspectors Report, Chapter 22, Table 2.12.2, 'BAA "Best Estimates" of Stansted
Related Employment at 15mppa'. 9 BAA Stansted 2001 Planning Application, ES7, Table 4.7.
10 BAA Stansted 2006 Planning Application (‘G1’), ES6, Tables 17 & 19.
11 BAA Stansted 2008 Planning Application (‘G2’), ES7, Table 39.
12 Based on Stansted having provided 11,700 jobs in the 12 months to 31.10. 2007, handling 24.0m passengers.
13 SSE estimate based on 350 direct jobs per 1 mppa increment at Stansted.
14 This is well documented in an excellent paper by Brendon Sewill, ‘Airport jobs: false hopes, cruel hoax’, AEF,
2009. 15
‘Government Tourism Policy’, Department of Culture, Media and Sport (‘DCMS’), March 2011. 16
‘Reform of Air Passenger Duty’: a consultation’, HMT, March 2011. 17
‘UK Tourism Satellite Account for 2008’, ONS, 2011.
4
visits by air (including 4.9m business visits) spending £14.0bn in the UK economy.18
(ii) the aviation industry (in the UK and overseas) makes an important contribution to the tourism industries of other countries by facilitating overseas visits by UK residents; in 2010, UK residents made 43.2m visits abroad by air (including 5.2m business visits) spending £26.4bn in overseas economies.19
The extent to which the latter can be at the expense of UK domestic tourism is examined in the next section.
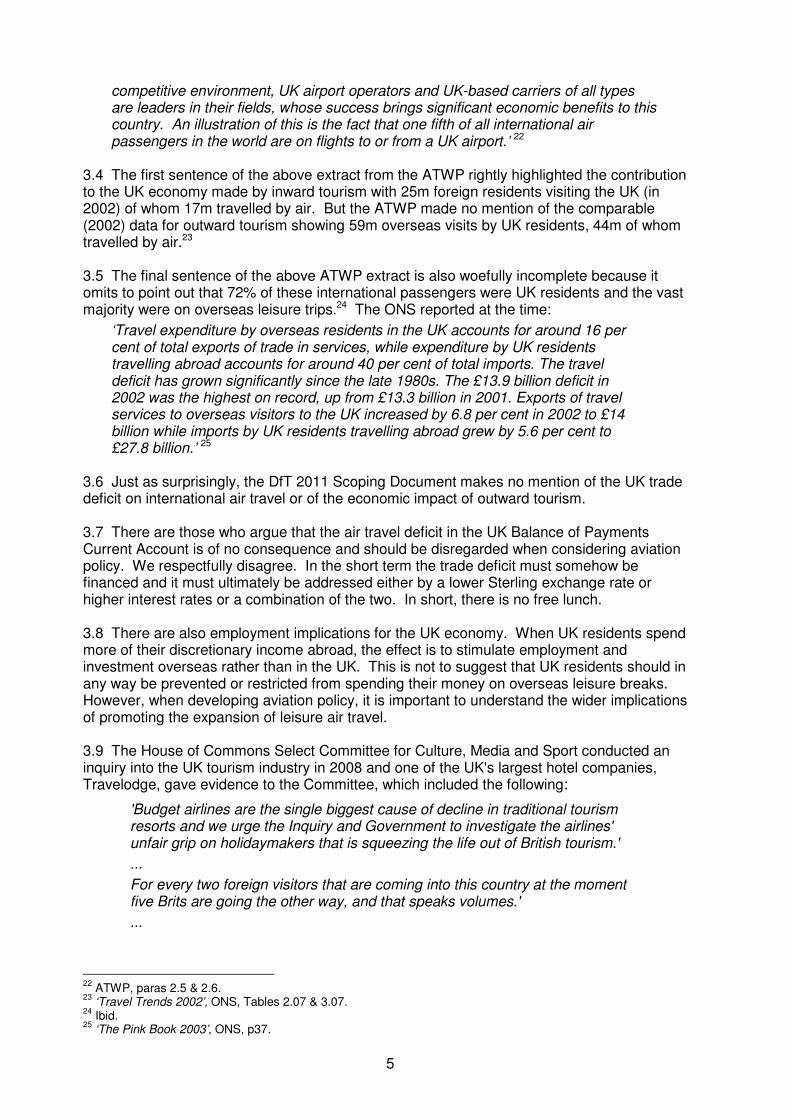
3. The UK trade deficit on international air travel 3.1 As can be seen in Figure 2 below, between 1995 and 2008 the trade deficit on international air travel increased very substantially – from £2.6bn to £17.4bn – in parallel with rapid market growth, fuelled largely by cheap flights. Since 2008, the deficit has significantly narrowed – to £12.4bn in 2010 – in parallel with the general downturn in the economy, and in air travel.20 21
3.2 It should also be noted that the international value of Sterling declined by 22% between 31 December 2007 and 31 December 2010 and this will have influenced the volume of leisure travel. Outward visits by UK residents declined by 20.4% between 2008 and 2010 whilst inward visits to the UK by non-UK residents declined by only 7.1%.
Figure 2: The UK trade deficit on international air travel (£bn)
Source: Travel Trends, ONS, Tables 2.07 & 3.07.
3.3 A major policy shortcoming of the 2003 ATWP was that it ignored the UK trade deficit on international air travel. In fact the ATWP ignored outward tourism altogether but it was at pains to emphasise the benefits of inward tourism, for example:
‘Around 25 million foreign visitors a year contribute to a tourist industry that directly supports more than two million jobs; two thirds of these visitors come by air. … The aviation industry itself makes an important contribution to our economy. It directly supports around 200,000 jobs, and indirectly up to three times as many. In a tough
18
‘Travel Trends 2010’, ONS, Tables 2.07 & 2.09. 19
Ibid, Tables 3.07 & 3.09. 20
Ibid, Tables 2.09 & 3.09. 21
Visitor expenditure reported by ONS in Travel Trends is only expenditure during the visit and excludes the cost of air fares. In 2009 UK residents spent £6.14bn with foreign airlines (i.e. imports) and foreign residents spent £4.26bn with UK airlines (i.e exports) resulting in a trade deficit of £1.88bn. [‘Pink Book, 2010’, Table 3.2].
5
competitive environment, UK airport operators and UK-based carriers of all types are leaders in their fields, whose success brings significant economic benefits to this country. An illustration of this is the fact that one fifth of all international air passengers in the world are on flights to or from a UK airport.’ 22
3.4 The first sentence of the above extract from the ATWP rightly highlighted the contribution to the UK economy made by inward tourism with 25m foreign residents visiting the UK (in 2002) of whom 17m travelled by air. But the ATWP made no mention of the comparable (2002) data for outward tourism showing 59m overseas visits by UK residents, 44m of whom travelled by air.23 3.5 The final sentence of the above ATWP extract is also woefully incomplete because it omits to point out that 72% of these international passengers were UK residents and the vast majority were on overseas leisure trips.24 The ONS reported at the time:
‘Travel expenditure by overseas residents in the UK accounts for around 16 per cent of total exports of trade in services, while expenditure by UK residents travelling abroad accounts for around 40 per cent of total imports. The travel deficit has grown significantly since the late 1980s. The £13.9 billion deficit in 2002 was the highest on record, up from £13.3 billion in 2001. Exports of travel services to overseas visitors to the UK increased by 6.8 per cent in 2002 to £14 billion while imports by UK residents travelling abroad grew by 5.6 per cent to £27.8 billion.’ 25
3.6 Just as surprisingly, the DfT 2011 Scoping Document makes no mention of the UK trade deficit on international air travel or of the economic impact of outward tourism. 3.7 There are those who argue that the air travel deficit in the UK Balance of Payments Current Account is of no consequence and should be disregarded when considering aviation policy. We respectfully disagree. In the short term the trade deficit must somehow be financed and it must ultimately be addressed either by a lower Sterling exchange rate or higher interest rates or a combination of the two. In short, there is no free lunch. 3.8 There are also employment implications for the UK economy. When UK residents spend more of their discretionary income abroad, the effect is to stimulate employment and investment overseas rather than in the UK. This is not to suggest that UK residents should in any way be prevented or restricted from spending their money on overseas leisure breaks. However, when developing aviation policy, it is important to understand the wider implications of promoting the expansion of leisure air travel. 3.9 The House of Commons Select Committee for Culture, Media and Sport conducted an inquiry into the UK tourism industry in 2008 and one of the UK's largest hotel companies, Travelodge, gave evidence to the Committee, which included the following:
'Budget airlines are the single biggest cause of decline in traditional tourism resorts and we urge the Inquiry and Government to investigate the airlines' unfair grip on holidaymakers that is squeezing the life out of British tourism.'
...
For every two foreign visitors that are coming into this country at the moment five Brits are going the other way, and that speaks volumes.'
...
22
ATWP, paras 2.5 & 2.6. 23
‘Travel Trends 2002’, ONS, Tables 2.07 & 3.07. 24
Ibid. 25
‘The Pink Book 2003’, ONS, p37.
6
'A 10% reduction in overseas flights by British tourists by 2020 would create 31,250 jobs and inject £1 billion into struggling tourism locations outside of London.' 26
3.10 In a similar vein, a 2004 report by the Association of British Travel Agents (‘ABTA’) said:
'The majority of the respondents said that demand was staying the same. Those reporting a decline in UK sales through their agency cited direct selling by tour operators as the reason. Others felt that the rise of low cost carriers meant that European holidays provided better value to customers than UK holidays.' 27
and a 2006 report by Visit London stated:
'... the domestic market is likely to remain subdued. Lower consumer spending coupled with the continuing availability of cheap air flights to the continent continues to have a negative impact on the capital.' 28
3.11 As a result of research carried out by SSE in 200729 it was estimated that one full time equivalent (‘FTE’) job in the UK tourism industry is created for every additional £31,000 of expenditure in the industry. Updating this estimate to Q2 2011 in line with average earnings takes the figure to about £33,400 which equates to 30,000 jobs for every £1bn of additional expenditure. This is similar to the recently published DCMS estimate30 of 25,000 additional jobs for every £1bn of additional expenditure. 3.12 According to research commissioned by VisitEngland into the impact of the economic downturn on the domestic tourism industry, 13% of the UK population replaced a foreign holiday with one at home in 200931 – the so called ‘staycation’ phenomenon – and this increased to 19% in 2010.32 The results of this research appear to be broadly consistent with the 20% fall in overseas holiday trips by UK residents between 2008 and 2010 (from 45.5m to 36.4m).33 3.13 One of the effects of the staycation phenomenon was a £5bn reduction in the UK trade deficit on international travel between 2008 and 2010 – entirely due to a reduction in overseas spending by UK residents (i.e. imports) which fell from £31.5bn to £26.4bn. Expenditure by foreign residents in the UK (i.e. exports) also reduced over the period but only fractionally, from £14.1bn to £14.0bn. 3.14 If this £5bn reduction in overseas holiday spend by UK residents was switched to the UK’s domestic tourism sector it would have generated 125,000 – 150,000 additional jobs. In practice, however, some of the £5bn would have reflected the reduction in UK consumers’ discretionary income between 2008 and 2010; some would have been switched to other purchases (including purchases of imported goods); and some would simply have been saved. 3.15 It would require more detailed research to produce a reliable estimate of the extent to which the UK’s domestic tourism industry competes with overseas tourism for UK consumers’ discretionary expenditure. However, we can confidently say that some switching of tourism expenditure from overseas to the UK has taken place over the past two-three years and this will have benefitted the UK economy and UK employment.
26
Transcript of oral evidence to House of Commons Culture, Media and Sport Committee, 29 Jan 2008, and Travelodge press release of same date. 27
UK Tourism Survey, ABTA, 2004. 28
'Prospects for 2006', Visit London, 2006. 29
http://www.stopstanstedexpansion.com/documents/SSE10a_Proof_Employment_&_Housing.pdf, para 4.3.16. 30
’Government Tourism Policy’, DCMS, March 2011, Prime Minister’s Foreword ‘… £2 billion worth of extra spend to the UK and help to create 50 000 new jobs across the country’. 31
The Credit Crunch and the Future of the Staycation (April 2010). 32
Update on the Staycation Wave 3 - March 2011. 33
Travel Trends 2009 & 2010, ONS, Table 3.07; Total holiday visits abroad by UK residents by all modes of transport.
7
Policy development
3.16 There are signs that the Government now recognises the need to tackle the UK’s trade deficit on international tourism. The ‘Government Tourism Policy’ published by DCMS in March 2011 graphs the UK’s tourism trade imbalance over the period 1985-2010 and provides the following commentary:
‘Clearly, part of the answer to tackling this trade deficit lies in attracting more foreign visitors, which is why major sporting events like the Olympics are so important. But boosting domestic tourism can make a huge positive contribution too.
Equally, it’s inevitable that strong and uncontrollable external forces such as exchange rate movements or the vagaries of our weather will mean our balance of trade will be highly volatile from year to year. Nonetheless, in spite of the volatility we must create an underlying trend of rebalancing this area of the visitor economy. There will be big variations from year to year but, over time, our goal should be to persuade more of us to holiday at home. In measurable terms we should increase the proportion of UK residents who holiday in the UK to match those who holiday abroad each year.’ 34
3.17 The Government’s recognition of the need to tackle the trade deficit on international travel is long overdue and we note that the Government has a twin track strategy to deliver this policy objective, i.e. partly by attracting more foreign visitors and partly by increasing the proportion of UK residents who holiday in the UK. 3.18 An examination of the elasticity of demand for leisure air travel leads one to the clear conclusion that increasing the price of air travel would be a highly effective policy tool in tackling the UK’s trade deficit on international air travel, as will be explained in the next section. 4. Policy implications 4.1 The size of UK air travel deficit has shown itself to be highly sensitive to the overall size of the UK air travel market:
• 1995 to 2008 – the market grew 82% and the deficit grew by 562%
• 2008 to 2010 – the market shrank 10% and the deficit shrank by 29% 4.2 The explanation for this high level of sensitivity can largely be found by looking at the composition of the UK international air travel market and the relative price elasticities of the key segments.
34
‘Government Tourism Policy’, DCMS, March 2011.
8
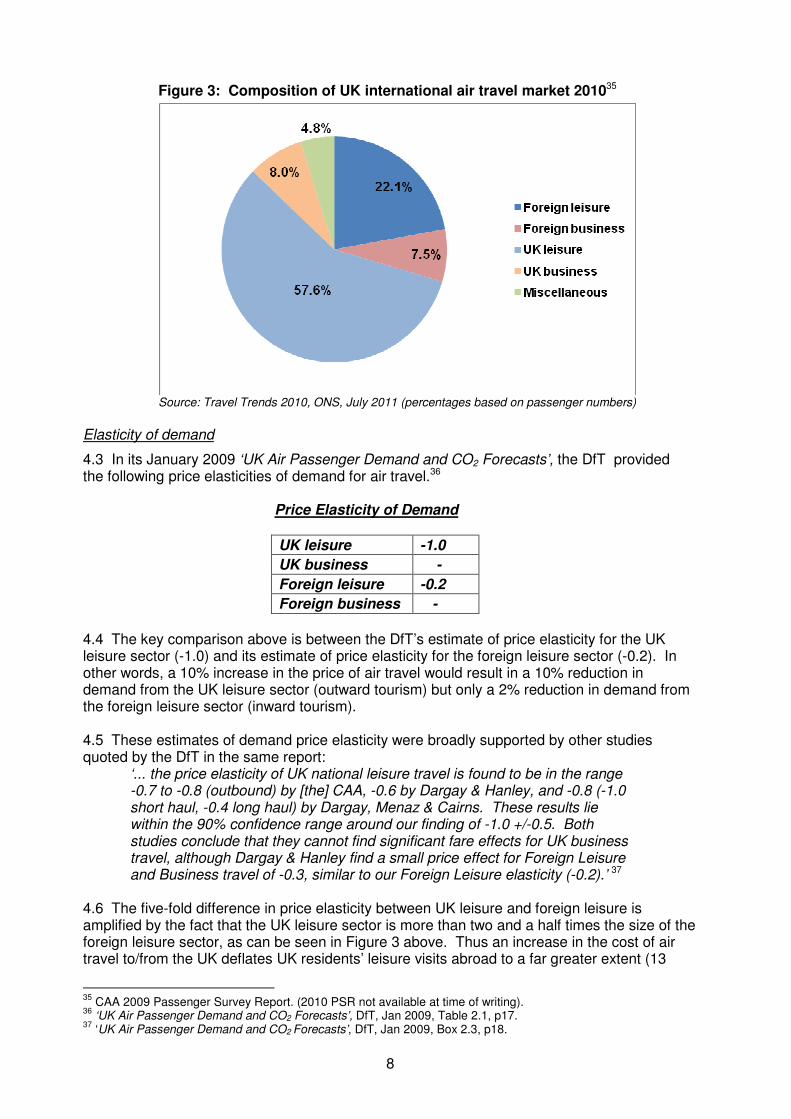
Figure 3: Composition of UK international air travel market 201035
Source: Travel Trends 2010, ONS, July 2011 (percentages based on passenger numbers)
Elasticity of demand
4.3 In its January 2009 ‘UK Air Passenger Demand and CO2 Forecasts’, the DfT provided the following price elasticities of demand for air travel.36
Price Elasticity of Demand
UK leisure -1.0
UK business -
Foreign leisure -0.2
Foreign business -
4.4 The key comparison above is between the DfT’s estimate of price elasticity for the UK leisure sector (-1.0) and its estimate of price elasticity for the foreign leisure sector (-0.2). In other words, a 10% increase in the price of air travel would result in a 10% reduction in demand from the UK leisure sector (outward tourism) but only a 2% reduction in demand from the foreign leisure sector (inward tourism). 4.5 These estimates of demand price elasticity were broadly supported by other studies quoted by the DfT in the same report:
‘... the price elasticity of UK national leisure travel is found to be in the range -0.7 to -0.8 (outbound) by [the] CAA, -0.6 by Dargay & Hanley, and -0.8 (-1.0 short haul, -0.4 long haul) by Dargay, Menaz & Cairns. These results lie within the 90% confidence range around our finding of -1.0 +/-0.5. Both studies conclude that they cannot find significant fare effects for UK business travel, although Dargay & Hanley find a small price effect for Foreign Leisure and Business travel of -0.3, similar to our Foreign Leisure elasticity (-0.2).’ 37
4.6 The five-fold difference in price elasticity between UK leisure and foreign leisure is amplified by the fact that the UK leisure sector is more than two and a half times the size of the foreign leisure sector, as can be seen in Figure 3 above. Thus an increase in the cost of air travel to/from the UK deflates UK residents’ leisure visits abroad to a far greater extent (13
35
CAA 2009 Passenger Survey Report. (2010 PSR not available at time of writing). 36
‘UK Air Passenger Demand and CO2 Forecasts’, DfT, Jan 2009, Table 2.1, p17. 37
‘UK Air Passenger Demand and CO2 Forecasts’, DfT, Jan 2009, Box 2.3, p18.
9
times greater, based on the 2010 data38) than it deflates leisure visits to the UK by foreign residents. The converse is also true with regard to a decrease in the price of air travel and this helps to explain why the boom in cheap flights between the mid-1990s and 2008 was accompanied by a spiralling of the UK trade deficit on international air travel. 4.7 The above analysis – and the empirical evidence since the mid-1990s – strongly indicates that reducing the price of air travel results in an increase in the UK trade deficit and vice versa. Moreover, the comparative factor of 13 times the effect on imports (outward visits) as on exports (inward visits) strongly indicates that a higher price of air travel would result in a jobs benefit for the UK; only a small proportion of the consumer expenditure which was no longer being spent on overseas leisure visits would need to be spent in the UK economy for there to be a net gain.
Regional impacts
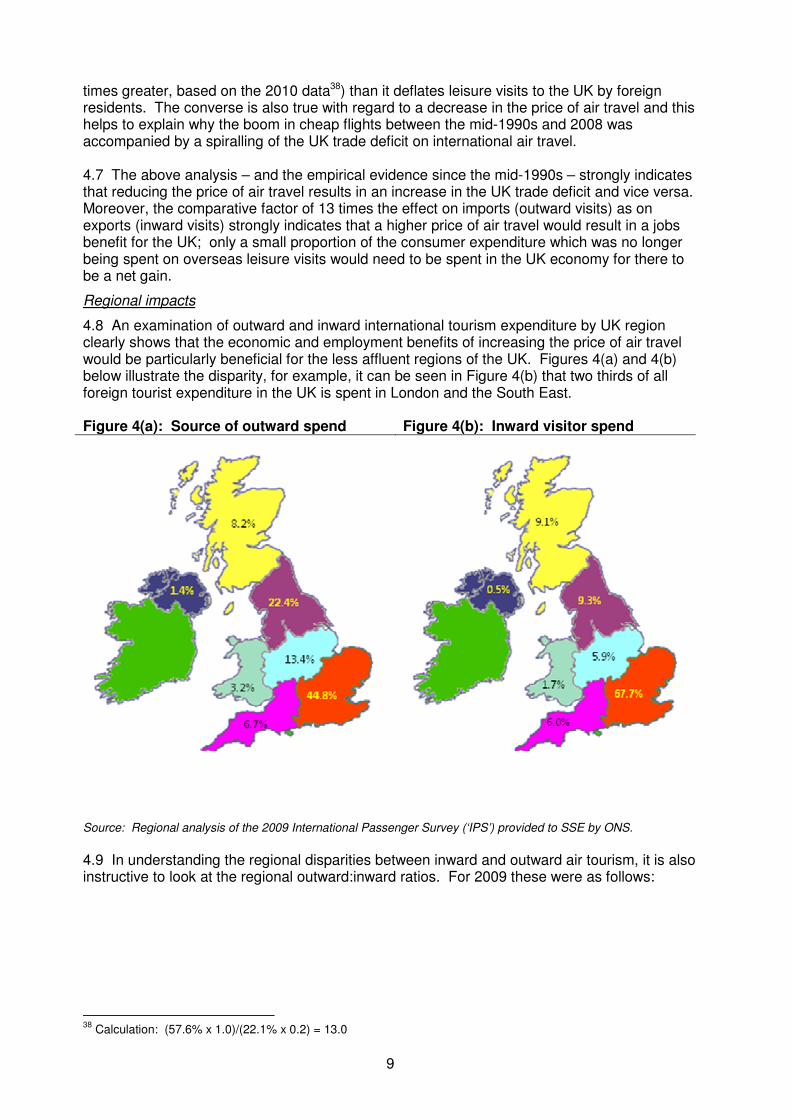
4.8 An examination of outward and inward international tourism expenditure by UK region clearly shows that the economic and employment benefits of increasing the price of air travel would be particularly beneficial for the less affluent regions of the UK. Figures 4(a) and 4(b) below illustrate the disparity, for example, it can be seen in Figure 4(b) that two thirds of all foreign tourist expenditure in the UK is spent in London and the South East. Figure 4(a): Source of outward spend Figure 4(b): Inward visitor spend
Source: Regional analysis of the 2009 International Passenger Survey (‘IPS’) provided to SSE by ONS.
4.9 In understanding the regional disparities between inward and outward air tourism, it is also instructive to look at the regional outward:inward ratios. For 2009 these were as follows:
38
Calculation: (57.6% x 1.0)/(22.1% x 0.2) = 13.0
10
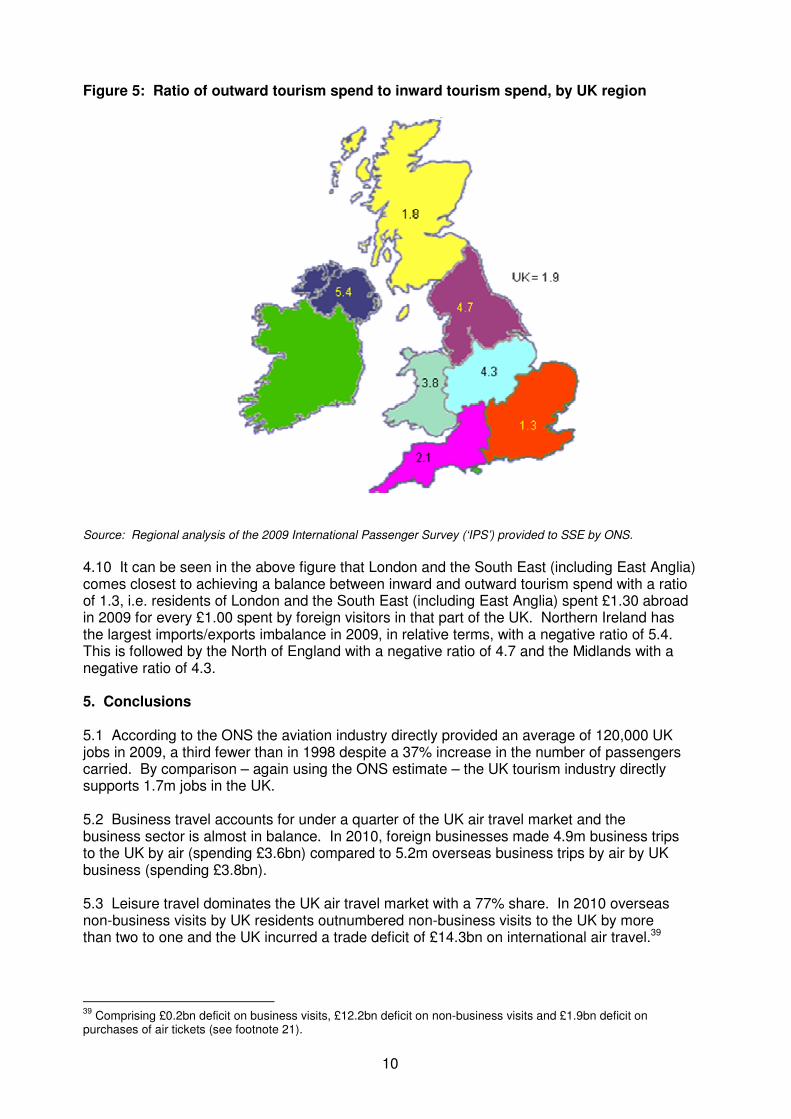
Figure 5: Ratio of outward tourism spend to inward tourism spend, by UK region
Source: Regional analysis of the 2009 International Passenger Survey (‘IPS’) provided to SSE by ONS.
4.10 It can be seen in the above figure that London and the South East (including East Anglia) comes closest to achieving a balance between inward and outward tourism spend with a ratio of 1.3, i.e. residents of London and the South East (including East Anglia) spent £1.30 abroad in 2009 for every £1.00 spent by foreign visitors in that part of the UK. Northern Ireland has the largest imports/exports imbalance in 2009, in relative terms, with a negative ratio of 5.4. This is followed by the North of England with a negative ratio of 4.7 and the Midlands with a negative ratio of 4.3. 5. Conclusions 5.1 According to the ONS the aviation industry directly provided an average of 120,000 UK jobs in 2009, a third fewer than in 1998 despite a 37% increase in the number of passengers carried. By comparison – again using the ONS estimate – the UK tourism industry directly supports 1.7m jobs in the UK. 5.2 Business travel accounts for under a quarter of the UK air travel market and the business sector is almost in balance. In 2010, foreign businesses made 4.9m business trips to the UK by air (spending £3.6bn) compared to 5.2m overseas business trips by air by UK business (spending £3.8bn). 5.3 Leisure travel dominates the UK air travel market with a 77% share. In 2010 overseas non-business visits by UK residents outnumbered non-business visits to the UK by more than two to one and the UK incurred a trade deficit of £14.3bn on international air travel.39
39
Comprising £0.2bn deficit on business visits, £12.2bn deficit on non-business visits and £1.9bn deficit on purchases of air tickets (see footnote 21).
11
5.4. Overseas leisure travel has an undoubted social value for UK residents and it benefits the countries visited by providing them with foreign currency earnings, jobs and investment. There are however certain adverse economic impacts for the UK, particularly in relation to UK jobs and investment. More detailed research would be needed in order to reliably quantify the economic and employment impacts but we can estimate that the employment impact of the UK deficit on international air travel could be up to 430,000 UK jobs.40 5.5 The largest air tourism imbalances are in the least affluent regions of the UK, for example, the North of England has a ratio of 4.7 outward tourists for every overseas visitor. As a result, these are the areas whose local economies and jobs’ markets would have most to gain if a better balance could be achieved between outward, inward and domestic tourism. 5.6 The five-fold difference in price elasticity between the UK leisure and foreign leisure sectors of the air travel market has important implications for Government policy. It means that price can be a very effective lever for dampening outward leisure air travel without having too much effect on inward leisure air travel. The policy implications of this are particularly important in relation to the taxation of air travel and the delivery of the Government’s objective announced earlier this year ‘…to increase the proportion of UK residents who holiday in the UK to match those who holiday abroad each year.’ 41 Stop Stansted Expansion August 2011
40
Based on 30,000 jobs per £1bn and deficit of £14.3bn in 2010 (£12.4bn on visits and £1.9bn on air tickets). 41
‘Government Tourism Policy’, DCMS, March 2011, para 2.2.


