56
AVICC: Solid Waste Workshop June 19, 2015
AVICC: Solid Waste Workshop
June 19, 2015

• Introductions
• Project Objectives
• Solid Waste System Overviews
• Solid Waste Management Trends
• SWOT Analysis
• Break Out Sessions
• Presentations
• Next Steps
Workshop Agenda
Introductions
• Workshop Leader(s)
– Wilbert Yang, P. Eng., Senior Waste Management Engineer
– Avery Gottfried, ME, P. Eng., Solid Waste Planning Engineer
– Jessica Frank, Project Management Coordinator
• AVICC Representatives
– Your name
– Who you represent
– Expectations for the workshop
Workshop Objectives
• Baseline for solid waste management practices for Vancouver Island and Coastal Communities
• Understanding of issues and challenges
• Identify opportunities for collaboration
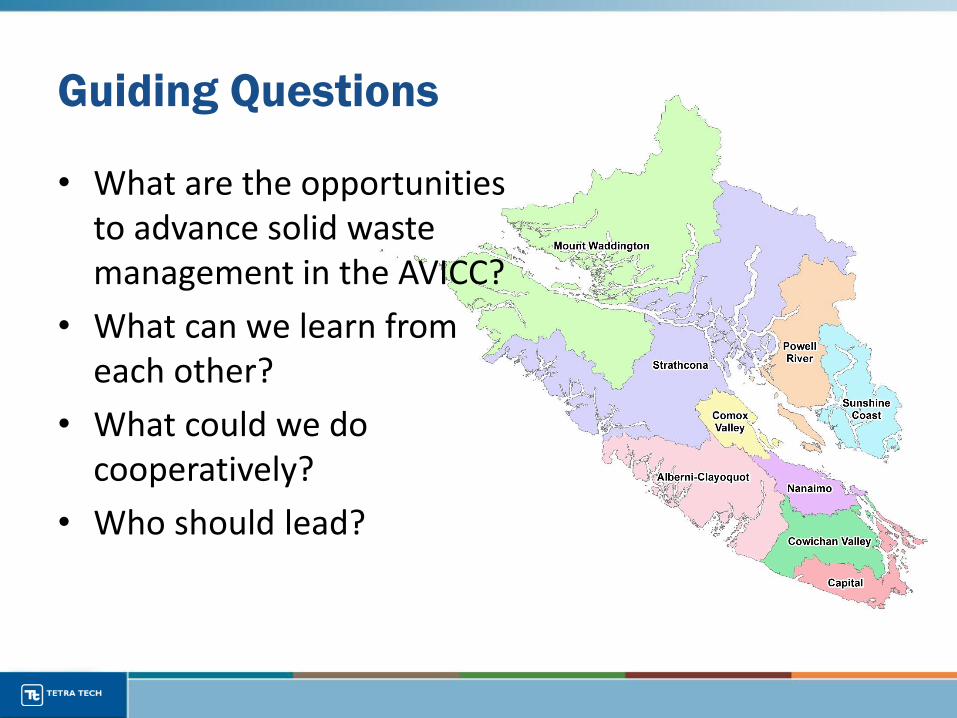
Guiding Questions
• What are the opportunities to advance solid waste management in the AVICC?
• What can we learn from each other?
• What could we do cooperatively?
• Who should lead?

Project Deliverable
• Report that summarizes workshop objectives
• Presentation in a “Consumer Report” style to help regional districts:
– Understand solid waste system performance;
– Identify areas for improvement;
– Learn from others; and
– Opportunities for collaboration.

• Population: 800,000
• Population Distribution: 88% in 4 Regional Districts
• Disposal (2013): 325,000 tonnes
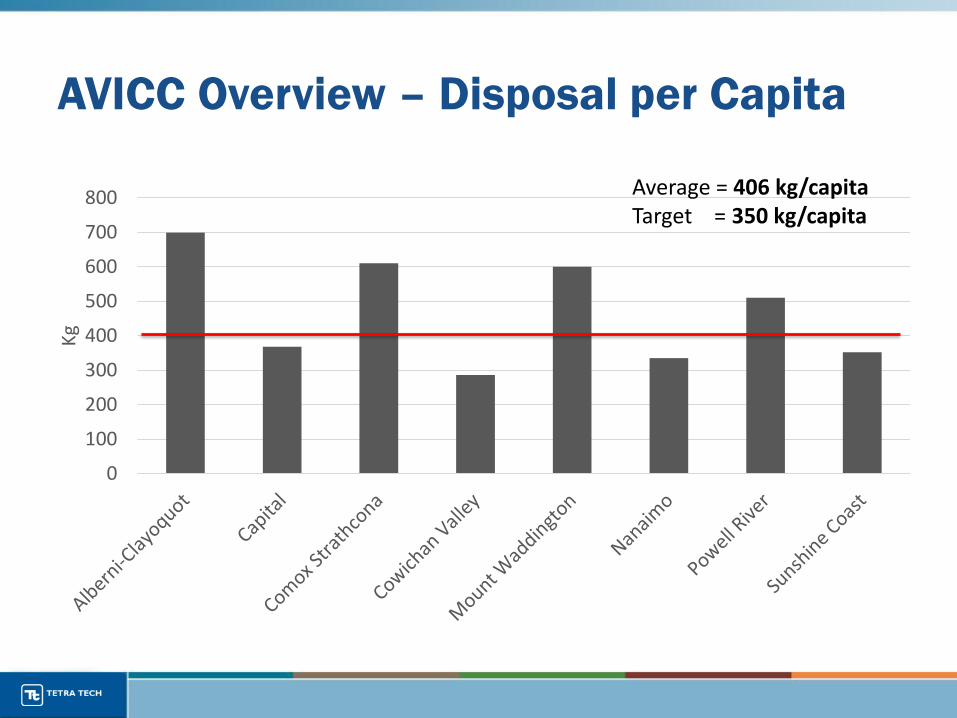
• Disposal per capita*: 403 kg/capita– Range: 286 to 699 kg/capita
– BC Average (2012): 570 kg/capita
• Tipping fees (average): $133/tonne– Range: $95 to $215 /tonne
* Construction & Demolition disposal figures not complete
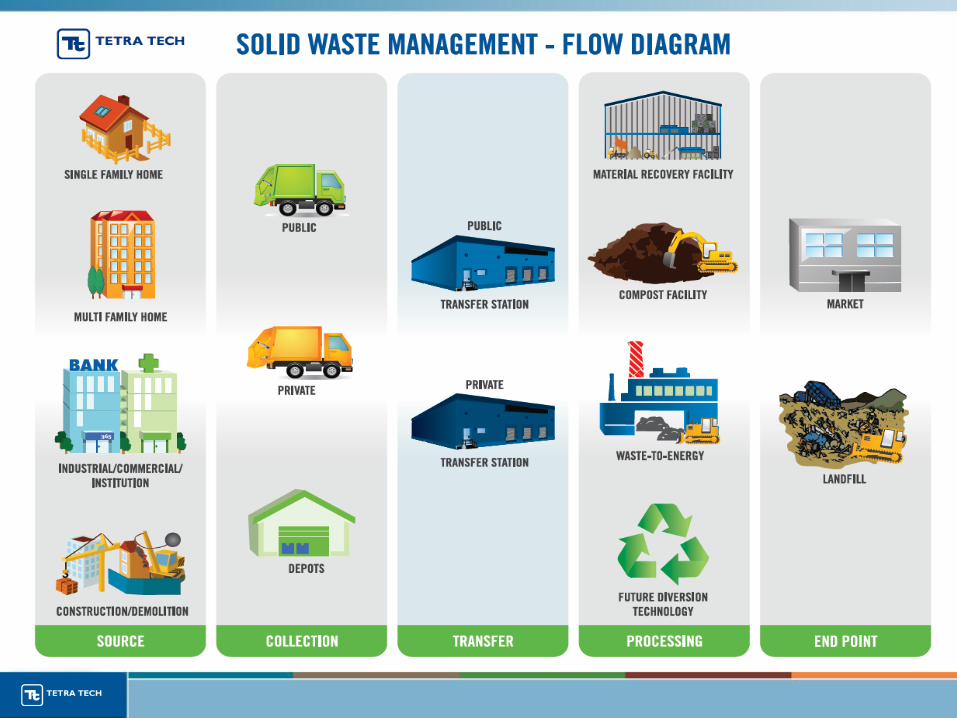
AVICC Overview - Disposal

Landfill and Composting Operations
0
100
200
300
400
500
600
700
800
Kg
AVICC Overview – Disposal per Capita
Average = 406 kg/capitaTarget = 350 kg/capita
0
10
20
30
40
50
60
70
80
90
Year
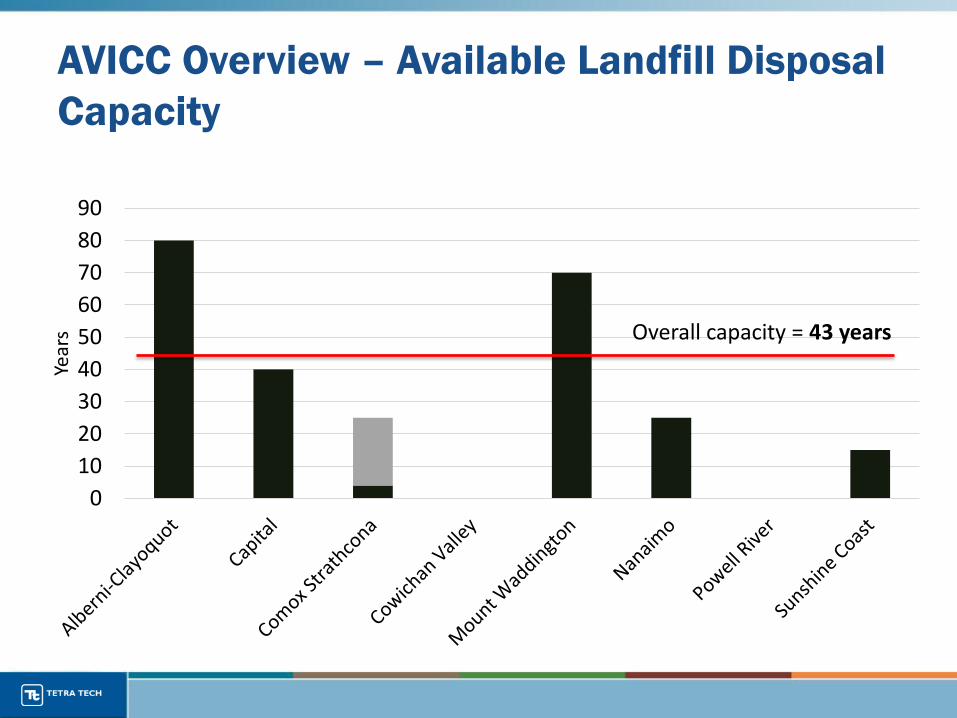
sAVICC Overview – Available Landfill Disposal
Capacity
Overall capacity = 43 years
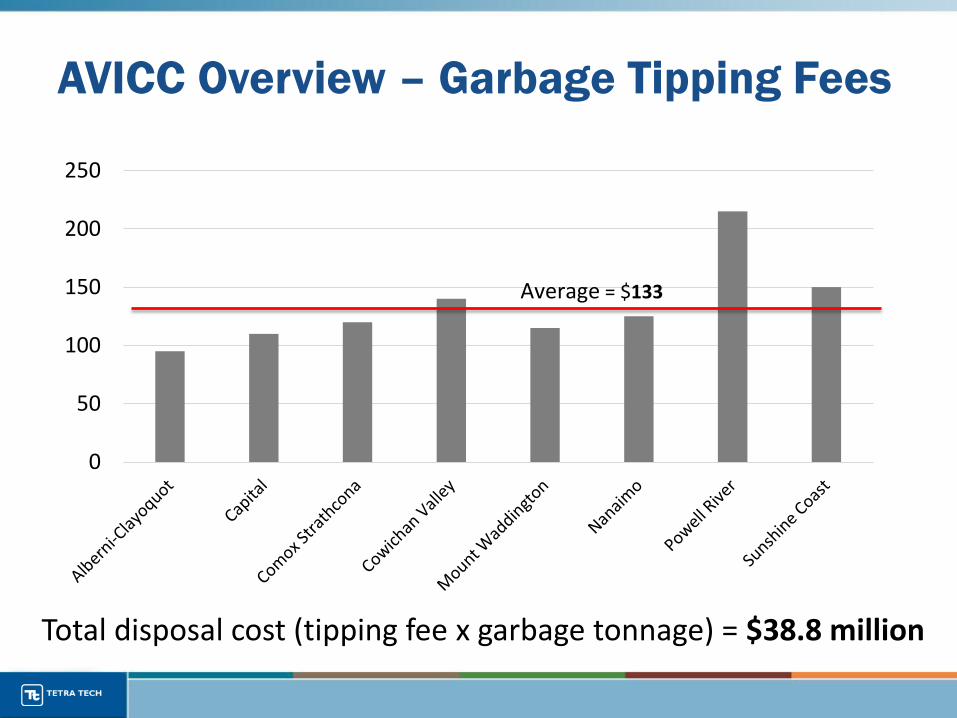
AVICC Overview – Garbage Tipping Fees
Total disposal cost (tipping fee x garbage tonnage) = $38.8 million
0
50
100
150
200
250
Average = $133

• Recycling:– More recycled than disposed (364,630 tonnes)
– Almost all communities receives incentives from MMBC
• Recycled per capita (Average): 456 kg/capita– Range 86 to 595 kg/capita
• 7 Material Recycling Facilities in the AVICC area– CRD
– CSWM
– NRD
AVICC Overview - Recycling
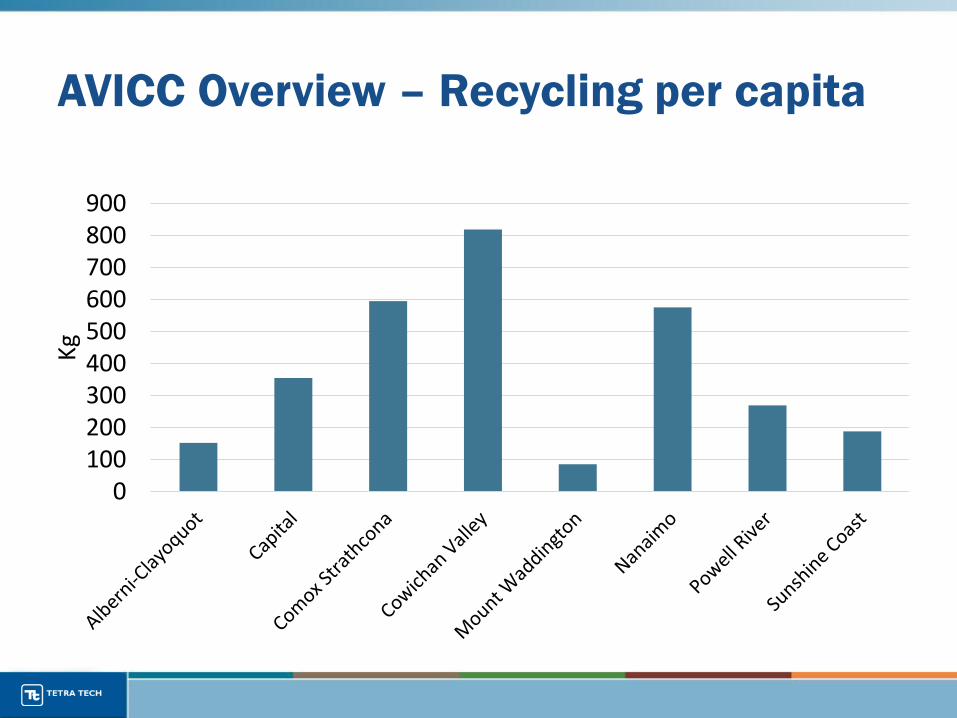
AVICC Overview – Recycling per capita
0100200300400500600700800900
Kg
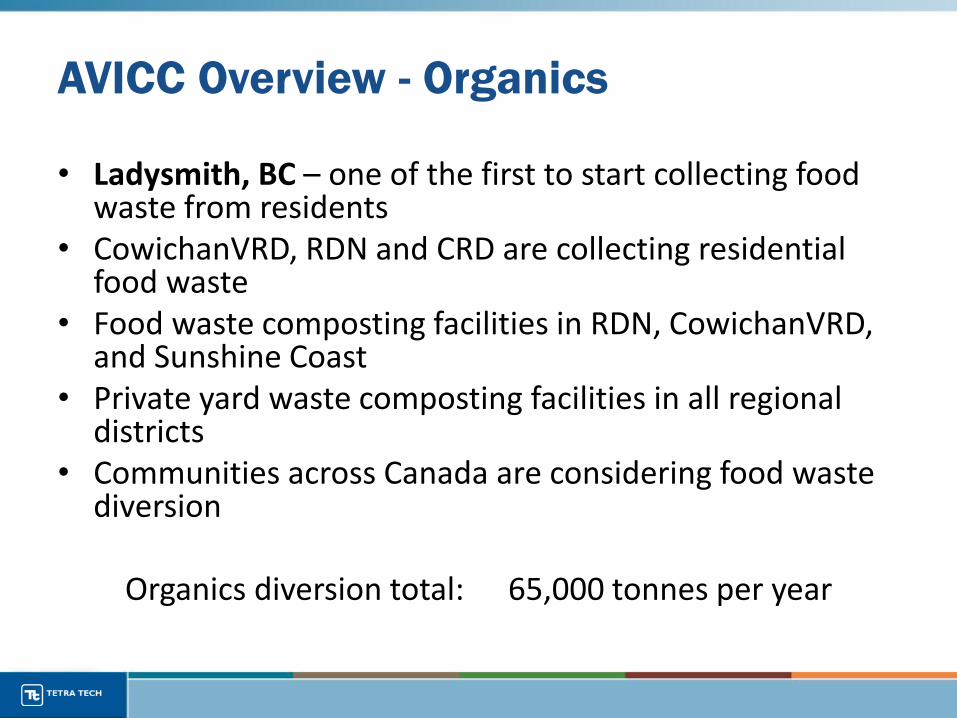
AVICC Overview - Organics
• Ladysmith, BC – one of the first to start collecting food waste from residents
• CowichanVRD, RDN and CRD are collecting residential food waste
• Food waste composting facilities in RDN, CowichanVRD, and Sunshine Coast
• Private yard waste composting facilities in all regional districts
• Communities across Canada are considering food waste diversion
Organics diversion total: 65,000 tonnes per year

Solid Waste Management Plan
1985 1990 1995 2000 2005 2010 2015
Capital
Mount Waddington
Powell River
Nanaimo
Cowichan Valley
Alberni-Clayoquot
Sunshine Coast
Comox Strathcona
Year of Approval
New Plan - Phase 2
New Plan - Phase 1
New Plan - Phase 3
New Plan - Phase 3
Review of Existing Plan
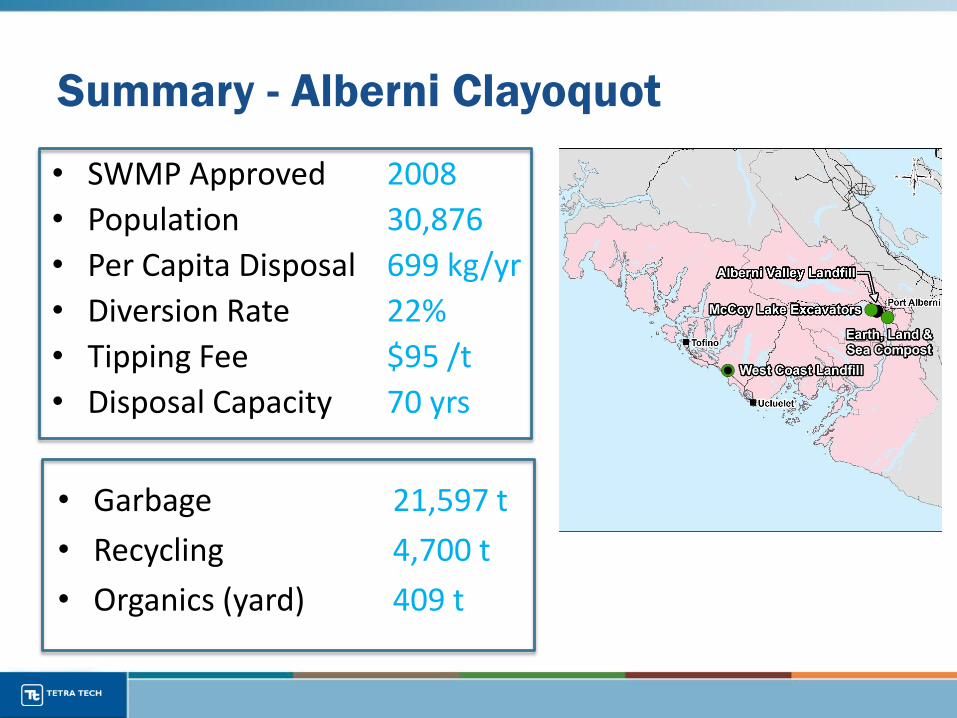
Summary - Alberni Clayoquot
• SWMP Approved 2008
• Population 30,876
• Per Capita Disposal 699 kg/yr
• Diversion Rate 22%
• Tipping Fee $95 /t
• Disposal Capacity 70 yrs
• Garbage 21,597 t
• Recycling 4,700 t
• Organics (yard) 409 t
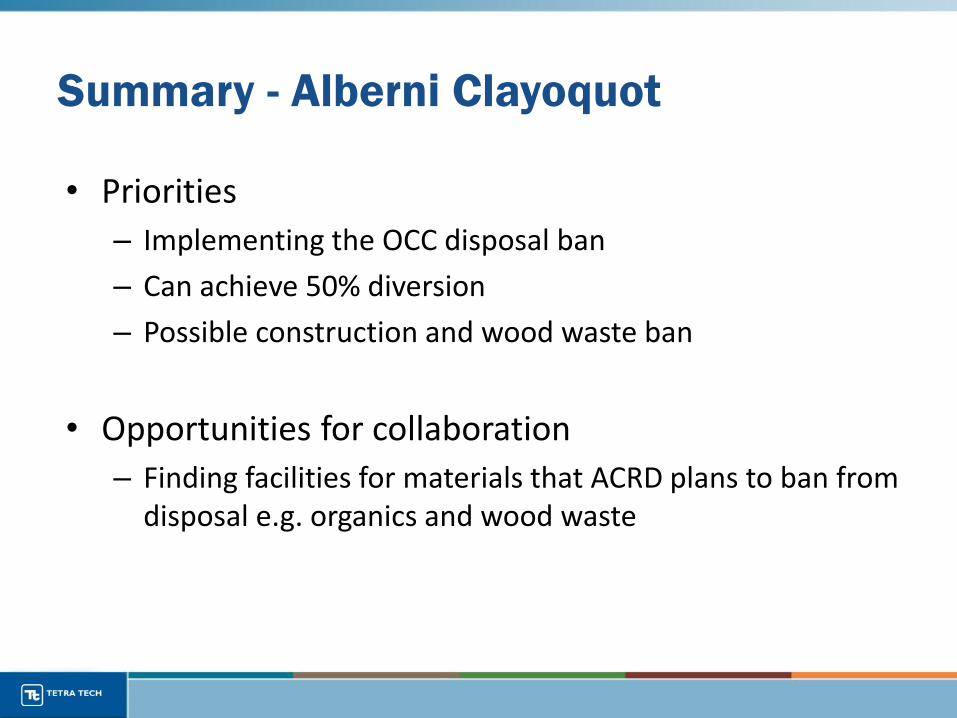
Summary - Alberni Clayoquot
• Priorities
– Implementing the OCC disposal ban
– Can achieve 50% diversion
– Possible construction and wood waste ban
• Opportunities for collaboration
– Finding facilities for materials that ACRD plans to ban from disposal e.g. organics and wood waste
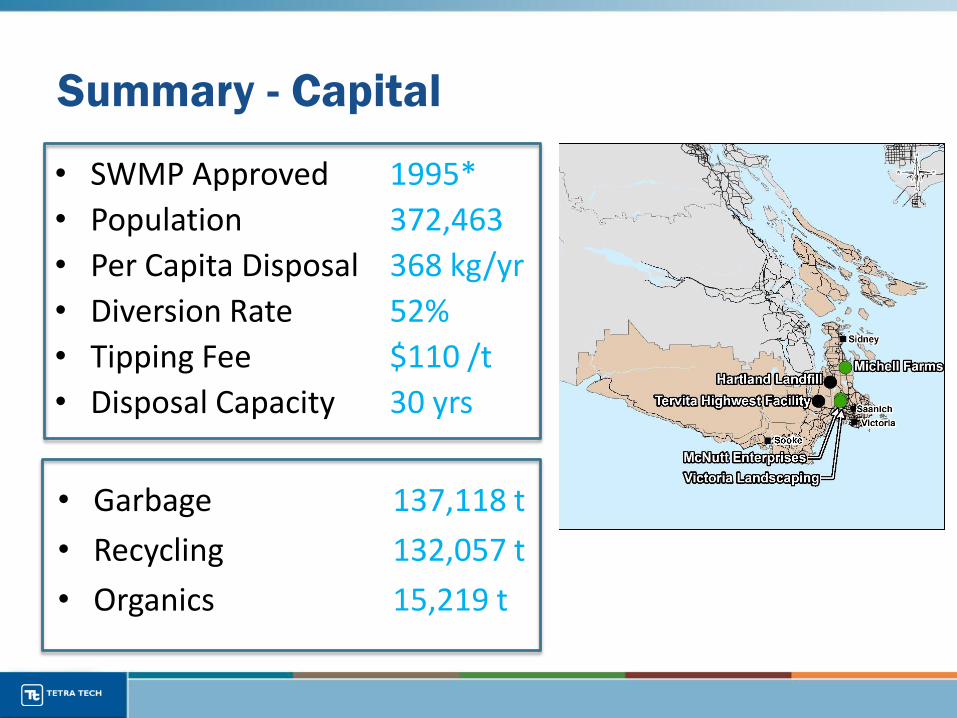
Summary - Capital
• SWMP Approved 1995*
• Population 372,463
• Per Capita Disposal 368 kg/yr
• Diversion Rate 52%
• Tipping Fee $110 /t
• Disposal Capacity 30 yrs
• Garbage 137,118 t
• Recycling 132,057 t
• Organics 15,219 t
Summary - Capital
• Priorities– Revision of SWM Plan. Currently in Phase 3
– Develop integrated food waste processing capacity in the region (currently exporting to Cowichan Valley and/or Harvest Power in Richmond)
– Develop a sustainable financial model for SWM
• Opportunities for collaboration– Financial sustainability models
– Shared landfill space - be part of the solution
– Consolidation of tonnages for shared facility (WTE)

Summary – Comox Strathcona WM
• SWMP Approved 2013
• Population 104,950
• Per Capita Disposal 610 kg/yr
• Diversion Rate 51%
• Tipping Fee $120 /t
• Disposal Capacity 4 yrs*
• Garbage 64,292 t
• Recycling 62,436 t
• Organics (yard) 4,690 t
Summary – Comox Strathcona WM
• Priorities– Construct a new landfill by 2017
– Build a regional composting facility in the next few years
– Closure of Campbell River Landfill
– Construct new Transfer Station to support the new landfill
– Finding the funds to do all the work
• Opportunities for collaboration– Benefits of economies of scale from working together
– Opportunity for a shared mega landfill (consolidated service and fee to include transportation)
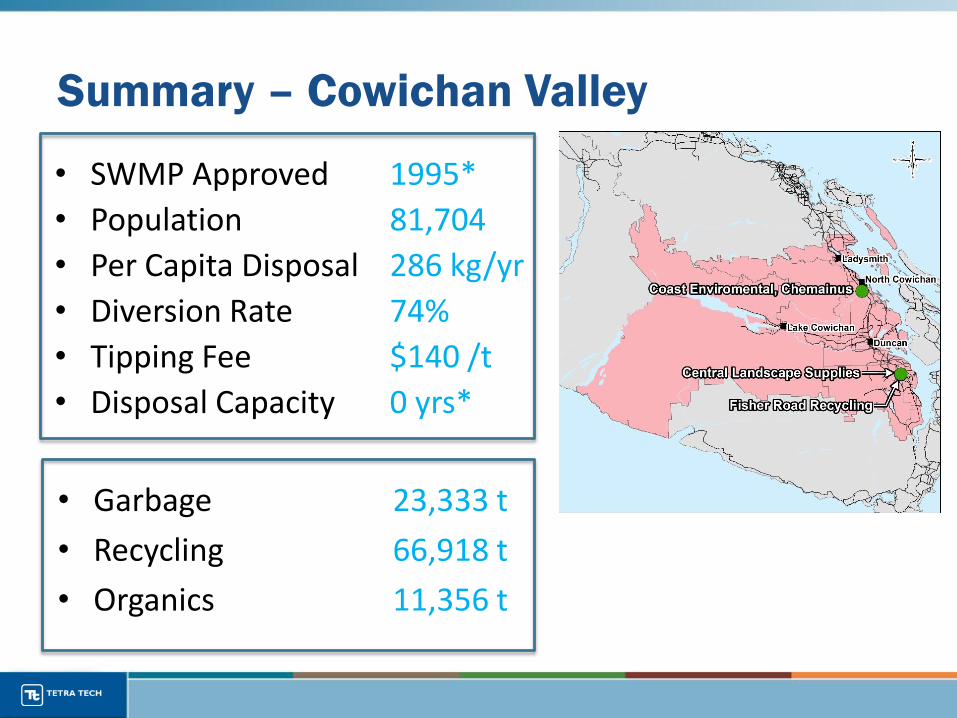
Summary – Cowichan Valley
• SWMP Approved 1995*
• Population 81,704
• Per Capita Disposal 286 kg/yr
• Diversion Rate 74%
• Tipping Fee $140 /t
• Disposal Capacity 0 yrs*
• Garbage 23,333 t
• Recycling 66,918 t
• Organics 11,356 t

Summary – Cowichan Valley
• Priorities
– Finding a local solution to garbage disposal
– Composting – facilities have odour issues that require a technological resolution
• Opportunities for collaboration
– Local solutions to garbage disposal e.g. collaboration for landfill or WTE facility
– High tech organics processing solutions
– Leakage – loss of solid waste to other jurisdictions
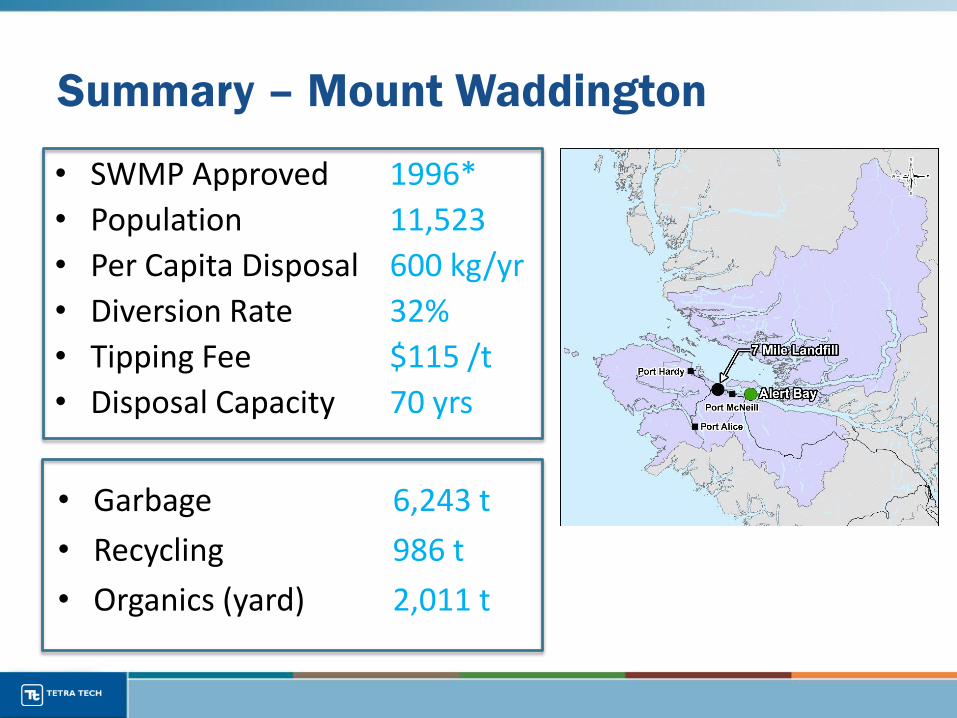
Summary – Mount Waddington
• SWMP Approved 1996*
• Population 11,523
• Per Capita Disposal 600 kg/yr
• Diversion Rate 32%
• Tipping Fee $115 /t
• Disposal Capacity 70 yrs
• Garbage 6,243 t
• Recycling 986 t
• Organics (yard) 2,011 t
Summary – Mount Waddington
• Priorities
– Need to provide services for small isolated communities –poor transport links, long distances
– Cost benefit analysis of introducing organics collection
• Opportunities for collaboration
– Primarily there to observe
– Have invested in the landfill and are happy with program
– Concern over impact of StewardsChoice – if undercuts MMBC, rural communities will suffer

Summary – Nanaimo
• SWMP Approved 2004*
• Population 150,040
• Per Capita Disposal 335 kg/yr
• Diversion Rate 68%
• Tipping Fee $125 /t
• Disposal Capacity 25 yrs
• Garbage 52,237 t
• Recycling 86,603 t
• Organics 26,250 t

Summary – Nanaimo
• Priorities– SWM Plan review – underway
– Managing waste export – could look at changing by-laws
– Sustainable financing for the system – because of export tipping fees are not providing sufficient revenue
– Looking at pre-sort facilities, maybe using a MRF
– Long term disposal options
• Opportunities for collaboration– Cooperative approach to marketing recyclables
– Potential for a joint WTE facility

Summary – Powell River
• SWMP Approved 1996*
• Population 19,906
• Per Capita Disposal 510 kg/yr
• Diversion Rate 41%
• Tipping Fee $215 /t
• Disposal Capacity 0 yrs
• Garbage 10,623 t
• Recycling 5,367 t
• Organics (yard) 1,950 t

Summary – Powell River
• Priorities
– Finalize SWM Plan
– Implement organics diversion program
– Expand EPR beyond existing programs – local opportunities
– Resource recovery centre – applied for grant
• Opportunities for collaboration
– Possibility of using another regions’ landfill for disposal
– Exploring all options for residuals (after max. diversion)

Summary – Sunshine Coast
• SWMP Approved 2011
• Population 29,584
• Per Capita Disposal 352 kg/yr
• Diversion Rate 50%
• Tipping Fee $150 /t
• Disposal Capacity 15-20 yrs
• Garbage 10,229 t
• Recycling 5,563 t
• Organics 3,318 t
Summary – Sunshine Coast
• Priorities
– 24 Initiatives in SWMP • Including curbside organics and EOW garbage collection
– Closure of Pender Harbour Landfill and conversion to a TS
– Reviewing priorities for post 2015
• Opportunities for collaboration
– Developing financially sustainable SWM models
– Information sharing
– Service delivery for rural residents
Solid Waste Management Trends
• Materials changing:
– Less paper (mainly ONP)
– Less glass
– More plastic
• EPR support (MMBC)
– Money good
– Restrictions on what is collected
• Collection approach changing:
– Glass being excluded
– Single stream vs source separated
Trends – Recycling
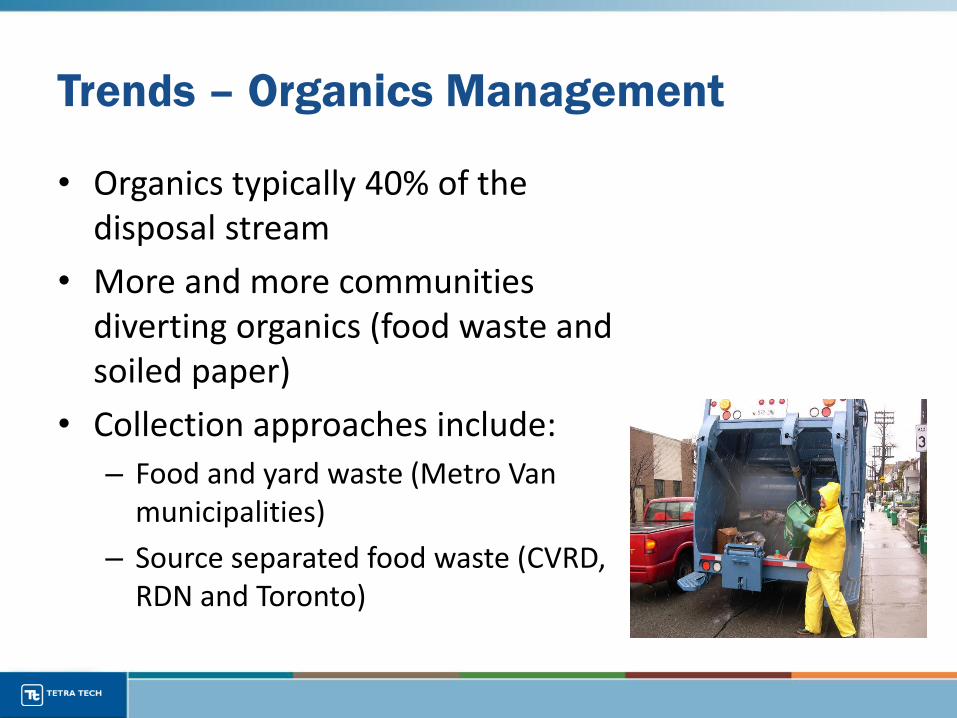
• Organics typically 40% of the disposal stream
• More and more communities diverting organics (food waste and soiled paper)
• Collection approaches include:
– Food and yard waste (Metro Van municipalities)
– Source separated food waste (CVRD, RDN and Toronto)
Trends – Organics Management

Composting Process
CO2
O2
CO2
O2
H2OH2O

Anaerobic Process
CO2
O2
CO2
O2
H2OCH4
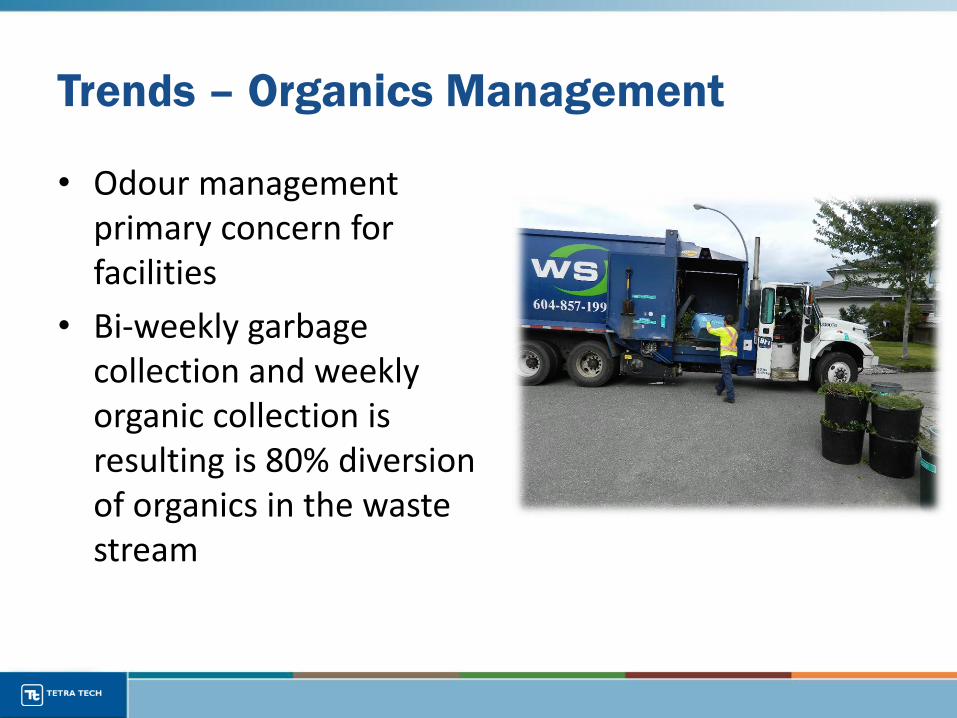
• Odour management primary concern for facilities
• Bi-weekly garbage collection and weekly organic collection is resulting is 80% diversion of organics in the waste stream
Trends – Organics Management

• Many technologies available
• Anaerobic digestion becoming more popular
– Composting still required to transform organic material into a quality soil amendment
Trends – Organics Management
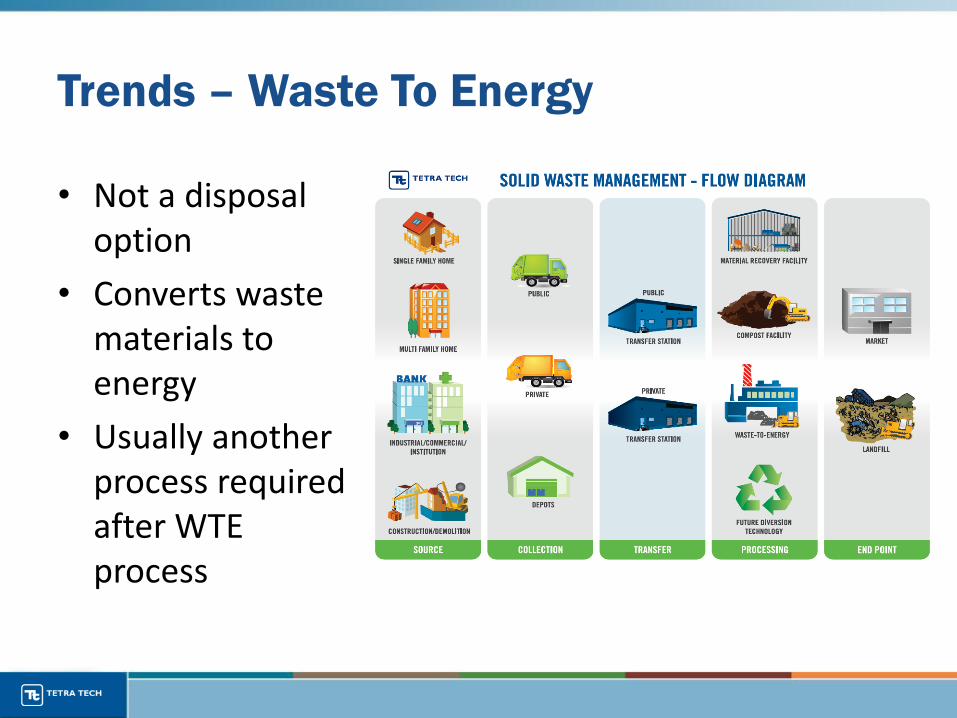
• Not a disposal option
• Converts waste materials to energy
• Usually another process required after WTE process
Trends – Waste To Energy

Trends – Waste To Energy (Thermal)
• Mass Burn – Metro Vancouver
• 280,000 tonnes/yr
• Generates high pressure steam that can be used for industrial processes or make electricity (25 MW)
• Mass reduction: 80%
• Volume reduction: >90%

Trends – Waste To Energy
• Issues:
– Air emissions
– Cost
– Residuals (Fly ash & Bottom ash)
• Cost from Tri-Regional District Study:
– Capital Cost = $235M
– Capacity = 200,000 t/yr
Cost of Thermal Processing Versus Capacity
y = -77.257Ln(x) + 1046.5$0
$50
$100
$150
$200
$250
$300
$350
$400
$450
$500
0 50000 100000 150000 200000 250000 300000 350000
Capacity (TPY)
Co
st
($/t
on
ne)
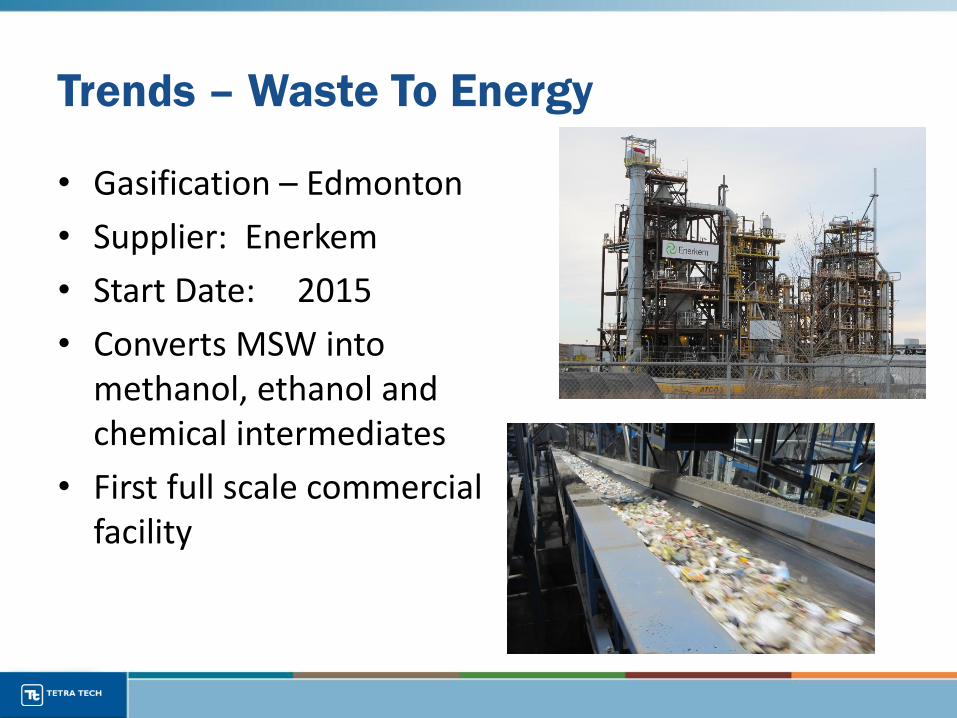
Trends – Waste To Energy
• Gasification – Edmonton
• Supplier: Enerkem
• Start Date: 2015
• Converts MSW into methanol, ethanol and chemical intermediates
• First full scale commercial facility
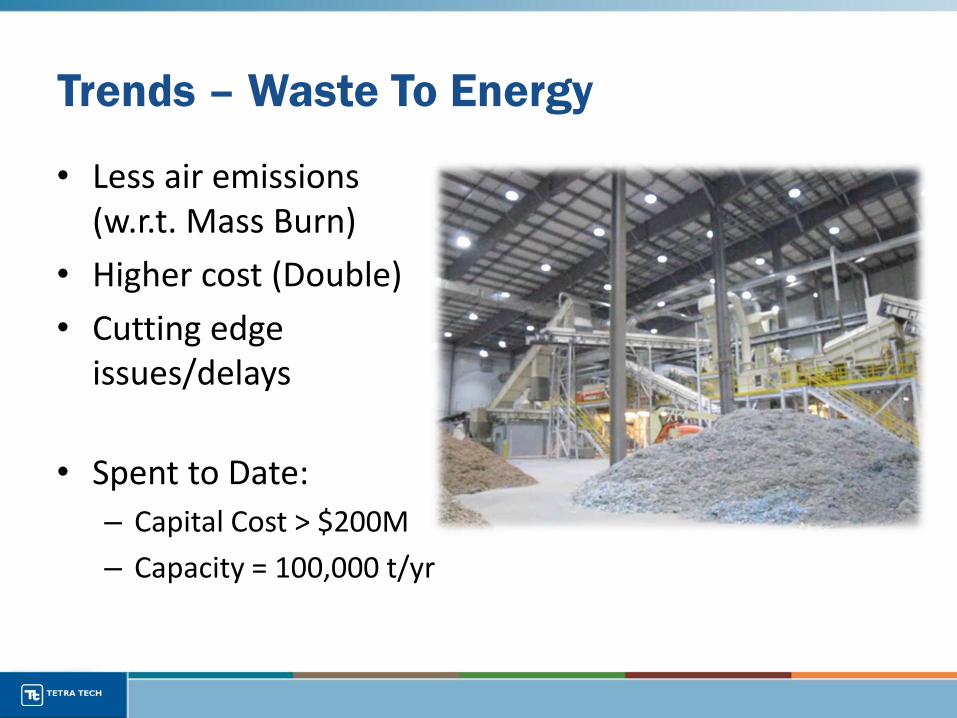
Trends – Waste To Energy
• Less air emissions (w.r.t. Mass Burn)
• Higher cost (Double)
• Cutting edge issues/delays
• Spent to Date:
– Capital Cost > $200M
– Capacity = 100,000 t/yr

• Controversial approach to recycling
• Parts of US cities use it as a primary form of recycling
– Quality of recyclables tend to be low
– Can achieve 50% diversion
Trends – Mixed Waste/Dirty MRFs
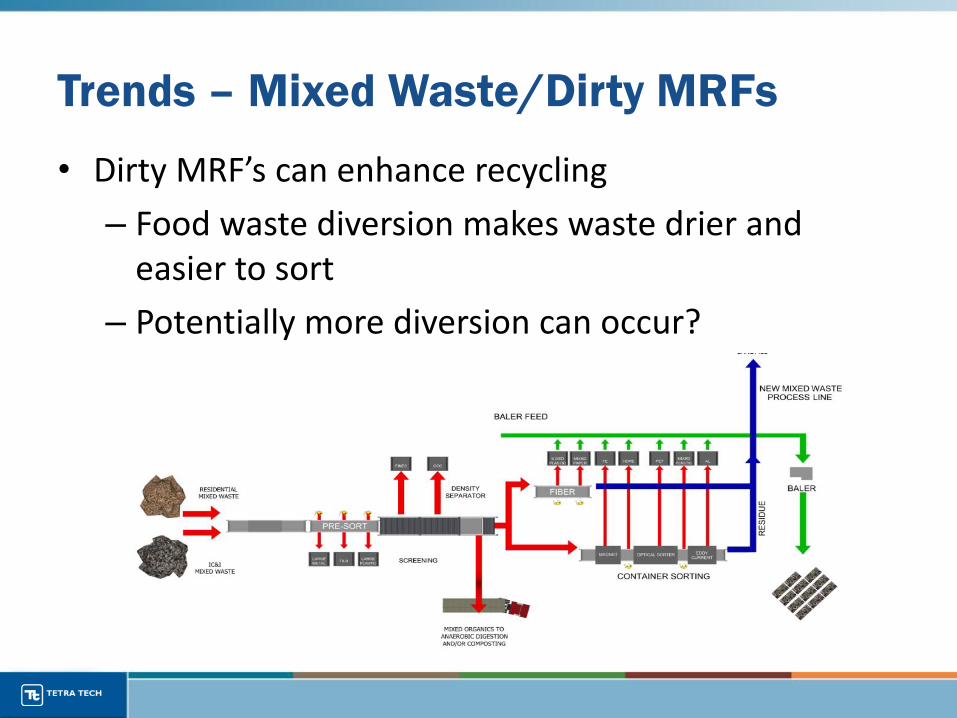
• Dirty MRF’s can enhance recycling
– Food waste diversion makes waste drier and easier to sort
– Potentially more diversion can occur?
Trends – Mixed Waste/Dirty MRFs
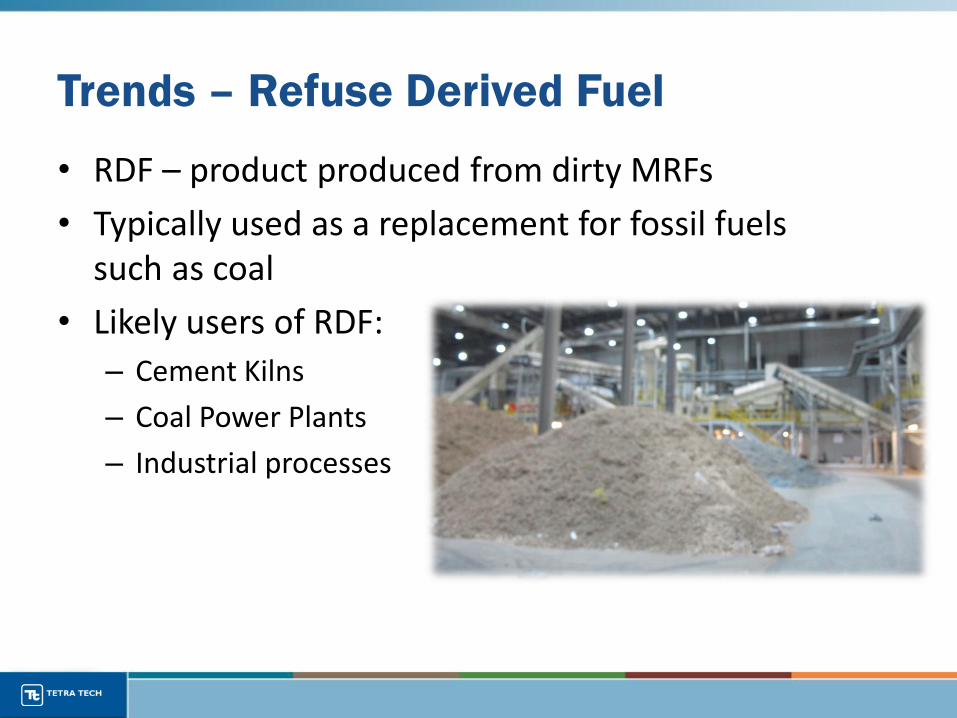
• RDF – product produced from dirty MRFs
• Typically used as a replacement for fossil fuels such as coal
• Likely users of RDF:
– Cement Kilns
– Coal Power Plants
– Industrial processes
Trends – Refuse Derived Fuel
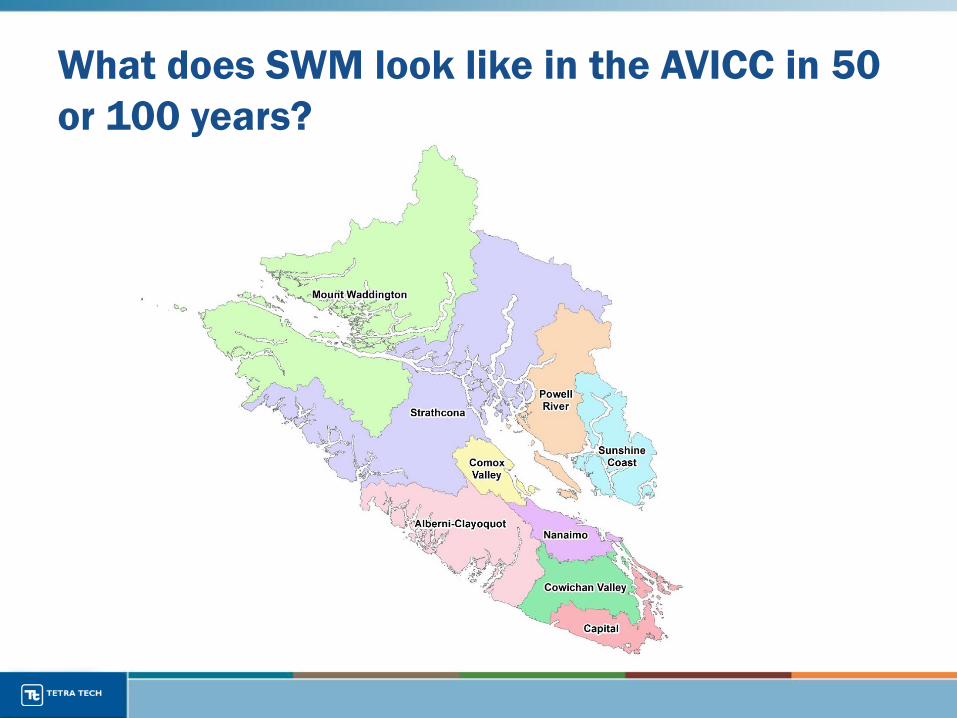
What does SWM look like in the AVICC in 50
or 100 years?
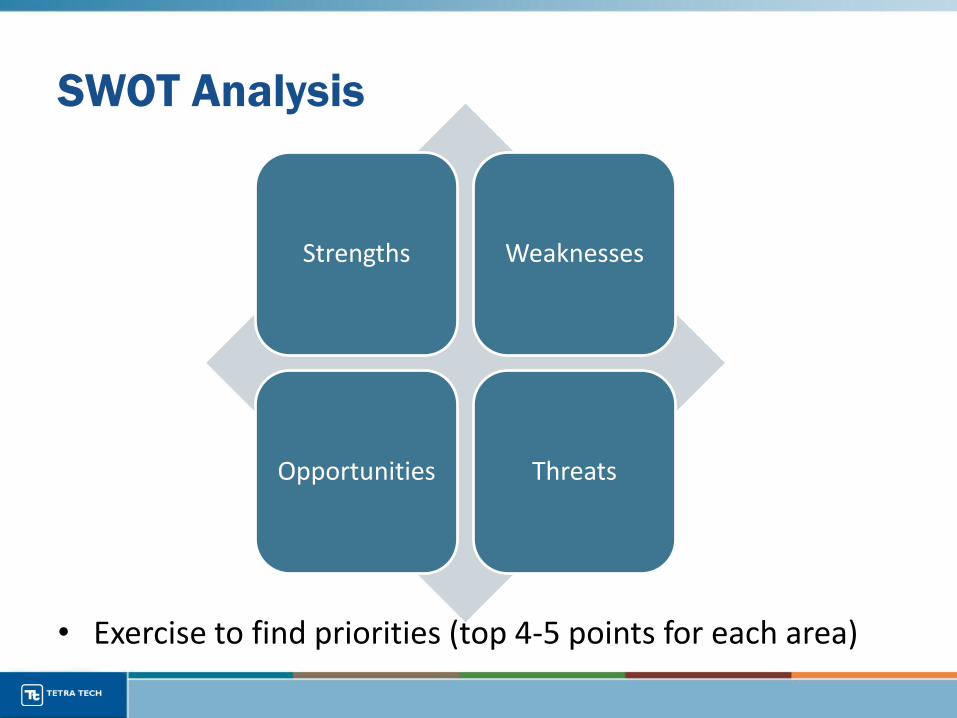
Strengths Weaknesses
Opportunities Threats
SWOT Analysis
• Exercise to find priorities (top 4-5 points for each area)
Strengths, Weaknesses, Opportunities &
Threats (SWOT)
• Help share and compare ideas
• Bring a clearer common purpose and understand of factors for success
• Organize important factors linked to success and failure
• Provide linearity to decision making process
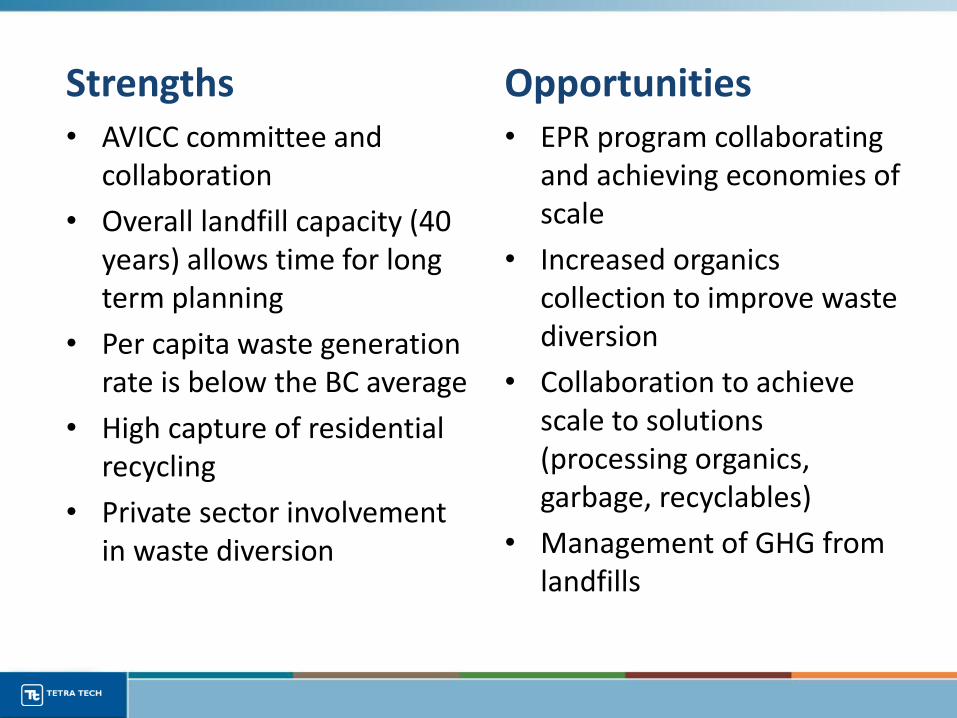
Strengths• AVICC committee and
collaboration
• Overall landfill capacity (40 years) allows time for long term planning
• Per capita waste generation rate is below the BC average
• High capture of residential recycling
• Private sector involvement in waste diversion
Opportunities• EPR program collaborating
and achieving economies of scale
• Increased organics collection to improve waste diversion
• Collaboration to achieve scale to solutions (processing organics, garbage, recyclables)
• Management of GHG from landfills
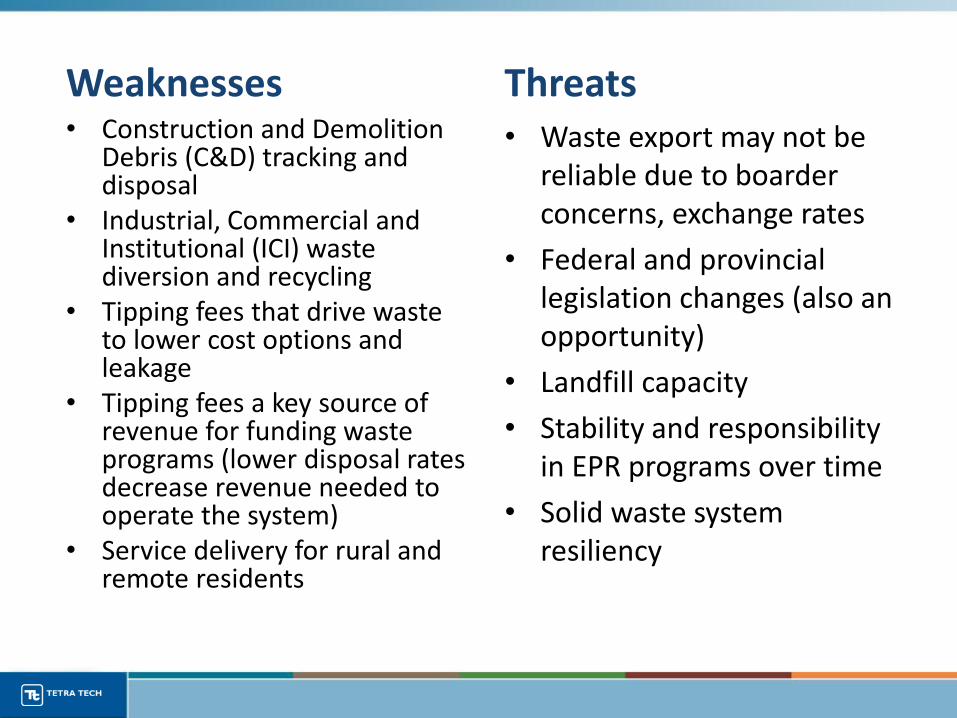
Weaknesses• Construction and Demolition
Debris (C&D) tracking and disposal
• Industrial, Commercial and Institutional (ICI) waste diversion and recycling
• Tipping fees that drive waste to lower cost options and leakage
• Tipping fees a key source of revenue for funding waste programs (lower disposal rates decrease revenue needed to operate the system)
• Service delivery for rural and remote residents
Threats• Waste export may not be
reliable due to boarder concerns, exchange rates
• Federal and provincial legislation changes (also an opportunity)
• Landfill capacity
• Stability and responsibility in EPR programs over time
• Solid waste system resiliency
Issues for Further Discussion in Break-Out
Groups
• Items for discussion:
– Issues
– Challenges
– Collaboration Opportunities

Break-Out Topics
• Five Groups
• Vote on following items for discussion:
– Issues
– Challenges
– Collaboration Opportunities
• One or several topics to discuss
• Select a secretary and presenter in each group
Break-Out Guiding Questions
• What Will it Take to Achieve <x> Priority?
• What can we learn from each other?
• What could we do cooperatively?
• Who should lead / be involved?
Sample Identified Needs:
– Policies and Procedures
– Information and Communication
– Performance Standards and Guidelines
– Infrastructure
Next Steps
• Summary report of various programs
• Workshop results to be included


