AD______________ Award Number: W81XWH- TITLE: PRINCIPAL INVESTIGATOR: CONTRACTING ORGANIZATION: University of REPORT DATE: TYPE OF REPORT: Annual PREPARED FOR: U.S. Army Medical Research and Materiel Command Fort Detrick, Maryland 21702-5012 DISTRIBUTION STATEMENT: Approved for public release; distribution unlimited The views, opinions and/or findings contained in this report are those of the author(s) and should not be construed as an official Department of the Army position, policy or decision unless so designated by other documentation.
Transcript
AD______________ Award Number: W81XWH-10-1-0736 TITLE: Objective Methods to Test Visual Dysfunction in the Presence of Cognitive Impairment PRINCIPAL INVESTIGATOR: Dr. Randy Kardon CONTRACTING ORGANIZATION: University of Iowa Iowa City, IA 52242 REPORT DATE: October 2011 TYPE OF REPORT: Annual PREPARED FOR: U.S. Army Medical Research and Materiel Command Fort Detrick, Maryland 21702-5012 DISTRIBUTION STATEMENT: Approved for public release; distribution unlimited The views, opinions and/or findings contained in this report are those of the author(s) and should not be construed as an official Department of the Army position, policy or decision unless so designated by other documentation.
REPORT DOCUMENTATION PAGE Form Approved
OMB No. 0704-0188 Public reporting burden for this collection of information is estimated to average 1 hour per response, including the time for reviewing instructions, searching existing data sources, gathering and maintaining the data needed, and completing and reviewing this collection of information. Send comments regarding this burden estimate or any other aspect of this collection of information, including suggestions for reducing this burden to Department of Defense, Washington Headquarters Services, Directorate for Information Operations and Reports (0704-0188), 1215 Jefferson Davis Highway, Suite 1204, Arlington, VA 22202-4302. Respondents should be aware that notwithstanding any other provision of law, no person shall be subject to any penalty for failing to comply with a collection of information if it does not display a currently valid OMB control number. PLEASE DO NOT RETURN YOUR FORM TO THE ABOVE ADDRESS. 1. REPORT DATE (DD-MM-YYYY) 2. REPORT TYPE 3. DATES COVERED (From - To)
4. TITLE AND SUBTITLE 5a. CONTRACT NUMBER
5b. GRANT NUMBER
5c. PROGRAM ELEMENT NUMBER
6. AUTHOR(S) 5d. PROJECT NUMBER
5e. TASK NUMBER
E-Mail: 5f. WORK UNIT NUMBER 7. PERFORMING ORGANIZATION NAME(S) AND ADDRESS(ES) 8. PERFORMING ORGANIZATION REPORT NUMBER
9. SPONSORING / MONITORING AGENCY NAME(S) AND ADDRESS(ES) 10. SPONSOR/MONITOR’S ACRONYM(S) U.S. Army Medical Research and Materiel Command
Fort Detrick, Maryland 21702-5012 11. SPONSOR/MONITOR’S REPORT NUMBER(S) 12. DISTRIBUTION / AVAILABILITY STATEMENT Approved for Public Release; Distribution Unlimited
13. SUPPLEMENTARY NOTES 14. ABSTRACT
15. SUBJECT TERMS
16. SECURITY CLASSIFICATION OF:
17. LIMITATION OF ABSTRACT
18. NUMBER OF PAGES
19a. NAME OF RESPONSIBLE PERSON USAMRMC
a. REPORT U
b. ABSTRACT U
c. THIS PAGE U
UU
19b. TELEPHONE NUMBER (include area code)
Standard Form 298 (Rev. 8-98) Prescribed by ANSI Std. Z39.18
Objective Methods to Test Visual Dysfunction in the Presence of Cognitive Impairment
Dr. Randy Kardon
W81XWH-10-1-0736
15 Sep 2010 - 14 Sep 2011Annual01-10-2011
University of Iowa Iowa City, IA 52242
Purpose: to develop and validate objective tests to diagnose vision deficits in patients with cognitive impairment and ensure effective monitoring of their treatment. Scope: objective methods to monitor visual function include 1) the pupil light reflex, 2) light evoked potentials from the brain and from the eye and 3) purposeful eye movements to track moving targets that are resolved. Major Findings (year one): 1) a hand held pupillometer was evaluated resulting in a new chromatic stimulus and pupil test being delivered by Neuroptics which will differentiate photoreceptor from optic nerve disease, 2) a prototype, dry electrode system was evaluated and requirements fully specified with delivery expected in Year 2, 3) A Smart Eye head and ocular tracking system was implemented and evaluated, 4) a software architecture for stimulus presentation, data synchronization, and analysis was developed and completed, 5) integration of an entire ocular testing echo-system was completed that integrates visual stimulation, evoked potential recording, head/eye tracking, and pupil responses. Significance: objective tests of vision will greatly improve eye care by providing faster, lower cost testing that can be performed in remote settings and will provide a new tool for assessing innovative treatments being developed to save or restore vision.
Key Research Accomplishments………………………………………….…….. 18
Reportable Outcomes……………………………………………………………… 18
Conclusion…………………………………………………………………………… 18
References……………………………………………………………………………. 19
Appendices…………………………………………………………………………… 19
4
INTRODUCTION: Our project’s research goal is to provide an objective and military relevant means for diagnosing and localizing the site of visual dysfunction in cognitively impaired patients. The successful attainment of this goal hinges on the development of a suite of objective tests designed to free the TBI patients from the cognitive demands placed on them during standard visual testing. As a necessary step for testing of cognitively impaired patients with suspected visual dysfunction, we will first optimize three objective tests of visual function: a) pupil contractions to light stimuli, b) evoked potentials elicited from the visual cortex in response to visual stimuli in the central and peripheral visual field locations, and c) eye position correlated with moving visual targets varying in spatial properties as a means of verifying that the patient was able to perceive the targets. Next, we will validate these objective tests against gold standard behavioral tests of visual field sensitivity in cognitively intact participants who are capable of performing these tests accurately. For the validation phase, participants will be selected who have either normal visual function or who have known dysfunction at different sites along their visual pathway. Using this strategy, normal eyes and eyes with well-‐defined damage to the retina, optic nerve, visual radiations or visual cortex will be used to study the sensitivity and specificity of the different modalities of objective testing being evaluated in this proposal. Once validated in these participants, these objective tests can then be rapidly implemented for use in cognitively impaired patients, specifically those who have suffered traumatic brain injury.
5
BODY -‐ RESEARCH ACCOMPLISHMENTS ASSOCIATED WITH APPROVED STATEMENT OF WORK FOR YEAR 1: Task 1. Implementation of novel product-‐ready hardware solutions that allow objective testing of the visual system (months 1-‐12): 1a. Hand-‐held portable pupillometer (Neuroptics, Inc.) (months 1-‐4).
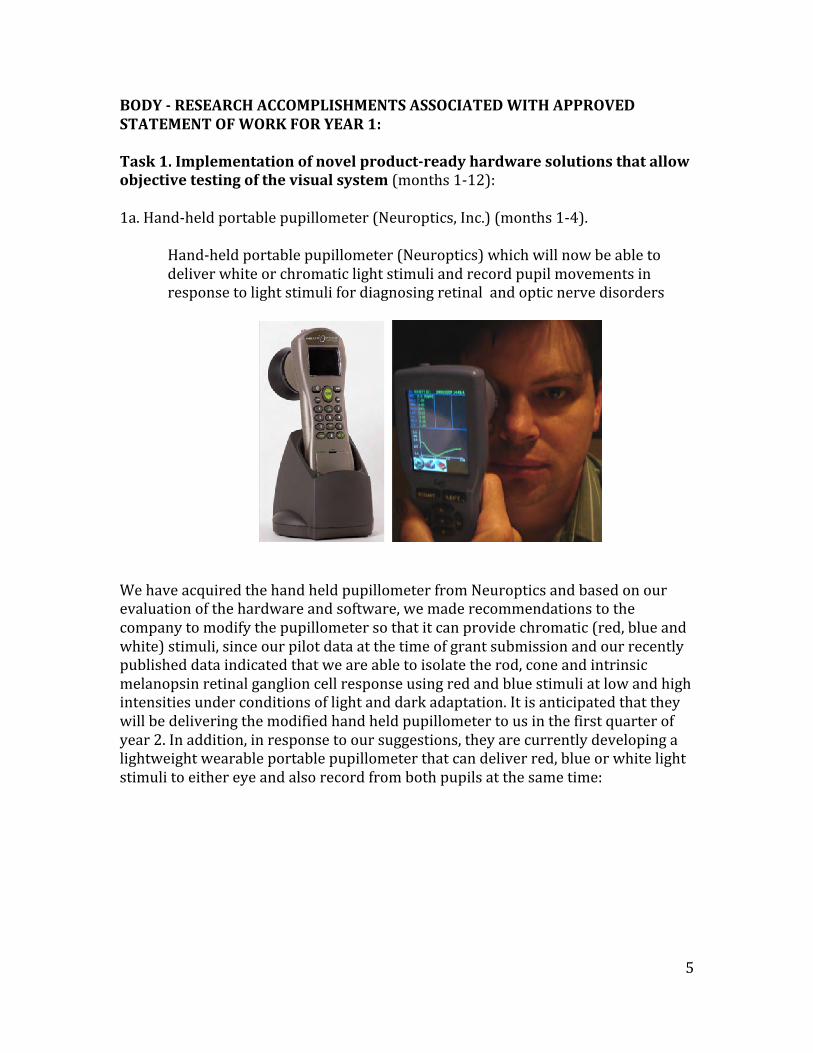
Hand-‐held portable pupillometer (Neuroptics) which will now be able to deliver white or chromatic light stimuli and record pupil movements in response to light stimuli for diagnosing retinal and optic nerve disorders
We have acquired the hand held pupillometer from Neuroptics and based on our evaluation of the hardware and software, we made recommendations to the company to modify the pupillometer so that it can provide chromatic (red, blue and white) stimuli, since our pilot data at the time of grant submission and our recently published data indicated that we are able to isolate the rod, cone and intrinsic melanopsin retinal ganglion cell response using red and blue stimuli at low and high intensities under conditions of light and dark adaptation. It is anticipated that they will be delivering the modified hand held pupillometer to us in the first quarter of year 2. In addition, in response to our suggestions, they are currently developing a lightweight wearable portable pupillometer that can deliver red, blue or white light stimuli to either eye and also record from both pupils at the same time:
6
1b. TrueField Analyzer visual field testing device (Seeing Machines Limited) (months 5-‐8). The TrueField Analyzer being developed by Dr. Ted Maddess at Canberra University in Australia for Seeming Machines Limited has not been released for patient testing at this time. They are unable to provide us with a date when the instrument will be available for use and purchase. Because of this, the PI has recently traveled to Dr. Maddess laboratory in September 2011 to further evaluate the multifocal pupil perimetry device and to further understand the nature of the problems that they are experiencing with the instrument. The main problem is that the LCD light source that they are using to provide the focal light stimuli has proven to be unstable over time and at this time they are developing an automated light calibration routine that will adjust the brightness of the stimulus as it changes over time to ensure that the light intensity delivered is what is specified. In addition, they are still working out which wavelength of light, stimulus size, and timing of stimulus provide the optimal ability to differentiate diseased from normal eyes. Because of the uncertainty surrounding the deliverability of the TrueField Analyzer, we have developed a flexible visual stimulation software platform (see “Development of Optical Stimuli” under 1d) below) that will allow us to measure pupil responses to focal stimuli in different locations of the visual field, so that we can still proceed with collecting pupil responses to diffuse and focal stimuli in normal subjects and patients with our own instrumentation. We will still incorporate the TrueField Analyzer into our testing, providing it will be made available to us during the grant period. Developing
7
our own rudimentary focal pupil perimetry testing, in parallel, will allow us to still pursue this type of testing. 1c. “Dry electrode” wireless EEG system (Sigmed, Inc.) (months 7-‐12) Based on a feedback from Sigmed, we expect to receive our dry-‐electrode wireless system by the end of the year. Sigmed has redesigned their current 16-‐channel EEG system to accommodate our requirements to measure from 8 channels placed around the eyes to measure EOG, orbicularis-‐corrugator EMG, ERG, and another 8 channels placed over occipital-‐parietal-‐temporal scalp locations to measure evoked potentials from visual cortex. This translated into different settings for the front-‐end gain setting, given that the dynamic range for EOG and EMG (+/-‐ 2mV) is larger than the dynamic range that the existing prototype 16-‐channel EEG system can handle. The requirements that are being met to make the system work with our existing equipment and experiments are: 1) Sixteen channels divided into 2 groups:
a) 8 channels for measuring EMG/EOG/ERG on the face, placed around both eyes
(i) Dynamic range of input signal: +/-‐ 2mV (i.e., 4mV), (ii) High pass filter: between 0.01-‐0.1 Hz,
b) 8 channels for measuring VEPs across occipital/parietal scalp locations (i) Dynamic range of input signal: standard EEG settings (ii) High pass filter: standard EEG settings
2) Method to synchronize the onboard system clock with an external time server via wireless link (e.g., basic NTP client functionality).
3) Time-‐stamping of each recorded EEG/ EMG time-‐slice. 4) Specification of software interface:
(a) API to send commands/receive responses from system, (b) Streaming data API, (c) Data packet layout.
5) Two different types of dry electrodes (not requiring skin preparation or electrode gel), configured to be clipped on or off the electrode wiring ends:
6) Low impedance (5-‐10 kilo-‐ohms) One potential problem that was conveyed to us as feedback from the Product Line Review (PLR) was that it was anticipated that there would be electromagnetic noise introduced into the system from the surrounding environment associates with a high impedance skin electrode system. We did not adequately convey at the time
8
that the “dry” electrode system that penetrates only the surface epidermis of skin has characteristically very low impedance (5-‐10 kilo-‐ohms) compared to higher impedance wet electrodes (80-‐100 kilo-‐ohms). We are going to take advantage of the new low impedance electrodes that should be delivered in the next year so that our noise level will be very low. 1d. Multi-‐camera eye movement monitor (Smart Eye AB) and visual stimulus software platform (months 1-‐6) As part of Task 1, we have a) evaluated, b) fine tuned, and c) expanded the measuring accuracy and integration capabilities of the 4-‐vantage point cameras of the Smart Eye remote head/eye tracker. In order to maximize the unobtrusiveness of the system, as well as patient comfort, the cameras and infrared illuminators are located six feet away from the patient, which poses a major challenge for any existing eye tracking system to obtain sufficient resolution and accuracy of eye tracking. From initial results, the infrared illumination was found to be insufficient at six feet, leading to faint retinal reflections, and hampering tracking performance. To increase the illumination levels, we purchased brighter infrared illuminators from Smart Eye, modified the system, and subsequently verified the improved illumination levels and sufficient tracking, which will be used in the planned human testing in years 2 and 3. In order to expand interoperability with our current stimulus presentation and other physiological measurement systems, we modified and upgraded the Smart Eye system to accept transistor-‐transistor-‐logic TTL signals. The ability to log TTL signals together with the eye tracking data, enable us to synchronize data across multiple modalities, such as evoked potentials simultaneous with the eye tracking.
9
Figure 1. Demonstration of Smart Eye head and eye movement tracking system fitted to a large screen TV. 1) Development of optical-‐visual stimuli With the help of our software provider, we have developed Opto Viewer – a system designed to present a wide variety of visual stimuli. The program allows stimuli to be easily arranged into multiple experiment sequences. It is also possible to trigger the onset of stimuli from 3rd party software packages, like Matlab, which allows us to delay the onset of stimuli based on any custom criteria. For example, the onset of a wide-‐field chromatic stimulus – used to monitor a subject’s pupil light reflex – can be delayed until the subject’s pupils have dilated to a specified level. Or, in terms of eye movement tests, a vanishing optotype target can be delayed from starting to move across the monitor until the subject has fixated it for a specified minimum time interval to ensure that the subject is in fact aware of the presence of the target. The experimenter can also control what type of image stabilization should be applied to the stimulus canvas based on the subject’s head and/or eye location and orientation. Having access to a wide variety of customizable stimuli is an important aspect of our study design because they will be used to elicit responses that are objective measures of visual function. These responses include 1) eye movements that will correlate (follow) the location of the visual stimulus, if seen and will be random when the stimulus can no longer be resolved 2) pupil responses to the visual stimuli in the center and periphery of the visual field, 3) evoked responses from the eye and brain in response to the visual stimuli.
10
The implementation of the software architecture allows us to control the graphics hardware on a low-‐level software to hardware control, to maximize timing precision of the stimuli, while at the same time it offers cross-‐platform compatibility to run on desktop, laptop, and handheld devices (e.g. iPad interface planned in future). Visual stimuli include static or moving visual stimuli, which can be filled with solid colors, static or moving gratings of various configurations (verniers, checkerboard, stripes etc.), images, and vanishing optotypes. The colors and transparency of these stimuli can be independently varied over time. Based on algorithm to adjust pixel colors in real time, we have generalized the vanishing optotype design to enable us to display these optotypes on any background. The stimulus presentation system includes all the stimulus types required for the purposes of this project in order to study the pupil light reflex with colored light, acuity and eye movements with vanishing optotypes and vernier patterns, opto-‐kinetic reflexes with moving gratings, and visually-‐evoked potentials (VEPs) with flickering color patches. We have included various methods to synchronize the physiological data with stimulus onset times. These methods include sending TTL-‐type signals via the parallel and/or serial ports on the stimulus PC to the data recorder (Biopac or Smart Eye hardware). We have also developed and tested an analog light meter that is facing the stimulus monitor. This light meter allows us to monitor the actual sequencing of the presented stimuli very accurately, and helps us record and monitor screen refreshes on modern LCD monitors. Knowing the precise stimulus history during the testing allows us to more accurately assess the frequency dependent Fourier analysis of evoked responses.
a) Vanishing optotypes With the expert help of Dr. Lars Friesen, we have developed examples of computerized vanishing optotype stimuli. Vanishing optotypes are uniquely suited for someone with limited cognition because they are either visible against a diffuse background or they will blend into the background and “vanish” if the person cannot resolve their border. Changing the thickness of the lines used to define their shape varies the acuity of each target, without having to change the target size.
Figure 2: example of vanishing optotype rings that change in spatial frequency (left to right) and contrast (top to bottom)
11
We have evaluated the trade-‐off amongst line thickness, line orientation, and screen resolution. Line thickness is constrained by the monitor resolution (thinnest component of a horizontal or vertical line segment, and cannot be less than a single pixel wide). In the case of slanted line segments, it is necessary to apply anti-‐aliasing filtering to suppress display artifacts, which reduces the high-‐frequency content of the vanishing optotype target, and complicates the interpretation of the displayed grayscale values versus the intended light levels. After reaching a certain lower limit in line thickness, we have found that it might be better to alter the grayscale values to obtain even lower contrast ratios which will allow us to reach the visual threshold for spatial frequency using wider (thicker) borders for the optotypes. For testing of normal subjects and patients in years 2 and 3, we will use vanishing optotype targets in conjunction with the Smart Eye computerized eye movement video monitoring system to detect whether a subject’s eyes track these targets as they become visible while moving on a screen.
Figure 3. Examples of one type of moving vanishing optotype programmed to fade into the background due to increase in spatial frequency. Such an optotype will be dynamically moved across the screen while its spatial resolution is reduced and a subject’s eye movements are monitored simultaneously to detect whether the subject tracks its movement.
12
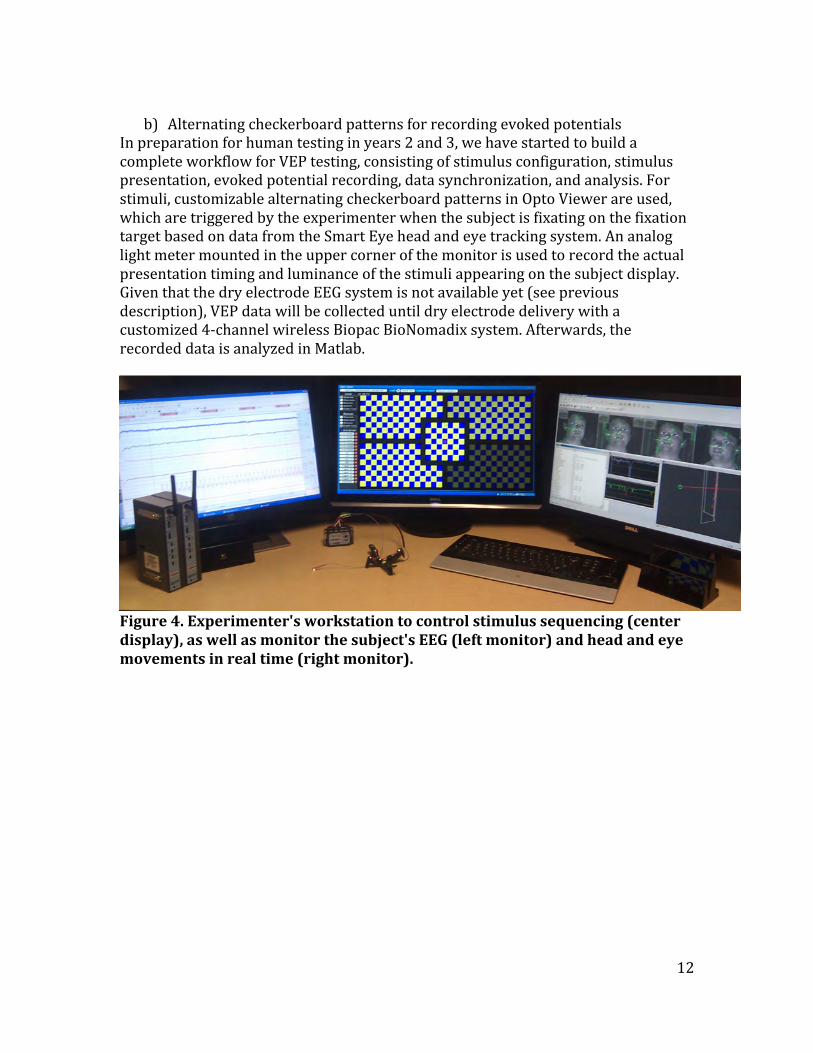
b) Alternating checkerboard patterns for recording evoked potentials
In preparation for human testing in years 2 and 3, we have started to build a complete workflow for VEP testing, consisting of stimulus configuration, stimulus presentation, evoked potential recording, data synchronization, and analysis. For stimuli, customizable alternating checkerboard patterns in Opto Viewer are used, which are triggered by the experimenter when the subject is fixating on the fixation target based on data from the Smart Eye head and eye tracking system. An analog light meter mounted in the upper corner of the monitor is used to record the actual presentation timing and luminance of the stimuli appearing on the subject display. Given that the dry electrode EEG system is not available yet (see previous description), VEP data will be collected until dry electrode delivery with a customized 4-‐channel wireless Biopac BioNomadix system. Afterwards, the recorded data is analyzed in Matlab.
Figure 4. Experimenter's workstation to control stimulus sequencing (center display), as well as monitor the subject's EEG (left monitor) and head and eye movements in real time (right monitor).
13
Figure 5. Example of one type of VEP stimulus. Sinusoidally alternating checkerboard patterns and a fixation target presented on the subject monitor. Mounted on the monitor stand are 4 video cameras and infrared illuminators (Smart Eye System) for tracking the eyes and head in real time during the visual testing. An analog light meter is mounted to the upper right hand corner of the monitor and is directed at the monitor to transmit the light level in real time to the computer. In the stimulus shown, each box containing a checkerboard pattern in the center and peripheral visual field locations can be made to alternate at distinct frequencies independently for extracting visual field information from the VEP signals recorded.
Figure 6. Custom wireless Biopac BioNomadix 4-‐channel VEP system with a shared reference electrode (unipolar setup). The four electrodes are supported on a flexible cross that is applied to the scalp and the small box to the left is the wireless transmitter to relay the VEP signals continuously to the Biopac receiver/digitizer.
14
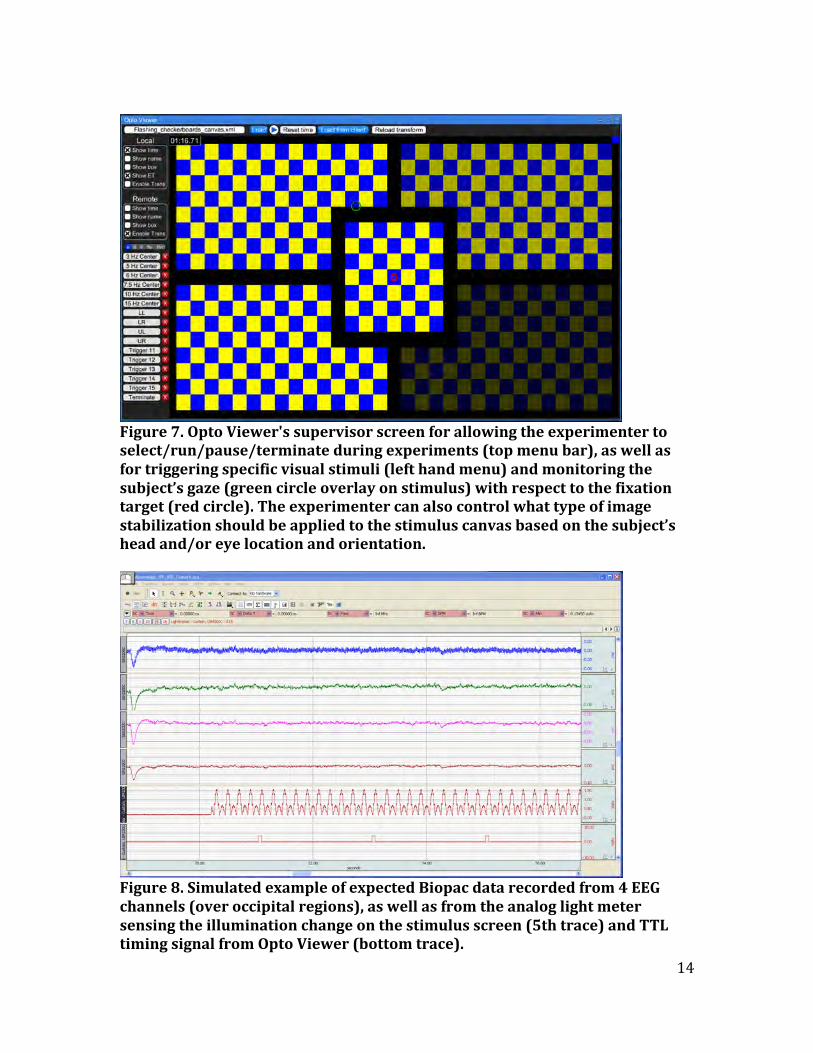
Figure 7. Opto Viewer's supervisor screen for allowing the experimenter to select/run/pause/terminate during experiments (top menu bar), as well as for triggering specific visual stimuli (left hand menu) and monitoring the subject’s gaze (green circle overlay on stimulus) with respect to the fixation target (red circle). The experimenter can also control what type of image stabilization should be applied to the stimulus canvas based on the subject’s head and/or eye location and orientation.
Figure 8. Simulated example of expected Biopac data recorded from 4 EEG channels (over occipital regions), as well as from the analog light meter sensing the illumination change on the stimulus screen (5th trace) and TTL timing signal from Opto Viewer (bottom trace).
15
Figure 9. Expected spectrogram of VEP (red tracing) and light meter (blue peaks) signals for sinusoidally changing checkerboard stimulus of blue and yellow squares at 10 Hz (base frequency). Note that it is expected that the frequency analysis picks up a 10 Hz VEP response (yellow to yellow and blue to blue) and a 20 Hz VEP response from a state change (on-‐off signal due to yellow to black or blue to black) reflecting the potential to detect visual evoked responses using Fourier transform power analysis of temporal frequencies in the EEG recording. We will also be extracting phase (latency) information using this type of analysis. 2) Integration of visual stimuli, eye movement, pupil, and evoked potential
measurement systems with analysis
Over the past year, we have developed an integrated multi-‐modal experimental control and analysis platform. Currently, we can control, import, synchronize, and integrate data collected from our Biopac system (for EKG, EOG, EMG, GSR, etc.), Arrington head-‐mounted eye and pupil tracker, Smart Eye system, Diagnosys stimulus presentation system, as well as the Opto Viewer stimulus presentation system especially developed for this project. We have developed numerous Matlab signal processing scripts which link directly to the analysis software to retrieve and pass back data in real time, as well as to visualize results. Our analysis architecture allows us to monitor different diagnostic metrics simultaneously in case more than one stimulus type are presented at the same time, e.g., we can compute pupil responses to color patches flickering at different frequencies, relating the measurements to the patch being fixated from eye tracking data, while also calculating VEP amplitudes from the EEG data.
16
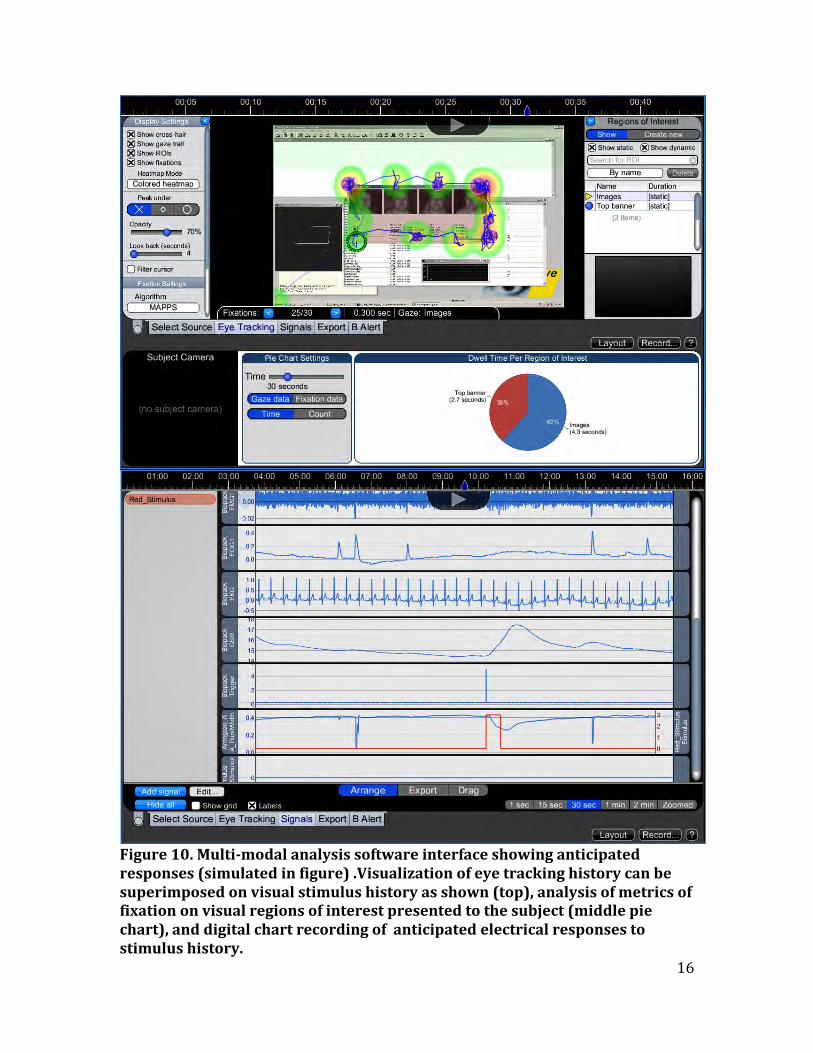
Figure 10. Multi-‐modal analysis software interface showing anticipated responses (simulated in figure) .Visualization of eye tracking history can be superimposed on visual stimulus history as shown (top), analysis of metrics of fixation on visual regions of interest presented to the subject (middle pie chart), and digital chart recording of anticipated electrical responses to stimulus history.
Gaze data F1Xat1on data
T1me Count
17
1e. Literature study (months 1-‐12) The following is a screen capture of saved searches that we have performed to obtain relevant literature for the project using PubMed:
The literature search is an ongoing process, as we continually are updating our information with recently published articles that are relevant to our proposed research.
18
KEY RESEARCH ACCOMPLISHMENTS (SUMMARY)
• Evaluation of hand held pupillometer and facilitation of new chromatic pupil testing platform to be delivered by Neuroptics in Year 2
• Prototype of dry electrode system evaluated and delivery expected in first part of Year 2
• Implementation and evaluation of Smart Eye head and ocular tracking system
• Software architecture development completed for stimulus presentation, data synchronization, and analysis
• Integration of an entire ocular testing echo-‐system completed that integrates visual stimulation, evoked potential recording (VEP, PERG, EMG and skin conductance), head tracking, eye tracking, and pupil responses with a unified data analysis system
• Key literature reviewed and continues as an ongoing updated process REPORTABLE OUTCOMES Presentation of research project to Congressional Briefing in Washington D.C. Feb 2011 Presentation and discussion of TBI related research planned to Smith Kettlewell symposium on TBI March 2011 Received DOD TATRC 3 year grant on investigation of photosensitivity in TBI Since the first year of this research was restricted to implementation of a hardware and software testing and analysis platform, we have not yet tested human subjects (years 2 and 3). Therefore, we do not yet have results of testing to report in the literature. However, the following two manuscripts were published on relevant work to this project: Kardon R, Anderson SC, Damarjian TG, Grace EM, Stone E, Kawasaki A. Chromatic pupillometry in patients with retinitis pigmentosa. Ophthalmology 2011;118(2): 376-‐81. Park JC, Moura AL, Raza AS, Rhee DW, Kardon RH, Hood DC. Toward a clinical protocol for assessing rod, cone, and melanopsin contributions to the human pupil response. Invest Ophthalmol Vis Sci. 2011 Aug 22;52(9):6624-‐35. CONCLUSIONS The research work that we are carrying out has important implications for the greater public good, in addition to its military relevance. Visual impairment from traumatic brain injury can occur in military personnel exposed to direct trauma to
19
the brain or indirectly from blast injury. Similar damage to the visual system can also occur in the civilian population from TBI resulting from motor vehicle accidents and also from head injury due to contact sports at both the school and professional level. Traumatic causes of visual damage can also be additive after repeated episodes of head injury. Patients with visual pathway damage are often unaware of the problem and their associated cognitive impairment may mask the underlying vision impairment and also prevent detection with standard tests of visual function, which require good cognitive performance and focused attention during the test. In addition, other forms of cognitive impairment in the general population such as attention deficit disorder, depression, and dementia prevent the accurate assessment of visual function. Patients with undiagnosed visual dysfunction and superimposed cognitive impairment may pose a danger to themselves and to others when tasks such as driving and other tasks, which demand good visual performance, cannot be safely carried out. For this research, our main goal is to use objective reflexes of the visual system to diagnose vision deficits and ensure effective monitoring of their treatment, when indicated. Such tests will allow accurate testing of the visual system with almost no demands on cognitive function during testing. This will be possible because the constriction of the pupils in response to light, the electrical recording of light evoked potentials (voltage) from the skin overlying the vision centers of the brain and the monitoring of purposeful eye movements to track moving targets are all objective, natural reflexes of the visual system. We are taking advantage of these reflexes by implementing an integrated system to quantify them using a specially designed suite of rapidly performed tests requiring little patient cooperation. Once validated in our proposed study, these tests can be used in cognitively intact or cognitively impaired individuals to assess visual function, leading to rehabilitation and treatment when appropriate. So what? The availability of the objective tests of vision being developed and implemented will greatly improve eye care by providing faster, lower cost testing that can be performed in remote settings. This will provide easier access of the public to accurate assessment of their visual function and will also reduce the cost associated with current testing and transportation to sites of testing. Such tests will also provide a new tool for assessing innovative treatments being developed to save or restore vision. REFERENCES -‐ none APPENDICES – none SUPPORTING DATA – all figures including in body of report