An Abstract of the Thesis of Awatef Mandi Hassan for the degree of Master of Science in Chemistry presented on July 15.1994. Title: Structural and Preliminary Biosynthetic Studies on New Metabolites Produced by Streptomyces murayamaensis Mutant MC2. Abstract approved: Steven J. ould C H3 A procedure for efficient and reproducible isolation of metabolites from cultures of MC2 mutant strain of Streptomyces murayamaensis has been developed. Phenanthroviridin aglycone, 1, a possible shunt product of the kinamycins biosynthesis pathway, was detected in the fermentation cell extract.1 The structure of UV16A, 2, was obtained by X-ray crystallography. Incorporation of 13C-label from 13C uniformly labeled glucose into UV16A made the assignment of most carbons possible and indicated a possible biogenesis from the condensation of a decaketide product and a C7N unit.
Transcript
An Abstract of the Thesis of
Awatef Mandi Hassan for the degree of Master of Science in Chemistry
presented on July 151994
Title Structural and Preliminary Biosynthetic Studies on New Metabolites
Produced by Streptomyces murayamaensis Mutant MC2
Abstract approved
Steven J ould
C H3
A procedure for efficient and reproducible isolation of metabolites from
cultures of MC2 mutant strain of Streptomyces murayamaensis has been
developed Phenanthroviridin aglycone 1 a possible shunt product of the
kinamycins biosynthesis pathway was detected in the fermentation cell
extract1 The structure of UV16A 2 was obtained by X-ray crystallography
Incorporation of 13C-label from 13C uniformly labeled glucose into UV16A made
the assignment of most carbons possible and indicated a possible biogenesis
from the condensation of a decaketide product and a C7N unit
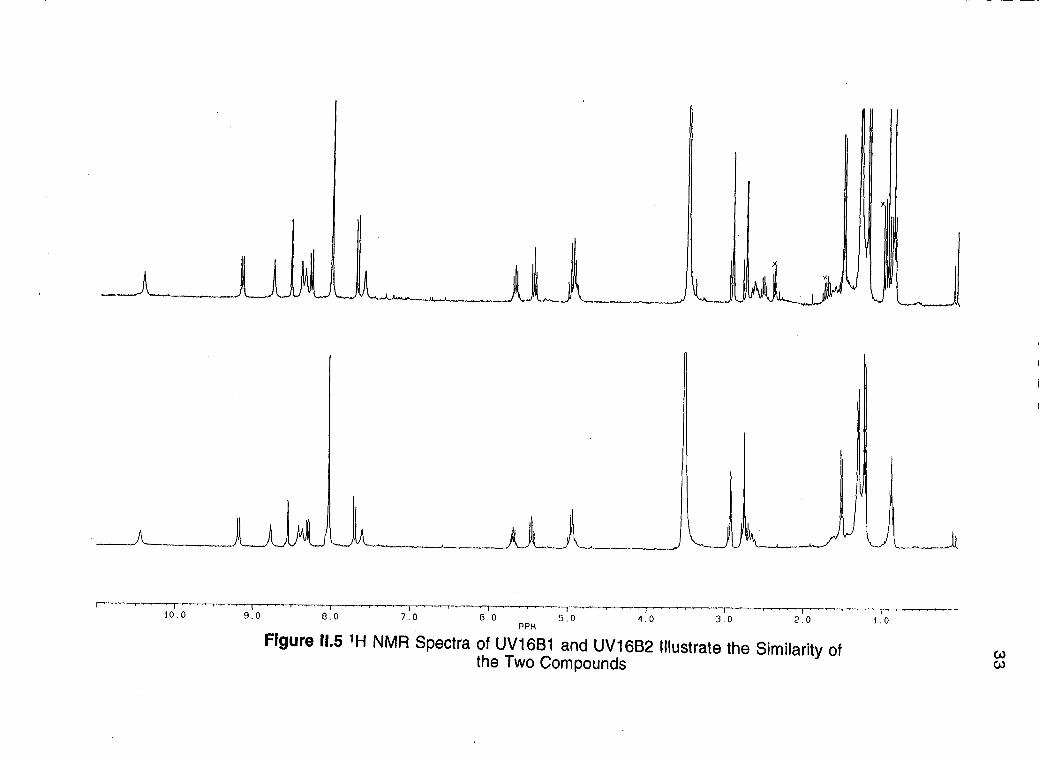
Preparative HPLC was of pivotal importance in the separation of
UV16B1 and UV16B2 which differ only in a methylene group Partial structure
of UV16B1 UV16B2 and UV16C Proton and carbon assignments have been
made based on the use of modern 2D-NMR experiments (COSY HMQC
HMBC)
NH2
OH 0 OH
2
Structural and Preliminary Biosynthetic Studies on New Metabolites Produced by
Streptomyces murayamaensis Mutant MC2
Awatef Mandi Hassan
A THESIS
submitted to
Oregon State University
in partial fulfilment of
the requirements for the
degree of
Master of Science
Completed July 15 1994
Commencement date June 1995
APPROVED
Professor of Chemisflji in charge of major
Head of Department of Chemistry
Dean of Grad School
Date thesis is presented July 15 1994
Presented by Awatef Mandi Hassan
Redacted for privacy
This work is dedicated to the memory of
my father Mandi Hassan
He gave me love courage and taught me to work hard and never quit
Acknowledgment
I would like to thank my major advisor Professamp Steven J Gould for
his support and guidance that made this thesis possible During my two years
of research he provided ideas enthusiasm and encouragement will beI
always grateful
Credit for this accomplishment also goes to Dr John Carney His
frequent suggestions and his assistance in obtaining and analyzing data are
greatly appreciated
Special thanks is due to Mr Roger Kohnert for his advice and
assistance with NMR experiments to Mr Chris Melville for X-ray
crystallographic analysis and to Dr Martha Cone for her assistance in culture
preparation and fermentation
I would also like to thank members of Gould group especially Dr
Nuria Tamayo and Dr Tom OHare mostly for their friendship that made my
time in the lab enjoyable and for their constructive suggestions and helpful
criticism of my thesis
Finally I thank my mother my husband and my lovely two kids Fatima
and Hassan for their love patience and support
Table of Contents
1Introduction
1Biological Activity of Polyketide-Derived Natural Products
Kinamycin D Biosynthesis 2
Antibiotic Biosynthesis in S murayamaensis
The Use of Multiply 13C-labeled Precursors in Structure
Molecular Biological Approach 6
and Biosynthetic Studies 10
Rationale for Current Study 12
Results and Discussion 14
Isolation and Characterization of MC2 Metabolites 14
Production and Detection of Phenanthroviridin Aglycone (1) 16
Bioactivity 18
Radioactive and Stable Isotope Feedings 21
UV16A Structural Studies 22
Biogenesis of UV16A 28
UV16B1UV16B2 Structural Studies 30
Biosynthetic Studies of UV16B1 and UV16B2 49
UV16C Structural Studies 57
Conclusion 64
Further Areas of Study 64
Experimental 66
Detection of Phenanthroviridin Aglycone (1) in MC2
Stereochemistry of Threonine Residue in
Homonuclear Correlation Spectroscopy
Heteronuclear Multiple Quantum Coherence
General 66
HPLC Analysis 67
Preparation of Phosphate-Buffered Silica 68
Fermentation of S murayamaensis Mutant MC2 68
Agar Medium Preparation 68
Seed Medium Preparation 68
Production Medium Preparation 69
Isolation and Purification of UV16A Bl B2 and C 70
Crude Cell Extract 71
Purification of UV16A 72
X-ray Chrystalography of UV16A 73
Purification of UV16B1 and UV16B2 73
Reduction of UV16B2 74
Acid Hydrolysis of UV16B1UV16132 Mixture 75
UV16B1 and UV16B2 76
Purification of UV16C 76
Acetylation of UV16C 77
Methylation of UV16C 77
Bioassay 78
Structural Studies 78
(COSY) on AC 300 78
(HMQC) on AC 300 78
Heteronuclear Multiple Bond Connectivity (HMBC) on AC 300 79
Fast Atom Bombardment Mass Spectrometry (FAB) 79
Radioisotope Feeding Studies 79
[U-14C]D-Glucose 79
[U-14C]Glycerol 80
Stable Isotope Feeding Studies 80
[U- 13C6]D- Glucose 80
Bibliography 81
Appendix 1 87
Expansion of The 500 MHz HMBC Spectrum of UV16B2 87
Appendix 2 102
Crystal and Collection Data for UV16A C26H16N207 102
List of Figures
Figure 11 Examples of Biologically Active Polyketides 2
Figure 12 Metabolites Obtained from Cultures of Streptomyces murayamaensis 5
Figure 13 Schematic Representation of Carbon Chains in Which Each Carbon is Enriched with Carbon-13 and Showing the Expected NMR Spin-Coupled Signal Patterns 11
Figure 111 HPLC Analysis of LH-20 Fraction from MC2 17
Figure 112 ORTEP Drawing from Single-Crystal X-ray Structure Determination of UV16A 24
Figure 113 13C NMR Spectrum of 13C Enriched UV16A from [U-13C61D-Glucose Feeding Experiment 26
Figure 114 HPLC Diagram of UV16B1UV16B2 Mixture from Buffered 31Silica Column
Figure 115 1H NMR Spectra of UV16B1 and UV1662 Illustrate the Similarity of the Two Compounds 33
Figure 117 An Enlargement of the 00 30 ppm Region of
Figure 119 The 500 MHz HMBC Spectrum of UV16B2 in
Figure 111 0 Effect of the Reduction on 1H and 13C Chemical
Figure 111 2 The 500 MHz HMBC Spectrum of Reduced
Figure 1113 Carbon-Carbon Connectivities in the
Figure 1114 The 300 MHz 13C-13C COSY Spectrum of 13C Enriched
Figure 116 The 400 MHz 1H-1H COSY Spectrum of UV16B1 in DMF-d7 37
the 400 MHz 1H-1H COSY of UV16B1 in DMF-d7 39
Figure 118 The 500 MHz HMBC Spectrum of UV16B2 in DMF-d7 40
DMF-d7 at 386 K 41
Shifts of UV16B2 Chromophore Part Structure 46
Figure 1111 1H NMR Spectrum of Reduced UV16B2 in DMSO-d6 47
UV16B2 in DMSO-d6 48
Chromophore of UV16B1 and UV1662 53
UV16B1UV16B2 from [U-13C6]D-Glucose Feeding Experiment 54
Figure 1115 The 300 MHz 2D-INADEQUATE Spectrum of 13C Enriched UV16B1UV16B2 from [U-13C6]D-Glucose Feeding Experiment 55
Figure 1116 The 300 MHz 2D-INADEQUATE Spectrum of 13C Enriched UV16B1UV16B2 from [U-13C6]D-Glucose 56
Figure 1117 1H NMR Spectrum of UV16C 58
Figure A1 Expansion 1 of the 500 MHz HMBC Spectrum of B2 88
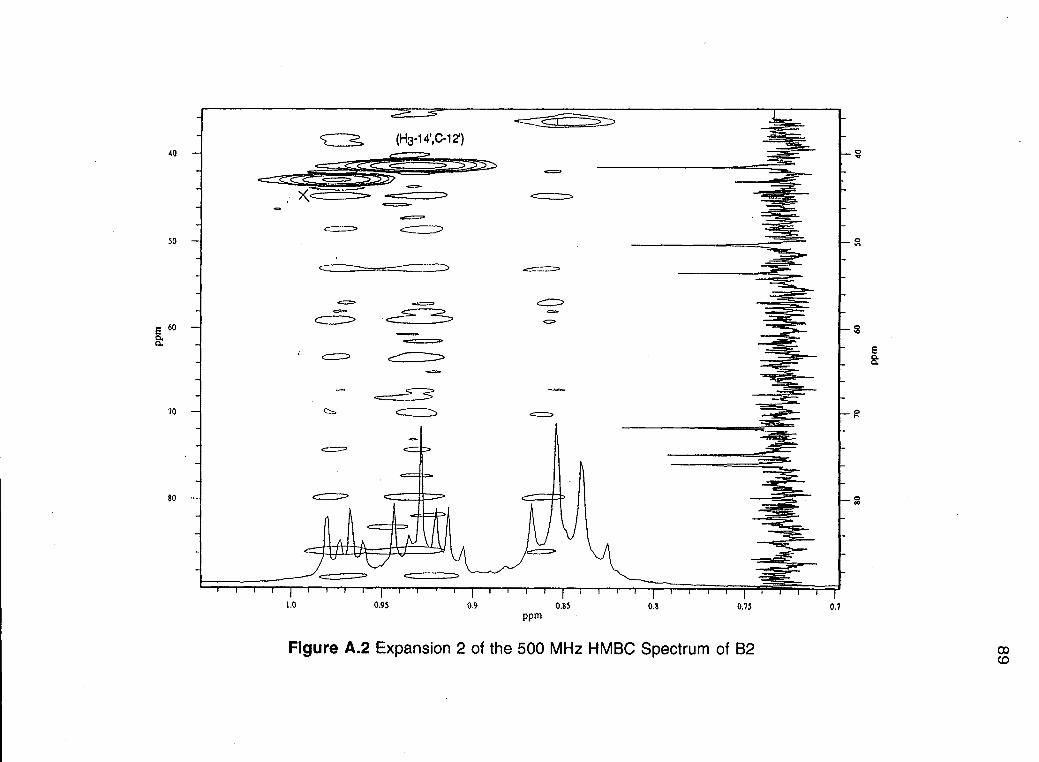
Figure A2 Expansion 2 of the 500 MHz HMBC Spectrum of B2 89
Figure A3 Expansion 3 of the 500 MHz HMBC Spectrum of B2 90
Figure A4 Expansion 4 of the 500 MHz HMBC Spectrum of B2 91
Figure A5 Expansion 5 of the 500 MHz HMBC Spectrum of B2 92
Figure A6 Expansion 6 of the 500 MHz HMBC Spectrum of B2 93
Figure A7 Expansion 7 of the 500 MHz HMBC Spectrum of B2 94
Figure A8 Expansion 8 of the 500 MHz HMBC Spectrum of B2 95
Figure A9 Expansion 9 of the 500 MHz HMBC Spectrum of B2 96
Figure A10 Expansion 10 of the 500 MHz HMBC Spectrum of B2 97
Figure A11 Expansion 11 of the 500 MHz HMBC Spectrum of B2 98
Figure A12 Expansion 12 of the 500 MHz HMBC Spectrum of B2 99
Figure A13 Expansion 13 of the 500 MHz HMBC Spectrum of B2 100
Figure A14 Expansion of the 500 MHz HMBC Spectrum of B2 at 368 K 101
List of Tables
Table 111 Minimum Inhibitory Concentration of UV16B1UV16B2 19
Table 112 Bioactivity of Different Fractions of MC2 Extract 20
Table 113 NMR Spectral Data of UV16A 25
Table 114 NMR Spectral Data of UV16B1 and UV16B2 34
Table 115 NMR Spectral Data of UV16C 61
Table A1 Crystal and Collection Data for UV16A 103
List of Schemes
Scheme 11 Proposed Pathway of Kinamycin Biosynthesis 4
Scheme 111 Schematic Diagram of the Isolation and
Scheme 112 Phenanthroviridin Aglycone as Possible
Scheme 114 Proposed Biosynthesis of PD116744 23 via
Scheme 12 Biosynthesis of Kinamycins versus Murayaquinone 9
Purification of MC2 Metabolites 15
Shunt Product from Kinamycin Biosynthetic Pathway 18
Scheme 113 Biosynthesis of CAN Unit from Glucose 29
Dehydrorabelomycin 29
Scheme 115 Proposed Biosynthetic Route to Substructure 26 50
Scheme 116 Proposed Biosynthetic Route to 27 and 28 51
Scheme 117 Biosynthesis of Threonine 52
Structural and Preliminary Biosynthetic Studieson New Metabolites Produced by
Streptomyces murayamaensis Mutant MC2
Introduction
Biological Activity of Polyketide-Derived Natural Products
Polyketide-derived compounds abound in both prokaryotes and
eukaryotes where they play an amazing variety of roles They owe their
chemical diversity both to the programming of the polyketide synthase and to
the events occurring after chain assembly such as formation of aromatic ether
or macrolide ring systems addition of moieties such as methyl groups terpene
chains or sugar residues and many others
The polyketide-derived compounds have a very wide spectrum of
bioactivity Adriamycin 3 an anthracycline isolated from Streptomyces
peucetius is clinically used as an antitumor agent2 Oxytetracycline 4 one of
the tetracyclines discovered in 1951 has a broad spectrum of antibiotic activity
Aquayamycin 5 is an active inhibitor of the biosynthesis of noradrenaline and
adrenaline3 Kerriamycin B 6 and C 7 and aggreticin 8 are inhibitors of
platelet aggregation4
The latter antibiotics 5-8 belong to the angucycline group which is
comprised of more than one hundred secondary metabolites of microbial origin
The name angucycline or angucyclinone refers to the characteristic four-ring
frame of the aglycone moiety which is assembled in an angular manner5
2
H3C0 0 OH 0
C H3
H 3C OH OH N(CH3)2
OHO
SOO HO
OH 0 OH 0 0
NH2
OH
3 4
5 R1 =R2 =H 6 R1 =AR2=B 7 Ri = H R2 =A 8 RI = R2= A
OH 0
H3CFCV H3C
H3C
OH HHOOO
A
Figure 11 Examples of Biologically Active Polyketides
Kinamycin D Biosynthesis
Kinamycin A B C and D 9a-d isolated from Streptomyces
murayamaensis possess modest antitumor properties and antibiotic activity
against Gram- positive organisms They were originally characterized by Omura
and co-workers6-8 as benzo[b]carbazoles on the basis of chemical
3
spectroscopic and X-ray crystallographic data9 The structures recently have
been revised as the diazo-substituted benzo[b]fluorenes shown1011
9a Rj = R2= R3 = Ac R4 = H
9b R2=AcR1 =R3= R4=H
9c Ri =R3=R4=AcR2=H
9d R1=R3=AcR2=R4=H
Kinamycins are derived from acetate apparently through a decaketide
10 which transforms to the benz[a]anthraquinone 1112-14 Metabolism of
dehydrorabelomycin 11 to a quinone 12 followed by reduction to the
hydroquinone 13 and a biological Friedel-Crafts cyclization would yield the
fluorene system of the kinamycins (Scheme 11)
4
CH3COCoA ---1shy
0 0 0 10 11
C H3
OH 0
12
-CO2 [0]
HO0 C H3 KinamycinsMO
OH 0
18
Scheme 11 Proposed Pathway of Kinamycin Biosynthesis
Studying the kinamycin biosynthetic pathway has been targeted in many
ways One strategy involved isolation and characterization of metabolites
related to the kinamycins from fermentation broths of Streptomyces
murayamaensis This type of strategy has been shown to be quite successful in
biosynthetic studies of secondary metabolites1516 By changing the
fermentation conditions (temperature media and time) different metabolites
may accumulate In the kinamycin studies this led to the characterization of a
5
number of putative intermediates (prekinamycin 14 ketoanhydrokinamycin
15 kinamycin E 16 and kinamycin F 17)1718
HO
H3 CH3
14
H 0 R20
0 H3
16 Ri=H R2=Ac 17 R1 =H R2=HSO
OH
r OH 0
Figure L2 Metabolites Obtained from Cultures of Streptomyces murayamaensis
Secondly a strategy of biosynthetic feeding studies of putative
intermediates has also been employed So far dehydrorabelomycin 1114 and
kinobscurenone 1819 have been incorporated into 9 The insolubility of
prekinamycin 14 the impermeability of the cells or both presumably have
prevented its incorporation into 9
A third approach used successfully in the past to study the biosynthesis
of many microbial products including polyketide antibiotics was the
development of blocked mutant strains20 Isolation and structure determination
of some compounds produced by S coelicolor mutant strains for example had
led to the proposal of a reasonable pathway to the antibiotic actinorhodin21 S
murayamaensis blocked mutants were developed with two kinds of
mutagenesis nitrosoguanidine and germicidal UV light Kinafluorenone 19
6
the first recognized biosynthetically-derived benzo[b]fluorenone was isolated
from a mutant strain of S murayamaensis (MC1) blocked in the biosynthesis of
kinamycins22 Strain MC1 was isolated from amongst survivors of mutagenesis
of a wild type spore suspension with nitrosoguanidine
HO
OH
00 OHHC3
19
Antibiotic Biosynthesis in S murayamaensis - Molecular BiologicalApproach
Rapid progress in molecular genetic studies of Streptomyces now affords
basic information on the organization and regulation of genes concerned with
antibiotic biosynthesis in these organisms An important feature in
streptomycetes is that genes for the various steps of polyketide biosynthesis
show marked tendency to clustering2023 This is also true of genes for the
biosynthesis of antibiotics of other chemical classes This greatly facilitates the
isolation and characterization of all the biosynthetic genes on a pathway once
a strategy is available to identify just one In the case of antibiotic production
one or more resistance genes must also be expressed in order to protect the
host cell from the biological effects of its own antibiotics and this is usually
closely linked to the biosynthetic structural genes24
macrolides aminoglycosides and modified peptide antibiotics all have been
cloned in the past decade Some of these have been cloned by selection for
resistance genes and searching for contiguous biosynthesis genes whereas
others have been cloned by complementation of blocked mutants More
recently several antibiotic biosynthesis genes and gene clusters have been
cloned using heterologous probes to hybridize and isolate predicted genes
encoding steps in the pathway of interest2526
act III (a gene that encodes the actinorhodin polyketide ketoreductase of
S coelicolor) and gra ORF1 (a gene that encodes the granaticin ketoacyl
synthase of S vioaceorber Yu 22)27 probes were used to screen a genomic
library of S murayamaensis (constructed in bacteriophage EMBL4 and cloned
into E coh) and seven gene clusters positively hybridized with the DNA probes
act III and act III like genes encode reductases that reduce the 13-keto group
which is located nine carbons from the carboxyl end of the assembled
polyketide chain Since the synthesis of the polyketide chain begins at the
methyl terminus this hypothesis would suggest that the enzyme measures the
assembeled polyketide and reduces the proper keto group prior to ring closure
The reduction occurs at a carbon which is part of the first ring formed during the
biosynthesis and may be a prerequisite for efficient folding of the polyketide
chain2526
Interestingly an o-phenanthraquinone metabolite murayaquinone 20
has also been isolated from kinamycin producing cultures of S
murayamaensis28 This raises a question of whether it is produced by different
polyketide synthase or by an alternative folding of the same decaketide
precursor leading to the kinamycin skeleton
8
OH
20
As shown in Scheme 12 in the biosynthesis of murayaquinone the
nascent decaketide chain should be reduced at positions 11 and 15 or 7 and 11
depending on the direction of the polyketide chain folding while the precursor
chain of the kinamycins needs to be reduced at position 9 This suggests that
murayaquinone biosynthesis requires a different set of enzymes from that
required for the biosynthesis of kinamycins Hence the products of two different
polyketide pathways in S murayamaensis are known and the seven gene
clusters suggested more may exist
9
1 AcetylCoA starter unit + 9 MalonylCoA
1 AcetylCoA starter unit + MaionylCok
C001-4 or
HOOC
HO g
0 COOH
0
OH OH
0 HOOC
OH 0 OH
101
OH
CH3 [0]
OH
Kinamycins
OH 0
18
Scheme 12 Biosynthesis of Kinamycins versus Murayaquinone
10
The Use of Multiply 13C-labeled Precursors in Structure and Biosynthesis Studies
Feeding of precursors multiply labeled with carbon-13 has been used
to investigate complex biosynthetic problems [12-13C2]Acetate has been
extensively used to study terpenoid and polyketide metabolism29-31 This
powerful method derives from the simple principle that two adjacent carbons
simultaneously enriched in carbon-13 give rise to a pair of new coupled signals
in the corresponding 13C NMR spectrum These coupled pairs appear as
satellites about the natural abundance carbon signal producing an easily
recognized trio of resonances Any intervening process which breaks an intact
130-130 bond results instead in a simple enrichment of the appropriate sites in
the resulting metabolite and a corresponding enhancement of the relevant
natural abundance signals
Cane et al32 used a variation of the doubly labeled acetate technique
in which uniformly 13C-labeled glucose ([U-13C6]glucose) was used as in vivo
precursor of [12-13C2]acetyl CoA leading to the demonstration of the
mevalonoid origin of pentalenolactone and its precursor pentalenic acid by
interpretation of the 13C NMR spectra Logically this methodology should be
applicable to the study of additional product metabolism The presence of a
chain of three labeled carbon atoms derived intact from glucose should yield a
characteristic pattern consisting of two trios corresponding to each end of the
chain and a quintet resulting from the central carbon atom The quintet would
arise from the superposition of a triplet corresponding to those species in which
both neighboring carbons are labeled and a doublet resulting from those
species in which either one or the other of the adjacent carbons is enriched with
130 because the glucose enrichment was 80 The predicted quintet pattern is
11
based on the assumption that J AB J Bc Similarly a four-carbon unit could be
recognized by the resulting pattern of trio-quintet-quintet-trio Each of these
various coupling relationships illustrated schematically in Figure 13 is easily
recognized by the characteristic coupling constants and should be directly
verifiable by the appropriate homonuclear 13C-13C decoupling experiments
(A) (B) (C)
Figure I3 Schematic Representation of Carbon Chain in Which Each Carbon is Enriched with Carbon-13 and Showing the Expected NMR Spin-Coupled Signal Patterns (A) A two-carbon unit (B) a three-carbon unit (C) a four-carbon unit
The utility of such an approach was applied for shikimic acid derived
metabolites Shikimic acid the apparent precursor of numerous families of
natural products is known to be derived from glucose by the combination of an
intact four-carbon unit erythrose-4-phosphate and an intact three-carbon unit
phosphoenol pyruvate Studies of the biosynthesis of shikimate derived
metabolites using singly labeled samples of glucose were difficult to interpret
because of the competition between alternative metabolic pathways which
result in indirect labeling of numerous additional sites in the derived
metabolites33-34 The utilization of [U-13C6]glucose is effectively transparent to
the scrambling processes while remaining opaque to the direct incorporation of
intact biosynthetic units regardless of the manner of their derivation from
12
glucose Rinehart et al had reported the use of [U-13C6]glucose to confirm the
shikimate origin of the C7N unit of pactamycin and used homonuclear
decoupling to confirm the observed labeling patterns35 Gould and Cane had
reported the use of [U-13C6]glucose in the biosynthesis of streptonigrin36
Rationale for Current Study
Previous studies on the kinamycin biosynthetic pathway in S
murayamaensis involved isolation and characterization of some intermediates
obtained by manipulation of the fermentation conditions Developing S
murayamaensis mutant strains led to the characterization of kinafluorenone 19
from mutant strain MC1 Prekinamycin the first compound with the 5shy
diazobenzo[b]fluorene skeleton in the biosynthesis pathway of KD was
overproduced by a mutant strain MC4 Another mutant strain (MC2) isolated
from amongst the survivors of germicidal UV light treatment of a spore
suspension of the wild type strain has no detectable antibiotic activity3 7
Screening the strain in five different production media yielded no evidence of
kinamycin production Colonies of strain MC2 are very dark on soybean-
glucose agar and green in soybeanglucose liquid seed medium whereas the
wild type is dark brown in both instances
TLC analysis of the strain grown in oatmeal or glycerol-asparagine
media initially yielded no detectable production of kinamycin or
murayaquinone although during the course of present study it was discovered
that kinamycin is produced by the mutant after 8 days in oat meal production
medium in very minor quantities HPLC analysis of the ethyl acetate extract of
13
the strain grown on glycerol-asparagine revealed that it produces
kinafluorenone38
The objective of this study was to characterize new metabolites
produced by this mutant strain and to initiate a preliminary study of their
biosynthetic origin To discover unusual new metabolites from microbial
sources either biological or chemical screening was applied Since we were
expecting intermediates or some other metabolites of unknown biological
activity chemical screening using TLC and HPLC with a UV detector was used
to look for new metabolites produced by the mutant
In comparison with the wild type strain MC2 makes a number of new
metabolites in a wheat medium four of which were targeted for this study
(1) A metabolite with UV spectrum very similar to ketoanhydrokinamycin (260
304 420 nm) called metabolite UV16A
(2) Two non polar metabolites having a 402-404 nm chromophore (215 256
406 nm) called UV16B1 and UV16B2
(3) A more polar metabolite with UV max at 252 320 380 nm called UV16C
Development of isolation and purification procedures for each of these
compounds was the early focus in this study Following the isolation and
purification of the new metabolites structural studies of these compounds by
modern high field NMR techniques such as 2D NMR and other spectroscopic
methods was the immediate objective Since the use of the 13C-multiply
labeled precursors makes simultaneous determination of structure and
biosynthesis possible where classical methods could not provide unequivocal
answers the last part of this study was focused on feeding uniformly 13Cshy
labeled glucose and characterizing the 13C-enriched metabolites by the
appropriate NMR techniques
14
Results and Discussion
Isolation and Characterization of MC2 Metabolites
The 7 wheat 2 trace metals production medium was chosen to
grow the mutant since it showed the best production of the new metabolites
The colored metabolites were obtained from mycelium by extraction with
acetone Initial attempts to purify the colored metabolites by flash
chromatography on Silicar CC-4 did not result in good separation and the
Silicar retained the material very strongly Other portions of the mycelium
extract were chromatographed on Sephadex LH-20 and phosphate buffered
(pH 7) flash grade silica gel and eluted with increasing concentrations of
methanol in dichloromethane Both were capable of separating UV16A from
UV16B1UV16B2 The buffered silica had the advantages of tolerating more
material compared to the same size column of LH-20 and by the speed of flash
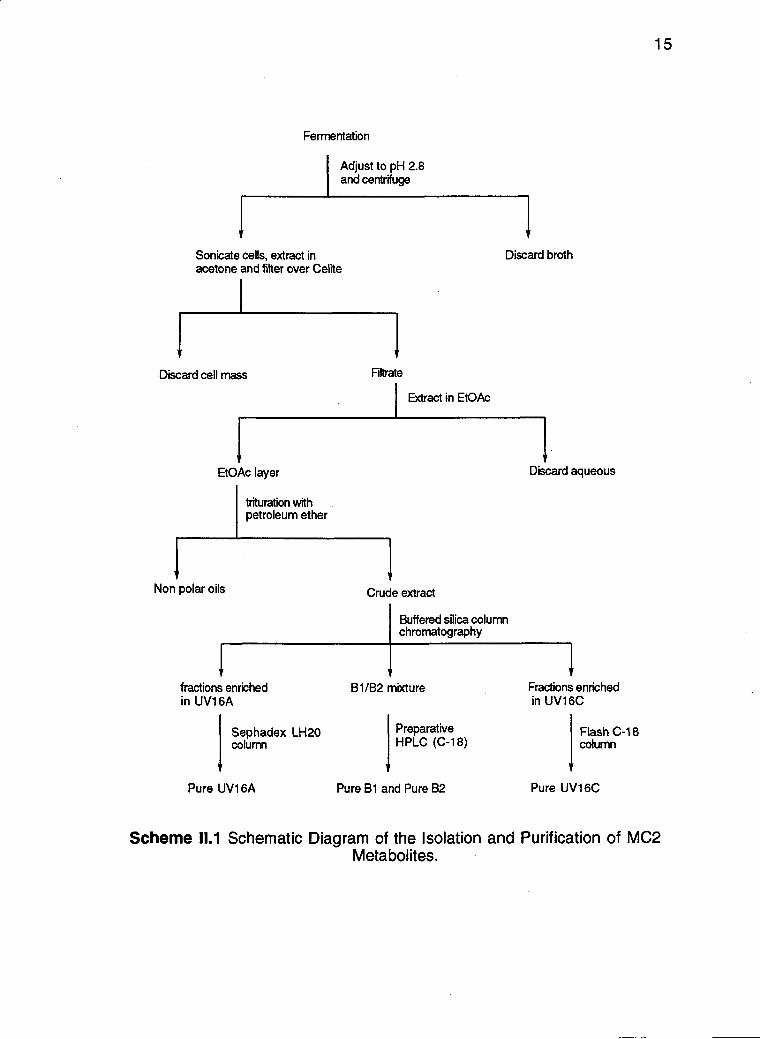
chromatography over gravity LH-20 chromatography The isolation and the
purification of the different metabolites is outlined in Scheme 111
15
Fermentation
Adjust to pH 28 and centrifuge
Sonicate cells extract in Discard broth acetone and filter over Celite
1
Discard cell mass Filtrate
Extract in EtOAc
EtOAc layer Discard aqueous
trituration with petroleum ether
Non polar oils
fractions enriched in UV16A
Sephadex LH2O column
Pure UV16A
Crude extract
IBuffered silica column chromatography
B1 B2 mixture
Preparative HPLC (C-18)
Pure B1 and Pure B2
1
Fractions enriched in UV16C
Flash C-18 column
Pure UV16C
Scheme 111 Schematic Diagram of the Isolation and Purification of MC2 Metabolites
16
Production and Detection of Phenanthroviridin Aglycone (1)
In an attempt to find a good chromatographic system to separate MC2
metabolites prior to the development of the above purification scheme crude
extract from MC2 cells (from a 43 L fermentation culture) was chromatographed
on a column of Silicar CC-4 and colored materials were eluted with increasing
proportions of EtOAc in dichloromethane (DCM) Fractions containing UV16A
as the major component (170 mg) were further purified on a column of buffered
silica gel yielding 24 mg of material in the fraction most enriched in UV16A A
portion (5 mg) was further chromatographed on Sephadex LH-20 in toluene-
methanol (91) One of the fractions (1 mg) was dissolved in methanolshy
dichloromethane (91) and analyzed by diode array HPLC (Figure 111a) One
of the minor metabolites in the fraction eluting at 196 min exactly matched the
retention time and the UVvis absorption spectrum of authentic
phenanthroviridin aglycone (Figure Ili b) Co-injection with the authentic
materia13940 gave a symmetrical enhancement of the peak with an unchanged
UVNis spectrum Further confirmation of the identity of the peak assigned to 1
was provided by thermospray (TSP) liquid chromatography mass spectrometry
(LCMS) both an authentic sample of 1 and the new metabolite had identical
retention times and gave an M- ion at mz 3051
17
1
03
A
012
B F2 008
0 0lt 004
200 300 400 500 600
Wavelength
16 18 20 22
Time min
Figure 111 HPLC Analysis of LH-20 Fraction from MC2 A Chromatogram of LH-20 fraction B UVNis absorption spectrum of the component eluting at 1956 min overlaid with spectrum of authentic 1
Phenanthroviridin aglycone was predicted to be a possible
intermediate 22 in the kinamycin pathway before the structure revision has been
done Subsequently four naturally-occuring benzo[b]phenanthridines have
been isolated from two different Streptomyces including 1 and the
jadomycins4142 The quinone 10 in the kinamycin biosynthetic pathway could
18
readily lead to the benzo[b]phenanthridines via nitrogen addition and
decarboxylation1
CH3
OH o OH 0
10 1
Scheme 112 Phenanthroviridin Aglycone as Possible Shunt Product from Kinamycin Biosynthetic Pathway
Bioactivity
The UV16B1UV16B2 mixture had some antibiotic activity against
Gram-positive bacteria which are more sensitive than Gram-negative The
minimum inhibitory concentrations of UV16B1UV16B2 against a group of
selected bacteria are listed in Table 111 UV16B1UV16B2 UV16A and
UV16C exhibit no significant activity against yeast or mold
19
Table 111 Minimum Inhibitory Concentration of UV16B1UV16B2 (11gmL)
Test microorganism MIC
Escherichia coil ATCC 10536 gt128
Serratia Marcescens ATCC 13880 128
Pseudomonas aerufinosa ATCC 25619 128
Klebsiella pnumonias AAD 128
Bacillus subtilis ATCC 6633 16
Staphylococcus aureus ATCC 25923 64
Streptococcus faecalis ATCC 29212 64
Micrococcus luteus ATCC 9341 1
Bioactivity of different fractions from a buffered silica column was tested
in the laboratory of Dr M Daeschel (Food Science-OSU) and the results are
presented in Table 112 Five mg of samples (1-4 nonpolar fractions UV16C
very polar fractions UV16A respectively) were dissolved in 1 mL of DMSO and
paper disks (14 inch diameter) were impregnated with 20 pL Number 5 was
prepared by partially dissolving -11 mg of UV16B1UV16B2 mg in 1 mL of 91
DCM- methanol and the disk was prepared by adding 15 IL of the suspension
while disk 6 was prepared by adding 15 tiL of UV16 broth and 7 was a DMSO
control UV16A UV16B1UV16B2 and UV16C did not show pronounced
activity toward bacteria yeast or fungi However the nonpolar fraction of the
fermentation crude extract has very high activity against fungi
20
Table 112 Bioactivity of Different Fractions of MC2 Extract
Gram positive bacteria 1 2 3 4 5 6 7
Lactobacilus plantarum 31
Pediococcus pentosaceus FBB-61 -
Streptococcus faecalis 34
Leuconostoc mesenteroides 47
Staphilococcus aureus 609 ++
Bacillus subtilis 614 +shy + +-
Listeria monocitogenes 630 +1shy
Gram negative bacteria
Klebsiella pneumonie 601 + +
Escherichia coli 13604
Enterobacter aerogenes 605
Pseudomonas aeruginosa 603 +shy +-
Pseudomonas flourescense 602
Salmonella typhimirum 616
Yeast
1003
1009 +++ ++ ++
1011 +++ -
1023 +++ + + +shy
1024 +++
1025 +++ ++ ++ +shy
1026 +++ -
21
Table 112 Continued
Fungi
MP-2 +++ shy
MP-3 +- +shy
MP-4 +shy
MP-6 ++
MP-7 +++ shy
MP-13 ++
+++ extremely large inhibition but not complete ++ or + not complete inhibition
Radioactive and Stable Isotope Feedings
To prepare for a 13C-feeding the incorporation of glucose or glycerol as
a carbon source was tested [U- 14C]D- Glucose and [U-14C]glycerol were fed to
separate cultures of MC2 at 24 48and 72 h after the inoculation of the
production media The addition of both labeled glucose and glycerol was
accompanied with 1 g of unlabeled compound to observe the effect on the
production of the target metabolites The addition of both compounds
decreased the production of UV16A and UV16B1UV16B2 while it did not affect
the production of UV16C The incorporation of 14C from either glucose or
glycerol in various metabolites was similar 008 - 012 in UV16B1UV16B2
and 011 - 017 in UV16C Glucose was chosen over glycerol for the stable
22
isotope feeding experiment because it has the advantage of showing longer
units
[U-13C6]D-Glucose was fed along with [U-14C]D-Glucose to one liter of
MC2 cultures using the same feeding strategy used for the radioactive feeding
The crude extract (298 mg) was chromatographed by the usual method
Buffered silica chromatography yielded 175 mg of pure UV16B1UV16B2
mixture with 0048 14C incorporation The incorporation of the radioactive
label in UV16A was 0013 However since the mass of this metabolite was
only 16 mg the 13C NMR spectrum showed a highly 13C enriched sample On
the other hand UV16C had a 0034 incorporation but due to high amount
(116 mg) produced the level of 13C enrichment shown in the 13C NMR spectrum
was low
UV16A Structural Studies
UV16A was separated from a minor green metabolite having similar Rf
on silica gel TLC by chromatographing the fraction enriched in UV16A on a
Sephadex LH-20 column and eluting with dichloromethane- methanol (11)
The infrared spectrum of the pure UV16A with strong absorption at 1629 1669
cm-1 representing quinone carbonyl stretches was not surprising since its
UVNis spectrum resembles that of ketoanhydrokinamycin 15 Indeed
examination of proton NMR spectrum of UV16A (Table II3) revealed the
pattern typical of the three adjacent hydrogens in the A ring of the kinamycin
skeleton [8 737 (1H d J = 86 Hz) 781 (1H t J = 82 Hz) 754 (1H d J= 72
Hz)]
23
A 1H-1H COSY spectrum revealed another AMX spin system at 6 71
(1H d J=84 Hz) 785 (1H dd J= 84 20 Hz) 808 (1H d J= 20 Hz) Single
frequency decoupling provided confirmation of this analysis From an HMQC
experiment it was deduced that two doublets at 8 315 and 390 represent
diastereotopic methylene protons that show geminal coupling of 13 Hz From
the above data part structures 21 and 22 were defined
710 H
781
737
OH 0 H 808
21 22
These two part structures left unassigned signals for one methyl at 8
13 the diastereotopic methylene one aromatic and one exchangable proton
at 8 800 There was also a very broad hump in the region of 11-12 ppm that
was not accounted for Due to the poor solubility of UV16A a decent natural
abundance 13C NMR spectrum was never obtained Some of the 13C chemical
shifts were observed indirectly through HMBC and HMQC NMR experiments
The results will be discussed later
The solubility of the UV16A metabolite was so low that a small sample
of - 2 mg would precipitate in 05 mL of DMSO at 323 K in the NMR tube as light
orange needles To modify the quality of the crystal a super-saturated solution
(- 2 mg of material in 05 mL of DMSO heated to - 90 degC) was slowly cooled
over a 48 h period in a low-form Dewar flask filled with hot water The collected
crystals were suitable for X-ray diffraction A single crystal X-ray diffraction
24
analysis provided the total structure 2 The ORTEP plot is shown in Figure
112
NH2
OH 0 OH
2
(1
CS U -----Ai 4 100 11v- 4
00---5- shyNor -fir0--
II
e
Figure 112 ORTEP Drawing from Single-Crystal X-ray Structure Determination of UV16A Hydrogens have been omitted for clarity
25
Table 113 NMR Spectral Data of UV16A
1H 13CNo Jcc (Hz)
1 1926 C 527
2 (315 39) 2H d J= 13Hz 515 CH2
3 743 C 375
4 1571 C 557
4a C
5 81 1H s 1175 CH 686
6 1625 C 702
6a C
7 1900 C 557
7a 1159 C 650
8 1607 C 646
9 737 1H d J= 86 Hz 1240 CH 570
10 781 1H t J= 82 Hz 1376 CH 569
11 754 1H d J= 72 Hz 1187 CH 614
11a 1350 C 612
12 1826 C 532
12a C
12b C
13 13 3H s 207 CH3 375 1 1667 C
2 1290 C
3 808 1H d J= 20 Hz 1270 CH 4 1320 C
5 1480 C 6 710 1H d J= 84 Hz 1163 CH
7 785 1H dd J= 84 20 Hz 1314 CH
1-NH2 800 2H br exchangable
6 -OH 11-12 br exchangable
8 -OH 11-12 br exchangable
The enrichment is very low and Jcc could not be measured 13C chemical shift could not be identified by HMBC experiment
The HMQC data were collected using the following acquisition
parameters DO = 3 ps D1 = 20 s SI1 = 512 word SI2 = 2048 word The data
were acquired in 192 experiments of 96 scans each
79
0Heteronuciear Multiple Bond on AC
This data set was collected using the following parameters DO = 3 gs D1
= 20 s D2 = 33 ms S1 = OH D4 = 005 s SI1 = 512 word SI2 = 2048 word
The data was acquired in 128 experiments of 176 scans each
Fast Atom Bombardment Mass Spectrometry (FAB)
Samples of A UV16B1 or UV16B2 were dissolved in 3-nitrobenzyl
alcohol matrix Sample ion fragments were generated by FAB source
generated from Ze gas 8 keV
Radioisotope Feeding Studies
fkl14-C1D-Glucose
A 25 mL aqueous solution of D- [U- 14C]glucose (429 X 107 dpm sp act=
10-15 mCi mmol-1) was fed to 5 - 200 mL cultures in 3 pulses 24 h apart 10 mL
of the labeled glucose solution was sterile filtered into 24 h cultures 75 mL of
the same solution was subsequentely administered via sterile filter at 48 and 72
h Each time the same volume of 4 unlabeled D-Glucose solution was added
to the cultures The 8 day cultures were harvested to give -900 mg of crude
extract Subsequent purification of 1618 mg of the crude extract on buffered
silica column yielded a 49 mg fraction containing UV16A UV16B1 and
UV16B2 which retained 0014 of the fed radioactivity Further purification of
80
the UV16C containing fraction on a C-18 column yielded 70 mg of pure UV16C
which retained 002 of the fed radioactivity
at14C)Glycerol
The above procedure was used to feed [U-14C]Glycerol (443 X 107 dpm
sp act = 5 - 10 mCi mmol-1) along with 1 g of unlabeled glycerol to 5 - 200 mL
cultures The 8 day cultures were harvested to give 755 mg of crude extract
Purification of 100 mg of the crude extract yielded 33 mg of UV16B1UV16B2
mixture which retained 0016 of the fed radioactivity
Stable Isotope Feeding Studies
e
Fermentation conditions for this experiment were identical to those
outlined above Feedings were administered to 5-200 mL cultures contained in
1 L Erlenmeyer flasks One gram of [U- 13C6JD- Glucose (98+ enriched) was
dissolved in 25 mL of Milli-Q water and administered as 75 75 and 10 mL at
24 48 and 72 h after inoculation respectively Simultaneously a total of 427 X
107 dpm of [U-74CJD-Glucose was fed in the same volumes The 7 day cultures
were harvested and subsequent purification yielded 175 mg of a
UV16B1UV16B2 mixture 16 mg of UV16A and 116 mg of UV16C
81
Bibliography
1 Cone M C Hassan A M Gore M P Gould SJ Borders D B Alluri M R Detection of Phenanthroviridin Aglycone in a UV-Mutant of Streptomyces murayamaensis J Org Chem 1994 59 1923-1924
2 Arcamone F Franceschi G Penco S Adriamycin(14-Hydroxyshydaunomycin) A Novel Antitumor Antibiotic Tetrahedron Lett 1969 1007-1010
3 Ayukawa S Umezawa H Inhibition of Dopamine 13 - Hydroxylase by Aquayamycin J Antibiot 1968 21 354-357
4 Omura S Nakagawa A Fukamachi N Miura S Takahashi Y Komiyama K Kobayashi B OM-4842 A New Platelet Aggregation Inhibitor from Streptomyces J Antibiot 1988 812-813
5 Roher J Theiricke R Anglucycline Group Antibiotic Natural Product Reports 1992 9 103-137
6 Ito S Matsuya T Omura S Otani M Nakagawa H Takeshima H lwai Y Ohtani M Hata T A New Antibiotic Kinamycin J Antibiotics 1970 23 315-317
7 HataT Omura S Iwai Y Nakagawa A Otani M Ito S Masuya T A new antibiotic Kinamycin Fermentation Isolation Purification and Properties J Antibiot 1971 24 353-359
8 Omura S Nakagawa A Yamada H Hata T Furusaki A Watanabe T Structure and Biological Properties of Kinamycin A B C D Chem Pharm Bull 1973 21 931-940
9 Furusaki A Matsui M Watanabe T Omura S Nakagawa A Hata T The Crystal and Molecular Structure of Kinamycin C p -Brompbenzoate Isr J Chem 1972 10 173-187
10 Gould S J Tamayo N Melville C R Cone M C Revised Structure for the Kinamycin Antibiotics 5-Diazobenzo[b]fluorenes Rather Than
82
Benzo[b]carbazole Cyanamides J Am Chem Soc 1994 116 2207shy2208
11 Mithani S Weeratunga G Taylor N J Dmitrienko G I The Kinamycins are Diazofluorenes and not Cyanocarbazoles J Am Chem Soc 1994 116 2209-2210
12 Sato Y Gould S J Bioaynthesis of Kinamycin D Incorporation of [ 12shy13C] Acetate and of [ 2-2H3 1-13C] Acetate Tetrahedron Lett 1985 26 4023-4026
13 Sato Y Gould S J Bioaynthesis of Kinamycin Antibiotics by Streptomyces murayamaensis Determination of the Origin of Carbon Hydrogen and Oxygen Atoms by 13C NMR Spectroscopy J Am Chem Soc 1986 108 4625- 4631
14 Seaton P J Gould S J Kinamycin Biosynthesis Derivation byExcision of an Acetate Unit from a Single- Chain Decaketide Intermediate J Am Chem Soc 1987 109 5282
15 Verrall M S Discovery and Isolation of Microbial Products Ellis Norwood London 1985
16 Luckner M Secondary Metabolism in Microorganisms Plants and Animals 2nd Edition Spronger-Verlag Berlin 1984
17 Cone M C Seaton P J Halley K A Gould S J New Products Related to Kinamycin from Streptomyces murayamaensis I Taxonomy Production Isolation and Biological Properties Antibiot 1989 42 179shy188
18 Seaton P J Gould S J New Natural Products Related to Kinamycin from Streptomyces murayamaensis II Structure of Prekinamycin Ketoanhydrokinamycin and Kinamycin E and F J Antibiot 1989 42 189- 197
19 Melville C R unpublished results
83
20 Hopwood D A Sherman D H Molecular Genetics of Polyketides and its Comparison to Fatty Acid Biosynthesis Ann Rev Genet 1990 24 37-66
21 Rudd B A M Hopwood D A J Gen Microbiol 1979 114 35
22 Cone M C Melville C R Gore M P Gould S J Kinafluorenone a Benz[b]fluorenone Isolated from the Kinamycin Producer Streptomyces murayamaensis J Org Chem 1993 58 1058-1061
23 Hopwood D A 1986 Cloning and Analysis of Antibiotic Biosynthetic Genes in Streptomyces In Biological Biochemical and Biomedical Aspects of Actinomycetes ed G Szabo S biro M Good Fellow pp 3shy14 Budapest Akademiai kiado
24 Robinson J A Enzymes of Secondary Metabolism in Microorganism Chem Soc Review 1988 17 416-418
25 Strohl W R Bartel P L Li Y Connors N C Woodman R H Expression of Polyketide Biosynthesis and Regulatory Genes in Heterologous Streptomycetes J Ind Microb 1991 7 163-174
26 Bar let P L Zhu C Lampel J S Dosch D C Connors N C Strohl W R BealeJr J M Floss H G Biosynthesis of Anthraquinone by Interspesies Cloning of Actinorhodin Biosynthesis Genes in Streptomycetes Clarification of Actinorhodin Gene Functions J Bact 1990 172 4816- 4826
27 Sherman D H Malpartida F Bibb M J Kieser H M Bibb M J Hopwood D A Structure and deduced function of the granaticinproducing polyketide synthase gene cluster of Streptomyces violaceoruber Tu22 EMBO 1989 8 2717-2725
28 Sato Y Kohnert R Gould S J Application of Long Range 1H13C Heteronuclear Correlation Spectroscopy (LR HETCOSY) to Structure Elucidation The structure of Murayaquinone Tetrahedron Lett 1986 27 143
29 Tanabe M Suzuki KDetection of C-C Bond Fission during the Biosynthesis of the Fungal Triprenyl phenol Ascochlorin using [12shy13C]Acetate J Chem SocChem Commun 1974 445-446
84
30 McInnes A G Smith D G Walter J A Vining L C Wright J L C New Techniques Biosynthetic Studies using 13C Nuclear Magnetic Resonance Spectroscopy The Biosynthesis of Tenellin Enriched from Singly and Doubly LabelledPrecursor J Chem SocChem Commun 1974 282
31 Seto H Sato T Yonehara H Utilization of Carbon-13-Carbon-13 Coupling in Structural and Biosynthetic Studies An Alternate Double Labeling Method J Am Chem Soc 1973 95 8461
32 Cane D E Rossi T Tillman A M Pachlatko J P Stereochemical Studies of Isoprenoid Biosynthesis Biosynthesis of Pentalenolactone from [U- 13C6]Glucose and [6- 2H2]Glucose J Am Chem Soc 1981 103 1838
33 Hornemann U Kehrer J P Eggert J H Pyruvic Acid and D-Glucose as Precursors in Mitomycin Biosynthesis by Streptomyces verticillatus J Chem Soc Chem Commun 1974 1045-1046
34 Haber A Johnson R D Rinehart K L Jr Biosynthetic Origin of the C2 Unit of Geldanamycin and Distribution of Label from D[6-13Cplucose J Am Chem Soc 1977 99 3541-3544
35 Rinehart K L Jr Potgieter M Delaware D L Seto H Direct Evidence from Multiple 13C Labeling and Homonuclear Decoupling for the Labeling Pattern by Glucose of the m-Aminobenzoyl (CAN) Unit of Pactamycin J Am Chem Soc 1981 103 2099-2102
36 Gould S J Cane D E Biosynthesis of Streptonigrin from [U- 13C6] -D-Glucose Origin of the Quinoline Quinone J Am Chem Soc 1982 104 343-346
37 Cone M C Research Report Culture Techniques for Streptomyces murayamaensis Screening of S murayamaensis UV and NTG Survivors 389
38 Cone M C Research Report Metabolites of Streptomyces murayamaensis Strain UV16 292
39 Gore M P Gould S J Weller D D Synthesis of Putative Intermediates in the Biosynthesis of the Kinamycin Antibiotics Total Synthesis of
85
Phenanthroviridin Aglycone and Related Compounds J Org Chem 1992 57 2774-2783
40 Gore M P Gould S J Weller D D Total Synthesis of Phenanthroviridin Aglycone The First Naturally Occurring Benzo[b]phenanthridine J Org Chem 1991 56 2289-2291
41 Ayer S W McInnes A G Thibault P Walter J A Doull J L Parnell T Vining L CJadomycin a Novel 8H-Benz[b]oxazolo[32shytjphenanthoviridine Antibiotic from Steptomyces venezuelae ISP5230 Tetrahedron Lett 1991 32 6301-6304
42 Doull J L Ayer S W Singh A K Thibault P Production of A Novel Polyketide AntibioticJadomycin B By Streptomyces venezuelae Following Heat Shock J Antibiot 1993 46 869-871
43 French JC at Warner - Lambert Company Unpublished results
44 Mathews C K van Hold K E Biochemistry The BenjaminCummings Publishing Company 1990 pp 730-731
45 Claydon N Frederick G Metabolic Products of Entomophthora virulenta J Chem Soc Perkin Trans I 1978 171-173
46 Jaime C Ortuno R M Font J Di- and Trisubstituted y-Lactones Conformational Study by Molecular Mechanics Calculations and Coupling Constant Analysis J Org Chem 1986 51 3946-3951
47 Sakai R PhD Thesis University of Illinois Urbana 1991 106-118
48 Hornemann U Personal Communications
49 Molecular Structure Corporation TEXSAN 1988 MSC 3200A Research Forest Drive The Woodlands TX 77381
50 CarneyJ work done at University of Illinois
86
51 Sahm D F Washington J A H Antibacterial Susceptibility Tests Dilution Methods In Manual of Clinical Microbiology 5th ed Ballows AHausler W J Jr HermannK L lsenburg H D Eds Am Soc for Microbiology Washington D C 1991 pp 1105-1116
87
Appendix 1
Expansions of 500 MHz HMBC Spectrum of UV16B2
Figure A1 Expansion 1 of the 500 MHz HMBC Spectrum of B2
40
(H3-1 4C-1 2)4_
50 o
E 60
Q WINSIZZNer $
E a
10 o
80
I
10 095 09 ppm
085
I
08 075 07
Figure A2 Expansion 2 of the 500 MHz HMBC Spectrum of B2
F 1111111111-ill-It 17 16 13 14 13 12 11
ppm
Figure A3 Expansion 3 of the 500 MHz HMBC Spectrum of B2
EF
-40 Z=M (H2-13C-12)
O lt7
30
O (H3-19C-2) C011
60 - cq
Cz)
I I I I I 1 I 1II II 17 16 15 14
ppm
Figure A4 Expansion 4 of the 500 MHz HMBC Spectrum of B2
0
0
- 3 165 shy
00 0 00 -
0 170
_-shy41111 _-------- -
175 shy(H-21C-111
00
n180 I I I
18 17 16 15 14 1213 11 ppm
Figure A5 Expansion 5 of the 500 MHz HMBC Spectrum of B2
10
(H-12C-14)
15
(H-1 2C-21)
y
20
E ta
25
30 (H-6C-16)
(H-1 2C-1 3)
35
Iii 1 i 1
27 26 23 24 23 22 21 20 ppm
Figure A6 Expansion 6 of the 500 MHz HMBC Spectrum of B2
35
40
45 ---
50 - Si
-55
o 0
60
65
70 - 0
1 I I
r r I rui
I I I r r -1 11-1
40 38 36 34 32 30 28 26 24 22 ppm
Figure A7 Expansion 7 of the 500 MHz HMBC Spectrum of B2
i I 1111111r 29 28 27 25 24 23 22
ppm
Figure A8 Expansion 8 of the 500 MHz HMBC Spectrum of B2
10
15 O (H-3C-191 0
20 (H-7C-204)
E n o
25
30 o
35
57 55 53 51 49 ppm
Figure A9 Expansion 9 of the 500 MHz HMBC Spectrum of B2
r 47
35
40 shy
45 shy
50
55 shyE Q
60
65
70 shy(H-2C-3)
75 shy
53 51 ppm
Figure A10 Expansion 10 of the 500 MHz HMBC Spectrum of B2
(H-2C-22)
Ishy- 3
165
(H-3C-1) ca
170
175
(H-TC11) N
180
57 55 53 51 49 47 ppm
Figure A11 Expansion 11 of the 500 MHz HMBC Spectrum of B2
35 U
40
0
0 0
45
50
7 0
0
55
0 ca
CO (-NHC-21 0
60
65 7
0
C
70
75
93 91 89 87 85
I I
ppm 83
I
81
I
79 77 75
Figure A12 Expansion 12 of the 500 MHz HMBC Spectrum of B2
120
0 0
0
0130 - 0 C) (H-7C-3)
c(H-3C-7)
0
0 00
140
(H-3C-4) (15
CJ
(Chr 8858 8 1368)
(H-6C-2)
(H-6C-4)
150 shy
(H-3C-5) 0 (H-7C-5) (1)
C
C
160
93
Ishy
91
1 1
89 87
-1
85
A 83
ppm 81 79 77 75
Figure A13 Expansion 13 of the 500 MHz HMBC Spectrum of B2
0 0
0 0 0
120
0
0
130
(
(H-3C-7)
H-3C-4)
140
(Chr 8856 8)368)0 0 0
150 shy 0
0
(H-3C-5) 0 o
(Chr 8828 81453)
160 -(-NHC-22) 0Q)
170 -0
(-NHC-11) oo
(H-3C-1)0 0 (H-7C-1)
180 -1
100 I
95 1
90 I
ppm
t 85
(Chr 8828 81766)
80 75
Figure A14 Expansion of the 500 MHz HMBC Spectrum of B2 at 368 K
102
Appendix 2
Crystal and Collection Data for UV16A C26H16N207
103
Table A1 Crystal and Collection Data for UV16A
Emperical Formula
Formula Weight
Crystal Dimensions (mm)
Crystal System
Crystal Color
Habit
No Reflections Used for Unit
Cell Determination (20 range)
Lattice Parameters
a =
b =
c=
cc=
13=
Y=
V =
Space Group
Z Value
Dcalc
Radiation
Temperature
Scan Type
Scan Rate
Scan Width
C26H16N207C2H6OS
54655
023 X 008 X 006
triclinic
orange
needle
18 (2005-2614deg)
9799 (3) A
16243 (4) A
8000(2) A
10213 (2)deg
9463 (2)deg
9794 (2)deg
1225 (1) A3
P-1 (2)
2
1482 gcm3
Mo Ka
23 plusmn degC
co-28
80degmin (in omega)
(15 + 003 tan 0)deg
104
Table A1 Continued
20max 499deg
sineAmax 05436 A-1
Counting Time (background peak) 21
No of Reflections Measured
Total 5788
Unique 2969 (Rim= 0073)
Observed 1336
0041
Rw 0044
Goodness of Fit Indicator 129
Corrections
DIFABS Lorentz and polorization effects
Transmission Factors 081 to 128
Freidel Mates Averaged Yes
ShiftError (max) in Final LS Cycle 00266
Max Peak in Final Diff Map 16664 e-A3
Max Unassinged Peak in Final Diff Map 0166 e-A3
Min Peak in Final Diff Map -0174 e-A3
F(000) 568
Preparative HPLC was of pivotal importance in the separation of
UV16B1 and UV16B2 which differ only in a methylene group Partial structure
of UV16B1 UV16B2 and UV16C Proton and carbon assignments have been
made based on the use of modern 2D-NMR experiments (COSY HMQC
HMBC)
NH2
OH 0 OH
2
Structural and Preliminary Biosynthetic Studies on New Metabolites Produced by
Streptomyces murayamaensis Mutant MC2
Awatef Mandi Hassan
A THESIS
submitted to
Oregon State University
in partial fulfilment of
the requirements for the
degree of
Master of Science
Completed July 15 1994
Commencement date June 1995
APPROVED
Professor of Chemisflji in charge of major
Head of Department of Chemistry
Dean of Grad School
Date thesis is presented July 15 1994
Presented by Awatef Mandi Hassan
Redacted for privacy
This work is dedicated to the memory of
my father Mandi Hassan
He gave me love courage and taught me to work hard and never quit
Acknowledgment
I would like to thank my major advisor Professamp Steven J Gould for
his support and guidance that made this thesis possible During my two years
of research he provided ideas enthusiasm and encouragement will beI
always grateful
Credit for this accomplishment also goes to Dr John Carney His
frequent suggestions and his assistance in obtaining and analyzing data are
greatly appreciated
Special thanks is due to Mr Roger Kohnert for his advice and
assistance with NMR experiments to Mr Chris Melville for X-ray
crystallographic analysis and to Dr Martha Cone for her assistance in culture
preparation and fermentation
I would also like to thank members of Gould group especially Dr
Nuria Tamayo and Dr Tom OHare mostly for their friendship that made my
time in the lab enjoyable and for their constructive suggestions and helpful
criticism of my thesis
Finally I thank my mother my husband and my lovely two kids Fatima
and Hassan for their love patience and support
Table of Contents
1Introduction
1Biological Activity of Polyketide-Derived Natural Products
Kinamycin D Biosynthesis 2
Antibiotic Biosynthesis in S murayamaensis
The Use of Multiply 13C-labeled Precursors in Structure
Molecular Biological Approach 6
and Biosynthetic Studies 10
Rationale for Current Study 12
Results and Discussion 14
Isolation and Characterization of MC2 Metabolites 14
Production and Detection of Phenanthroviridin Aglycone (1) 16
Bioactivity 18
Radioactive and Stable Isotope Feedings 21
UV16A Structural Studies 22
Biogenesis of UV16A 28
UV16B1UV16B2 Structural Studies 30
Biosynthetic Studies of UV16B1 and UV16B2 49
UV16C Structural Studies 57
Conclusion 64
Further Areas of Study 64
Experimental 66
Detection of Phenanthroviridin Aglycone (1) in MC2
Stereochemistry of Threonine Residue in
Homonuclear Correlation Spectroscopy
Heteronuclear Multiple Quantum Coherence
General 66
HPLC Analysis 67
Preparation of Phosphate-Buffered Silica 68
Fermentation of S murayamaensis Mutant MC2 68
Agar Medium Preparation 68
Seed Medium Preparation 68
Production Medium Preparation 69
Isolation and Purification of UV16A Bl B2 and C 70
Crude Cell Extract 71
Purification of UV16A 72
X-ray Chrystalography of UV16A 73
Purification of UV16B1 and UV16B2 73
Reduction of UV16B2 74
Acid Hydrolysis of UV16B1UV16132 Mixture 75
UV16B1 and UV16B2 76
Purification of UV16C 76
Acetylation of UV16C 77
Methylation of UV16C 77
Bioassay 78
Structural Studies 78
(COSY) on AC 300 78
(HMQC) on AC 300 78
Heteronuclear Multiple Bond Connectivity (HMBC) on AC 300 79
Fast Atom Bombardment Mass Spectrometry (FAB) 79
Radioisotope Feeding Studies 79
[U-14C]D-Glucose 79
[U-14C]Glycerol 80
Stable Isotope Feeding Studies 80
[U- 13C6]D- Glucose 80
Bibliography 81
Appendix 1 87
Expansion of The 500 MHz HMBC Spectrum of UV16B2 87
Appendix 2 102
Crystal and Collection Data for UV16A C26H16N207 102
List of Figures
Figure 11 Examples of Biologically Active Polyketides 2
Figure 12 Metabolites Obtained from Cultures of Streptomyces murayamaensis 5
Figure 13 Schematic Representation of Carbon Chains in Which Each Carbon is Enriched with Carbon-13 and Showing the Expected NMR Spin-Coupled Signal Patterns 11
Figure 111 HPLC Analysis of LH-20 Fraction from MC2 17
Figure 112 ORTEP Drawing from Single-Crystal X-ray Structure Determination of UV16A 24
Figure 113 13C NMR Spectrum of 13C Enriched UV16A from [U-13C61D-Glucose Feeding Experiment 26
Figure 114 HPLC Diagram of UV16B1UV16B2 Mixture from Buffered 31Silica Column
Figure 115 1H NMR Spectra of UV16B1 and UV1662 Illustrate the Similarity of the Two Compounds 33
Figure 117 An Enlargement of the 00 30 ppm Region of
Figure 119 The 500 MHz HMBC Spectrum of UV16B2 in
Figure 111 0 Effect of the Reduction on 1H and 13C Chemical
Figure 111 2 The 500 MHz HMBC Spectrum of Reduced
Figure 1113 Carbon-Carbon Connectivities in the
Figure 1114 The 300 MHz 13C-13C COSY Spectrum of 13C Enriched
Figure 116 The 400 MHz 1H-1H COSY Spectrum of UV16B1 in DMF-d7 37
the 400 MHz 1H-1H COSY of UV16B1 in DMF-d7 39
Figure 118 The 500 MHz HMBC Spectrum of UV16B2 in DMF-d7 40
DMF-d7 at 386 K 41
Shifts of UV16B2 Chromophore Part Structure 46
Figure 1111 1H NMR Spectrum of Reduced UV16B2 in DMSO-d6 47
UV16B2 in DMSO-d6 48
Chromophore of UV16B1 and UV1662 53
UV16B1UV16B2 from [U-13C6]D-Glucose Feeding Experiment 54
Figure 1115 The 300 MHz 2D-INADEQUATE Spectrum of 13C Enriched UV16B1UV16B2 from [U-13C6]D-Glucose Feeding Experiment 55
Figure 1116 The 300 MHz 2D-INADEQUATE Spectrum of 13C Enriched UV16B1UV16B2 from [U-13C6]D-Glucose 56
Figure 1117 1H NMR Spectrum of UV16C 58
Figure A1 Expansion 1 of the 500 MHz HMBC Spectrum of B2 88
Figure A2 Expansion 2 of the 500 MHz HMBC Spectrum of B2 89
Figure A3 Expansion 3 of the 500 MHz HMBC Spectrum of B2 90
Figure A4 Expansion 4 of the 500 MHz HMBC Spectrum of B2 91
Figure A5 Expansion 5 of the 500 MHz HMBC Spectrum of B2 92
Figure A6 Expansion 6 of the 500 MHz HMBC Spectrum of B2 93
Figure A7 Expansion 7 of the 500 MHz HMBC Spectrum of B2 94
Figure A8 Expansion 8 of the 500 MHz HMBC Spectrum of B2 95
Figure A9 Expansion 9 of the 500 MHz HMBC Spectrum of B2 96
Figure A10 Expansion 10 of the 500 MHz HMBC Spectrum of B2 97
Figure A11 Expansion 11 of the 500 MHz HMBC Spectrum of B2 98
Figure A12 Expansion 12 of the 500 MHz HMBC Spectrum of B2 99
Figure A13 Expansion 13 of the 500 MHz HMBC Spectrum of B2 100
Figure A14 Expansion of the 500 MHz HMBC Spectrum of B2 at 368 K 101
List of Tables
Table 111 Minimum Inhibitory Concentration of UV16B1UV16B2 19
Table 112 Bioactivity of Different Fractions of MC2 Extract 20
Table 113 NMR Spectral Data of UV16A 25
Table 114 NMR Spectral Data of UV16B1 and UV16B2 34
Table 115 NMR Spectral Data of UV16C 61
Table A1 Crystal and Collection Data for UV16A 103
List of Schemes
Scheme 11 Proposed Pathway of Kinamycin Biosynthesis 4
Scheme 111 Schematic Diagram of the Isolation and
Scheme 112 Phenanthroviridin Aglycone as Possible
Scheme 114 Proposed Biosynthesis of PD116744 23 via
Scheme 12 Biosynthesis of Kinamycins versus Murayaquinone 9
Purification of MC2 Metabolites 15
Shunt Product from Kinamycin Biosynthetic Pathway 18
Scheme 113 Biosynthesis of CAN Unit from Glucose 29
Dehydrorabelomycin 29
Scheme 115 Proposed Biosynthetic Route to Substructure 26 50
Scheme 116 Proposed Biosynthetic Route to 27 and 28 51
Scheme 117 Biosynthesis of Threonine 52
Structural and Preliminary Biosynthetic Studieson New Metabolites Produced by
Streptomyces murayamaensis Mutant MC2
Introduction
Biological Activity of Polyketide-Derived Natural Products
Polyketide-derived compounds abound in both prokaryotes and
eukaryotes where they play an amazing variety of roles They owe their
chemical diversity both to the programming of the polyketide synthase and to
the events occurring after chain assembly such as formation of aromatic ether
or macrolide ring systems addition of moieties such as methyl groups terpene
chains or sugar residues and many others
The polyketide-derived compounds have a very wide spectrum of
bioactivity Adriamycin 3 an anthracycline isolated from Streptomyces
peucetius is clinically used as an antitumor agent2 Oxytetracycline 4 one of
the tetracyclines discovered in 1951 has a broad spectrum of antibiotic activity
Aquayamycin 5 is an active inhibitor of the biosynthesis of noradrenaline and
adrenaline3 Kerriamycin B 6 and C 7 and aggreticin 8 are inhibitors of
platelet aggregation4
The latter antibiotics 5-8 belong to the angucycline group which is
comprised of more than one hundred secondary metabolites of microbial origin
The name angucycline or angucyclinone refers to the characteristic four-ring
frame of the aglycone moiety which is assembled in an angular manner5
2
H3C0 0 OH 0
C H3
H 3C OH OH N(CH3)2
OHO
SOO HO
OH 0 OH 0 0
NH2
OH
3 4
5 R1 =R2 =H 6 R1 =AR2=B 7 Ri = H R2 =A 8 RI = R2= A
OH 0
H3CFCV H3C
H3C
OH HHOOO
A
Figure 11 Examples of Biologically Active Polyketides
Kinamycin D Biosynthesis
Kinamycin A B C and D 9a-d isolated from Streptomyces
murayamaensis possess modest antitumor properties and antibiotic activity
against Gram- positive organisms They were originally characterized by Omura
and co-workers6-8 as benzo[b]carbazoles on the basis of chemical
3
spectroscopic and X-ray crystallographic data9 The structures recently have
been revised as the diazo-substituted benzo[b]fluorenes shown1011
9a Rj = R2= R3 = Ac R4 = H
9b R2=AcR1 =R3= R4=H
9c Ri =R3=R4=AcR2=H
9d R1=R3=AcR2=R4=H
Kinamycins are derived from acetate apparently through a decaketide
10 which transforms to the benz[a]anthraquinone 1112-14 Metabolism of
dehydrorabelomycin 11 to a quinone 12 followed by reduction to the
hydroquinone 13 and a biological Friedel-Crafts cyclization would yield the
fluorene system of the kinamycins (Scheme 11)
4
CH3COCoA ---1shy
0 0 0 10 11
C H3
OH 0
12
-CO2 [0]
HO0 C H3 KinamycinsMO
OH 0
18
Scheme 11 Proposed Pathway of Kinamycin Biosynthesis
Studying the kinamycin biosynthetic pathway has been targeted in many
ways One strategy involved isolation and characterization of metabolites
related to the kinamycins from fermentation broths of Streptomyces
murayamaensis This type of strategy has been shown to be quite successful in
biosynthetic studies of secondary metabolites1516 By changing the
fermentation conditions (temperature media and time) different metabolites
may accumulate In the kinamycin studies this led to the characterization of a
5
number of putative intermediates (prekinamycin 14 ketoanhydrokinamycin
15 kinamycin E 16 and kinamycin F 17)1718
HO
H3 CH3
14
H 0 R20
0 H3
16 Ri=H R2=Ac 17 R1 =H R2=HSO
OH
r OH 0
Figure L2 Metabolites Obtained from Cultures of Streptomyces murayamaensis
Secondly a strategy of biosynthetic feeding studies of putative
intermediates has also been employed So far dehydrorabelomycin 1114 and
kinobscurenone 1819 have been incorporated into 9 The insolubility of
prekinamycin 14 the impermeability of the cells or both presumably have
prevented its incorporation into 9
A third approach used successfully in the past to study the biosynthesis
of many microbial products including polyketide antibiotics was the
development of blocked mutant strains20 Isolation and structure determination
of some compounds produced by S coelicolor mutant strains for example had
led to the proposal of a reasonable pathway to the antibiotic actinorhodin21 S
murayamaensis blocked mutants were developed with two kinds of
mutagenesis nitrosoguanidine and germicidal UV light Kinafluorenone 19
6
the first recognized biosynthetically-derived benzo[b]fluorenone was isolated
from a mutant strain of S murayamaensis (MC1) blocked in the biosynthesis of
kinamycins22 Strain MC1 was isolated from amongst survivors of mutagenesis
of a wild type spore suspension with nitrosoguanidine
HO
OH
00 OHHC3
19
Antibiotic Biosynthesis in S murayamaensis - Molecular BiologicalApproach
Rapid progress in molecular genetic studies of Streptomyces now affords
basic information on the organization and regulation of genes concerned with
antibiotic biosynthesis in these organisms An important feature in
streptomycetes is that genes for the various steps of polyketide biosynthesis
show marked tendency to clustering2023 This is also true of genes for the
biosynthesis of antibiotics of other chemical classes This greatly facilitates the
isolation and characterization of all the biosynthetic genes on a pathway once
a strategy is available to identify just one In the case of antibiotic production
one or more resistance genes must also be expressed in order to protect the
host cell from the biological effects of its own antibiotics and this is usually
closely linked to the biosynthetic structural genes24
macrolides aminoglycosides and modified peptide antibiotics all have been
cloned in the past decade Some of these have been cloned by selection for
resistance genes and searching for contiguous biosynthesis genes whereas
others have been cloned by complementation of blocked mutants More
recently several antibiotic biosynthesis genes and gene clusters have been
cloned using heterologous probes to hybridize and isolate predicted genes
encoding steps in the pathway of interest2526
act III (a gene that encodes the actinorhodin polyketide ketoreductase of
S coelicolor) and gra ORF1 (a gene that encodes the granaticin ketoacyl
synthase of S vioaceorber Yu 22)27 probes were used to screen a genomic
library of S murayamaensis (constructed in bacteriophage EMBL4 and cloned
into E coh) and seven gene clusters positively hybridized with the DNA probes
act III and act III like genes encode reductases that reduce the 13-keto group
which is located nine carbons from the carboxyl end of the assembled
polyketide chain Since the synthesis of the polyketide chain begins at the
methyl terminus this hypothesis would suggest that the enzyme measures the
assembeled polyketide and reduces the proper keto group prior to ring closure
The reduction occurs at a carbon which is part of the first ring formed during the
biosynthesis and may be a prerequisite for efficient folding of the polyketide
chain2526
Interestingly an o-phenanthraquinone metabolite murayaquinone 20
has also been isolated from kinamycin producing cultures of S
murayamaensis28 This raises a question of whether it is produced by different
polyketide synthase or by an alternative folding of the same decaketide
precursor leading to the kinamycin skeleton
8
OH
20
As shown in Scheme 12 in the biosynthesis of murayaquinone the
nascent decaketide chain should be reduced at positions 11 and 15 or 7 and 11
depending on the direction of the polyketide chain folding while the precursor
chain of the kinamycins needs to be reduced at position 9 This suggests that
murayaquinone biosynthesis requires a different set of enzymes from that
required for the biosynthesis of kinamycins Hence the products of two different
polyketide pathways in S murayamaensis are known and the seven gene
clusters suggested more may exist
9
1 AcetylCoA starter unit + 9 MalonylCoA
1 AcetylCoA starter unit + MaionylCok
C001-4 or
HOOC
HO g
0 COOH
0
OH OH
0 HOOC
OH 0 OH
101
OH
CH3 [0]
OH
Kinamycins
OH 0
18
Scheme 12 Biosynthesis of Kinamycins versus Murayaquinone
10
The Use of Multiply 13C-labeled Precursors in Structure and Biosynthesis Studies
Feeding of precursors multiply labeled with carbon-13 has been used
to investigate complex biosynthetic problems [12-13C2]Acetate has been
extensively used to study terpenoid and polyketide metabolism29-31 This
powerful method derives from the simple principle that two adjacent carbons
simultaneously enriched in carbon-13 give rise to a pair of new coupled signals
in the corresponding 13C NMR spectrum These coupled pairs appear as
satellites about the natural abundance carbon signal producing an easily
recognized trio of resonances Any intervening process which breaks an intact
130-130 bond results instead in a simple enrichment of the appropriate sites in
the resulting metabolite and a corresponding enhancement of the relevant
natural abundance signals
Cane et al32 used a variation of the doubly labeled acetate technique
in which uniformly 13C-labeled glucose ([U-13C6]glucose) was used as in vivo
precursor of [12-13C2]acetyl CoA leading to the demonstration of the
mevalonoid origin of pentalenolactone and its precursor pentalenic acid by
interpretation of the 13C NMR spectra Logically this methodology should be
applicable to the study of additional product metabolism The presence of a
chain of three labeled carbon atoms derived intact from glucose should yield a
characteristic pattern consisting of two trios corresponding to each end of the
chain and a quintet resulting from the central carbon atom The quintet would
arise from the superposition of a triplet corresponding to those species in which
both neighboring carbons are labeled and a doublet resulting from those
species in which either one or the other of the adjacent carbons is enriched with
130 because the glucose enrichment was 80 The predicted quintet pattern is
11
based on the assumption that J AB J Bc Similarly a four-carbon unit could be
recognized by the resulting pattern of trio-quintet-quintet-trio Each of these
various coupling relationships illustrated schematically in Figure 13 is easily
recognized by the characteristic coupling constants and should be directly
verifiable by the appropriate homonuclear 13C-13C decoupling experiments
(A) (B) (C)
Figure I3 Schematic Representation of Carbon Chain in Which Each Carbon is Enriched with Carbon-13 and Showing the Expected NMR Spin-Coupled Signal Patterns (A) A two-carbon unit (B) a three-carbon unit (C) a four-carbon unit
The utility of such an approach was applied for shikimic acid derived
metabolites Shikimic acid the apparent precursor of numerous families of
natural products is known to be derived from glucose by the combination of an
intact four-carbon unit erythrose-4-phosphate and an intact three-carbon unit
phosphoenol pyruvate Studies of the biosynthesis of shikimate derived
metabolites using singly labeled samples of glucose were difficult to interpret
because of the competition between alternative metabolic pathways which
result in indirect labeling of numerous additional sites in the derived
metabolites33-34 The utilization of [U-13C6]glucose is effectively transparent to
the scrambling processes while remaining opaque to the direct incorporation of
intact biosynthetic units regardless of the manner of their derivation from
12
glucose Rinehart et al had reported the use of [U-13C6]glucose to confirm the
shikimate origin of the C7N unit of pactamycin and used homonuclear
decoupling to confirm the observed labeling patterns35 Gould and Cane had
reported the use of [U-13C6]glucose in the biosynthesis of streptonigrin36
Rationale for Current Study
Previous studies on the kinamycin biosynthetic pathway in S
murayamaensis involved isolation and characterization of some intermediates
obtained by manipulation of the fermentation conditions Developing S
murayamaensis mutant strains led to the characterization of kinafluorenone 19
from mutant strain MC1 Prekinamycin the first compound with the 5shy
diazobenzo[b]fluorene skeleton in the biosynthesis pathway of KD was
overproduced by a mutant strain MC4 Another mutant strain (MC2) isolated
from amongst the survivors of germicidal UV light treatment of a spore
suspension of the wild type strain has no detectable antibiotic activity3 7
Screening the strain in five different production media yielded no evidence of
kinamycin production Colonies of strain MC2 are very dark on soybean-
glucose agar and green in soybeanglucose liquid seed medium whereas the
wild type is dark brown in both instances
TLC analysis of the strain grown in oatmeal or glycerol-asparagine
media initially yielded no detectable production of kinamycin or
murayaquinone although during the course of present study it was discovered
that kinamycin is produced by the mutant after 8 days in oat meal production
medium in very minor quantities HPLC analysis of the ethyl acetate extract of
13
the strain grown on glycerol-asparagine revealed that it produces
kinafluorenone38
The objective of this study was to characterize new metabolites
produced by this mutant strain and to initiate a preliminary study of their
biosynthetic origin To discover unusual new metabolites from microbial
sources either biological or chemical screening was applied Since we were
expecting intermediates or some other metabolites of unknown biological
activity chemical screening using TLC and HPLC with a UV detector was used
to look for new metabolites produced by the mutant
In comparison with the wild type strain MC2 makes a number of new
metabolites in a wheat medium four of which were targeted for this study
(1) A metabolite with UV spectrum very similar to ketoanhydrokinamycin (260
304 420 nm) called metabolite UV16A
(2) Two non polar metabolites having a 402-404 nm chromophore (215 256
406 nm) called UV16B1 and UV16B2
(3) A more polar metabolite with UV max at 252 320 380 nm called UV16C
Development of isolation and purification procedures for each of these
compounds was the early focus in this study Following the isolation and
purification of the new metabolites structural studies of these compounds by
modern high field NMR techniques such as 2D NMR and other spectroscopic
methods was the immediate objective Since the use of the 13C-multiply
labeled precursors makes simultaneous determination of structure and
biosynthesis possible where classical methods could not provide unequivocal
answers the last part of this study was focused on feeding uniformly 13Cshy
labeled glucose and characterizing the 13C-enriched metabolites by the
appropriate NMR techniques
14
Results and Discussion
Isolation and Characterization of MC2 Metabolites
The 7 wheat 2 trace metals production medium was chosen to
grow the mutant since it showed the best production of the new metabolites
The colored metabolites were obtained from mycelium by extraction with
acetone Initial attempts to purify the colored metabolites by flash
chromatography on Silicar CC-4 did not result in good separation and the
Silicar retained the material very strongly Other portions of the mycelium
extract were chromatographed on Sephadex LH-20 and phosphate buffered
(pH 7) flash grade silica gel and eluted with increasing concentrations of
methanol in dichloromethane Both were capable of separating UV16A from
UV16B1UV16B2 The buffered silica had the advantages of tolerating more
material compared to the same size column of LH-20 and by the speed of flash
chromatography over gravity LH-20 chromatography The isolation and the
purification of the different metabolites is outlined in Scheme 111
15
Fermentation
Adjust to pH 28 and centrifuge
Sonicate cells extract in Discard broth acetone and filter over Celite
1
Discard cell mass Filtrate
Extract in EtOAc
EtOAc layer Discard aqueous
trituration with petroleum ether
Non polar oils
fractions enriched in UV16A
Sephadex LH2O column
Pure UV16A
Crude extract
IBuffered silica column chromatography
B1 B2 mixture
Preparative HPLC (C-18)
Pure B1 and Pure B2
1
Fractions enriched in UV16C
Flash C-18 column
Pure UV16C
Scheme 111 Schematic Diagram of the Isolation and Purification of MC2 Metabolites
16
Production and Detection of Phenanthroviridin Aglycone (1)
In an attempt to find a good chromatographic system to separate MC2
metabolites prior to the development of the above purification scheme crude
extract from MC2 cells (from a 43 L fermentation culture) was chromatographed
on a column of Silicar CC-4 and colored materials were eluted with increasing
proportions of EtOAc in dichloromethane (DCM) Fractions containing UV16A
as the major component (170 mg) were further purified on a column of buffered
silica gel yielding 24 mg of material in the fraction most enriched in UV16A A
portion (5 mg) was further chromatographed on Sephadex LH-20 in toluene-
methanol (91) One of the fractions (1 mg) was dissolved in methanolshy
dichloromethane (91) and analyzed by diode array HPLC (Figure 111a) One
of the minor metabolites in the fraction eluting at 196 min exactly matched the
retention time and the UVvis absorption spectrum of authentic
phenanthroviridin aglycone (Figure Ili b) Co-injection with the authentic
materia13940 gave a symmetrical enhancement of the peak with an unchanged
UVNis spectrum Further confirmation of the identity of the peak assigned to 1
was provided by thermospray (TSP) liquid chromatography mass spectrometry
(LCMS) both an authentic sample of 1 and the new metabolite had identical
retention times and gave an M- ion at mz 3051
17
1
03
A
012
B F2 008
0 0lt 004
200 300 400 500 600
Wavelength
16 18 20 22
Time min
Figure 111 HPLC Analysis of LH-20 Fraction from MC2 A Chromatogram of LH-20 fraction B UVNis absorption spectrum of the component eluting at 1956 min overlaid with spectrum of authentic 1
Phenanthroviridin aglycone was predicted to be a possible
intermediate 22 in the kinamycin pathway before the structure revision has been
done Subsequently four naturally-occuring benzo[b]phenanthridines have
been isolated from two different Streptomyces including 1 and the
jadomycins4142 The quinone 10 in the kinamycin biosynthetic pathway could
18
readily lead to the benzo[b]phenanthridines via nitrogen addition and
decarboxylation1
CH3
OH o OH 0
10 1
Scheme 112 Phenanthroviridin Aglycone as Possible Shunt Product from Kinamycin Biosynthetic Pathway
Bioactivity
The UV16B1UV16B2 mixture had some antibiotic activity against
Gram-positive bacteria which are more sensitive than Gram-negative The
minimum inhibitory concentrations of UV16B1UV16B2 against a group of
selected bacteria are listed in Table 111 UV16B1UV16B2 UV16A and
UV16C exhibit no significant activity against yeast or mold
19
Table 111 Minimum Inhibitory Concentration of UV16B1UV16B2 (11gmL)
Test microorganism MIC
Escherichia coil ATCC 10536 gt128
Serratia Marcescens ATCC 13880 128
Pseudomonas aerufinosa ATCC 25619 128
Klebsiella pnumonias AAD 128
Bacillus subtilis ATCC 6633 16
Staphylococcus aureus ATCC 25923 64
Streptococcus faecalis ATCC 29212 64
Micrococcus luteus ATCC 9341 1
Bioactivity of different fractions from a buffered silica column was tested
in the laboratory of Dr M Daeschel (Food Science-OSU) and the results are
presented in Table 112 Five mg of samples (1-4 nonpolar fractions UV16C
very polar fractions UV16A respectively) were dissolved in 1 mL of DMSO and
paper disks (14 inch diameter) were impregnated with 20 pL Number 5 was
prepared by partially dissolving -11 mg of UV16B1UV16B2 mg in 1 mL of 91
DCM- methanol and the disk was prepared by adding 15 IL of the suspension
while disk 6 was prepared by adding 15 tiL of UV16 broth and 7 was a DMSO
control UV16A UV16B1UV16B2 and UV16C did not show pronounced
activity toward bacteria yeast or fungi However the nonpolar fraction of the
fermentation crude extract has very high activity against fungi
20
Table 112 Bioactivity of Different Fractions of MC2 Extract
Gram positive bacteria 1 2 3 4 5 6 7
Lactobacilus plantarum 31
Pediococcus pentosaceus FBB-61 -
Streptococcus faecalis 34
Leuconostoc mesenteroides 47
Staphilococcus aureus 609 ++
Bacillus subtilis 614 +shy + +-
Listeria monocitogenes 630 +1shy
Gram negative bacteria
Klebsiella pneumonie 601 + +
Escherichia coli 13604
Enterobacter aerogenes 605
Pseudomonas aeruginosa 603 +shy +-
Pseudomonas flourescense 602
Salmonella typhimirum 616
Yeast
1003
1009 +++ ++ ++
1011 +++ -
1023 +++ + + +shy
1024 +++
1025 +++ ++ ++ +shy
1026 +++ -
21
Table 112 Continued
Fungi
MP-2 +++ shy
MP-3 +- +shy
MP-4 +shy
MP-6 ++
MP-7 +++ shy
MP-13 ++
+++ extremely large inhibition but not complete ++ or + not complete inhibition
Radioactive and Stable Isotope Feedings
To prepare for a 13C-feeding the incorporation of glucose or glycerol as
a carbon source was tested [U- 14C]D- Glucose and [U-14C]glycerol were fed to
separate cultures of MC2 at 24 48and 72 h after the inoculation of the
production media The addition of both labeled glucose and glycerol was
accompanied with 1 g of unlabeled compound to observe the effect on the
production of the target metabolites The addition of both compounds
decreased the production of UV16A and UV16B1UV16B2 while it did not affect
the production of UV16C The incorporation of 14C from either glucose or
glycerol in various metabolites was similar 008 - 012 in UV16B1UV16B2
and 011 - 017 in UV16C Glucose was chosen over glycerol for the stable
22
isotope feeding experiment because it has the advantage of showing longer
units
[U-13C6]D-Glucose was fed along with [U-14C]D-Glucose to one liter of
MC2 cultures using the same feeding strategy used for the radioactive feeding
The crude extract (298 mg) was chromatographed by the usual method
Buffered silica chromatography yielded 175 mg of pure UV16B1UV16B2
mixture with 0048 14C incorporation The incorporation of the radioactive
label in UV16A was 0013 However since the mass of this metabolite was
only 16 mg the 13C NMR spectrum showed a highly 13C enriched sample On
the other hand UV16C had a 0034 incorporation but due to high amount
(116 mg) produced the level of 13C enrichment shown in the 13C NMR spectrum
was low
UV16A Structural Studies
UV16A was separated from a minor green metabolite having similar Rf
on silica gel TLC by chromatographing the fraction enriched in UV16A on a
Sephadex LH-20 column and eluting with dichloromethane- methanol (11)
The infrared spectrum of the pure UV16A with strong absorption at 1629 1669
cm-1 representing quinone carbonyl stretches was not surprising since its
UVNis spectrum resembles that of ketoanhydrokinamycin 15 Indeed
examination of proton NMR spectrum of UV16A (Table II3) revealed the
pattern typical of the three adjacent hydrogens in the A ring of the kinamycin
skeleton [8 737 (1H d J = 86 Hz) 781 (1H t J = 82 Hz) 754 (1H d J= 72
Hz)]
23
A 1H-1H COSY spectrum revealed another AMX spin system at 6 71
(1H d J=84 Hz) 785 (1H dd J= 84 20 Hz) 808 (1H d J= 20 Hz) Single
frequency decoupling provided confirmation of this analysis From an HMQC
experiment it was deduced that two doublets at 8 315 and 390 represent
diastereotopic methylene protons that show geminal coupling of 13 Hz From
the above data part structures 21 and 22 were defined
710 H
781
737
OH 0 H 808
21 22
These two part structures left unassigned signals for one methyl at 8
13 the diastereotopic methylene one aromatic and one exchangable proton
at 8 800 There was also a very broad hump in the region of 11-12 ppm that
was not accounted for Due to the poor solubility of UV16A a decent natural
abundance 13C NMR spectrum was never obtained Some of the 13C chemical
shifts were observed indirectly through HMBC and HMQC NMR experiments
The results will be discussed later
The solubility of the UV16A metabolite was so low that a small sample
of - 2 mg would precipitate in 05 mL of DMSO at 323 K in the NMR tube as light
orange needles To modify the quality of the crystal a super-saturated solution
(- 2 mg of material in 05 mL of DMSO heated to - 90 degC) was slowly cooled
over a 48 h period in a low-form Dewar flask filled with hot water The collected
crystals were suitable for X-ray diffraction A single crystal X-ray diffraction
24
analysis provided the total structure 2 The ORTEP plot is shown in Figure
112
NH2
OH 0 OH
2
(1
CS U -----Ai 4 100 11v- 4
00---5- shyNor -fir0--
II
e
Figure 112 ORTEP Drawing from Single-Crystal X-ray Structure Determination of UV16A Hydrogens have been omitted for clarity
25
Table 113 NMR Spectral Data of UV16A
1H 13CNo Jcc (Hz)
1 1926 C 527
2 (315 39) 2H d J= 13Hz 515 CH2
3 743 C 375
4 1571 C 557
4a C
5 81 1H s 1175 CH 686
6 1625 C 702
6a C
7 1900 C 557
7a 1159 C 650
8 1607 C 646
9 737 1H d J= 86 Hz 1240 CH 570
10 781 1H t J= 82 Hz 1376 CH 569
11 754 1H d J= 72 Hz 1187 CH 614
11a 1350 C 612
12 1826 C 532
12a C
12b C
13 13 3H s 207 CH3 375 1 1667 C
2 1290 C
3 808 1H d J= 20 Hz 1270 CH 4 1320 C
5 1480 C 6 710 1H d J= 84 Hz 1163 CH
7 785 1H dd J= 84 20 Hz 1314 CH
1-NH2 800 2H br exchangable
6 -OH 11-12 br exchangable
8 -OH 11-12 br exchangable
The enrichment is very low and Jcc could not be measured 13C chemical shift could not be identified by HMBC experiment
The HMQC data were collected using the following acquisition
parameters DO = 3 ps D1 = 20 s SI1 = 512 word SI2 = 2048 word The data
were acquired in 192 experiments of 96 scans each
79
0Heteronuciear Multiple Bond on AC
This data set was collected using the following parameters DO = 3 gs D1
= 20 s D2 = 33 ms S1 = OH D4 = 005 s SI1 = 512 word SI2 = 2048 word
The data was acquired in 128 experiments of 176 scans each
Fast Atom Bombardment Mass Spectrometry (FAB)
Samples of A UV16B1 or UV16B2 were dissolved in 3-nitrobenzyl
alcohol matrix Sample ion fragments were generated by FAB source
generated from Ze gas 8 keV
Radioisotope Feeding Studies
fkl14-C1D-Glucose
A 25 mL aqueous solution of D- [U- 14C]glucose (429 X 107 dpm sp act=
10-15 mCi mmol-1) was fed to 5 - 200 mL cultures in 3 pulses 24 h apart 10 mL
of the labeled glucose solution was sterile filtered into 24 h cultures 75 mL of
the same solution was subsequentely administered via sterile filter at 48 and 72
h Each time the same volume of 4 unlabeled D-Glucose solution was added
to the cultures The 8 day cultures were harvested to give -900 mg of crude
extract Subsequent purification of 1618 mg of the crude extract on buffered
silica column yielded a 49 mg fraction containing UV16A UV16B1 and
UV16B2 which retained 0014 of the fed radioactivity Further purification of
80
the UV16C containing fraction on a C-18 column yielded 70 mg of pure UV16C
which retained 002 of the fed radioactivity
at14C)Glycerol
The above procedure was used to feed [U-14C]Glycerol (443 X 107 dpm
sp act = 5 - 10 mCi mmol-1) along with 1 g of unlabeled glycerol to 5 - 200 mL
cultures The 8 day cultures were harvested to give 755 mg of crude extract
Purification of 100 mg of the crude extract yielded 33 mg of UV16B1UV16B2
mixture which retained 0016 of the fed radioactivity
Stable Isotope Feeding Studies
e
Fermentation conditions for this experiment were identical to those
outlined above Feedings were administered to 5-200 mL cultures contained in
1 L Erlenmeyer flasks One gram of [U- 13C6JD- Glucose (98+ enriched) was
dissolved in 25 mL of Milli-Q water and administered as 75 75 and 10 mL at
24 48 and 72 h after inoculation respectively Simultaneously a total of 427 X
107 dpm of [U-74CJD-Glucose was fed in the same volumes The 7 day cultures
were harvested and subsequent purification yielded 175 mg of a
UV16B1UV16B2 mixture 16 mg of UV16A and 116 mg of UV16C
81
Bibliography
1 Cone M C Hassan A M Gore M P Gould SJ Borders D B Alluri M R Detection of Phenanthroviridin Aglycone in a UV-Mutant of Streptomyces murayamaensis J Org Chem 1994 59 1923-1924
2 Arcamone F Franceschi G Penco S Adriamycin(14-Hydroxyshydaunomycin) A Novel Antitumor Antibiotic Tetrahedron Lett 1969 1007-1010
3 Ayukawa S Umezawa H Inhibition of Dopamine 13 - Hydroxylase by Aquayamycin J Antibiot 1968 21 354-357
4 Omura S Nakagawa A Fukamachi N Miura S Takahashi Y Komiyama K Kobayashi B OM-4842 A New Platelet Aggregation Inhibitor from Streptomyces J Antibiot 1988 812-813
5 Roher J Theiricke R Anglucycline Group Antibiotic Natural Product Reports 1992 9 103-137
6 Ito S Matsuya T Omura S Otani M Nakagawa H Takeshima H lwai Y Ohtani M Hata T A New Antibiotic Kinamycin J Antibiotics 1970 23 315-317
7 HataT Omura S Iwai Y Nakagawa A Otani M Ito S Masuya T A new antibiotic Kinamycin Fermentation Isolation Purification and Properties J Antibiot 1971 24 353-359
8 Omura S Nakagawa A Yamada H Hata T Furusaki A Watanabe T Structure and Biological Properties of Kinamycin A B C D Chem Pharm Bull 1973 21 931-940
9 Furusaki A Matsui M Watanabe T Omura S Nakagawa A Hata T The Crystal and Molecular Structure of Kinamycin C p -Brompbenzoate Isr J Chem 1972 10 173-187
10 Gould S J Tamayo N Melville C R Cone M C Revised Structure for the Kinamycin Antibiotics 5-Diazobenzo[b]fluorenes Rather Than
82
Benzo[b]carbazole Cyanamides J Am Chem Soc 1994 116 2207shy2208
11 Mithani S Weeratunga G Taylor N J Dmitrienko G I The Kinamycins are Diazofluorenes and not Cyanocarbazoles J Am Chem Soc 1994 116 2209-2210
12 Sato Y Gould S J Bioaynthesis of Kinamycin D Incorporation of [ 12shy13C] Acetate and of [ 2-2H3 1-13C] Acetate Tetrahedron Lett 1985 26 4023-4026
13 Sato Y Gould S J Bioaynthesis of Kinamycin Antibiotics by Streptomyces murayamaensis Determination of the Origin of Carbon Hydrogen and Oxygen Atoms by 13C NMR Spectroscopy J Am Chem Soc 1986 108 4625- 4631
14 Seaton P J Gould S J Kinamycin Biosynthesis Derivation byExcision of an Acetate Unit from a Single- Chain Decaketide Intermediate J Am Chem Soc 1987 109 5282
15 Verrall M S Discovery and Isolation of Microbial Products Ellis Norwood London 1985
16 Luckner M Secondary Metabolism in Microorganisms Plants and Animals 2nd Edition Spronger-Verlag Berlin 1984
17 Cone M C Seaton P J Halley K A Gould S J New Products Related to Kinamycin from Streptomyces murayamaensis I Taxonomy Production Isolation and Biological Properties Antibiot 1989 42 179shy188
18 Seaton P J Gould S J New Natural Products Related to Kinamycin from Streptomyces murayamaensis II Structure of Prekinamycin Ketoanhydrokinamycin and Kinamycin E and F J Antibiot 1989 42 189- 197
19 Melville C R unpublished results
83
20 Hopwood D A Sherman D H Molecular Genetics of Polyketides and its Comparison to Fatty Acid Biosynthesis Ann Rev Genet 1990 24 37-66
21 Rudd B A M Hopwood D A J Gen Microbiol 1979 114 35
22 Cone M C Melville C R Gore M P Gould S J Kinafluorenone a Benz[b]fluorenone Isolated from the Kinamycin Producer Streptomyces murayamaensis J Org Chem 1993 58 1058-1061
23 Hopwood D A 1986 Cloning and Analysis of Antibiotic Biosynthetic Genes in Streptomyces In Biological Biochemical and Biomedical Aspects of Actinomycetes ed G Szabo S biro M Good Fellow pp 3shy14 Budapest Akademiai kiado
24 Robinson J A Enzymes of Secondary Metabolism in Microorganism Chem Soc Review 1988 17 416-418
25 Strohl W R Bartel P L Li Y Connors N C Woodman R H Expression of Polyketide Biosynthesis and Regulatory Genes in Heterologous Streptomycetes J Ind Microb 1991 7 163-174
26 Bar let P L Zhu C Lampel J S Dosch D C Connors N C Strohl W R BealeJr J M Floss H G Biosynthesis of Anthraquinone by Interspesies Cloning of Actinorhodin Biosynthesis Genes in Streptomycetes Clarification of Actinorhodin Gene Functions J Bact 1990 172 4816- 4826
27 Sherman D H Malpartida F Bibb M J Kieser H M Bibb M J Hopwood D A Structure and deduced function of the granaticinproducing polyketide synthase gene cluster of Streptomyces violaceoruber Tu22 EMBO 1989 8 2717-2725
28 Sato Y Kohnert R Gould S J Application of Long Range 1H13C Heteronuclear Correlation Spectroscopy (LR HETCOSY) to Structure Elucidation The structure of Murayaquinone Tetrahedron Lett 1986 27 143
29 Tanabe M Suzuki KDetection of C-C Bond Fission during the Biosynthesis of the Fungal Triprenyl phenol Ascochlorin using [12shy13C]Acetate J Chem SocChem Commun 1974 445-446
84
30 McInnes A G Smith D G Walter J A Vining L C Wright J L C New Techniques Biosynthetic Studies using 13C Nuclear Magnetic Resonance Spectroscopy The Biosynthesis of Tenellin Enriched from Singly and Doubly LabelledPrecursor J Chem SocChem Commun 1974 282
31 Seto H Sato T Yonehara H Utilization of Carbon-13-Carbon-13 Coupling in Structural and Biosynthetic Studies An Alternate Double Labeling Method J Am Chem Soc 1973 95 8461
32 Cane D E Rossi T Tillman A M Pachlatko J P Stereochemical Studies of Isoprenoid Biosynthesis Biosynthesis of Pentalenolactone from [U- 13C6]Glucose and [6- 2H2]Glucose J Am Chem Soc 1981 103 1838
33 Hornemann U Kehrer J P Eggert J H Pyruvic Acid and D-Glucose as Precursors in Mitomycin Biosynthesis by Streptomyces verticillatus J Chem Soc Chem Commun 1974 1045-1046
34 Haber A Johnson R D Rinehart K L Jr Biosynthetic Origin of the C2 Unit of Geldanamycin and Distribution of Label from D[6-13Cplucose J Am Chem Soc 1977 99 3541-3544
35 Rinehart K L Jr Potgieter M Delaware D L Seto H Direct Evidence from Multiple 13C Labeling and Homonuclear Decoupling for the Labeling Pattern by Glucose of the m-Aminobenzoyl (CAN) Unit of Pactamycin J Am Chem Soc 1981 103 2099-2102
36 Gould S J Cane D E Biosynthesis of Streptonigrin from [U- 13C6] -D-Glucose Origin of the Quinoline Quinone J Am Chem Soc 1982 104 343-346
37 Cone M C Research Report Culture Techniques for Streptomyces murayamaensis Screening of S murayamaensis UV and NTG Survivors 389
38 Cone M C Research Report Metabolites of Streptomyces murayamaensis Strain UV16 292
39 Gore M P Gould S J Weller D D Synthesis of Putative Intermediates in the Biosynthesis of the Kinamycin Antibiotics Total Synthesis of
85
Phenanthroviridin Aglycone and Related Compounds J Org Chem 1992 57 2774-2783
40 Gore M P Gould S J Weller D D Total Synthesis of Phenanthroviridin Aglycone The First Naturally Occurring Benzo[b]phenanthridine J Org Chem 1991 56 2289-2291
41 Ayer S W McInnes A G Thibault P Walter J A Doull J L Parnell T Vining L CJadomycin a Novel 8H-Benz[b]oxazolo[32shytjphenanthoviridine Antibiotic from Steptomyces venezuelae ISP5230 Tetrahedron Lett 1991 32 6301-6304
42 Doull J L Ayer S W Singh A K Thibault P Production of A Novel Polyketide AntibioticJadomycin B By Streptomyces venezuelae Following Heat Shock J Antibiot 1993 46 869-871
43 French JC at Warner - Lambert Company Unpublished results
44 Mathews C K van Hold K E Biochemistry The BenjaminCummings Publishing Company 1990 pp 730-731
45 Claydon N Frederick G Metabolic Products of Entomophthora virulenta J Chem Soc Perkin Trans I 1978 171-173
46 Jaime C Ortuno R M Font J Di- and Trisubstituted y-Lactones Conformational Study by Molecular Mechanics Calculations and Coupling Constant Analysis J Org Chem 1986 51 3946-3951
47 Sakai R PhD Thesis University of Illinois Urbana 1991 106-118
48 Hornemann U Personal Communications
49 Molecular Structure Corporation TEXSAN 1988 MSC 3200A Research Forest Drive The Woodlands TX 77381
50 CarneyJ work done at University of Illinois
86
51 Sahm D F Washington J A H Antibacterial Susceptibility Tests Dilution Methods In Manual of Clinical Microbiology 5th ed Ballows AHausler W J Jr HermannK L lsenburg H D Eds Am Soc for Microbiology Washington D C 1991 pp 1105-1116
87
Appendix 1
Expansions of 500 MHz HMBC Spectrum of UV16B2
Figure A1 Expansion 1 of the 500 MHz HMBC Spectrum of B2
40
(H3-1 4C-1 2)4_
50 o
E 60
Q WINSIZZNer $
E a
10 o
80
I
10 095 09 ppm
085
I
08 075 07
Figure A2 Expansion 2 of the 500 MHz HMBC Spectrum of B2
F 1111111111-ill-It 17 16 13 14 13 12 11
ppm
Figure A3 Expansion 3 of the 500 MHz HMBC Spectrum of B2
EF
-40 Z=M (H2-13C-12)
O lt7
30
O (H3-19C-2) C011
60 - cq
Cz)
I I I I I 1 I 1II II 17 16 15 14
ppm
Figure A4 Expansion 4 of the 500 MHz HMBC Spectrum of B2
0
0
- 3 165 shy
00 0 00 -
0 170
_-shy41111 _-------- -
175 shy(H-21C-111
00
n180 I I I
18 17 16 15 14 1213 11 ppm
Figure A5 Expansion 5 of the 500 MHz HMBC Spectrum of B2
10
(H-12C-14)
15
(H-1 2C-21)
y
20
E ta
25
30 (H-6C-16)
(H-1 2C-1 3)
35
Iii 1 i 1
27 26 23 24 23 22 21 20 ppm
Figure A6 Expansion 6 of the 500 MHz HMBC Spectrum of B2
35
40
45 ---
50 - Si
-55
o 0
60
65
70 - 0
1 I I
r r I rui
I I I r r -1 11-1
40 38 36 34 32 30 28 26 24 22 ppm
Figure A7 Expansion 7 of the 500 MHz HMBC Spectrum of B2
i I 1111111r 29 28 27 25 24 23 22
ppm
Figure A8 Expansion 8 of the 500 MHz HMBC Spectrum of B2
10
15 O (H-3C-191 0
20 (H-7C-204)
E n o
25
30 o
35
57 55 53 51 49 ppm
Figure A9 Expansion 9 of the 500 MHz HMBC Spectrum of B2
r 47
35
40 shy
45 shy
50
55 shyE Q
60
65
70 shy(H-2C-3)
75 shy
53 51 ppm
Figure A10 Expansion 10 of the 500 MHz HMBC Spectrum of B2
(H-2C-22)
Ishy- 3
165
(H-3C-1) ca
170
175
(H-TC11) N
180
57 55 53 51 49 47 ppm
Figure A11 Expansion 11 of the 500 MHz HMBC Spectrum of B2
35 U
40
0
0 0
45
50
7 0
0
55
0 ca
CO (-NHC-21 0
60
65 7
0
C
70
75
93 91 89 87 85
I I
ppm 83
I
81
I
79 77 75
Figure A12 Expansion 12 of the 500 MHz HMBC Spectrum of B2
120
0 0
0
0130 - 0 C) (H-7C-3)
c(H-3C-7)
0
0 00
140
(H-3C-4) (15
CJ
(Chr 8858 8 1368)
(H-6C-2)
(H-6C-4)
150 shy
(H-3C-5) 0 (H-7C-5) (1)
C
C
160
93
Ishy
91
1 1
89 87
-1
85
A 83
ppm 81 79 77 75
Figure A13 Expansion 13 of the 500 MHz HMBC Spectrum of B2
0 0
0 0 0
120
0
0
130
(
(H-3C-7)
H-3C-4)
140
(Chr 8856 8)368)0 0 0
150 shy 0
0
(H-3C-5) 0 o
(Chr 8828 81453)
160 -(-NHC-22) 0Q)
170 -0
(-NHC-11) oo
(H-3C-1)0 0 (H-7C-1)
180 -1
100 I
95 1
90 I
ppm
t 85
(Chr 8828 81766)
80 75
Figure A14 Expansion of the 500 MHz HMBC Spectrum of B2 at 368 K
102
Appendix 2
Crystal and Collection Data for UV16A C26H16N207
103
Table A1 Crystal and Collection Data for UV16A
Emperical Formula
Formula Weight
Crystal Dimensions (mm)
Crystal System
Crystal Color
Habit
No Reflections Used for Unit
Cell Determination (20 range)
Lattice Parameters
a =
b =
c=
cc=
13=
Y=
V =
Space Group
Z Value
Dcalc
Radiation
Temperature
Scan Type
Scan Rate
Scan Width
C26H16N207C2H6OS
54655
023 X 008 X 006
triclinic
orange
needle
18 (2005-2614deg)
9799 (3) A
16243 (4) A
8000(2) A
10213 (2)deg
9463 (2)deg
9794 (2)deg
1225 (1) A3
P-1 (2)
2
1482 gcm3
Mo Ka
23 plusmn degC
co-28
80degmin (in omega)
(15 + 003 tan 0)deg
104
Table A1 Continued
20max 499deg
sineAmax 05436 A-1
Counting Time (background peak) 21
No of Reflections Measured
Total 5788
Unique 2969 (Rim= 0073)
Observed 1336
0041
Rw 0044
Goodness of Fit Indicator 129
Corrections
DIFABS Lorentz and polorization effects
Transmission Factors 081 to 128
Freidel Mates Averaged Yes
ShiftError (max) in Final LS Cycle 00266
Max Peak in Final Diff Map 16664 e-A3
Max Unassinged Peak in Final Diff Map 0166 e-A3
Min Peak in Final Diff Map -0174 e-A3
F(000) 568
2
H3C0 0 OH 0
C H3
H 3C OH OH N(CH3)2
OHO
SOO HO
OH 0 OH 0 0
NH2
OH
3 4
5 R1 =R2 =H 6 R1 =AR2=B 7 Ri = H R2 =A 8 RI = R2= A
OH 0
H3CFCV H3C
H3C
OH HHOOO
A
Figure 11 Examples of Biologically Active Polyketides
Kinamycin D Biosynthesis
Kinamycin A B C and D 9a-d isolated from Streptomyces
murayamaensis possess modest antitumor properties and antibiotic activity
against Gram- positive organisms They were originally characterized by Omura
and co-workers6-8 as benzo[b]carbazoles on the basis of chemical
3
spectroscopic and X-ray crystallographic data9 The structures recently have
been revised as the diazo-substituted benzo[b]fluorenes shown1011
9a Rj = R2= R3 = Ac R4 = H
9b R2=AcR1 =R3= R4=H
9c Ri =R3=R4=AcR2=H
9d R1=R3=AcR2=R4=H
Kinamycins are derived from acetate apparently through a decaketide
10 which transforms to the benz[a]anthraquinone 1112-14 Metabolism of
dehydrorabelomycin 11 to a quinone 12 followed by reduction to the
hydroquinone 13 and a biological Friedel-Crafts cyclization would yield the
fluorene system of the kinamycins (Scheme 11)
4
CH3COCoA ---1shy
0 0 0 10 11
C H3
OH 0
12
-CO2 [0]
HO0 C H3 KinamycinsMO
OH 0
18
Scheme 11 Proposed Pathway of Kinamycin Biosynthesis
Studying the kinamycin biosynthetic pathway has been targeted in many
ways One strategy involved isolation and characterization of metabolites
related to the kinamycins from fermentation broths of Streptomyces
murayamaensis This type of strategy has been shown to be quite successful in
biosynthetic studies of secondary metabolites1516 By changing the
fermentation conditions (temperature media and time) different metabolites
may accumulate In the kinamycin studies this led to the characterization of a
5
number of putative intermediates (prekinamycin 14 ketoanhydrokinamycin
15 kinamycin E 16 and kinamycin F 17)1718
HO
H3 CH3
14
H 0 R20
0 H3
16 Ri=H R2=Ac 17 R1 =H R2=HSO
OH
r OH 0
Figure L2 Metabolites Obtained from Cultures of Streptomyces murayamaensis
Secondly a strategy of biosynthetic feeding studies of putative
intermediates has also been employed So far dehydrorabelomycin 1114 and
kinobscurenone 1819 have been incorporated into 9 The insolubility of
prekinamycin 14 the impermeability of the cells or both presumably have
prevented its incorporation into 9
A third approach used successfully in the past to study the biosynthesis
of many microbial products including polyketide antibiotics was the
development of blocked mutant strains20 Isolation and structure determination
of some compounds produced by S coelicolor mutant strains for example had
led to the proposal of a reasonable pathway to the antibiotic actinorhodin21 S
murayamaensis blocked mutants were developed with two kinds of
mutagenesis nitrosoguanidine and germicidal UV light Kinafluorenone 19
6
the first recognized biosynthetically-derived benzo[b]fluorenone was isolated
from a mutant strain of S murayamaensis (MC1) blocked in the biosynthesis of
kinamycins22 Strain MC1 was isolated from amongst survivors of mutagenesis
of a wild type spore suspension with nitrosoguanidine
HO
OH
00 OHHC3
19
Antibiotic Biosynthesis in S murayamaensis - Molecular BiologicalApproach
Rapid progress in molecular genetic studies of Streptomyces now affords
basic information on the organization and regulation of genes concerned with
antibiotic biosynthesis in these organisms An important feature in
streptomycetes is that genes for the various steps of polyketide biosynthesis
show marked tendency to clustering2023 This is also true of genes for the
biosynthesis of antibiotics of other chemical classes This greatly facilitates the
isolation and characterization of all the biosynthetic genes on a pathway once
a strategy is available to identify just one In the case of antibiotic production
one or more resistance genes must also be expressed in order to protect the
host cell from the biological effects of its own antibiotics and this is usually
closely linked to the biosynthetic structural genes24
macrolides aminoglycosides and modified peptide antibiotics all have been
cloned in the past decade Some of these have been cloned by selection for
resistance genes and searching for contiguous biosynthesis genes whereas
others have been cloned by complementation of blocked mutants More
recently several antibiotic biosynthesis genes and gene clusters have been
cloned using heterologous probes to hybridize and isolate predicted genes
encoding steps in the pathway of interest2526
act III (a gene that encodes the actinorhodin polyketide ketoreductase of
S coelicolor) and gra ORF1 (a gene that encodes the granaticin ketoacyl
synthase of S vioaceorber Yu 22)27 probes were used to screen a genomic
library of S murayamaensis (constructed in bacteriophage EMBL4 and cloned
into E coh) and seven gene clusters positively hybridized with the DNA probes
act III and act III like genes encode reductases that reduce the 13-keto group
which is located nine carbons from the carboxyl end of the assembled
polyketide chain Since the synthesis of the polyketide chain begins at the
methyl terminus this hypothesis would suggest that the enzyme measures the
assembeled polyketide and reduces the proper keto group prior to ring closure
The reduction occurs at a carbon which is part of the first ring formed during the
biosynthesis and may be a prerequisite for efficient folding of the polyketide
chain2526
Interestingly an o-phenanthraquinone metabolite murayaquinone 20
has also been isolated from kinamycin producing cultures of S
murayamaensis28 This raises a question of whether it is produced by different
polyketide synthase or by an alternative folding of the same decaketide
precursor leading to the kinamycin skeleton
8
OH
20
As shown in Scheme 12 in the biosynthesis of murayaquinone the
nascent decaketide chain should be reduced at positions 11 and 15 or 7 and 11
depending on the direction of the polyketide chain folding while the precursor
chain of the kinamycins needs to be reduced at position 9 This suggests that
murayaquinone biosynthesis requires a different set of enzymes from that
required for the biosynthesis of kinamycins Hence the products of two different
polyketide pathways in S murayamaensis are known and the seven gene
clusters suggested more may exist
9
1 AcetylCoA starter unit + 9 MalonylCoA
1 AcetylCoA starter unit + MaionylCok
C001-4 or
HOOC
HO g
0 COOH
0
OH OH
0 HOOC
OH 0 OH
101
OH
CH3 [0]
OH
Kinamycins
OH 0
18
Scheme 12 Biosynthesis of Kinamycins versus Murayaquinone
10
The Use of Multiply 13C-labeled Precursors in Structure and Biosynthesis Studies
Feeding of precursors multiply labeled with carbon-13 has been used
to investigate complex biosynthetic problems [12-13C2]Acetate has been
extensively used to study terpenoid and polyketide metabolism29-31 This
powerful method derives from the simple principle that two adjacent carbons
simultaneously enriched in carbon-13 give rise to a pair of new coupled signals
in the corresponding 13C NMR spectrum These coupled pairs appear as
satellites about the natural abundance carbon signal producing an easily
recognized trio of resonances Any intervening process which breaks an intact
130-130 bond results instead in a simple enrichment of the appropriate sites in
the resulting metabolite and a corresponding enhancement of the relevant
natural abundance signals
Cane et al32 used a variation of the doubly labeled acetate technique
in which uniformly 13C-labeled glucose ([U-13C6]glucose) was used as in vivo
precursor of [12-13C2]acetyl CoA leading to the demonstration of the
mevalonoid origin of pentalenolactone and its precursor pentalenic acid by
interpretation of the 13C NMR spectra Logically this methodology should be
applicable to the study of additional product metabolism The presence of a
chain of three labeled carbon atoms derived intact from glucose should yield a
characteristic pattern consisting of two trios corresponding to each end of the
chain and a quintet resulting from the central carbon atom The quintet would
arise from the superposition of a triplet corresponding to those species in which
both neighboring carbons are labeled and a doublet resulting from those
species in which either one or the other of the adjacent carbons is enriched with
130 because the glucose enrichment was 80 The predicted quintet pattern is
11
based on the assumption that J AB J Bc Similarly a four-carbon unit could be
recognized by the resulting pattern of trio-quintet-quintet-trio Each of these
various coupling relationships illustrated schematically in Figure 13 is easily
recognized by the characteristic coupling constants and should be directly
verifiable by the appropriate homonuclear 13C-13C decoupling experiments
(A) (B) (C)
Figure I3 Schematic Representation of Carbon Chain in Which Each Carbon is Enriched with Carbon-13 and Showing the Expected NMR Spin-Coupled Signal Patterns (A) A two-carbon unit (B) a three-carbon unit (C) a four-carbon unit
The utility of such an approach was applied for shikimic acid derived
metabolites Shikimic acid the apparent precursor of numerous families of
natural products is known to be derived from glucose by the combination of an
intact four-carbon unit erythrose-4-phosphate and an intact three-carbon unit
phosphoenol pyruvate Studies of the biosynthesis of shikimate derived
metabolites using singly labeled samples of glucose were difficult to interpret
because of the competition between alternative metabolic pathways which
result in indirect labeling of numerous additional sites in the derived
metabolites33-34 The utilization of [U-13C6]glucose is effectively transparent to
the scrambling processes while remaining opaque to the direct incorporation of
intact biosynthetic units regardless of the manner of their derivation from
12
glucose Rinehart et al had reported the use of [U-13C6]glucose to confirm the
shikimate origin of the C7N unit of pactamycin and used homonuclear
decoupling to confirm the observed labeling patterns35 Gould and Cane had
reported the use of [U-13C6]glucose in the biosynthesis of streptonigrin36
Rationale for Current Study
Previous studies on the kinamycin biosynthetic pathway in S
murayamaensis involved isolation and characterization of some intermediates
obtained by manipulation of the fermentation conditions Developing S
murayamaensis mutant strains led to the characterization of kinafluorenone 19
from mutant strain MC1 Prekinamycin the first compound with the 5shy
diazobenzo[b]fluorene skeleton in the biosynthesis pathway of KD was
overproduced by a mutant strain MC4 Another mutant strain (MC2) isolated
from amongst the survivors of germicidal UV light treatment of a spore
suspension of the wild type strain has no detectable antibiotic activity3 7
Screening the strain in five different production media yielded no evidence of
kinamycin production Colonies of strain MC2 are very dark on soybean-
glucose agar and green in soybeanglucose liquid seed medium whereas the
wild type is dark brown in both instances
TLC analysis of the strain grown in oatmeal or glycerol-asparagine
media initially yielded no detectable production of kinamycin or
murayaquinone although during the course of present study it was discovered
that kinamycin is produced by the mutant after 8 days in oat meal production
medium in very minor quantities HPLC analysis of the ethyl acetate extract of
13
the strain grown on glycerol-asparagine revealed that it produces
kinafluorenone38
The objective of this study was to characterize new metabolites
produced by this mutant strain and to initiate a preliminary study of their
biosynthetic origin To discover unusual new metabolites from microbial
sources either biological or chemical screening was applied Since we were
expecting intermediates or some other metabolites of unknown biological
activity chemical screening using TLC and HPLC with a UV detector was used
to look for new metabolites produced by the mutant
In comparison with the wild type strain MC2 makes a number of new
metabolites in a wheat medium four of which were targeted for this study
(1) A metabolite with UV spectrum very similar to ketoanhydrokinamycin (260
304 420 nm) called metabolite UV16A
(2) Two non polar metabolites having a 402-404 nm chromophore (215 256
406 nm) called UV16B1 and UV16B2
(3) A more polar metabolite with UV max at 252 320 380 nm called UV16C
Development of isolation and purification procedures for each of these
compounds was the early focus in this study Following the isolation and
purification of the new metabolites structural studies of these compounds by
modern high field NMR techniques such as 2D NMR and other spectroscopic
methods was the immediate objective Since the use of the 13C-multiply
labeled precursors makes simultaneous determination of structure and
biosynthesis possible where classical methods could not provide unequivocal
answers the last part of this study was focused on feeding uniformly 13Cshy
labeled glucose and characterizing the 13C-enriched metabolites by the
appropriate NMR techniques
14
Results and Discussion
Isolation and Characterization of MC2 Metabolites
The 7 wheat 2 trace metals production medium was chosen to
grow the mutant since it showed the best production of the new metabolites
The colored metabolites were obtained from mycelium by extraction with
acetone Initial attempts to purify the colored metabolites by flash
chromatography on Silicar CC-4 did not result in good separation and the
Silicar retained the material very strongly Other portions of the mycelium
extract were chromatographed on Sephadex LH-20 and phosphate buffered
(pH 7) flash grade silica gel and eluted with increasing concentrations of
methanol in dichloromethane Both were capable of separating UV16A from
UV16B1UV16B2 The buffered silica had the advantages of tolerating more
material compared to the same size column of LH-20 and by the speed of flash
chromatography over gravity LH-20 chromatography The isolation and the
purification of the different metabolites is outlined in Scheme 111
15
Fermentation
Adjust to pH 28 and centrifuge
Sonicate cells extract in Discard broth acetone and filter over Celite
1
Discard cell mass Filtrate
Extract in EtOAc
EtOAc layer Discard aqueous
trituration with petroleum ether
Non polar oils
fractions enriched in UV16A
Sephadex LH2O column
Pure UV16A
Crude extract
IBuffered silica column chromatography
B1 B2 mixture
Preparative HPLC (C-18)
Pure B1 and Pure B2
1
Fractions enriched in UV16C
Flash C-18 column
Pure UV16C
Scheme 111 Schematic Diagram of the Isolation and Purification of MC2 Metabolites
16
Production and Detection of Phenanthroviridin Aglycone (1)
In an attempt to find a good chromatographic system to separate MC2
metabolites prior to the development of the above purification scheme crude
extract from MC2 cells (from a 43 L fermentation culture) was chromatographed
on a column of Silicar CC-4 and colored materials were eluted with increasing
proportions of EtOAc in dichloromethane (DCM) Fractions containing UV16A
as the major component (170 mg) were further purified on a column of buffered
silica gel yielding 24 mg of material in the fraction most enriched in UV16A A
portion (5 mg) was further chromatographed on Sephadex LH-20 in toluene-
methanol (91) One of the fractions (1 mg) was dissolved in methanolshy
dichloromethane (91) and analyzed by diode array HPLC (Figure 111a) One
of the minor metabolites in the fraction eluting at 196 min exactly matched the
retention time and the UVvis absorption spectrum of authentic
phenanthroviridin aglycone (Figure Ili b) Co-injection with the authentic
materia13940 gave a symmetrical enhancement of the peak with an unchanged
UVNis spectrum Further confirmation of the identity of the peak assigned to 1
was provided by thermospray (TSP) liquid chromatography mass spectrometry
(LCMS) both an authentic sample of 1 and the new metabolite had identical
retention times and gave an M- ion at mz 3051
17
1
03
A
012
B F2 008
0 0lt 004
200 300 400 500 600
Wavelength
16 18 20 22
Time min
Figure 111 HPLC Analysis of LH-20 Fraction from MC2 A Chromatogram of LH-20 fraction B UVNis absorption spectrum of the component eluting at 1956 min overlaid with spectrum of authentic 1
Phenanthroviridin aglycone was predicted to be a possible
intermediate 22 in the kinamycin pathway before the structure revision has been
done Subsequently four naturally-occuring benzo[b]phenanthridines have
been isolated from two different Streptomyces including 1 and the
jadomycins4142 The quinone 10 in the kinamycin biosynthetic pathway could
18
readily lead to the benzo[b]phenanthridines via nitrogen addition and
decarboxylation1
CH3
OH o OH 0
10 1
Scheme 112 Phenanthroviridin Aglycone as Possible Shunt Product from Kinamycin Biosynthetic Pathway
Bioactivity
The UV16B1UV16B2 mixture had some antibiotic activity against
Gram-positive bacteria which are more sensitive than Gram-negative The
minimum inhibitory concentrations of UV16B1UV16B2 against a group of
selected bacteria are listed in Table 111 UV16B1UV16B2 UV16A and
UV16C exhibit no significant activity against yeast or mold
19
Table 111 Minimum Inhibitory Concentration of UV16B1UV16B2 (11gmL)
Test microorganism MIC
Escherichia coil ATCC 10536 gt128
Serratia Marcescens ATCC 13880 128
Pseudomonas aerufinosa ATCC 25619 128
Klebsiella pnumonias AAD 128
Bacillus subtilis ATCC 6633 16
Staphylococcus aureus ATCC 25923 64
Streptococcus faecalis ATCC 29212 64
Micrococcus luteus ATCC 9341 1
Bioactivity of different fractions from a buffered silica column was tested
in the laboratory of Dr M Daeschel (Food Science-OSU) and the results are
presented in Table 112 Five mg of samples (1-4 nonpolar fractions UV16C
very polar fractions UV16A respectively) were dissolved in 1 mL of DMSO and
paper disks (14 inch diameter) were impregnated with 20 pL Number 5 was
prepared by partially dissolving -11 mg of UV16B1UV16B2 mg in 1 mL of 91
DCM- methanol and the disk was prepared by adding 15 IL of the suspension
while disk 6 was prepared by adding 15 tiL of UV16 broth and 7 was a DMSO
control UV16A UV16B1UV16B2 and UV16C did not show pronounced
activity toward bacteria yeast or fungi However the nonpolar fraction of the
fermentation crude extract has very high activity against fungi
20
Table 112 Bioactivity of Different Fractions of MC2 Extract
Gram positive bacteria 1 2 3 4 5 6 7
Lactobacilus plantarum 31
Pediococcus pentosaceus FBB-61 -
Streptococcus faecalis 34
Leuconostoc mesenteroides 47
Staphilococcus aureus 609 ++
Bacillus subtilis 614 +shy + +-
Listeria monocitogenes 630 +1shy
Gram negative bacteria
Klebsiella pneumonie 601 + +
Escherichia coli 13604
Enterobacter aerogenes 605
Pseudomonas aeruginosa 603 +shy +-
Pseudomonas flourescense 602
Salmonella typhimirum 616
Yeast
1003
1009 +++ ++ ++
1011 +++ -
1023 +++ + + +shy
1024 +++
1025 +++ ++ ++ +shy
1026 +++ -
21
Table 112 Continued
Fungi
MP-2 +++ shy
MP-3 +- +shy
MP-4 +shy
MP-6 ++
MP-7 +++ shy
MP-13 ++
+++ extremely large inhibition but not complete ++ or + not complete inhibition
Radioactive and Stable Isotope Feedings
To prepare for a 13C-feeding the incorporation of glucose or glycerol as
a carbon source was tested [U- 14C]D- Glucose and [U-14C]glycerol were fed to
separate cultures of MC2 at 24 48and 72 h after the inoculation of the
production media The addition of both labeled glucose and glycerol was
accompanied with 1 g of unlabeled compound to observe the effect on the
production of the target metabolites The addition of both compounds
decreased the production of UV16A and UV16B1UV16B2 while it did not affect
the production of UV16C The incorporation of 14C from either glucose or
glycerol in various metabolites was similar 008 - 012 in UV16B1UV16B2
and 011 - 017 in UV16C Glucose was chosen over glycerol for the stable
22
isotope feeding experiment because it has the advantage of showing longer
units
[U-13C6]D-Glucose was fed along with [U-14C]D-Glucose to one liter of
MC2 cultures using the same feeding strategy used for the radioactive feeding
The crude extract (298 mg) was chromatographed by the usual method
Buffered silica chromatography yielded 175 mg of pure UV16B1UV16B2
mixture with 0048 14C incorporation The incorporation of the radioactive
label in UV16A was 0013 However since the mass of this metabolite was
only 16 mg the 13C NMR spectrum showed a highly 13C enriched sample On
the other hand UV16C had a 0034 incorporation but due to high amount
(116 mg) produced the level of 13C enrichment shown in the 13C NMR spectrum
was low
UV16A Structural Studies
UV16A was separated from a minor green metabolite having similar Rf
on silica gel TLC by chromatographing the fraction enriched in UV16A on a
Sephadex LH-20 column and eluting with dichloromethane- methanol (11)
The infrared spectrum of the pure UV16A with strong absorption at 1629 1669
cm-1 representing quinone carbonyl stretches was not surprising since its
UVNis spectrum resembles that of ketoanhydrokinamycin 15 Indeed
examination of proton NMR spectrum of UV16A (Table II3) revealed the
pattern typical of the three adjacent hydrogens in the A ring of the kinamycin
skeleton [8 737 (1H d J = 86 Hz) 781 (1H t J = 82 Hz) 754 (1H d J= 72
Hz)]
23
A 1H-1H COSY spectrum revealed another AMX spin system at 6 71
(1H d J=84 Hz) 785 (1H dd J= 84 20 Hz) 808 (1H d J= 20 Hz) Single
frequency decoupling provided confirmation of this analysis From an HMQC
experiment it was deduced that two doublets at 8 315 and 390 represent
diastereotopic methylene protons that show geminal coupling of 13 Hz From
the above data part structures 21 and 22 were defined
710 H
781
737
OH 0 H 808
21 22
These two part structures left unassigned signals for one methyl at 8
13 the diastereotopic methylene one aromatic and one exchangable proton
at 8 800 There was also a very broad hump in the region of 11-12 ppm that
was not accounted for Due to the poor solubility of UV16A a decent natural
abundance 13C NMR spectrum was never obtained Some of the 13C chemical
shifts were observed indirectly through HMBC and HMQC NMR experiments
The results will be discussed later
The solubility of the UV16A metabolite was so low that a small sample
of - 2 mg would precipitate in 05 mL of DMSO at 323 K in the NMR tube as light
orange needles To modify the quality of the crystal a super-saturated solution
(- 2 mg of material in 05 mL of DMSO heated to - 90 degC) was slowly cooled
over a 48 h period in a low-form Dewar flask filled with hot water The collected
crystals were suitable for X-ray diffraction A single crystal X-ray diffraction
24
analysis provided the total structure 2 The ORTEP plot is shown in Figure
112
NH2
OH 0 OH
2
(1
CS U -----Ai 4 100 11v- 4
00---5- shyNor -fir0--
II
e
Figure 112 ORTEP Drawing from Single-Crystal X-ray Structure Determination of UV16A Hydrogens have been omitted for clarity
25
Table 113 NMR Spectral Data of UV16A
1H 13CNo Jcc (Hz)
1 1926 C 527
2 (315 39) 2H d J= 13Hz 515 CH2
3 743 C 375
4 1571 C 557
4a C
5 81 1H s 1175 CH 686
6 1625 C 702
6a C
7 1900 C 557
7a 1159 C 650
8 1607 C 646
9 737 1H d J= 86 Hz 1240 CH 570
10 781 1H t J= 82 Hz 1376 CH 569
11 754 1H d J= 72 Hz 1187 CH 614
11a 1350 C 612
12 1826 C 532
12a C
12b C
13 13 3H s 207 CH3 375 1 1667 C
2 1290 C
3 808 1H d J= 20 Hz 1270 CH 4 1320 C
5 1480 C 6 710 1H d J= 84 Hz 1163 CH
7 785 1H dd J= 84 20 Hz 1314 CH
1-NH2 800 2H br exchangable
6 -OH 11-12 br exchangable
8 -OH 11-12 br exchangable
The enrichment is very low and Jcc could not be measured 13C chemical shift could not be identified by HMBC experiment
The HMQC data were collected using the following acquisition
parameters DO = 3 ps D1 = 20 s SI1 = 512 word SI2 = 2048 word The data
were acquired in 192 experiments of 96 scans each
79
0Heteronuciear Multiple Bond on AC
This data set was collected using the following parameters DO = 3 gs D1
= 20 s D2 = 33 ms S1 = OH D4 = 005 s SI1 = 512 word SI2 = 2048 word
The data was acquired in 128 experiments of 176 scans each
Fast Atom Bombardment Mass Spectrometry (FAB)
Samples of A UV16B1 or UV16B2 were dissolved in 3-nitrobenzyl
alcohol matrix Sample ion fragments were generated by FAB source
generated from Ze gas 8 keV
Radioisotope Feeding Studies
fkl14-C1D-Glucose
A 25 mL aqueous solution of D- [U- 14C]glucose (429 X 107 dpm sp act=
10-15 mCi mmol-1) was fed to 5 - 200 mL cultures in 3 pulses 24 h apart 10 mL
of the labeled glucose solution was sterile filtered into 24 h cultures 75 mL of
the same solution was subsequentely administered via sterile filter at 48 and 72
h Each time the same volume of 4 unlabeled D-Glucose solution was added
to the cultures The 8 day cultures were harvested to give -900 mg of crude
extract Subsequent purification of 1618 mg of the crude extract on buffered
silica column yielded a 49 mg fraction containing UV16A UV16B1 and
UV16B2 which retained 0014 of the fed radioactivity Further purification of
80
the UV16C containing fraction on a C-18 column yielded 70 mg of pure UV16C
which retained 002 of the fed radioactivity
at14C)Glycerol
The above procedure was used to feed [U-14C]Glycerol (443 X 107 dpm
sp act = 5 - 10 mCi mmol-1) along with 1 g of unlabeled glycerol to 5 - 200 mL
cultures The 8 day cultures were harvested to give 755 mg of crude extract
Purification of 100 mg of the crude extract yielded 33 mg of UV16B1UV16B2
mixture which retained 0016 of the fed radioactivity
Stable Isotope Feeding Studies
e
Fermentation conditions for this experiment were identical to those
outlined above Feedings were administered to 5-200 mL cultures contained in
1 L Erlenmeyer flasks One gram of [U- 13C6JD- Glucose (98+ enriched) was
dissolved in 25 mL of Milli-Q water and administered as 75 75 and 10 mL at
24 48 and 72 h after inoculation respectively Simultaneously a total of 427 X
107 dpm of [U-74CJD-Glucose was fed in the same volumes The 7 day cultures
were harvested and subsequent purification yielded 175 mg of a
UV16B1UV16B2 mixture 16 mg of UV16A and 116 mg of UV16C
81
Bibliography
1 Cone M C Hassan A M Gore M P Gould SJ Borders D B Alluri M R Detection of Phenanthroviridin Aglycone in a UV-Mutant of Streptomyces murayamaensis J Org Chem 1994 59 1923-1924
2 Arcamone F Franceschi G Penco S Adriamycin(14-Hydroxyshydaunomycin) A Novel Antitumor Antibiotic Tetrahedron Lett 1969 1007-1010
3 Ayukawa S Umezawa H Inhibition of Dopamine 13 - Hydroxylase by Aquayamycin J Antibiot 1968 21 354-357
4 Omura S Nakagawa A Fukamachi N Miura S Takahashi Y Komiyama K Kobayashi B OM-4842 A New Platelet Aggregation Inhibitor from Streptomyces J Antibiot 1988 812-813
5 Roher J Theiricke R Anglucycline Group Antibiotic Natural Product Reports 1992 9 103-137
6 Ito S Matsuya T Omura S Otani M Nakagawa H Takeshima H lwai Y Ohtani M Hata T A New Antibiotic Kinamycin J Antibiotics 1970 23 315-317
7 HataT Omura S Iwai Y Nakagawa A Otani M Ito S Masuya T A new antibiotic Kinamycin Fermentation Isolation Purification and Properties J Antibiot 1971 24 353-359
8 Omura S Nakagawa A Yamada H Hata T Furusaki A Watanabe T Structure and Biological Properties of Kinamycin A B C D Chem Pharm Bull 1973 21 931-940
9 Furusaki A Matsui M Watanabe T Omura S Nakagawa A Hata T The Crystal and Molecular Structure of Kinamycin C p -Brompbenzoate Isr J Chem 1972 10 173-187
10 Gould S J Tamayo N Melville C R Cone M C Revised Structure for the Kinamycin Antibiotics 5-Diazobenzo[b]fluorenes Rather Than
82
Benzo[b]carbazole Cyanamides J Am Chem Soc 1994 116 2207shy2208
11 Mithani S Weeratunga G Taylor N J Dmitrienko G I The Kinamycins are Diazofluorenes and not Cyanocarbazoles J Am Chem Soc 1994 116 2209-2210
12 Sato Y Gould S J Bioaynthesis of Kinamycin D Incorporation of [ 12shy13C] Acetate and of [ 2-2H3 1-13C] Acetate Tetrahedron Lett 1985 26 4023-4026
13 Sato Y Gould S J Bioaynthesis of Kinamycin Antibiotics by Streptomyces murayamaensis Determination of the Origin of Carbon Hydrogen and Oxygen Atoms by 13C NMR Spectroscopy J Am Chem Soc 1986 108 4625- 4631
14 Seaton P J Gould S J Kinamycin Biosynthesis Derivation byExcision of an Acetate Unit from a Single- Chain Decaketide Intermediate J Am Chem Soc 1987 109 5282
15 Verrall M S Discovery and Isolation of Microbial Products Ellis Norwood London 1985
16 Luckner M Secondary Metabolism in Microorganisms Plants and Animals 2nd Edition Spronger-Verlag Berlin 1984
17 Cone M C Seaton P J Halley K A Gould S J New Products Related to Kinamycin from Streptomyces murayamaensis I Taxonomy Production Isolation and Biological Properties Antibiot 1989 42 179shy188
18 Seaton P J Gould S J New Natural Products Related to Kinamycin from Streptomyces murayamaensis II Structure of Prekinamycin Ketoanhydrokinamycin and Kinamycin E and F J Antibiot 1989 42 189- 197
19 Melville C R unpublished results
83
20 Hopwood D A Sherman D H Molecular Genetics of Polyketides and its Comparison to Fatty Acid Biosynthesis Ann Rev Genet 1990 24 37-66
21 Rudd B A M Hopwood D A J Gen Microbiol 1979 114 35
22 Cone M C Melville C R Gore M P Gould S J Kinafluorenone a Benz[b]fluorenone Isolated from the Kinamycin Producer Streptomyces murayamaensis J Org Chem 1993 58 1058-1061
23 Hopwood D A 1986 Cloning and Analysis of Antibiotic Biosynthetic Genes in Streptomyces In Biological Biochemical and Biomedical Aspects of Actinomycetes ed G Szabo S biro M Good Fellow pp 3shy14 Budapest Akademiai kiado
24 Robinson J A Enzymes of Secondary Metabolism in Microorganism Chem Soc Review 1988 17 416-418
25 Strohl W R Bartel P L Li Y Connors N C Woodman R H Expression of Polyketide Biosynthesis and Regulatory Genes in Heterologous Streptomycetes J Ind Microb 1991 7 163-174
26 Bar let P L Zhu C Lampel J S Dosch D C Connors N C Strohl W R BealeJr J M Floss H G Biosynthesis of Anthraquinone by Interspesies Cloning of Actinorhodin Biosynthesis Genes in Streptomycetes Clarification of Actinorhodin Gene Functions J Bact 1990 172 4816- 4826
27 Sherman D H Malpartida F Bibb M J Kieser H M Bibb M J Hopwood D A Structure and deduced function of the granaticinproducing polyketide synthase gene cluster of Streptomyces violaceoruber Tu22 EMBO 1989 8 2717-2725
28 Sato Y Kohnert R Gould S J Application of Long Range 1H13C Heteronuclear Correlation Spectroscopy (LR HETCOSY) to Structure Elucidation The structure of Murayaquinone Tetrahedron Lett 1986 27 143
29 Tanabe M Suzuki KDetection of C-C Bond Fission during the Biosynthesis of the Fungal Triprenyl phenol Ascochlorin using [12shy13C]Acetate J Chem SocChem Commun 1974 445-446
84
30 McInnes A G Smith D G Walter J A Vining L C Wright J L C New Techniques Biosynthetic Studies using 13C Nuclear Magnetic Resonance Spectroscopy The Biosynthesis of Tenellin Enriched from Singly and Doubly LabelledPrecursor J Chem SocChem Commun 1974 282
31 Seto H Sato T Yonehara H Utilization of Carbon-13-Carbon-13 Coupling in Structural and Biosynthetic Studies An Alternate Double Labeling Method J Am Chem Soc 1973 95 8461
32 Cane D E Rossi T Tillman A M Pachlatko J P Stereochemical Studies of Isoprenoid Biosynthesis Biosynthesis of Pentalenolactone from [U- 13C6]Glucose and [6- 2H2]Glucose J Am Chem Soc 1981 103 1838
33 Hornemann U Kehrer J P Eggert J H Pyruvic Acid and D-Glucose as Precursors in Mitomycin Biosynthesis by Streptomyces verticillatus J Chem Soc Chem Commun 1974 1045-1046
34 Haber A Johnson R D Rinehart K L Jr Biosynthetic Origin of the C2 Unit of Geldanamycin and Distribution of Label from D[6-13Cplucose J Am Chem Soc 1977 99 3541-3544
35 Rinehart K L Jr Potgieter M Delaware D L Seto H Direct Evidence from Multiple 13C Labeling and Homonuclear Decoupling for the Labeling Pattern by Glucose of the m-Aminobenzoyl (CAN) Unit of Pactamycin J Am Chem Soc 1981 103 2099-2102
36 Gould S J Cane D E Biosynthesis of Streptonigrin from [U- 13C6] -D-Glucose Origin of the Quinoline Quinone J Am Chem Soc 1982 104 343-346
37 Cone M C Research Report Culture Techniques for Streptomyces murayamaensis Screening of S murayamaensis UV and NTG Survivors 389
38 Cone M C Research Report Metabolites of Streptomyces murayamaensis Strain UV16 292
39 Gore M P Gould S J Weller D D Synthesis of Putative Intermediates in the Biosynthesis of the Kinamycin Antibiotics Total Synthesis of
85
Phenanthroviridin Aglycone and Related Compounds J Org Chem 1992 57 2774-2783
40 Gore M P Gould S J Weller D D Total Synthesis of Phenanthroviridin Aglycone The First Naturally Occurring Benzo[b]phenanthridine J Org Chem 1991 56 2289-2291
41 Ayer S W McInnes A G Thibault P Walter J A Doull J L Parnell T Vining L CJadomycin a Novel 8H-Benz[b]oxazolo[32shytjphenanthoviridine Antibiotic from Steptomyces venezuelae ISP5230 Tetrahedron Lett 1991 32 6301-6304
42 Doull J L Ayer S W Singh A K Thibault P Production of A Novel Polyketide AntibioticJadomycin B By Streptomyces venezuelae Following Heat Shock J Antibiot 1993 46 869-871
43 French JC at Warner - Lambert Company Unpublished results
44 Mathews C K van Hold K E Biochemistry The BenjaminCummings Publishing Company 1990 pp 730-731
45 Claydon N Frederick G Metabolic Products of Entomophthora virulenta J Chem Soc Perkin Trans I 1978 171-173
46 Jaime C Ortuno R M Font J Di- and Trisubstituted y-Lactones Conformational Study by Molecular Mechanics Calculations and Coupling Constant Analysis J Org Chem 1986 51 3946-3951
47 Sakai R PhD Thesis University of Illinois Urbana 1991 106-118
48 Hornemann U Personal Communications
49 Molecular Structure Corporation TEXSAN 1988 MSC 3200A Research Forest Drive The Woodlands TX 77381
50 CarneyJ work done at University of Illinois
86
51 Sahm D F Washington J A H Antibacterial Susceptibility Tests Dilution Methods In Manual of Clinical Microbiology 5th ed Ballows AHausler W J Jr HermannK L lsenburg H D Eds Am Soc for Microbiology Washington D C 1991 pp 1105-1116
87
Appendix 1
Expansions of 500 MHz HMBC Spectrum of UV16B2
Figure A1 Expansion 1 of the 500 MHz HMBC Spectrum of B2
40
(H3-1 4C-1 2)4_
50 o
E 60
Q WINSIZZNer $
E a
10 o
80
I
10 095 09 ppm
085
I
08 075 07
Figure A2 Expansion 2 of the 500 MHz HMBC Spectrum of B2
F 1111111111-ill-It 17 16 13 14 13 12 11
ppm
Figure A3 Expansion 3 of the 500 MHz HMBC Spectrum of B2
EF
-40 Z=M (H2-13C-12)
O lt7
30
O (H3-19C-2) C011
60 - cq
Cz)
I I I I I 1 I 1II II 17 16 15 14
ppm
Figure A4 Expansion 4 of the 500 MHz HMBC Spectrum of B2
0
0
- 3 165 shy
00 0 00 -
0 170
_-shy41111 _-------- -
175 shy(H-21C-111
00
n180 I I I
18 17 16 15 14 1213 11 ppm
Figure A5 Expansion 5 of the 500 MHz HMBC Spectrum of B2
10
(H-12C-14)
15
(H-1 2C-21)
y
20
E ta
25
30 (H-6C-16)
(H-1 2C-1 3)
35
Iii 1 i 1
27 26 23 24 23 22 21 20 ppm
Figure A6 Expansion 6 of the 500 MHz HMBC Spectrum of B2
35
40
45 ---
50 - Si
-55
o 0
60
65
70 - 0
1 I I
r r I rui
I I I r r -1 11-1
40 38 36 34 32 30 28 26 24 22 ppm
Figure A7 Expansion 7 of the 500 MHz HMBC Spectrum of B2
i I 1111111r 29 28 27 25 24 23 22
ppm
Figure A8 Expansion 8 of the 500 MHz HMBC Spectrum of B2
10
15 O (H-3C-191 0
20 (H-7C-204)
E n o
25
30 o
35
57 55 53 51 49 ppm
Figure A9 Expansion 9 of the 500 MHz HMBC Spectrum of B2
r 47
35
40 shy
45 shy
50
55 shyE Q
60
65
70 shy(H-2C-3)
75 shy
53 51 ppm
Figure A10 Expansion 10 of the 500 MHz HMBC Spectrum of B2
(H-2C-22)
Ishy- 3
165
(H-3C-1) ca
170
175
(H-TC11) N
180
57 55 53 51 49 47 ppm
Figure A11 Expansion 11 of the 500 MHz HMBC Spectrum of B2
35 U
40
0
0 0
45
50
7 0
0
55
0 ca
CO (-NHC-21 0
60
65 7
0
C
70
75
93 91 89 87 85
I I
ppm 83
I
81
I
79 77 75
Figure A12 Expansion 12 of the 500 MHz HMBC Spectrum of B2
120
0 0
0
0130 - 0 C) (H-7C-3)
c(H-3C-7)
0
0 00
140
(H-3C-4) (15
CJ
(Chr 8858 8 1368)
(H-6C-2)
(H-6C-4)
150 shy
(H-3C-5) 0 (H-7C-5) (1)
C
C
160
93
Ishy
91
1 1
89 87
-1
85
A 83
ppm 81 79 77 75
Figure A13 Expansion 13 of the 500 MHz HMBC Spectrum of B2
0 0
0 0 0
120
0
0
130
(
(H-3C-7)
H-3C-4)
140
(Chr 8856 8)368)0 0 0
150 shy 0
0
(H-3C-5) 0 o
(Chr 8828 81453)
160 -(-NHC-22) 0Q)
170 -0
(-NHC-11) oo
(H-3C-1)0 0 (H-7C-1)
180 -1
100 I
95 1
90 I
ppm
t 85
(Chr 8828 81766)
80 75
Figure A14 Expansion of the 500 MHz HMBC Spectrum of B2 at 368 K
102
Appendix 2
Crystal and Collection Data for UV16A C26H16N207
103
Table A1 Crystal and Collection Data for UV16A
Emperical Formula
Formula Weight
Crystal Dimensions (mm)
Crystal System
Crystal Color
Habit
No Reflections Used for Unit
Cell Determination (20 range)
Lattice Parameters
a =
b =
c=
cc=
13=
Y=
V =
Space Group
Z Value
Dcalc
Radiation
Temperature
Scan Type
Scan Rate
Scan Width
C26H16N207C2H6OS
54655
023 X 008 X 006
triclinic
orange
needle
18 (2005-2614deg)
9799 (3) A
16243 (4) A
8000(2) A
10213 (2)deg
9463 (2)deg
9794 (2)deg
1225 (1) A3
P-1 (2)
2
1482 gcm3
Mo Ka
23 plusmn degC
co-28
80degmin (in omega)
(15 + 003 tan 0)deg
104
Table A1 Continued
20max 499deg
sineAmax 05436 A-1
Counting Time (background peak) 21
No of Reflections Measured
Total 5788
Unique 2969 (Rim= 0073)
Observed 1336
0041
Rw 0044
Goodness of Fit Indicator 129
Corrections
DIFABS Lorentz and polorization effects
Transmission Factors 081 to 128
Freidel Mates Averaged Yes
ShiftError (max) in Final LS Cycle 00266
Max Peak in Final Diff Map 16664 e-A3
Max Unassinged Peak in Final Diff Map 0166 e-A3
Min Peak in Final Diff Map -0174 e-A3
F(000) 568
6
the first recognized biosynthetically-derived benzo[b]fluorenone was isolated
from a mutant strain of S murayamaensis (MC1) blocked in the biosynthesis of
kinamycins22 Strain MC1 was isolated from amongst survivors of mutagenesis
of a wild type spore suspension with nitrosoguanidine
HO
OH
00 OHHC3
19
Antibiotic Biosynthesis in S murayamaensis - Molecular BiologicalApproach
Rapid progress in molecular genetic studies of Streptomyces now affords
basic information on the organization and regulation of genes concerned with
antibiotic biosynthesis in these organisms An important feature in
streptomycetes is that genes for the various steps of polyketide biosynthesis
show marked tendency to clustering2023 This is also true of genes for the
biosynthesis of antibiotics of other chemical classes This greatly facilitates the
isolation and characterization of all the biosynthetic genes on a pathway once
a strategy is available to identify just one In the case of antibiotic production
one or more resistance genes must also be expressed in order to protect the
host cell from the biological effects of its own antibiotics and this is usually
closely linked to the biosynthetic structural genes24
macrolides aminoglycosides and modified peptide antibiotics all have been
cloned in the past decade Some of these have been cloned by selection for
resistance genes and searching for contiguous biosynthesis genes whereas
others have been cloned by complementation of blocked mutants More
recently several antibiotic biosynthesis genes and gene clusters have been
cloned using heterologous probes to hybridize and isolate predicted genes
encoding steps in the pathway of interest2526
act III (a gene that encodes the actinorhodin polyketide ketoreductase of
S coelicolor) and gra ORF1 (a gene that encodes the granaticin ketoacyl
synthase of S vioaceorber Yu 22)27 probes were used to screen a genomic
library of S murayamaensis (constructed in bacteriophage EMBL4 and cloned
into E coh) and seven gene clusters positively hybridized with the DNA probes
act III and act III like genes encode reductases that reduce the 13-keto group
which is located nine carbons from the carboxyl end of the assembled
polyketide chain Since the synthesis of the polyketide chain begins at the
methyl terminus this hypothesis would suggest that the enzyme measures the
assembeled polyketide and reduces the proper keto group prior to ring closure
The reduction occurs at a carbon which is part of the first ring formed during the
biosynthesis and may be a prerequisite for efficient folding of the polyketide
chain2526
Interestingly an o-phenanthraquinone metabolite murayaquinone 20
has also been isolated from kinamycin producing cultures of S
murayamaensis28 This raises a question of whether it is produced by different
polyketide synthase or by an alternative folding of the same decaketide
precursor leading to the kinamycin skeleton
8
OH
20
As shown in Scheme 12 in the biosynthesis of murayaquinone the
nascent decaketide chain should be reduced at positions 11 and 15 or 7 and 11
depending on the direction of the polyketide chain folding while the precursor
chain of the kinamycins needs to be reduced at position 9 This suggests that
murayaquinone biosynthesis requires a different set of enzymes from that
required for the biosynthesis of kinamycins Hence the products of two different
polyketide pathways in S murayamaensis are known and the seven gene
clusters suggested more may exist
9
1 AcetylCoA starter unit + 9 MalonylCoA
1 AcetylCoA starter unit + MaionylCok
C001-4 or
HOOC
HO g
0 COOH
0
OH OH
0 HOOC
OH 0 OH
101
OH
CH3 [0]
OH
Kinamycins
OH 0
18
Scheme 12 Biosynthesis of Kinamycins versus Murayaquinone
10
The Use of Multiply 13C-labeled Precursors in Structure and Biosynthesis Studies
Feeding of precursors multiply labeled with carbon-13 has been used
to investigate complex biosynthetic problems [12-13C2]Acetate has been
extensively used to study terpenoid and polyketide metabolism29-31 This
powerful method derives from the simple principle that two adjacent carbons
simultaneously enriched in carbon-13 give rise to a pair of new coupled signals
in the corresponding 13C NMR spectrum These coupled pairs appear as
satellites about the natural abundance carbon signal producing an easily
recognized trio of resonances Any intervening process which breaks an intact
130-130 bond results instead in a simple enrichment of the appropriate sites in
the resulting metabolite and a corresponding enhancement of the relevant
natural abundance signals
Cane et al32 used a variation of the doubly labeled acetate technique
in which uniformly 13C-labeled glucose ([U-13C6]glucose) was used as in vivo
precursor of [12-13C2]acetyl CoA leading to the demonstration of the
mevalonoid origin of pentalenolactone and its precursor pentalenic acid by
interpretation of the 13C NMR spectra Logically this methodology should be
applicable to the study of additional product metabolism The presence of a
chain of three labeled carbon atoms derived intact from glucose should yield a
characteristic pattern consisting of two trios corresponding to each end of the
chain and a quintet resulting from the central carbon atom The quintet would
arise from the superposition of a triplet corresponding to those species in which
both neighboring carbons are labeled and a doublet resulting from those
species in which either one or the other of the adjacent carbons is enriched with
130 because the glucose enrichment was 80 The predicted quintet pattern is
11
based on the assumption that J AB J Bc Similarly a four-carbon unit could be
recognized by the resulting pattern of trio-quintet-quintet-trio Each of these
various coupling relationships illustrated schematically in Figure 13 is easily
recognized by the characteristic coupling constants and should be directly
verifiable by the appropriate homonuclear 13C-13C decoupling experiments
(A) (B) (C)
Figure I3 Schematic Representation of Carbon Chain in Which Each Carbon is Enriched with Carbon-13 and Showing the Expected NMR Spin-Coupled Signal Patterns (A) A two-carbon unit (B) a three-carbon unit (C) a four-carbon unit
The utility of such an approach was applied for shikimic acid derived
metabolites Shikimic acid the apparent precursor of numerous families of
natural products is known to be derived from glucose by the combination of an
intact four-carbon unit erythrose-4-phosphate and an intact three-carbon unit
phosphoenol pyruvate Studies of the biosynthesis of shikimate derived
metabolites using singly labeled samples of glucose were difficult to interpret
because of the competition between alternative metabolic pathways which
result in indirect labeling of numerous additional sites in the derived
metabolites33-34 The utilization of [U-13C6]glucose is effectively transparent to
the scrambling processes while remaining opaque to the direct incorporation of
intact biosynthetic units regardless of the manner of their derivation from
12
glucose Rinehart et al had reported the use of [U-13C6]glucose to confirm the
shikimate origin of the C7N unit of pactamycin and used homonuclear
decoupling to confirm the observed labeling patterns35 Gould and Cane had
reported the use of [U-13C6]glucose in the biosynthesis of streptonigrin36
Rationale for Current Study
Previous studies on the kinamycin biosynthetic pathway in S
murayamaensis involved isolation and characterization of some intermediates
obtained by manipulation of the fermentation conditions Developing S
murayamaensis mutant strains led to the characterization of kinafluorenone 19
from mutant strain MC1 Prekinamycin the first compound with the 5shy
diazobenzo[b]fluorene skeleton in the biosynthesis pathway of KD was
overproduced by a mutant strain MC4 Another mutant strain (MC2) isolated
from amongst the survivors of germicidal UV light treatment of a spore
suspension of the wild type strain has no detectable antibiotic activity3 7
Screening the strain in five different production media yielded no evidence of
kinamycin production Colonies of strain MC2 are very dark on soybean-
glucose agar and green in soybeanglucose liquid seed medium whereas the
wild type is dark brown in both instances
TLC analysis of the strain grown in oatmeal or glycerol-asparagine
media initially yielded no detectable production of kinamycin or
murayaquinone although during the course of present study it was discovered
that kinamycin is produced by the mutant after 8 days in oat meal production
medium in very minor quantities HPLC analysis of the ethyl acetate extract of
13
the strain grown on glycerol-asparagine revealed that it produces
kinafluorenone38
The objective of this study was to characterize new metabolites
produced by this mutant strain and to initiate a preliminary study of their
biosynthetic origin To discover unusual new metabolites from microbial
sources either biological or chemical screening was applied Since we were
expecting intermediates or some other metabolites of unknown biological
activity chemical screening using TLC and HPLC with a UV detector was used
to look for new metabolites produced by the mutant
In comparison with the wild type strain MC2 makes a number of new
metabolites in a wheat medium four of which were targeted for this study
(1) A metabolite with UV spectrum very similar to ketoanhydrokinamycin (260
304 420 nm) called metabolite UV16A
(2) Two non polar metabolites having a 402-404 nm chromophore (215 256
406 nm) called UV16B1 and UV16B2
(3) A more polar metabolite with UV max at 252 320 380 nm called UV16C
Development of isolation and purification procedures for each of these
compounds was the early focus in this study Following the isolation and
purification of the new metabolites structural studies of these compounds by
modern high field NMR techniques such as 2D NMR and other spectroscopic
methods was the immediate objective Since the use of the 13C-multiply
labeled precursors makes simultaneous determination of structure and
biosynthesis possible where classical methods could not provide unequivocal
answers the last part of this study was focused on feeding uniformly 13Cshy
labeled glucose and characterizing the 13C-enriched metabolites by the
appropriate NMR techniques
14
Results and Discussion
Isolation and Characterization of MC2 Metabolites
The 7 wheat 2 trace metals production medium was chosen to
grow the mutant since it showed the best production of the new metabolites
The colored metabolites were obtained from mycelium by extraction with
acetone Initial attempts to purify the colored metabolites by flash
chromatography on Silicar CC-4 did not result in good separation and the
Silicar retained the material very strongly Other portions of the mycelium
extract were chromatographed on Sephadex LH-20 and phosphate buffered
(pH 7) flash grade silica gel and eluted with increasing concentrations of
methanol in dichloromethane Both were capable of separating UV16A from
UV16B1UV16B2 The buffered silica had the advantages of tolerating more
material compared to the same size column of LH-20 and by the speed of flash
chromatography over gravity LH-20 chromatography The isolation and the
purification of the different metabolites is outlined in Scheme 111
15
Fermentation
Adjust to pH 28 and centrifuge
Sonicate cells extract in Discard broth acetone and filter over Celite
1
Discard cell mass Filtrate
Extract in EtOAc
EtOAc layer Discard aqueous
trituration with petroleum ether
Non polar oils
fractions enriched in UV16A
Sephadex LH2O column
Pure UV16A
Crude extract
IBuffered silica column chromatography
B1 B2 mixture
Preparative HPLC (C-18)
Pure B1 and Pure B2
1
Fractions enriched in UV16C
Flash C-18 column
Pure UV16C
Scheme 111 Schematic Diagram of the Isolation and Purification of MC2 Metabolites
16
Production and Detection of Phenanthroviridin Aglycone (1)
In an attempt to find a good chromatographic system to separate MC2
metabolites prior to the development of the above purification scheme crude
extract from MC2 cells (from a 43 L fermentation culture) was chromatographed
on a column of Silicar CC-4 and colored materials were eluted with increasing
proportions of EtOAc in dichloromethane (DCM) Fractions containing UV16A
as the major component (170 mg) were further purified on a column of buffered
silica gel yielding 24 mg of material in the fraction most enriched in UV16A A
portion (5 mg) was further chromatographed on Sephadex LH-20 in toluene-
methanol (91) One of the fractions (1 mg) was dissolved in methanolshy
dichloromethane (91) and analyzed by diode array HPLC (Figure 111a) One
of the minor metabolites in the fraction eluting at 196 min exactly matched the
retention time and the UVvis absorption spectrum of authentic
phenanthroviridin aglycone (Figure Ili b) Co-injection with the authentic
materia13940 gave a symmetrical enhancement of the peak with an unchanged
UVNis spectrum Further confirmation of the identity of the peak assigned to 1
was provided by thermospray (TSP) liquid chromatography mass spectrometry
(LCMS) both an authentic sample of 1 and the new metabolite had identical
retention times and gave an M- ion at mz 3051
17
1
03
A
012
B F2 008
0 0lt 004
200 300 400 500 600
Wavelength
16 18 20 22
Time min
Figure 111 HPLC Analysis of LH-20 Fraction from MC2 A Chromatogram of LH-20 fraction B UVNis absorption spectrum of the component eluting at 1956 min overlaid with spectrum of authentic 1
Phenanthroviridin aglycone was predicted to be a possible
intermediate 22 in the kinamycin pathway before the structure revision has been
done Subsequently four naturally-occuring benzo[b]phenanthridines have
been isolated from two different Streptomyces including 1 and the
jadomycins4142 The quinone 10 in the kinamycin biosynthetic pathway could
18
readily lead to the benzo[b]phenanthridines via nitrogen addition and
decarboxylation1
CH3
OH o OH 0
10 1
Scheme 112 Phenanthroviridin Aglycone as Possible Shunt Product from Kinamycin Biosynthetic Pathway
Bioactivity
The UV16B1UV16B2 mixture had some antibiotic activity against
Gram-positive bacteria which are more sensitive than Gram-negative The
minimum inhibitory concentrations of UV16B1UV16B2 against a group of
selected bacteria are listed in Table 111 UV16B1UV16B2 UV16A and
UV16C exhibit no significant activity against yeast or mold
19
Table 111 Minimum Inhibitory Concentration of UV16B1UV16B2 (11gmL)
Test microorganism MIC
Escherichia coil ATCC 10536 gt128
Serratia Marcescens ATCC 13880 128
Pseudomonas aerufinosa ATCC 25619 128
Klebsiella pnumonias AAD 128
Bacillus subtilis ATCC 6633 16
Staphylococcus aureus ATCC 25923 64
Streptococcus faecalis ATCC 29212 64
Micrococcus luteus ATCC 9341 1
Bioactivity of different fractions from a buffered silica column was tested
in the laboratory of Dr M Daeschel (Food Science-OSU) and the results are
presented in Table 112 Five mg of samples (1-4 nonpolar fractions UV16C
very polar fractions UV16A respectively) were dissolved in 1 mL of DMSO and
paper disks (14 inch diameter) were impregnated with 20 pL Number 5 was
prepared by partially dissolving -11 mg of UV16B1UV16B2 mg in 1 mL of 91
DCM- methanol and the disk was prepared by adding 15 IL of the suspension
while disk 6 was prepared by adding 15 tiL of UV16 broth and 7 was a DMSO
control UV16A UV16B1UV16B2 and UV16C did not show pronounced
activity toward bacteria yeast or fungi However the nonpolar fraction of the
fermentation crude extract has very high activity against fungi
20
Table 112 Bioactivity of Different Fractions of MC2 Extract
Gram positive bacteria 1 2 3 4 5 6 7
Lactobacilus plantarum 31
Pediococcus pentosaceus FBB-61 -
Streptococcus faecalis 34
Leuconostoc mesenteroides 47
Staphilococcus aureus 609 ++
Bacillus subtilis 614 +shy + +-
Listeria monocitogenes 630 +1shy
Gram negative bacteria
Klebsiella pneumonie 601 + +
Escherichia coli 13604
Enterobacter aerogenes 605
Pseudomonas aeruginosa 603 +shy +-
Pseudomonas flourescense 602
Salmonella typhimirum 616
Yeast
1003
1009 +++ ++ ++
1011 +++ -
1023 +++ + + +shy
1024 +++
1025 +++ ++ ++ +shy
1026 +++ -
21
Table 112 Continued
Fungi
MP-2 +++ shy
MP-3 +- +shy
MP-4 +shy
MP-6 ++
MP-7 +++ shy
MP-13 ++
+++ extremely large inhibition but not complete ++ or + not complete inhibition
Radioactive and Stable Isotope Feedings
To prepare for a 13C-feeding the incorporation of glucose or glycerol as
a carbon source was tested [U- 14C]D- Glucose and [U-14C]glycerol were fed to
separate cultures of MC2 at 24 48and 72 h after the inoculation of the
production media The addition of both labeled glucose and glycerol was
accompanied with 1 g of unlabeled compound to observe the effect on the
production of the target metabolites The addition of both compounds
decreased the production of UV16A and UV16B1UV16B2 while it did not affect
the production of UV16C The incorporation of 14C from either glucose or
glycerol in various metabolites was similar 008 - 012 in UV16B1UV16B2
and 011 - 017 in UV16C Glucose was chosen over glycerol for the stable
22
isotope feeding experiment because it has the advantage of showing longer
units
[U-13C6]D-Glucose was fed along with [U-14C]D-Glucose to one liter of
MC2 cultures using the same feeding strategy used for the radioactive feeding
The crude extract (298 mg) was chromatographed by the usual method
Buffered silica chromatography yielded 175 mg of pure UV16B1UV16B2
mixture with 0048 14C incorporation The incorporation of the radioactive
label in UV16A was 0013 However since the mass of this metabolite was
only 16 mg the 13C NMR spectrum showed a highly 13C enriched sample On
the other hand UV16C had a 0034 incorporation but due to high amount
(116 mg) produced the level of 13C enrichment shown in the 13C NMR spectrum
was low
UV16A Structural Studies
UV16A was separated from a minor green metabolite having similar Rf
on silica gel TLC by chromatographing the fraction enriched in UV16A on a
Sephadex LH-20 column and eluting with dichloromethane- methanol (11)
The infrared spectrum of the pure UV16A with strong absorption at 1629 1669
cm-1 representing quinone carbonyl stretches was not surprising since its
UVNis spectrum resembles that of ketoanhydrokinamycin 15 Indeed
examination of proton NMR spectrum of UV16A (Table II3) revealed the
pattern typical of the three adjacent hydrogens in the A ring of the kinamycin
skeleton [8 737 (1H d J = 86 Hz) 781 (1H t J = 82 Hz) 754 (1H d J= 72
Hz)]
23
A 1H-1H COSY spectrum revealed another AMX spin system at 6 71
(1H d J=84 Hz) 785 (1H dd J= 84 20 Hz) 808 (1H d J= 20 Hz) Single
frequency decoupling provided confirmation of this analysis From an HMQC
experiment it was deduced that two doublets at 8 315 and 390 represent
diastereotopic methylene protons that show geminal coupling of 13 Hz From
the above data part structures 21 and 22 were defined
710 H
781
737
OH 0 H 808
21 22
These two part structures left unassigned signals for one methyl at 8
13 the diastereotopic methylene one aromatic and one exchangable proton
at 8 800 There was also a very broad hump in the region of 11-12 ppm that
was not accounted for Due to the poor solubility of UV16A a decent natural
abundance 13C NMR spectrum was never obtained Some of the 13C chemical
shifts were observed indirectly through HMBC and HMQC NMR experiments
The results will be discussed later
The solubility of the UV16A metabolite was so low that a small sample
of - 2 mg would precipitate in 05 mL of DMSO at 323 K in the NMR tube as light
orange needles To modify the quality of the crystal a super-saturated solution
(- 2 mg of material in 05 mL of DMSO heated to - 90 degC) was slowly cooled
over a 48 h period in a low-form Dewar flask filled with hot water The collected
crystals were suitable for X-ray diffraction A single crystal X-ray diffraction
24
analysis provided the total structure 2 The ORTEP plot is shown in Figure
112
NH2
OH 0 OH
2
(1
CS U -----Ai 4 100 11v- 4
00---5- shyNor -fir0--
II
e
Figure 112 ORTEP Drawing from Single-Crystal X-ray Structure Determination of UV16A Hydrogens have been omitted for clarity
25
Table 113 NMR Spectral Data of UV16A
1H 13CNo Jcc (Hz)
1 1926 C 527
2 (315 39) 2H d J= 13Hz 515 CH2
3 743 C 375
4 1571 C 557
4a C
5 81 1H s 1175 CH 686
6 1625 C 702
6a C
7 1900 C 557
7a 1159 C 650
8 1607 C 646
9 737 1H d J= 86 Hz 1240 CH 570
10 781 1H t J= 82 Hz 1376 CH 569
11 754 1H d J= 72 Hz 1187 CH 614
11a 1350 C 612
12 1826 C 532
12a C
12b C
13 13 3H s 207 CH3 375 1 1667 C
2 1290 C
3 808 1H d J= 20 Hz 1270 CH 4 1320 C
5 1480 C 6 710 1H d J= 84 Hz 1163 CH
7 785 1H dd J= 84 20 Hz 1314 CH
1-NH2 800 2H br exchangable
6 -OH 11-12 br exchangable
8 -OH 11-12 br exchangable
The enrichment is very low and Jcc could not be measured 13C chemical shift could not be identified by HMBC experiment
The HMQC data were collected using the following acquisition
parameters DO = 3 ps D1 = 20 s SI1 = 512 word SI2 = 2048 word The data
were acquired in 192 experiments of 96 scans each
79
0Heteronuciear Multiple Bond on AC
This data set was collected using the following parameters DO = 3 gs D1
= 20 s D2 = 33 ms S1 = OH D4 = 005 s SI1 = 512 word SI2 = 2048 word
The data was acquired in 128 experiments of 176 scans each
Fast Atom Bombardment Mass Spectrometry (FAB)
Samples of A UV16B1 or UV16B2 were dissolved in 3-nitrobenzyl
alcohol matrix Sample ion fragments were generated by FAB source
generated from Ze gas 8 keV
Radioisotope Feeding Studies
fkl14-C1D-Glucose
A 25 mL aqueous solution of D- [U- 14C]glucose (429 X 107 dpm sp act=
10-15 mCi mmol-1) was fed to 5 - 200 mL cultures in 3 pulses 24 h apart 10 mL
of the labeled glucose solution was sterile filtered into 24 h cultures 75 mL of
the same solution was subsequentely administered via sterile filter at 48 and 72
h Each time the same volume of 4 unlabeled D-Glucose solution was added
to the cultures The 8 day cultures were harvested to give -900 mg of crude
extract Subsequent purification of 1618 mg of the crude extract on buffered
silica column yielded a 49 mg fraction containing UV16A UV16B1 and
UV16B2 which retained 0014 of the fed radioactivity Further purification of
80
the UV16C containing fraction on a C-18 column yielded 70 mg of pure UV16C
which retained 002 of the fed radioactivity
at14C)Glycerol
The above procedure was used to feed [U-14C]Glycerol (443 X 107 dpm
sp act = 5 - 10 mCi mmol-1) along with 1 g of unlabeled glycerol to 5 - 200 mL
cultures The 8 day cultures were harvested to give 755 mg of crude extract
Purification of 100 mg of the crude extract yielded 33 mg of UV16B1UV16B2
mixture which retained 0016 of the fed radioactivity
Stable Isotope Feeding Studies
e
Fermentation conditions for this experiment were identical to those
outlined above Feedings were administered to 5-200 mL cultures contained in
1 L Erlenmeyer flasks One gram of [U- 13C6JD- Glucose (98+ enriched) was
dissolved in 25 mL of Milli-Q water and administered as 75 75 and 10 mL at
24 48 and 72 h after inoculation respectively Simultaneously a total of 427 X
107 dpm of [U-74CJD-Glucose was fed in the same volumes The 7 day cultures
were harvested and subsequent purification yielded 175 mg of a
UV16B1UV16B2 mixture 16 mg of UV16A and 116 mg of UV16C
81
Bibliography
1 Cone M C Hassan A M Gore M P Gould SJ Borders D B Alluri M R Detection of Phenanthroviridin Aglycone in a UV-Mutant of Streptomyces murayamaensis J Org Chem 1994 59 1923-1924
2 Arcamone F Franceschi G Penco S Adriamycin(14-Hydroxyshydaunomycin) A Novel Antitumor Antibiotic Tetrahedron Lett 1969 1007-1010
3 Ayukawa S Umezawa H Inhibition of Dopamine 13 - Hydroxylase by Aquayamycin J Antibiot 1968 21 354-357
4 Omura S Nakagawa A Fukamachi N Miura S Takahashi Y Komiyama K Kobayashi B OM-4842 A New Platelet Aggregation Inhibitor from Streptomyces J Antibiot 1988 812-813
5 Roher J Theiricke R Anglucycline Group Antibiotic Natural Product Reports 1992 9 103-137
6 Ito S Matsuya T Omura S Otani M Nakagawa H Takeshima H lwai Y Ohtani M Hata T A New Antibiotic Kinamycin J Antibiotics 1970 23 315-317
7 HataT Omura S Iwai Y Nakagawa A Otani M Ito S Masuya T A new antibiotic Kinamycin Fermentation Isolation Purification and Properties J Antibiot 1971 24 353-359
8 Omura S Nakagawa A Yamada H Hata T Furusaki A Watanabe T Structure and Biological Properties of Kinamycin A B C D Chem Pharm Bull 1973 21 931-940
9 Furusaki A Matsui M Watanabe T Omura S Nakagawa A Hata T The Crystal and Molecular Structure of Kinamycin C p -Brompbenzoate Isr J Chem 1972 10 173-187
10 Gould S J Tamayo N Melville C R Cone M C Revised Structure for the Kinamycin Antibiotics 5-Diazobenzo[b]fluorenes Rather Than
82
Benzo[b]carbazole Cyanamides J Am Chem Soc 1994 116 2207shy2208
11 Mithani S Weeratunga G Taylor N J Dmitrienko G I The Kinamycins are Diazofluorenes and not Cyanocarbazoles J Am Chem Soc 1994 116 2209-2210
12 Sato Y Gould S J Bioaynthesis of Kinamycin D Incorporation of [ 12shy13C] Acetate and of [ 2-2H3 1-13C] Acetate Tetrahedron Lett 1985 26 4023-4026
13 Sato Y Gould S J Bioaynthesis of Kinamycin Antibiotics by Streptomyces murayamaensis Determination of the Origin of Carbon Hydrogen and Oxygen Atoms by 13C NMR Spectroscopy J Am Chem Soc 1986 108 4625- 4631
14 Seaton P J Gould S J Kinamycin Biosynthesis Derivation byExcision of an Acetate Unit from a Single- Chain Decaketide Intermediate J Am Chem Soc 1987 109 5282
15 Verrall M S Discovery and Isolation of Microbial Products Ellis Norwood London 1985
16 Luckner M Secondary Metabolism in Microorganisms Plants and Animals 2nd Edition Spronger-Verlag Berlin 1984
17 Cone M C Seaton P J Halley K A Gould S J New Products Related to Kinamycin from Streptomyces murayamaensis I Taxonomy Production Isolation and Biological Properties Antibiot 1989 42 179shy188
18 Seaton P J Gould S J New Natural Products Related to Kinamycin from Streptomyces murayamaensis II Structure of Prekinamycin Ketoanhydrokinamycin and Kinamycin E and F J Antibiot 1989 42 189- 197
19 Melville C R unpublished results
83
20 Hopwood D A Sherman D H Molecular Genetics of Polyketides and its Comparison to Fatty Acid Biosynthesis Ann Rev Genet 1990 24 37-66
21 Rudd B A M Hopwood D A J Gen Microbiol 1979 114 35
22 Cone M C Melville C R Gore M P Gould S J Kinafluorenone a Benz[b]fluorenone Isolated from the Kinamycin Producer Streptomyces murayamaensis J Org Chem 1993 58 1058-1061
23 Hopwood D A 1986 Cloning and Analysis of Antibiotic Biosynthetic Genes in Streptomyces In Biological Biochemical and Biomedical Aspects of Actinomycetes ed G Szabo S biro M Good Fellow pp 3shy14 Budapest Akademiai kiado
24 Robinson J A Enzymes of Secondary Metabolism in Microorganism Chem Soc Review 1988 17 416-418
25 Strohl W R Bartel P L Li Y Connors N C Woodman R H Expression of Polyketide Biosynthesis and Regulatory Genes in Heterologous Streptomycetes J Ind Microb 1991 7 163-174
26 Bar let P L Zhu C Lampel J S Dosch D C Connors N C Strohl W R BealeJr J M Floss H G Biosynthesis of Anthraquinone by Interspesies Cloning of Actinorhodin Biosynthesis Genes in Streptomycetes Clarification of Actinorhodin Gene Functions J Bact 1990 172 4816- 4826
27 Sherman D H Malpartida F Bibb M J Kieser H M Bibb M J Hopwood D A Structure and deduced function of the granaticinproducing polyketide synthase gene cluster of Streptomyces violaceoruber Tu22 EMBO 1989 8 2717-2725
28 Sato Y Kohnert R Gould S J Application of Long Range 1H13C Heteronuclear Correlation Spectroscopy (LR HETCOSY) to Structure Elucidation The structure of Murayaquinone Tetrahedron Lett 1986 27 143
29 Tanabe M Suzuki KDetection of C-C Bond Fission during the Biosynthesis of the Fungal Triprenyl phenol Ascochlorin using [12shy13C]Acetate J Chem SocChem Commun 1974 445-446
84
30 McInnes A G Smith D G Walter J A Vining L C Wright J L C New Techniques Biosynthetic Studies using 13C Nuclear Magnetic Resonance Spectroscopy The Biosynthesis of Tenellin Enriched from Singly and Doubly LabelledPrecursor J Chem SocChem Commun 1974 282
31 Seto H Sato T Yonehara H Utilization of Carbon-13-Carbon-13 Coupling in Structural and Biosynthetic Studies An Alternate Double Labeling Method J Am Chem Soc 1973 95 8461
32 Cane D E Rossi T Tillman A M Pachlatko J P Stereochemical Studies of Isoprenoid Biosynthesis Biosynthesis of Pentalenolactone from [U- 13C6]Glucose and [6- 2H2]Glucose J Am Chem Soc 1981 103 1838
33 Hornemann U Kehrer J P Eggert J H Pyruvic Acid and D-Glucose as Precursors in Mitomycin Biosynthesis by Streptomyces verticillatus J Chem Soc Chem Commun 1974 1045-1046
34 Haber A Johnson R D Rinehart K L Jr Biosynthetic Origin of the C2 Unit of Geldanamycin and Distribution of Label from D[6-13Cplucose J Am Chem Soc 1977 99 3541-3544
35 Rinehart K L Jr Potgieter M Delaware D L Seto H Direct Evidence from Multiple 13C Labeling and Homonuclear Decoupling for the Labeling Pattern by Glucose of the m-Aminobenzoyl (CAN) Unit of Pactamycin J Am Chem Soc 1981 103 2099-2102
36 Gould S J Cane D E Biosynthesis of Streptonigrin from [U- 13C6] -D-Glucose Origin of the Quinoline Quinone J Am Chem Soc 1982 104 343-346
37 Cone M C Research Report Culture Techniques for Streptomyces murayamaensis Screening of S murayamaensis UV and NTG Survivors 389
38 Cone M C Research Report Metabolites of Streptomyces murayamaensis Strain UV16 292
39 Gore M P Gould S J Weller D D Synthesis of Putative Intermediates in the Biosynthesis of the Kinamycin Antibiotics Total Synthesis of
85
Phenanthroviridin Aglycone and Related Compounds J Org Chem 1992 57 2774-2783
40 Gore M P Gould S J Weller D D Total Synthesis of Phenanthroviridin Aglycone The First Naturally Occurring Benzo[b]phenanthridine J Org Chem 1991 56 2289-2291
41 Ayer S W McInnes A G Thibault P Walter J A Doull J L Parnell T Vining L CJadomycin a Novel 8H-Benz[b]oxazolo[32shytjphenanthoviridine Antibiotic from Steptomyces venezuelae ISP5230 Tetrahedron Lett 1991 32 6301-6304
42 Doull J L Ayer S W Singh A K Thibault P Production of A Novel Polyketide AntibioticJadomycin B By Streptomyces venezuelae Following Heat Shock J Antibiot 1993 46 869-871
43 French JC at Warner - Lambert Company Unpublished results
44 Mathews C K van Hold K E Biochemistry The BenjaminCummings Publishing Company 1990 pp 730-731
45 Claydon N Frederick G Metabolic Products of Entomophthora virulenta J Chem Soc Perkin Trans I 1978 171-173
46 Jaime C Ortuno R M Font J Di- and Trisubstituted y-Lactones Conformational Study by Molecular Mechanics Calculations and Coupling Constant Analysis J Org Chem 1986 51 3946-3951
47 Sakai R PhD Thesis University of Illinois Urbana 1991 106-118
48 Hornemann U Personal Communications
49 Molecular Structure Corporation TEXSAN 1988 MSC 3200A Research Forest Drive The Woodlands TX 77381
50 CarneyJ work done at University of Illinois
86
51 Sahm D F Washington J A H Antibacterial Susceptibility Tests Dilution Methods In Manual of Clinical Microbiology 5th ed Ballows AHausler W J Jr HermannK L lsenburg H D Eds Am Soc for Microbiology Washington D C 1991 pp 1105-1116
87
Appendix 1
Expansions of 500 MHz HMBC Spectrum of UV16B2
Figure A1 Expansion 1 of the 500 MHz HMBC Spectrum of B2
40
(H3-1 4C-1 2)4_
50 o
E 60
Q WINSIZZNer $
E a
10 o
80
I
10 095 09 ppm
085
I
08 075 07
Figure A2 Expansion 2 of the 500 MHz HMBC Spectrum of B2
F 1111111111-ill-It 17 16 13 14 13 12 11
ppm
Figure A3 Expansion 3 of the 500 MHz HMBC Spectrum of B2
EF
-40 Z=M (H2-13C-12)
O lt7
30
O (H3-19C-2) C011
60 - cq
Cz)
I I I I I 1 I 1II II 17 16 15 14
ppm
Figure A4 Expansion 4 of the 500 MHz HMBC Spectrum of B2
0
0
- 3 165 shy
00 0 00 -
0 170
_-shy41111 _-------- -
175 shy(H-21C-111
00
n180 I I I
18 17 16 15 14 1213 11 ppm
Figure A5 Expansion 5 of the 500 MHz HMBC Spectrum of B2
10
(H-12C-14)
15
(H-1 2C-21)
y
20
E ta
25
30 (H-6C-16)
(H-1 2C-1 3)
35
Iii 1 i 1
27 26 23 24 23 22 21 20 ppm
Figure A6 Expansion 6 of the 500 MHz HMBC Spectrum of B2
35
40
45 ---
50 - Si
-55
o 0
60
65
70 - 0
1 I I
r r I rui
I I I r r -1 11-1
40 38 36 34 32 30 28 26 24 22 ppm
Figure A7 Expansion 7 of the 500 MHz HMBC Spectrum of B2
i I 1111111r 29 28 27 25 24 23 22
ppm
Figure A8 Expansion 8 of the 500 MHz HMBC Spectrum of B2
10
15 O (H-3C-191 0
20 (H-7C-204)
E n o
25
30 o
35
57 55 53 51 49 ppm
Figure A9 Expansion 9 of the 500 MHz HMBC Spectrum of B2
r 47
35
40 shy
45 shy
50
55 shyE Q
60
65
70 shy(H-2C-3)
75 shy
53 51 ppm
Figure A10 Expansion 10 of the 500 MHz HMBC Spectrum of B2
(H-2C-22)
Ishy- 3
165
(H-3C-1) ca
170
175
(H-TC11) N
180
57 55 53 51 49 47 ppm
Figure A11 Expansion 11 of the 500 MHz HMBC Spectrum of B2
35 U
40
0
0 0
45
50
7 0
0
55
0 ca
CO (-NHC-21 0
60
65 7
0
C
70
75
93 91 89 87 85
I I
ppm 83
I
81
I
79 77 75
Figure A12 Expansion 12 of the 500 MHz HMBC Spectrum of B2
120
0 0
0
0130 - 0 C) (H-7C-3)
c(H-3C-7)
0
0 00
140
(H-3C-4) (15
CJ
(Chr 8858 8 1368)
(H-6C-2)
(H-6C-4)
150 shy
(H-3C-5) 0 (H-7C-5) (1)
C
C
160
93
Ishy
91
1 1
89 87
-1
85
A 83
ppm 81 79 77 75
Figure A13 Expansion 13 of the 500 MHz HMBC Spectrum of B2
0 0
0 0 0
120
0
0
130
(
(H-3C-7)
H-3C-4)
140
(Chr 8856 8)368)0 0 0
150 shy 0
0
(H-3C-5) 0 o
(Chr 8828 81453)
160 -(-NHC-22) 0Q)
170 -0
(-NHC-11) oo
(H-3C-1)0 0 (H-7C-1)
180 -1
100 I
95 1
90 I
ppm
t 85
(Chr 8828 81766)
80 75
Figure A14 Expansion of the 500 MHz HMBC Spectrum of B2 at 368 K