Page 1
84
EC Technical Assistance to the Government of Greenland
AWP report Annexes
ANNEX 1: The yearly budget allocations and projections 2006-2014 in the overall education sector (Million Euros) ______________________________ 85
ANNEX 2: Focal Areas Expenditure _______________________________________________________________________________________________ 86
ANNEX 3: Terms of reference for GEP ____________________________________________________________________________________________ 90
ANNEX 4: Description of the 17 Agreed Indicators ___________________________________________________________________________________ 95
ANNEX 5: Weight for the variable tranche _________________________________________________________________________________________ 107
ANNEX 6: List of targets established for 2012 ______________________________________________________________________________________ 111
Page 2
85
ANNEX 1: THE YEARLY BUDGET ALLOCATIONS AND PROJECTIONS 2006-2014 IN THE OVERALL EDUCATION SECTOR (MILLION EUROS)
The Education Medium-Term Expenditure Framework 2012-2015
MEDIUM TERM EXPENDITURE FRAMEWORK 2012-2015
(in million €) Exp. 2011
F.A 2012
B.P 2013
B.P 2014
B.P 2015
2011-2015
2011-2015
Total Budget 871,1 881,6 874,9 843,8 844,7
Of which education budget: Base GEP Total Base GEP Total Base GEP Total Base GEP Total Base GEP Total GEP Total
EXPENDITURE
Elementary Education 17,4 3,3 20,7 17,5 3,6 21,0 16,9 3,4 20,3 16,8 3,4 20,2 16,7 3,4 20,1 17,1 102,4
High School Education 23,4 4,4 27,8 23,4 5,2 28,6 22,6 5,6 28,2 22,5 5,8 28,3 22,4 6,1 28,4 27,1 141,3
Vocational Education and Training* 35,8 22,5 58,3 35,9 21,7 57,6 34,6 24,2 58,9 34,5 24,8 59,2
34,3
25,2 59,4 118,3 293,4
Higher Education 33,4 5,2 38,6 33,5 5,8 39,2 32,3 5,6 37,9 32,2 5,8 38,0 32,0 5,8 37,7 28,1 191,4
Buildings: Institutions 1,3 5,0 6,3 1,3 3,3 4,6 1,3 2,7 3,9 1,3 0,0 1,3 1,2 0,0 1,2 11,0 17,4
Buildings: Dormitories 6,8 11,8 18,7 6,8 10,6 17,5 6,6 7,2 13,8 6,6 1,3 7,9 6,5 1,3 7,9 32,3 65,7
Reserve (GEP Fund) 0,0 0,0 0,0 0,0 0,2 0,2 0,0 0,7 0,7 0,0 10,2 10,2 0,0 16,1 16,1 27,2 27,2
Total education budget: 118,1 52,2 170,4 118,4 50,4 168,7 114,3 49,4 163,7 113,9 51,3 165,1 113,1 57,8 170,9
Education in % of Total budget 19,6 19,1 18,7
19,6
20,2
FINANCING
Danish Government Sector Prgr. 0,0 0,0 0,0 0,0 0,0
EU Sector Budget Support FT 80% 21,8 21,8 21,4 21,4** 21,4 107,8
EU Sector Budget Support VT 20% 5,5 5,5 5,4 5,4** 5,4 27,2
Labour Market Contributions 7,6 7,6 7,6 7,6 7,6 38,0
EC SBS in % 16,2% 16,5% 16,5% 16,5% 16,5%
Source: The Finance Act of 2012 and Treasury Accounts 2011 (Exp. 2011). Explanations: "Base" is the original budget projections allocated to the overall education sector prior to the 2004 reform.
* Note: "Vocational Education and Training" includes skills training courses. **Note: The amount of the Budget support for 2014 and 2015 will depend on a new agreement between the
EU and Greenland.
Page 3
86
ANNEX 2: FOCAL AREAS EXPENDITURE
Initiatives Focal Area F.A.2011 (€) Exp 2011 (€) B.P. 2012 B.P. 2013 B.P.2014 B.P.2015
Development of Pilot Projects (GU-reform) 1 0,5 0,5 1,2 0,9 1,1 1,4
50 more apprentices starting pr. Year 1 0,3 0,2 0,1 0,1 0,1 0,1
School training places for double-year school leavers 2008 1 1,8 0,5 0,5 1,3 1,3 1,3
Tilskud til drift af efterskole i Grønland 1 0,9 0,9 0,0 0,0 0,0 0,0
Bridge building: Expansion of the continuation school quota 1 0,0 0,0 0,0 0,0 0,0 0,0
Inerisaavik ”The Good School” 1 0,5 0,5 0,5 0,5 0,5 0,5
1 year high school course in Nuuk 1 0,5 0,5 0,5 0,5 0,5 0,5
1 add. track at the high school in Nuuk from 2006 1 0,5 0,5 0,7 0,9 0,9 0,9
1 add. track at the high school in Qaqortoq from 2008 1 0,5 0,5 0,6 0,7 0,7 0,7
1 add. track at the high school in Aasiaat from 2008 1 0,5 0,5 0,9 1,2 1,2 1,2
2 add. tracks at the high school in Nuuk from 2008 1 0,9 0,9 0,9 0,9 0,9 0,9
Running costs of INUILI 1 0,1 0,1 0,1 0,1 0,1 0,1
1 add. track to the technical high school programme from 2008 1 0,5 0,5 0,5 0,5 0,5 0,5
1 Total 7,2 5,8 6,4 7,7 7,9 8,2
Initiatives Focal Area F.A.2011 (€) Exp 2011 (€) B.P. 2012 B.P. 2013 B.P.2014 B.P.2015
Development and improvement of language skills 2 0,1 0,0 0,0 0,0 0,0 0,0
Mining and construction education 2 1,3 1,3 1,3 1,3 1,3 1,3
National competency courses 2 3,2 3,9 3,3 3,3 3,3 3,3
Increase in the Piareersarfiit quota 2 2,3 2,2 2,3 2,3 2,3 2,3
2 Total 6,9 7,5 6,9 6,9 6,9 6,9
Page 4
87
Initiatives Focal Area F.A.2011 (€) Exp 2011 (€) B.P. 2012 B.P. 2013 B.P.2014 B.P.2015
Social sector 3 0,2 0,2 0,2 0,2 0,2 0,2
Administration programme for social workers 3 0,1 0,1 0,1 0,1 0,1 0,1
Health assistant education 3 0,0 0,0 0,3 0,3 0,3 0,3
Establishment of porter education 3 0,1 0,2 0,2 0,2 0,2 0,2
Specialisation modules 3 0,1 0,1 0,2 0,1 0,2 0,1
Team leader education (Management Academy) 3 0,1 0,1 0,1 0,1 0,1 0,1
Diploma courses for nurses 3 0,1 0,1 0,2 0,2 0,2 0,2
Dental care ancillary staff 3 0,1 0,1 0,1 0,1 0,1 0,1
Design education 3 0,3 0,3 0,4 0,4 0,4 0,4
Development and education within growth sectors 3 0,6 0,2 0,1 0,3 0,3 0,3
Increased activities in fall semester 3 0,7 1,8 0,5 0,5 0,5 0,5
Establishment of health (community) worker education 3 0,3 0,2 0,1 0,1 0,1 0,1
Continuation schools Maniitsoq og Qasigiannguit (current exp.) 3 0,0 0,0 1,6 1,4 1,4 1,4
Converting nursing education to BA programme 3 0,1 0,1 0,1 0,1 0,1 0,1
Two add tracks at ARTEK 3 0,2 0,2 0,2 0,2 0,2 0,2
Health Assistant education 3 0,0 0,0 0,2 0,2 0,2 0,2
VET schools- retention and extra 48 hours week 3 0,4 0,4 0,4 0,4 0,4 0,4
School for Fishing and Hunting 3 0,7 0,7 0,7 0,8 0,7 0,7
Meritudd.- sundhedsmedhj. til sundhedsass. 3 0,3 0,3 0,0 0,0 0,0 0,0
Adjustment of budget allocation (VET schools) 3 0,8 0,8 0,9 1,5 1,5 1,3
NI-Nuuk Management Academy 3 0,1 0,0 0,1 0,1 0,1 0,1
Increased activities-NI-Nuuk 3 0,5 0,5 0,5 0,5 0,5 0,5
Legal case administrator programme 3 0,1 0,1 0,1 0,1 0,1 0,1
Increased activities-NI-Nuuk (current exp) 3 0,0 0,0 0,0 0,0 0,0 0,0
Increased activities NI-Qaqortoq (new education - tourist guide) 3 0,0 0,0 0,1 0,1 0,1 0,1
Increased activities NI-Qaqortoq 3 0,2 0,2 0,3 0,4 0,4 0,4
Added classes health workers 3 0,2 0,2 0,2 0,2 0,2 0,2
Specialisation modules 3 0,2 0,2 0,4 0,2 0,4 0,4
New hospital porter training programme 3 0,1 0,1 0,1 0,1 0,1 0,1
Upgrade of unskilled workers 3 0,1 0,1 0,1 0,1 0,1 0,1
Extension of PI ?? 3 0,0 0,0 0,0 0,0 0,0 0,0
Engineering high school in Sisimiut - dormitory (current exp) 3 0,1 0,1 0,1 0,1 0,1 0,1
Expansion Iron & Metal School 3 0,2 0,2 0,4 0,6 0,6 0,6
Add classes in regional schools 3 0,0 0,0 0,0 0,0 0,0 0,0
Page 5
88
Decentralized education of social workers( Nuuk, Sisimiut, Ilulissat) 3 0,9 0,5 0,6 0,6 0,6 0,6
Extension of social worker education (SPS) 3 0,5 0,3 0,6 0,6 0,6 0,6
Language school, Nuuk branch 3 0,1 0,1 0,1 0,1 0,1 0,1
Initiatives Focal Area F.A.2011 (€) Exp 2011 (€) B.P. 2012 B.P. 2013 B.P.2014 B.P.2015
Social assistant education 3 0,0 0,0 0,2 0,2 0,2 0,2
Education programme of actors 3 0,1 0,0 0,1 0,1 0,1 0,1
3 Total 8,8 8,7 10,7 11,2 11,4 11,2
Initiatives Focal Area F.A.2011 (€) Exp 2011 (€) B.P. 2012 B.P. 2013 B.P.2014 B.P.2015
Increase in study grants due to increased intake – general 4 7,4 7,9 7,9 8,5 9,1 9,7
Increase in study grants due to increased intake because of double school leavers 2008 4 1,2 1,3 1,2 1,2 1,2 1,2
4 Total 8,6 9,2 9,1 9,7 10,3 10,9
Initiatives Focal Area F.A.2011 (€) Exp 2011 (€) B.P. 2012 B.P. 2013 B.P.2014 B.P.2015
Better guidance for reduction in drop-out rates 5 0,8 0,8 0,8 0,8 0,8 0,8
Closer links between schools and business/trades 5 0,1 0,0 0,1 0,0 0,0 0,0
Initiatives to reduce drop-out rates (Greenlandic students in Denmark) 5 0,0 0,0 0,0 0,0 0,0 0,0
5 Total 0,9 0,8 0,9 0,8 0,8 0,8
Page 6
89
Initiatives Focal Area F.A.2011 (€) Exp 2011 (€) B.P. 2012 B.P. 2013 B.P.2014 B.P.2015
Expansion of dormitory capacity in Nuuk (administration) 6 0,0 0,0 0,1 0,1 0,1 0,1
Dormitories - rental (Aasiaat) 6 0,0 0,0 0,0 0,0 0,0 0,0
School Building: Continuation School in Greenland 6 0,0 0,1 0,0 0,0 0,0 0,0
Maintainance (buildings) 6 0,8 0,7 0,8 0,8 0,8 0,8
School Building: Expansion - 2 extra tracks (Nuuk) 6 0,1 0,1 0,0 0,0 0,0 0,0
Dormitory - buildings at the coast 6 0,0 0,0 0,0 0,0 0,0 0,0
Dormitory Buildings - expansion of SPS 6 1,6 1,6 0,0 0,0 0,0 0,0
Dormitories (Nuuk) 6 3,0 8,1 2,5 3,2 0,0 0,0
Dormitories (Sisimiut) 6 2,5 2,5 1,1 0,7 0,0 0,0
Dormitories (Ilulissat) 6 0,4 0,4 1,1 1,1 0,0 0,0
Dormitory Buildings (Narsaq) 6 0,0 0,0 0,0 0,0 0,0 0,0
Dormitories (Qaqortoq) 6 1,2 1,2 1,0 0,5 0,0 0,0
Dormitory Buildings, apprentices in Nuuk 6 0,0 0,0 0,0 0,0 0,0 0,0
Dormitory Buildings, apprentices in Sisimiut 6 0,6 0,6 0,0 0,0 0,0 0,0
Dormitory Buildings, apprentices in Ilulissat 6 0,0 0,0 0,0 0,0 0,0 0,0
Dormitories (Aasiaat) 6 1,0 1,1 0,8 0,7 0,4 0,4
School Building, pre-projekt Qaqortoq 6 0,1 0,1 0,0 0,0 0,0 0,0
School Building (Nuuk) 6 3,2 3,2 2,7 0,0 0,0 0,0
School Building: Mining and Construction 6 0,0 0,0 0,5 0,0 0,0 0,0
School Building: Design education 6 0,0 0,0 0,0 0,0 0,0 0,0
Social Paedagogical School (construction) 6 0,0 0,0 0,0 0,0 0,0 0,0
School Building - Expansion INUILI 6 0,0 0,0 0,0 0,0 0,0 0,0
School Building (Aasiaat) 6 0,7 0,7 3,3 2,7 0,0 0,0
6 Total 15,0 20,1 14,0 9,8 1,3 1,3
Initiatives Focal Area F.A.2011 (€) Exp 2011 (€) B.P. 2012 B.P. 2013 B.P.2014 B.P.2015
To new AC clerk positions for GEP 7 0,1 0,1 0,3 0,4 0,4 0,4
Day care reform (The Good Day Care Institution) 7 0,8 0,8 0,6 0,7 0,7 0,7
Informations and campaigns (influencing attitudes) 7 0,1 0,1 0,1 0,1 0,1 0,1
Development projects (Mobile task force etc.) 7 0,5 0,9 0,3 0,3 0,3 0,3
Development projects (Recruitment centres) 7 0,1 0,1 0,1 0,1 0,1 0,1
ICT and E-learning- running costs + Dev. 7 0,7 0,5 0,7 0,7 0,7 0,7
ICT and E-learning- running costs + Dev. 7 0,1 0,1 0,1 0,1 0,1 0,1
7 Total 2,5 2,7 2,2 2,4 2,4 2,4
Page 7
90
ANNEX 3: TERMS OF REFERENCE FOR GEP
Ilisimatitsissut Memorandum
Uunga
To
The planning steering committee for the education
programme
Assinga uunga
Copy to
The strategic steering committee for the education
programme
Terms of reference for the education programme (the sector programme and the
extraordinary education initiative) – updated December 2010
Update
The background for the present updating of the terms of reference for the education programme is a
number of departmental changes since the terms of reference were adopted. In addition, as the
education programme has now been functional, an amendment seems to be necessary if all relevant
parties to the work to be performed in connection with the education programme are to
have influence.
Background
During the last 30 years Greenland’s education system has been extensively developed.
Right now only between 40 and 50 per cent of a youth year-group complete a qualifying
programme of education, which is not enough. From an international point of view, these
figures are low, and the situation will create problems in relation to benefiting from the
opportunities and meeting the challenges which are expected to be generated by
globalisation, and make it more difficult to fill future attractive jobs in the higher income brackets
with domestic labour. Moreover, a low level of education will result in a large residual group of
unskilled labour, who have a significantly higher risk of being affected by unemployment, and who
therefore risk constituting a major social and economic burden on the country’s limited resources.
The GoG’s contribution in the education area has been the allocation of extraordinary funds in the
budgets, and in the Political-Economic Report for 2005 it was recommended that an increasing
amount of up to DKK 400 million annually was to be reallocated to an extraordinary education and
qualification initiative for the period until 2013.
Since 2005, the education initiative via the extraordinary education initiative has been built up to a
level of about DKK 400 million. Of this amount, about 1/3 of the funds are allocated to the building
of teaching facilities and dormitories.
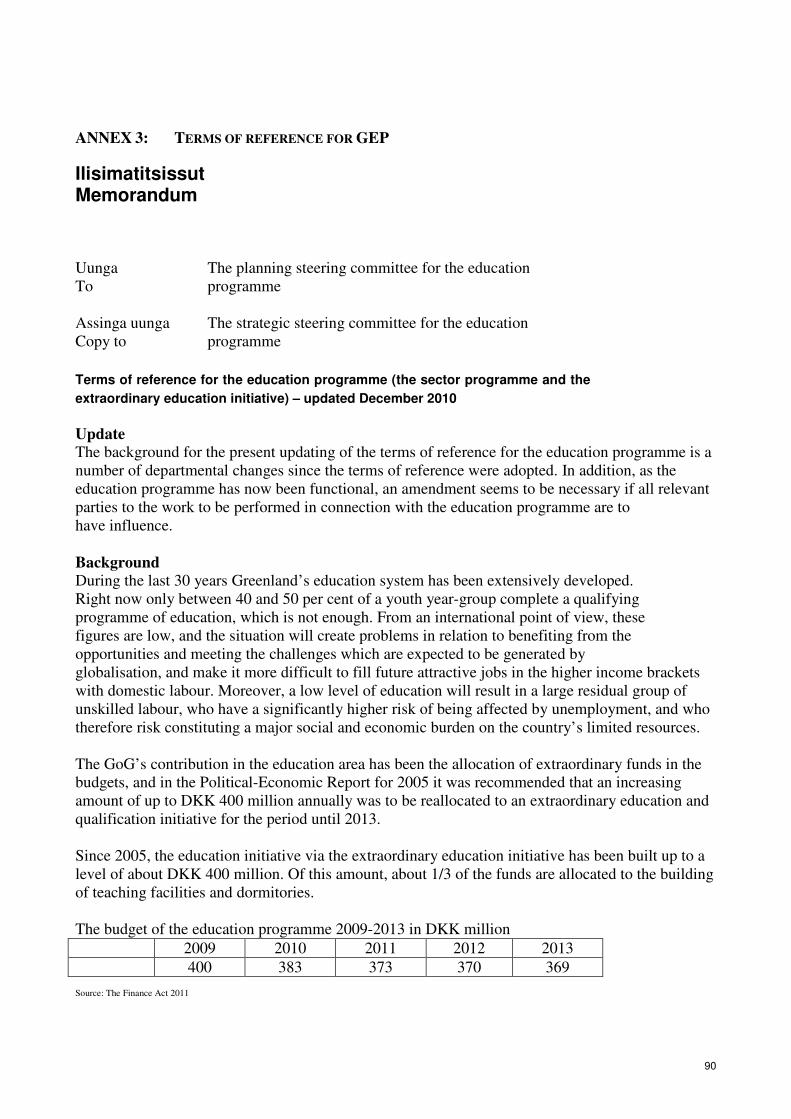
The budget of the education programme 2009-2013 in DKK million
2009 2010 2011 2012 2013
400 383 373 370 369
Source: The Finance Act 2011
Page 8
91
In 2004, a cross-directorial working group was established with two assignments: describing and
documenting the need for an extraordinary education initiative, and presenting specific and targeted
proposals for the allocation of the above-mentioned funds. The working group subsequently
presented its conclusions to Greenland’s Home Rule Government in the report “Progress through
education and development of competencies”. In this report, which was presented to Greenland’s
Parliament during the autumn session 2004, the challenge was described, and 25 initiatives were
listed whose implementation over the next decade would altogether be expected to result in a
massive increase in the qualifications of persons at the age of employment, in terms of education
and competencies.
In December 2005, based on the above, the Government drafted a concrete proposal for an
extraordinary education initiative, the so-called education programme, which was adopted by
Greenland’s Parliament during the spring session of 2006. The principal objective of the education
programme is that 2/3 of the population should have an education providing them with vocational
skills or academic qualifications, and the programme will be operative in two phases until the year
2020. These terms of reference will be replaced by new terms of reference, to be approved at
permanent under-secretary level, at the end of 2012, when the first phase comes to an end. Due to
changes in competencies in the Government departments and new initiatives, the intention is for the
amendment of the terms of reference to take effect at 1.1.2011, in order to allow for the influence of
all relevant stakeholders.
On the whole, the volume of the education programme (the sector programme and the extraordinary
education initiative) is such, both professionally and economically, that it will need to be anchored
in a steering group at permanent under-secretary level in relation to the strategic level, and on
middle management and case worker level in relation to the planning level.
The strategic steering group
Overall prioritisation and coordination of the education programme are dealt with at the strategic
level.
In relation to the superjacent political level, the strategic steering group will ensure the overriding
correlation between the political objectives and the actual implementation of the education
programme.
The strategic steering group will meet annually at the beginning of the second quarter.
The strategic steering group will have the following participants:
- The permanent secretary from the Ministry of Culture, Education, Research and the Church
(MoCERC), (Chairman)
- The permanent secretary from the Ministry of Finance (MoF)
- The permanent secretary from the Ministry of Health (MoH)
- The permanent secretary from the Ministry of Social Affairs (MoSA)
- The permanent secretary from the Ministry of Fisheries, Hunting and Agriculture (MoFHA)
- The permanent secretary from the Ministry of Industry and the Labour Market (MoILM)
- The Director of the Bureau of Minerals and Petroleum
Page 9
92
The planning steering committee
The planning steering committee is responsible for the continued control, follow-up and
coordination of the implementation of and allocations for all projects under the education
programme.
The planning steering committee is responsible, for each Parliamentary session, for a systematic
debriefing report on the status, progress and proposals to remedy any barriers for the progress of the
education programme. This is done by submitting a report during the autumn sessions that is
oriented towards the coming year, and an in-depth debriefing report on the entire preceding
calendar year during the spring sessions, anchored in the debriefing report on planning from the
autumn of that year.
In addition, the planning steering committee is responsible for providing input to the strategic
steering committee’s annual meeting.
Finally, as regards the external stakeholders (the labour market parties, the Business and
Competency Development Council, the planning steering committee, subjacent educational
institutions, the media etc.) the planning steering committee is to ensure the implementation of:
• Regular status briefings/meetings.
• Communication of the external stakeholders’ proposals/view on the projects.
• Communication of information to the media.
At the planning level, a minimum of one steering group meeting is held each quarter, with four
annual meetings.
The planning steering committee has the following participants:
• The head of department for Culture, Education, Research and the Church (MoCERC),
(Chairman)
• The head of department for Culture, Leisure, the Church and cross-cutting Initiatives
(MoCERC)
• The head of Economics, (MoCERC)
• The commissioner of the Ministry of Finance (MoF)
• A representative from the Ministry of Finance (in charge of EU cooperation) (MoF)
• A representative from the Chairman’s ministry
• A representative from KANUKOKA
• A representative from the Bureau of Minerals and Petroleum
• A representative from the Ministry of Health (MoH)
• A representative from the Ministry of Social Affairs (MoSA)
• A representative from the Ministry of Housing, Infrastructure and Transport (MoHIT)
• A representative from the Ministry of Industry and the Labour Market, (MoILM)
• A representative from the Ministry of Fisheries, Hunting and Agriculture (MoFHA)
• The education programme’s secretariat
Appointed as adviser:
• The Director of Statistics Greenland
Page 10
93
Moreover, working groups can be appointed for the continued work, in accordance with the wishes
of the steering group, on specific subjects of immediate importance prior to the decision of the
steering group.
In addition, additional representatives can be appointed as required.
The secretariat The secretariat of the education programme, and thus the daily coordination of activities under the
education programme, is in the hands of the Ministry of Culture, Education, Research and the
Church (MoCERC).
The secretariat sends out invitations to meetings as well as the agenda and the materials for the
meetings no later than one week before meetings in the planning steering committee. Any requests
to have items included on the agenda, notification of inability to attend, substitutes etc. are to be
reported to the secretariat.
The secretariat prepares the debriefing reports for the Parliament that the planning steering
committee is obliged to submit in connection with the Parliamentary sessions, and also the current
budget and activity follow-up is handled by the secretariat.
In addition, the secretariat is in charge of the administration of the partnership agreement with the
EU.
The responsibility for sector programme debriefing for the Danish Government lies with the
Ministry of Finance, with contributions from the secretariat.
Economy, budgets and budget follow-up
The overall outline of the activities under the education programme is set forth in main account
20.11.61 of the Finance Act: The education reserve.
Budgeting takes place according to the procedure in place for the Finance Act. The planning
steering committee gives priority to initiatives based on 1) the agencies’/ministries’ status regarding
current activities and the budget for the relevant financial year, and 2) a discussion document with a
description and the budget for any new initiatives. The priorities are then communicated to the
Government via the strategic level. The responsibility for the implementation of the individual
activities lies with the ministries and agencies involved.
The agencies/ministries must report regular updates and any major changes of the budget to the
secretariat, so that other projects can benefit from any reduction in spending. Additional spending is
also to be reported to and approved by the planning steering committee.
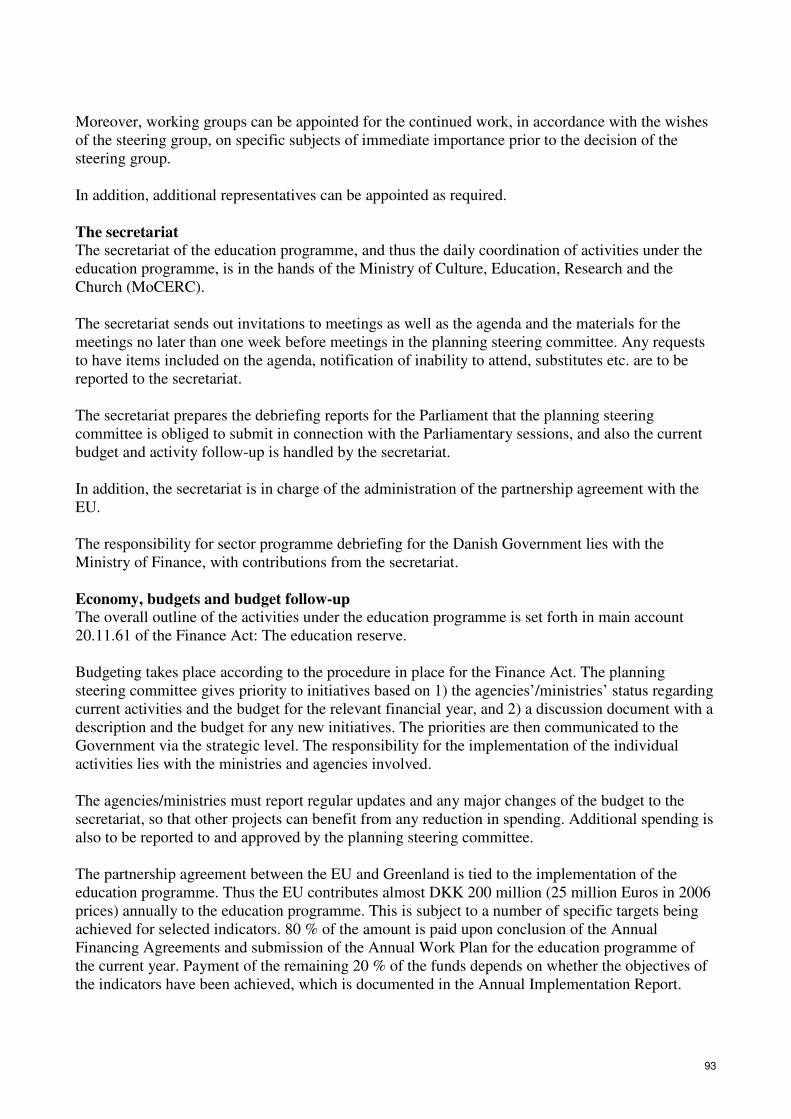
The partnership agreement between the EU and Greenland is tied to the implementation of the
education programme. Thus the EU contributes almost DKK 200 million (25 million Euros in 2006
prices) annually to the education programme. This is subject to a number of specific targets being
achieved for selected indicators. 80 % of the amount is paid upon conclusion of the Annual
Financing Agreements and submission of the Annual Work Plan for the education programme of
the current year. Payment of the remaining 20 % of the funds depends on whether the objectives of
the indicators have been achieved, which is documented in the Annual Implementation Report.
Page 11
94
Background materials
For further information on the background of the education programme, reference is made to the
following background documents:
• The report “Progress through education and competency development”, 2004.
• GoG’s education programme proposal, December 2005.
• The semi-annual debriefing reports to Parliament on the education programme.
• The agreement on the sector programme on education and business development between
the Danish Government and Greenland (2005-2007) (2008-2009).
• Political-economic report 2004, 2005, 2006, 2007, 2008, 2009 and 2010.
• The Finance Act 2005, 2006, 2007, 2008, 2009, 2010, 2011 and 2012.
Lise Lennert Olsen
Permanent Secretary
Ministry of Culture, Education, Research and the Church (MoCERC)
Page 12
95
ANNEX 4: DESCRIPTION OF THE 17 AGREED INDICATORS
Prefatory remarks
The post-graduate Greenlandic educational system is divided into:
- high school education
- vocational education and training
- higher education
Indicators showing “type of education” refer to the categories above. When relevant “higher
education” will be divided further into 1) the first cycle (bachelors’ level) including the short cycle
(academy programmes), and 2) the second cycle (masters’ level). Third cycle (doctors’ level) will
not be included because of the few numbers attending this level of education.
When "place of birth" is indicated, the address of the mother by the time of birth has been used,
since birth place relates to the city, where the birth took place and then indicates the place of
hospitals instead of the actual place of living; city, settlement and foreign. For persons born in
Greenland before 1973 no information on birth place is available.
The data is registered per 31st of December each year unless stated otherwise.
Definition of the indicators
Input indicators measure the financial resources provided and the administrative and regulatory
measures taken (for example, resources allocated, resources used, measures taken, laws passed).
The definition of inputs is very broad; covering in some cases what is often called "process
indicators".
Output indicators measures the immediate and concrete consequences of the resources used and
measures taken (for example, schools built, teachers employed, nurses trained) The definition of
output covers those goods and services "supplied", “produced” or "provided" by the public sector
with the inputs.
Outcome indicators measure the results at the level of beneficiaries (for example, gross enrolment
rates in primary schools, vaccination). The definition covers the outcomes (or results) from the use
and satisfaction of the goods and services produced by the public sector, when supply equals
demand.
Impact indicators measure the consequences of the outcomes in terms of wider objectives (for
example, literacy rates, health improvement). The definition covers the wider effects of the
outcomes but there might also be higher level impacts, related to broader objectives – growth and
income poverty, for example. In order to turn it into a net impact indicator the effect of other
educational programmes and other external effects (not related to GEP) has to be assessed and
accordingly subtracted.
Note: The matrix of the indicators describing the weight of the variable tranche is in the end of the
document.
Page 13
96
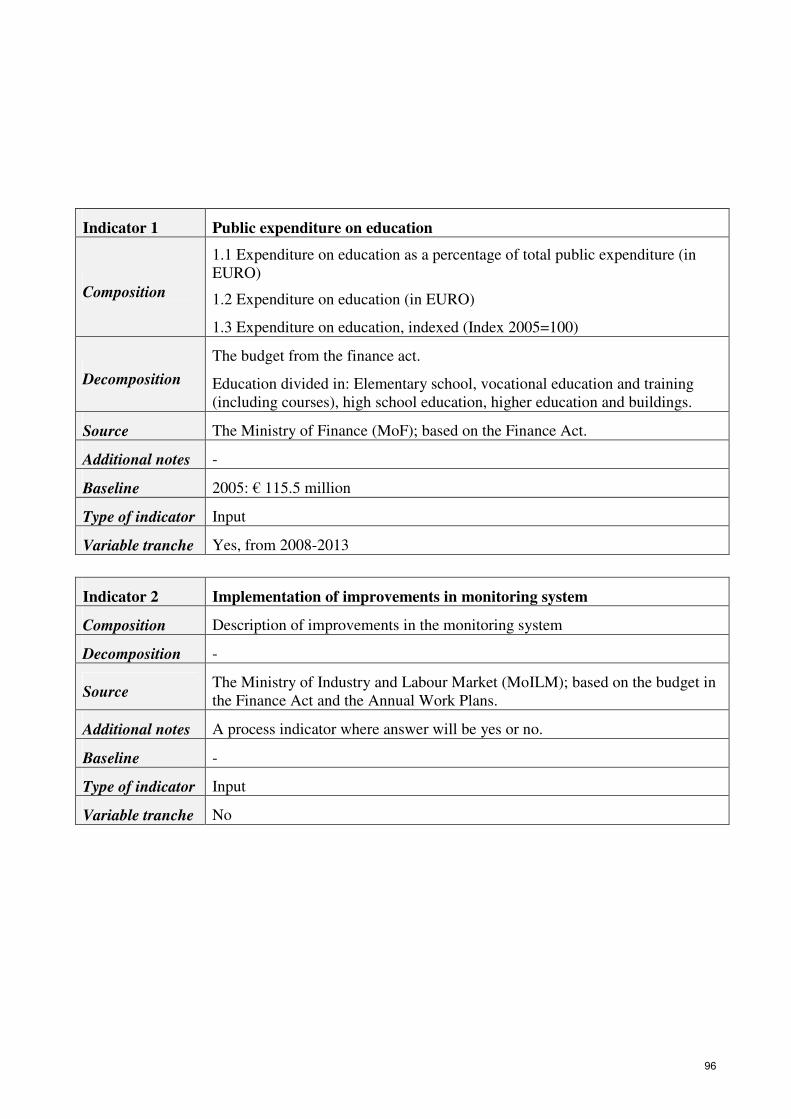
Indicator 2 Implementation of improvements in monitoring system
Composition Description of improvements in the monitoring system
Decomposition -
Source The Ministry of Industry and Labour Market (MoILM); based on the budget in
the Finance Act and the Annual Work Plans.
Additional notes A process indicator where answer will be yes or no.
Baseline -
Type of indicator Input
Variable tranche No
Indicator 1 Public expenditure on education
Composition
1.1 Expenditure on education as a percentage of total public expenditure (in
EURO)
1.2 Expenditure on education (in EURO)
1.3 Expenditure on education, indexed (Index 2005=100)
Decomposition
The budget from the finance act.
Education divided in: Elementary school, vocational education and training
(including courses), high school education, higher education and buildings.
Source The Ministry of Finance (MoF); based on the Finance Act.
Additional notes -
Baseline 2005: € 115.5 million
Type of indicator Input
Variable tranche Yes, from 2008-2013
Page 14
97
Indicator 3 Applicants
Composition
3.1 Students applying for vocational education and training (numbers and
indexed) (Index 2006=100)
3.2 Students applying for high school education (numbers and indexed) (Index
2008=100)
3.3 Students applying for higher education (numbers and indexed) (Index
2008=100)
Decomposition
By gender and age
By place of living at the time of applying (domestic divided into cities and
settlements)
Source The Ministry of Culture, Education, Research and the Church (MoCERC)
1;
based on administrative records from the local educational institutions.
Additional notes -
Baseline
2006: Vocational education and training: 1223 applicants
2008: High school education: 757 applicants
2008: Higher education: 450 applicants
Type of indicator Output
Variable tranche No
Indicator 4 Attendance
4.a Number of students attending vocational education and training and high
school education
Composition
4a.1 Students by type of education (numbers)
4a.2 Students by type of education (relative to total relevant population;
finished with elementary school)
4a.3 Students by type of education, indexed (Index 2005=100)
Decomposition
By gender and age
By place of birth (domestic divided into cities and settlements, and foreign)
By sectors for vocational education and training
Source Statistics Greenland (SG); based on the administrative records from the Study
Grant Administration.
Additional notes Relative to relevant population (1.2) is not possible 2005-2008.
Baseline 2005: 1925 students
Type of indicator Output
Variable tranche Yes, from 2008-2011
1 From 18 March 2011 Ministry of Education and Research following a reorganisation of the areas of resort
responsibilities (MOER)
Page 15
98
Indicator 4 Attendance
4.b Number of students attending skills and competence courses
Composition 4b.1 Participants by type of sector (numbers)
4b.2 Participants by type of sector, indexed (Index 2009=100)
Decomposition By gender and age
By place of birth (domestic divided into cities and settlements, and foreign)
Source Based on the administrative records from courses held, to the Ministry of
Industry and Mineral Resources.
Additional notes
Indicator measures participation to PKU-courses, which are aimed to unskilled
workers and AMA-courses, which are aimed at skilled workers. The courses
are classified according to the classification key is that of Statistics Greenland
for classifying enterprises and employment.
Baseline 2009: 875 students
Type of indicator Output
Variable tranche Yes, 2011
Indicator 4 Attendance
4.c Number of students attending higher education
Composition 4c.1 Students by type of education (numbers)
4c.2 Students by type of education, indexed (Index 2005=100)
Decomposition By gender and age
By place of birth (domestic divided into cities and settlements, and foreign)
Source Statistics Greenland (SG); based on the administrative records from the Study
Grant Administration.
Additional notes Students attending educations abroad without study grants from Greenland will
not be included. Statistics Greenland is planning to improve this with
assistance from Statistics Denmark and other relevant partners.
Baseline 2005: 775 students
Type of indicator Outcome
Variable tranche Yes, from 2008-2013
Page 16
99
Indicator 5 Apprenticeships
Composition
Number of apprenticeships in vocational education and training
5.1 Students by sector (numbers)
5.2 Students by sector, indexed (Index 2005=100)
Decomposition By gender and age
By place of birth (domestic divided into cities and settlements, and foreign)
Source Statistics Greenland (GS); based on the administrative records from the Study
Grant Administration.
Additional notes A few educations beside vocational education and training have
apprenticeships, which are not included, e.g. nurses and teachers, because they
are included within higher educations.
Baseline 2005: 1098 apprenticeships
Type of indicator Output
Variable tranche Yes, from 2008-2013
Indicator 6 Ratio of expenditure on private skills and competence courses with public
subsidies
Composition Ratio of expenditure on private skills and competence courses (with public
subsidies) related to all skills and competence courses
Decomposition -
Source The Ministry of Industry and and Labour Market (MoIaLM) based on
administrative records.
Additional notes -
Baseline 2008
Type of indicator Output
Variable tranche No
Page 17
100
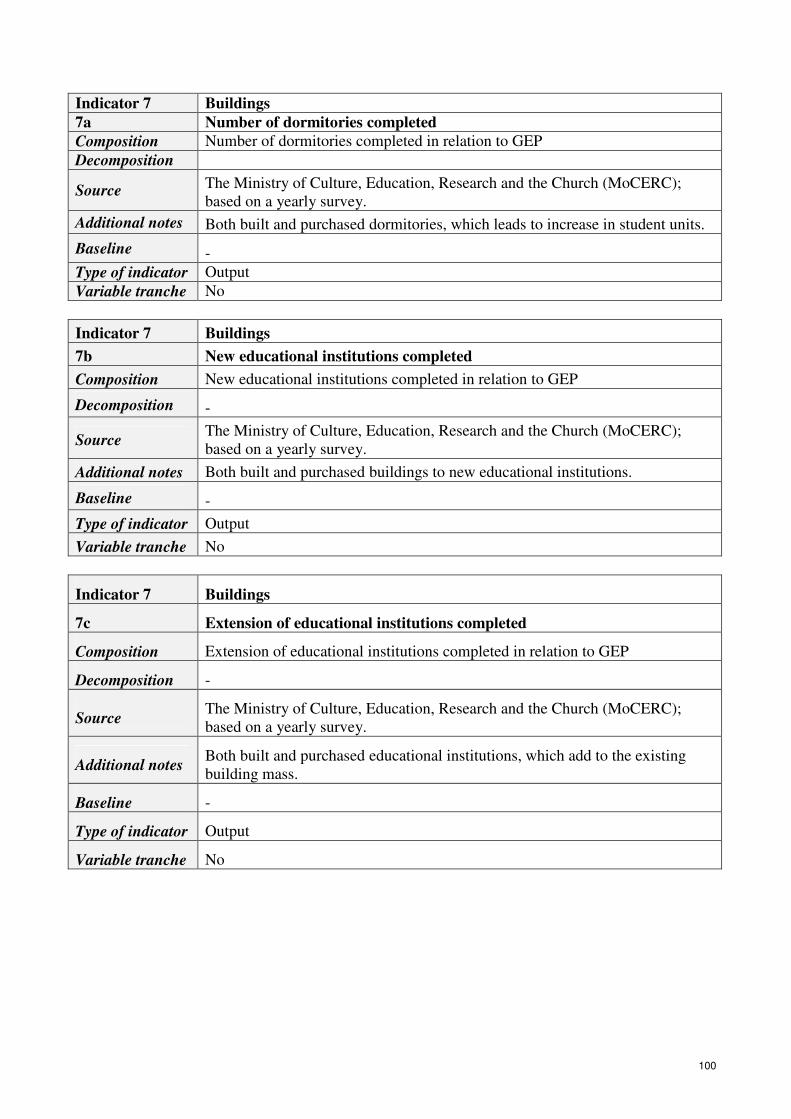
Indicator 7 Buildings
7a Number of dormitories completed
Composition Number of dormitories completed in relation to GEP
Decomposition
Source The Ministry of Culture, Education, Research and the Church (MoCERC);
based on a yearly survey.
Additional notes Both built and purchased dormitories, which leads to increase in student units.
Baseline -
Type of indicator Output
Variable tranche No
Indicator 7 Buildings
7b New educational institutions completed
Composition New educational institutions completed in relation to GEP
Decomposition -
Source The Ministry of Culture, Education, Research and the Church (MoCERC);
based on a yearly survey.
Additional notes Both built and purchased buildings to new educational institutions.
Baseline -
Type of indicator Output
Variable tranche No
Indicator 7 Buildings
7c Extension of educational institutions completed
Composition Extension of educational institutions completed in relation to GEP
Decomposition -
Source The Ministry of Culture, Education, Research and the Church (MoCERC);
based on a yearly survey.
Additional notes Both built and purchased educational institutions, which add to the existing
building mass.
Baseline -
Type of indicator Output
Variable tranche No
Page 18
101
Indicator 8 Education
Composition Share of workforce in Greenland with ISCED level 3 in percentage of total
workforce
Decomposition By gender and age
By place of birth (domestic divided into cities and settlements, and foreign)
Source
Statistics Greenland (SG); based on administrative records form The Study
Grant Administration and data collected in cooperation with Statistics
Denmark.
Additional notes
Value presents a minimum estimate for education level, and the purpose is to
obtain a valid picture of the annual development. The indicator value
underestimates the real education level of the workforce, because the used data
source records (Study Grant System) only include educations completed after
1984, and because the indicator value does not totally include those not having
received study grants.
Baseline 2008: 34.6%
Type of indicator Outcome
Variable tranche Yes, from 2011-2013
Indicator 9 Completion
Composition 9.1 Graduates by type of education (numbers)
9.2 Graduates by type of education, indexed (Index 2005=100)
Decomposition By gender and age
By place of birth (domestic divided into cities and settlements, and foreign)
Source Statistics Greenland (SG); based on the administrative records from the Study
Grant Administration.
Additional notes -
Baseline 2005: 581 graduates
Type of indicator Outcome
Variable tranche Yes, from 2008-2013
Page 19
102
Indicator 10 Repetition rates: Vocational education and training and high school
education
Composition
10.1 Repeaters attending vocational education and training and high school
education (numbers)
10.2 Repeaters attending relative to total attending students in vocational
education and training and high school education
10.3 Repeaters attending vocational education and training and high school
education, indexed (Index 2005=100)
Decomposition By gender and age
By place of birth (domestic divided into cities and settlements, and foreign)
Source Statistics Greenland (SG); based on the administrative records from the Study
Grant Administration.
Additional notes Higher education not included.
Baseline 2005: repetition rate 2.4% (47 students)
Type of indicator Outcome
Variable tranche No
Indicator 11 Dropout rates
11.a Formal education
Composition
11a.1 Dropout rate by type of education (numbers)
11a.2 Dropout rate relative to total attendance by type of education
11a.3 Dropout rate by type of education, indexed (Index 2005=100)
Decomposition By gender and age
By place of birth (domestic divided into cities and settlements, and foreign)
Source Statistics Greenland (SG); based on the administrative records from the Study
Grant Administration.
Additional notes -
Baseline 2005: drop-out rate 23.7% (639 students)
Type of indicator Outcome
Variable tranche Yes, from 2008-2013
Page 20
103
Indicator 11 Dropout rates
11.b Skills courses and competence courses
Composition
11b.1 Dropout rate by type of course (numbers)
11b.2 Dropout rate relative to total attendance by type of course
11b.3 Dropout rate by type of course, indexed (Index 2009=100)
Decomposition By gender and age
Source Based on the administrative records from courses held, to the Ministry of
Industry and Mineral Resources.
Additional notes
Indicator measures participation to PKU-courses, which are aimed to unskilled
workers and AMA-courses, which are aimed at skilled workers. The
classification key is that of Statistics Greenland for classifying enterprises and
employment.
Baseline 2009: drop-out rate 9% (75 course participants)
Type of indicator Outcome
Variable tranche Yes, from 2011-2013
Indicator 12 Job insertion
12.a Number of graduates from formal educations obtaining a job
Composition 12a.1 Graduates obtaining a job by type of education (numbers)
12a.2 Graduates obtaining a job relative to total graduates by type of education
12a.3 Graduates obtaining a job by type of education, indexed (Index
2009=100)
Decomposition By gender and age
By place of birth (domestic divided into cities and settlements, and foreign)
Source Statistics Greenland (GS); based on administrative records from tax authorities.
Additional notes The indicator measures the number of graduates, who are working the year
following graduation.
Note that graduates, who are employed abroad, will not be included. Statistics
Greenland is planning to improve this with data from Statistics Denmark.
Note that permanent job is defined as non-temporary job.
Baseline 2009: 673 graduates obtained a job (94% of the graduates)
Type of indicator Outcome
Variable tranche Yes, from 2010-2013
Page 21
104
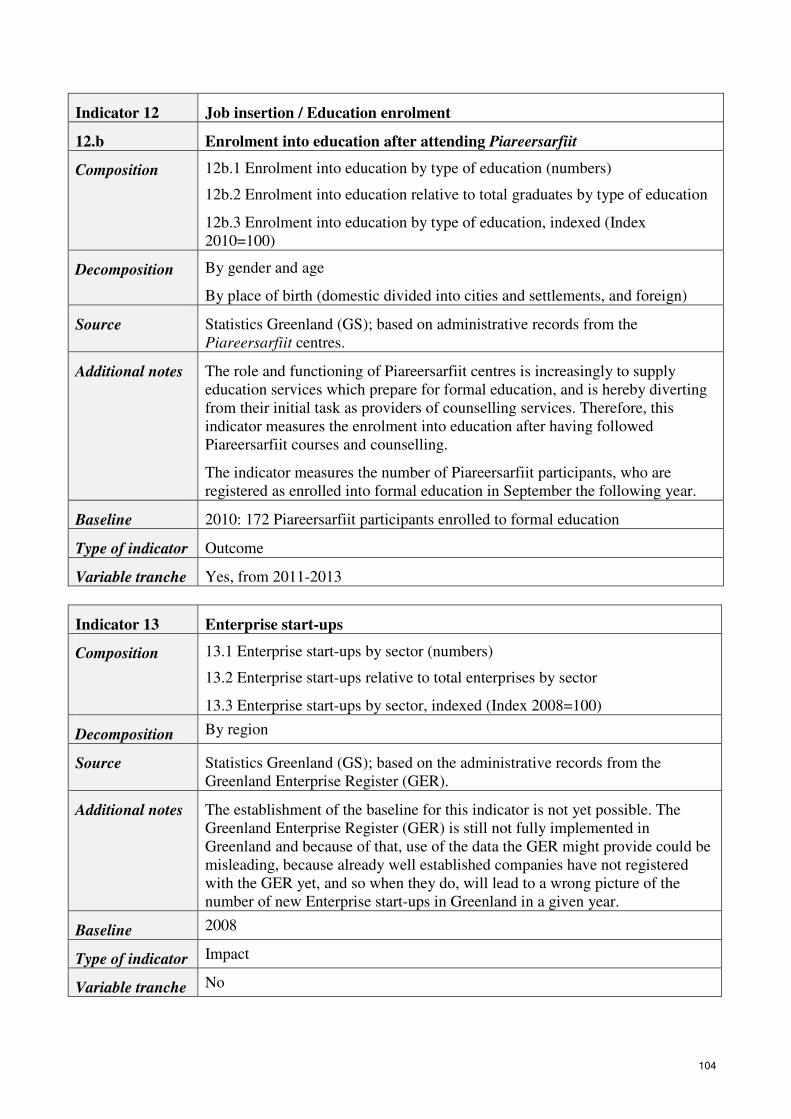
Indicator 12 Job insertion / Education enrolment
12.b Enrolment into education after attending Piareersarfiit
Composition 12b.1 Enrolment into education by type of education (numbers)
12b.2 Enrolment into education relative to total graduates by type of education
12b.3 Enrolment into education by type of education, indexed (Index
2010=100)
Decomposition By gender and age
By place of birth (domestic divided into cities and settlements, and foreign)
Source Statistics Greenland (GS); based on administrative records from the
Piareersarfiit centres.
Additional notes The role and functioning of Piareersarfiit centres is increasingly to supply
education services which prepare for formal education, and is hereby diverting
from their initial task as providers of counselling services. Therefore, this
indicator measures the enrolment into education after having followed
Piareersarfiit courses and counselling.
The indicator measures the number of Piareersarfiit participants, who are
registered as enrolled into formal education in September the following year.
Baseline 2010: 172 Piareersarfiit participants enrolled to formal education
Type of indicator Outcome
Variable tranche Yes, from 2011-2013
Indicator 13 Enterprise start-ups
Composition 13.1 Enterprise start-ups by sector (numbers)
13.2 Enterprise start-ups relative to total enterprises by sector
13.3 Enterprise start-ups by sector, indexed (Index 2008=100)
Decomposition By region
Source Statistics Greenland (GS); based on the administrative records from the
Greenland Enterprise Register (GER).
Additional notes The establishment of the baseline for this indicator is not yet possible. The
Greenland Enterprise Register (GER) is still not fully implemented in
Greenland and because of that, use of the data the GER might provide could be
misleading, because already well established companies have not registered
with the GER yet, and so when they do, will lead to a wrong picture of the
number of new Enterprise start-ups in Greenland in a given year.
Baseline 2008
Type of indicator Impact
Variable tranche No
Page 22
105
Indicator 14 GDP per capita
Composition 15.1 GDP per capita (EURO)
15.2 GDP per capita relative to EU-average (Index EU-27=100)
15.2 GDP per capita indexed (Index 2006=100)
Decomposition
Source Statistics Greenland (GS).
Additional notes The data on this indicator can only be delivered with a two years delay.
Baseline 2006: € 25.000 per capita
Type of indicator Impact
Variable tranche No
Indicator 15 Block grants and other external grants
Composition 15.1 Total external grants by origin (Denmark and EU) (EURO)
15.2 Total external grants in percentage of total public budget
15.3 Total external grants by origin (Denmark and EU) indexed (Index
2005=100)
Decomposition
Source Statistics Greenland (GS).
Additional notes The data on this indicator can only be delivered with a two years delay.
Baseline 2005: 524.253 Euro
Type of indicator Impact
Variable tranche No
Page 23
106
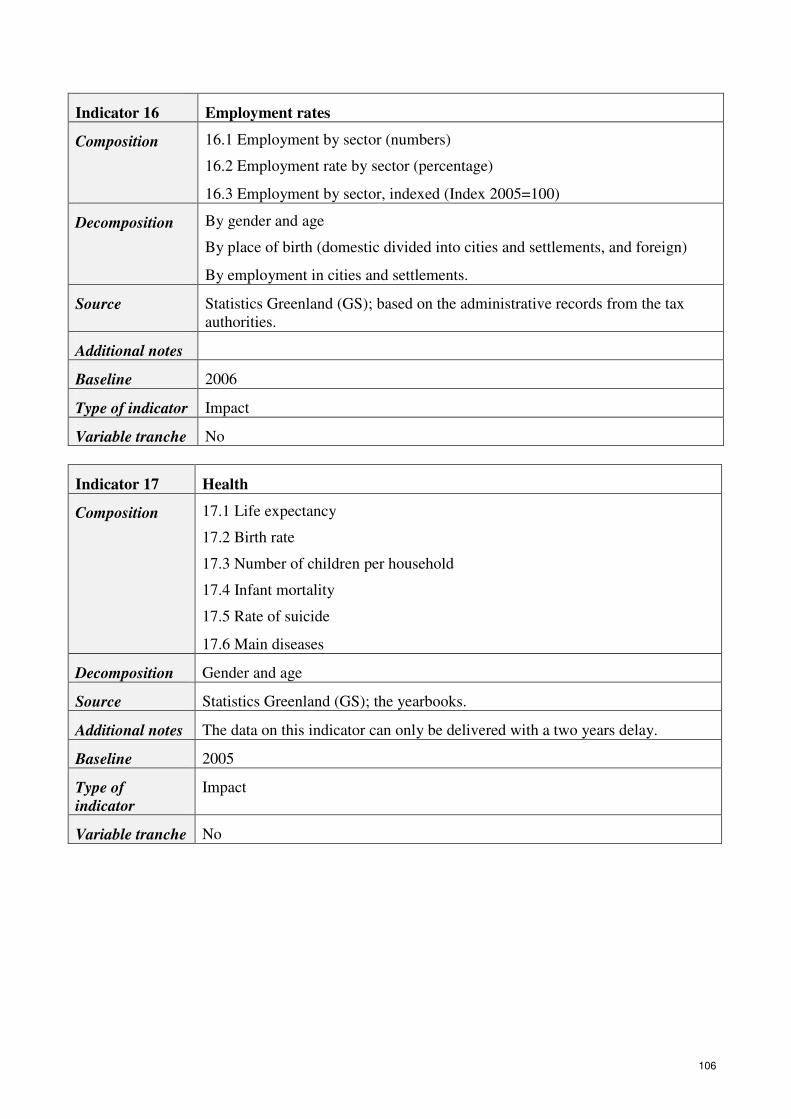
Indicator 16 Employment rates
Composition 16.1 Employment by sector (numbers)
16.2 Employment rate by sector (percentage)
16.3 Employment by sector, indexed (Index 2005=100)
Decomposition By gender and age
By place of birth (domestic divided into cities and settlements, and foreign)
By employment in cities and settlements.
Source Statistics Greenland (GS); based on the administrative records from the tax
authorities.
Additional notes
Baseline 2006
Type of indicator Impact
Variable tranche No
Indicator 17 Health
Composition 17.1 Life expectancy
17.2 Birth rate
17.3 Number of children per household
17.4 Infant mortality
17.5 Rate of suicide
17.6 Main diseases
Decomposition Gender and age
Source Statistics Greenland (GS); the yearbooks.
Additional notes The data on this indicator can only be delivered with a two years delay.
Baseline 2005
Type of
indicator
Impact
Variable tranche No
Page 24
107
ANNEX 5: WEIGHT FOR THE VARIABLE TRANCHE
No Indicator Input Output Outcome Impact
(gross)
Included in
the variable
tranche
2008 2009 2010 2011 2012 2013
1 Public expenditure on education
1.1 Expenditure on education as a
percentage of total public expenditure
(in EURO)
1.2 Expenditure on education (in EURO)
1.3 Expenditure on education, indexed
X
X 10% 10% 10% 10% 10% 10%
2 Implementation of improvements in
monitoring system
Description of improvements in the
monitoring system (process indicator
where answer will be yes or no)
X
3 Applicants
Students applying for formal education
3.1 Students applying for vocational
education and training (numbers and
indexed)
X
3.2 Students applying for high school
education (numbers and indexed)
3.3 Students applying for higher
education (numbers and indexed)
4 Attendance X
a) Number of students attending
vocational education and training and
high school education
X 25% 25% 20% 5%
Page 25
108
No Indicator Input Output Outcome Impact
(gross)
Included in
the variable
tranche
2008 2009 2010 2011 2012 2013
b) Number of students attending skills
and competence courses X 5%
c) Number of students attending higher
education X 5% 5% 5% 10% 10% 10%
5 Apprenticeships
Number of apprenticeships in vocational
education and training
X X 20% 20% 20% 10% 5% 0%
6 Ratio of expenditure on private skills
and competence courses (with public
subsidies) related to all skills and
competence courses
X
7 Buildings
a) Number of dormitories completed
b) New educational institutions
completed
c) Extension of educational institutions
completed
X
8 Education
Share of adult workforce in Greenland
with ISCED level 3
X X 15% 20% 20%
9 Completion
9.1 Graduates by type of education (numbers)
9.2 Graduates by type of education, indexed
X
X 20% 20% 20% 15% 20% 20%
Page 26
109
No Indicator Input Output Outcome Impact
(gross)
Included in
the variable
tranche
2008 2009 2010 2011 2012 2013
10 Repetition rates
Vocational education and training and
high school education
X
11 Dropout rates
X
a) Formal education X 20% 20% 20% 15% 20% 20%
b) Skills courses and competence
courses
12 Job Insertion
X
X
a) Number of graduates from formal
educations obtaining a job 5% 10% 10% 10%
b) Job insertion after attending
Piareersarfiit 5% 5% 10%
13 Enterprise start-ups X
14 GDP per capita X
15 Block grants and other external
grants X
16 Employment rates
16.1 Employment by sector (numbers)
16.2 Employment rate by sector
(percentage)
16.3 Employment by sector, indexed
(Index 2005=100)
X
Page 27
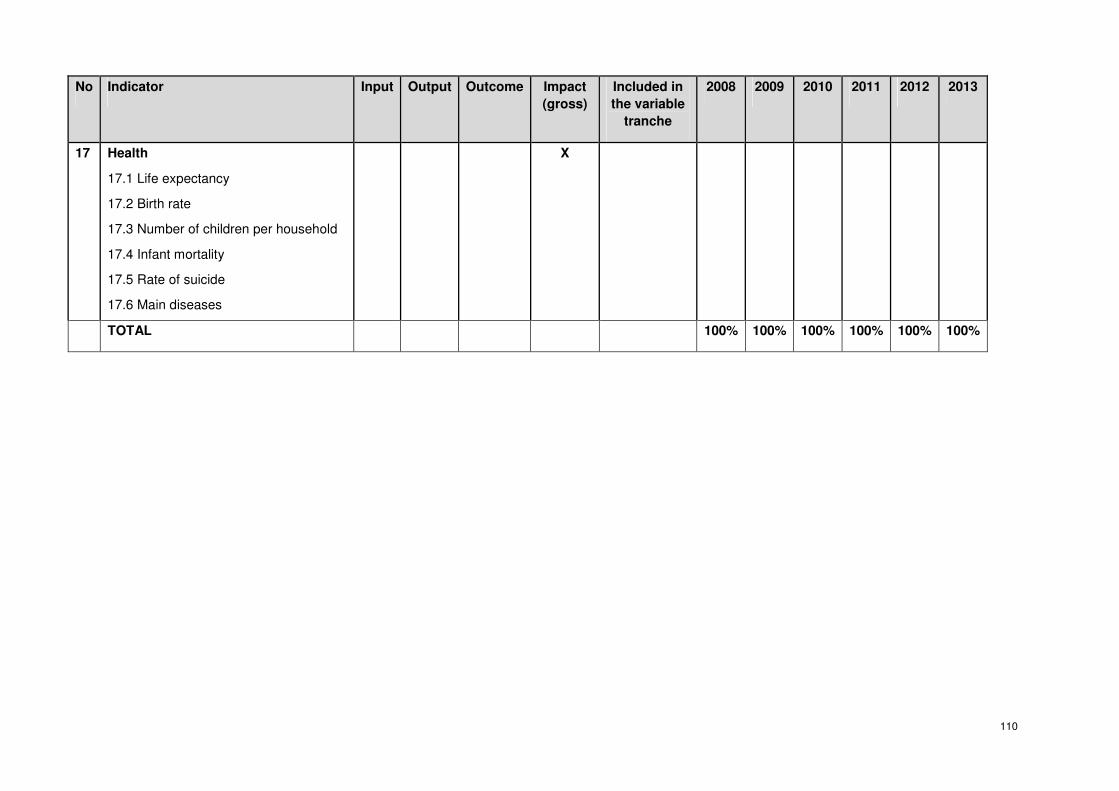
110
No Indicator Input Output Outcome Impact
(gross)
Included in
the variable
tranche
2008 2009 2010 2011 2012 2013
17 Health
17.1 Life expectancy
17.2 Birth rate
17.3 Number of children per household
17.4 Infant mortality
17.5 Rate of suicide
17.6 Main diseases
X
TOTAL 100% 100% 100% 100% 100% 100%
Page 28
111
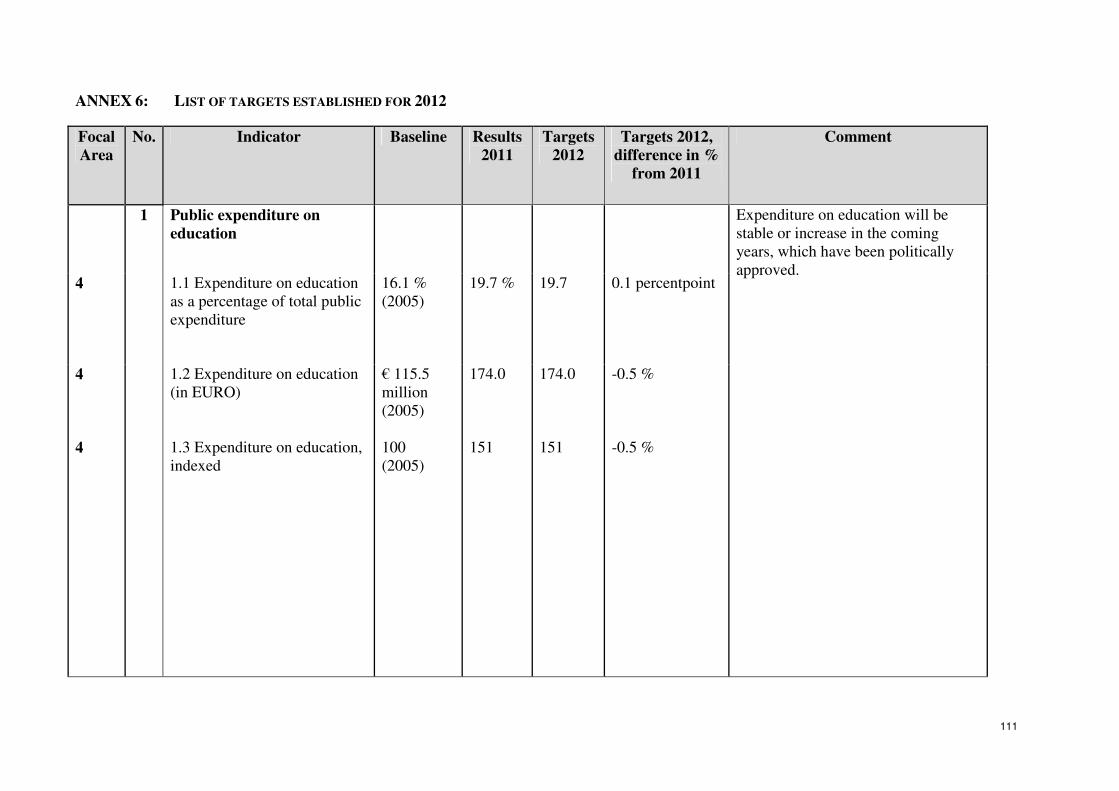
ANNEX 6: LIST OF TARGETS ESTABLISHED FOR 2012
Focal
Area
No. Indicator Baseline Results
2011
Targets
2012
Targets 2012,
difference in %
from 2011
Comment
1 Public expenditure on
education
Expenditure on education will be
stable or increase in the coming
years, which have been politically
approved. 4 1.1 Expenditure on education
as a percentage of total public
expenditure
16.1 %
(2005)
19.7 % 19.7 0.1 percentpoint
4 1.2 Expenditure on education
(in EURO)
€ 115.5
million
(2005)
174.0 174.0 -0.5 %
4 1.3 Expenditure on education,
indexed
100
(2005)
151 151 -0.5 %
Page 29
112
Focal
area
No. Indicator Baseline Results
2011
Targets
2012
Targets 2012,
difference in %
from 2011
Comment
2 Implementation of
improvements in monitoring
system
Description of improvements
in the monitoring system
(process indicator where
answer will be yes or no)
Yes
Yes
Page 30
113
Focal
area
No. Indicator Baseline Results
2011
Targets
2012
Targets 2012,
difference in %
from 2011
Comment
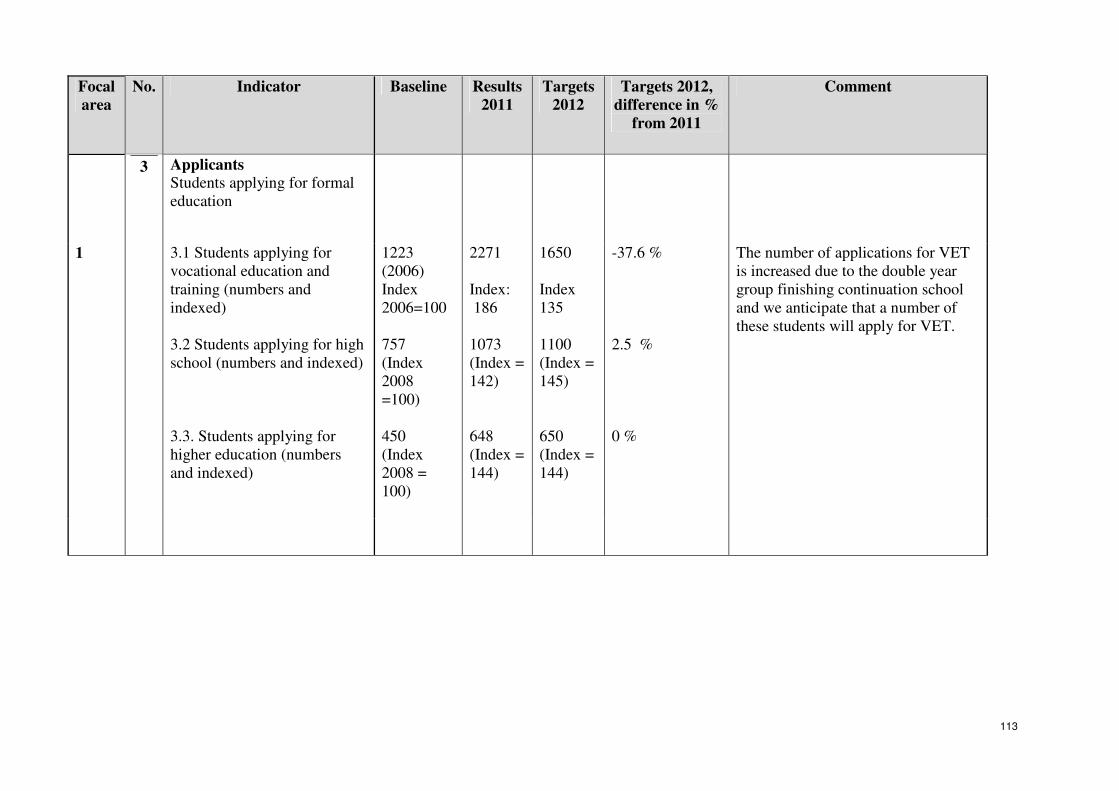
3
Applicants
Students applying for formal
education
1 3.1 Students applying for
vocational education and
training (numbers and
indexed)
3.2 Students applying for high
school (numbers and indexed)
3.3. Students applying for
higher education (numbers
and indexed)
1223
(2006)
Index
2006=100
757
(Index
2008
=100)
450
(Index
2008 =
100)
2271
Index:
186
1073
(Index =
142)
648
(Index =
144)
1650
Index
135
1100
(Index =
145)
650
(Index =
144)
-37.6 %
2.5 %
0 %
The number of applications for VET
is increased due to the double year
group finishing continuation school
and we anticipate that a number of
these students will apply for VET.
Page 31
114
Focal
area
No. Indicator Baseline Results 2011 Targets 2012 Targets 2012,
difference in
% from 2011
Comment
4 Attendance
1 a) Number of students
attending vocational
education and training
and high school
education
1925
(2005)
Index
2005=100
2679
Index: 139
2770
Index:144
3.4% Attendance is
expected to increase
as a result of
reduced drop-out
rates and better
guidance.
1 b) Number of students
attending skills and
competence courses
875
867 800 -8 % Numbers are
expected to increase
due to more funds
3 c) Number of students
attending higher
education
775
(2005)
Index
2005=100
1149
Index: 148
1170
Index: 151
1.8 % Only a slight
increase is expected
as there still are
only a limited
number of students
who qualify for
admission to higher
education.
1 5 Apprenticeships
Number of
apprenticeships in
vocational education and
training
1098
(2005)
Index
2005=100
1431
Index: 130
1440
Index: 131
0.6 % The number is
related to attendance
at VET schools. The
number is expected
be at the same level
as in 2010 due to the
continued slow
down of growth in
the private sector.
School traineeships
are not included and
some VET
programmes do not
apply
apprenticeships.
Page 32
115
Focal
area
No. Indicator Baseline Results 2011 Targets 2012 Targets 2012,
difference in
% from 2011
Comment
6 Ratio of expenditure on
private skills and
competence courses
(with public subsidies)
related to all skills and
competence courses
(2008)
There are no
results to add
Target is 0 (zero)
Included to monitor
trends over time.
Traditionally private
sector involvement
is low.
7 Buildings
6 a) Number of dormitories
completed
156 units
completed
58 Investments and
constructions are
ongoing
6
6
b) New educational
institutions completed
0 units
completed
0 units completed
•
The capacity of
dormitories is
expanded by 117
units in 2011 in
Nuuk and Ilullisat.
In 2011 new
projects are being
planned in Aasiaat
and Qaqortoq with
expected
finalization in 2012.
c) Extension of educational
institutions completed
1 units
completed 1 unit
Page 33
116
Focal
area
No. Indicator Baseline Results 2011 Targets 2012 Targets 2012,
difference in
% from 2011
Comment
8 Education
Share of adult population
with ISCED level 3 (in
Greenland at least a high
school education degree
or vocational education
and training)
34,6 %
35.5 %
35.8 %
0,3 percent
points
Long-term target:
2/3 of the
population should
have an education in
2020.
Due to lack in the
primary data the
indicator is
primarily giving a
valid pictures of the
development of the
education level over
time.
9 Completion Completion rates
are expected to
increase as
attendance increases
and drop-out rates
decrease. We are
beginning to see the
positive effect of the
initiatives; still the
full effect of
increased
attendance and
decreased drop-out
rates has yet to
show.
9.1 Graduates by type of
education (numbers)
581
(2005)
851
890 4.6 %
9.2 Graduates by type of
education, indexed
100
(2005)
146 153
Page 34
117
Focal
area
No. Indicator Baseline Results 2011 Targets 2012 Targets 2012,
difference in
% from 2011
Comment
10 Repetition rates
Vocational education and
training and high school
education
Repetition rates are
expected to remain
stable or decrease
slightly over time.
5 10.1 Repeaters attending
vocational education and
training and high school
education (numbers)
47
(2005)
71
80
3.9 %
5 10.2 Repeaters attending
relative to total attending
students in vocational
education and training
and high school education
2.4 %
(2005)
2.7 % 2.9 % 0,2 % - point
5 10.3 Repeaters attending
vocational education and
training and high school
education (indexed)
100
(2005)
151 170
Page 35
118
Focal
area
No. Indicator Baseline Results 2011 Targets 2012 Targets 2012,
difference in
% from 2011
Comment
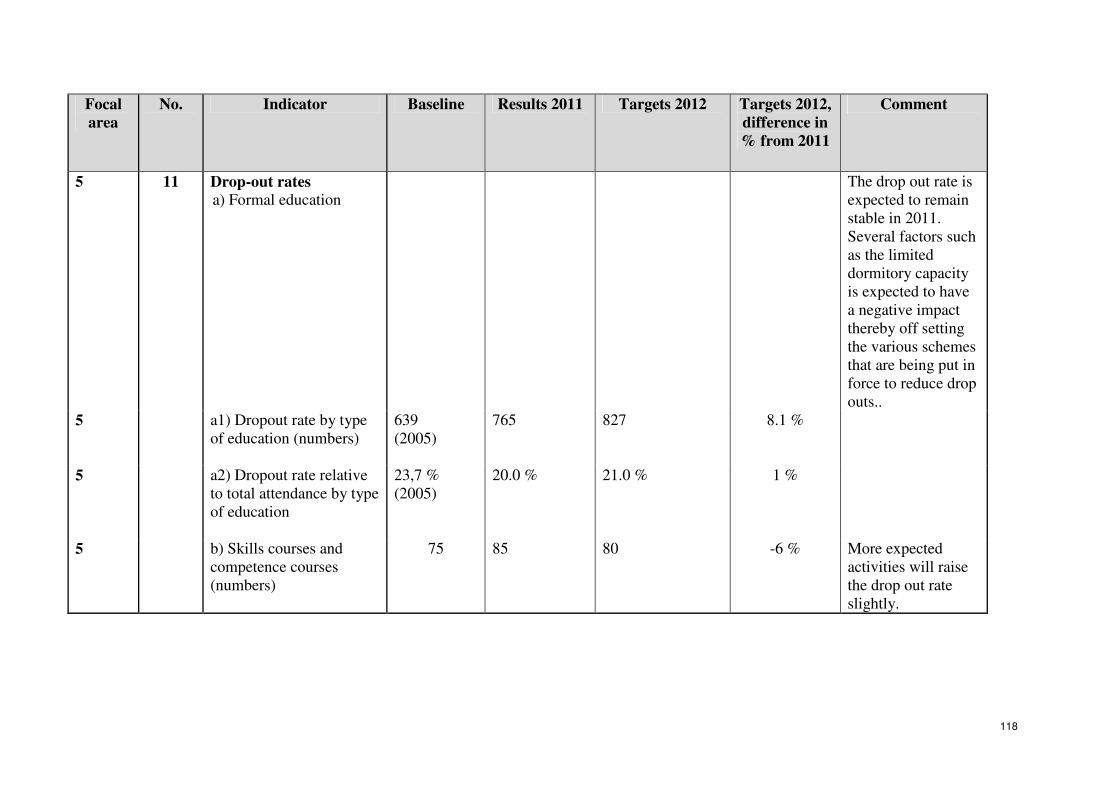
5 11 Drop-out rates
a) Formal education
The drop out rate is
expected to remain
stable in 2011.
Several factors such
as the limited
dormitory capacity
is expected to have
a negative impact
thereby off setting
the various schemes
that are being put in
force to reduce drop
outs..
5 a1) Dropout rate by type
of education (numbers)
639
(2005)
765 827
8.1 %
5 a2) Dropout rate relative
to total attendance by type
of education
23,7 %
(2005)
20.0 %
21.0 %
1 %
5 b) Skills courses and
competence courses
(numbers)
75 85 80 -6 % More expected
activities will raise
the drop out rate
slightly.
Page 36
119
Focal
area
No. Indicator Baseline Results 2010 Targets 2011 Targets 2011,
difference in
% from 2010
Comment
12 Job Insertion
7 a) Number of graduates
from formal educations
obtaining a job
399
(year=2008)
441
485
Job insertion is
expected to increase
with higher
education levels.
2 b) Enrolment into
education after attending
Piareersarfiit
0,24 0,23 0,26 The content of this
indicator has
changed as to reflect
the new role of
Piareersarfiit centres
becoming
increasingly more of
education centres.
13 Enterprise start-ups
13.1 Enterprise start-ups
by sector (numbers)
13.2 Enterprise start-ups
relative to total
enterprises by sector
13.3 Enterprise start-ups
by sector, indexed (Index
2008=100)
There is no
baseline for
this
indicator
Gross impact
included to allow
trend analysis in
later stage of the
programme.
Page 37
120
Focal
area
No. Indicator Baseline Results 2011 Targets 2012 Targets 2012,
difference in
% from 2011
Comment
14 GDP per capita €25.000
(2006)
€30.660
€31.321 2.1 % Gross impact
included to allow
trend analysis in
later stage of the
programme
Figures are only
available with two
years delay.
Page 38
121
Focal
area
No. Indicator Baseline Results 2010 Targets 2011 Targets
2011,
difference in
% from 2010
Comment
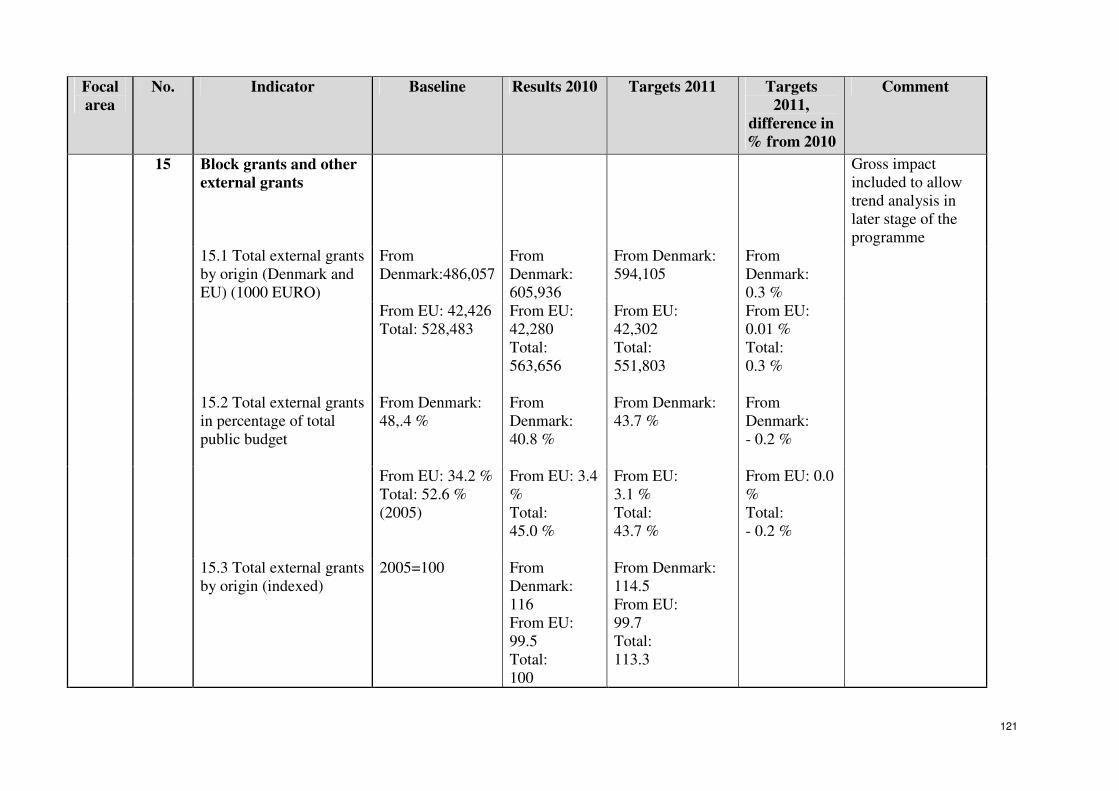
15 Block grants and other
external grants
Gross impact
included to allow
trend analysis in
later stage of the
programme
15.1 Total external grants
by origin (Denmark and
EU) (1000 EURO)
From
Denmark:486,057
From
Denmark:
605,936
From Denmark:
594,105
From
Denmark:
0.3 %
From EU: 42,426
Total: 528,483
From EU:
42,280
Total:
563,656
From EU:
42,302
Total:
551,803
From EU:
0.01 %
Total:
0.3 %
15.2 Total external grants
in percentage of total
public budget
From Denmark:
48,.4 %
From
Denmark:
40.8 %
From Denmark:
43.7 %
From
Denmark:
- 0.2 %
From EU: 34.2 %
Total: 52.6 %
(2005)
From EU: 3.4
%
Total:
45.0 %
From EU:
3.1 %
Total:
43.7 %
From EU: 0.0
%
Total:
- 0.2 %
15.3 Total external grants
by origin (indexed)
2005=100 From
Denmark:
116
From EU:
99.5
Total:
100
From Denmark:
114.5
From EU:
99.7
Total:
113.3
Page 39
122
2 For a detailed overview of employment rates broken down by sector, age, gender etc see annex 8: Baselines.
3 New calculation method
Focal
area
No. Indicator Baseline Results 2010 Targets 2011 Targets 2012,
difference in
% from 2011
Comment
16 Employment rates2
16.1 Employment by
sector (numbers)
Total
(2005):
28743
23,8263
n.a Gross impact
included to allow
trend analysis in
later stage of the
programme.
16.2 Employment rate by
sector (percentage)
16.3 Employment by
sector, indexed
2005=100 106.1
n.a
Page 40
123
Focal
area
No. Indicator Baseline Results 2010/2011 Targets
2012
Targets 2012,
difference in %
from 2011
Comment
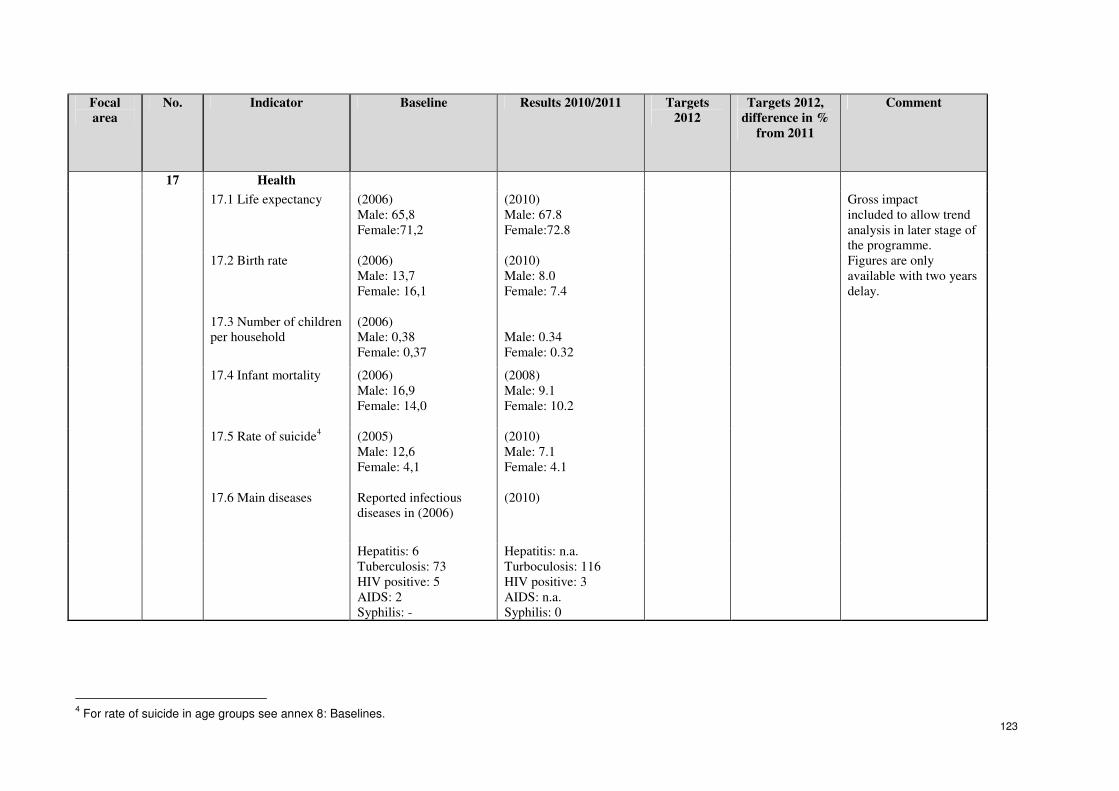
17 Health
17.1 Life expectancy
(2006)
Male: 65,8
Female:71,2
(2010)
Male: 67.8
Female:72.8
Gross impact
included to allow trend
analysis in later stage of
the programme.
17.2 Birth rate (2006)
Male: 13,7
Female: 16,1
(2010)
Male: 8.0
Female: 7.4
Figures are only
available with two years
delay.
17.3 Number of children
per household
(2006)
Male: 0,38
Female: 0,37
Male: 0.34
Female: 0.32
17.4 Infant mortality
(2006)
Male: 16,9
Female: 14,0
(2008)
Male: 9.1
Female: 10.2
17.5 Rate of suicide4 (2005)
Male: 12,6
Female: 4,1
(2010)
Male: 7.1
Female: 4.1
17.6 Main diseases Reported infectious
diseases in (2006)
(2010)
Hepatitis: 6
Tuberculosis: 73
HIV positive: 5
AIDS: 2
Syphilis: -
Hepatitis: n.a.
Turboculosis: 116
HIV positive: 3
AIDS: n.a.
Syphilis: 0
4 For rate of suicide in age groups see annex 8: Baselines.