81
AWUTU SENYA DISTRICT
AWUTU SENYA DISTRICT

ii
Copyright (c) 2014 Ghana Statistical Service

iii
PREFACE AND ACKNOWLEDGEMENT
No meaningful developmental activity can be undertaken without taking into account the
characteristics of the population for whom the activity is targeted. The size of the population
and its spatial distribution, growth and change over time, in addition to its socio-economic
characteristics are all important in development planning.
A population census is the most important source of data on the size, composition, growth
and distribution of a country’s population at the national and sub-national levels. Data from
the 2010 Population and Housing Census (PHC) will serve as reference for equitable
distribution of national resources and government services, including the allocation of
government funds among various regions, districts and other sub-national populations to
education, health and other social services.
The Ghana Statistical Service (GSS) is delighted to provide data users, especially the
Metropolitan, Municipal and District Assemblies, with district-level analytical reports based
on the 2010 PHC data to facilitate their planning and decision-making.
The District Analytical Report for the Awutu Senya District is one of the 216 district census
reports aimed at making data available to planners and decision makers at the district level. In
addition to presenting the district profile, the report discusses the social and economic
dimensions of demographic variables and their implications for policy formulation, planning
and interventions. The conclusions and recommendations drawn from the district report are
expected to serve as a basis for improving the quality of life of Ghanaians through evidence-
based decision-making, monitoring and evaluation of developmental goals and intervention
programmes.
For ease of accessibility to the census data, the district report and other census reports
produced by the GSS will be disseminated widely in both print and electronic formats. The
report will also be posted on the GSS website: www.statsghana.gov.gh.
The GSS wishes to express its profound gratitude to the Government of Ghana for providing
the required resources for the conduct of the 2010 PHC. While appreciating the contribution
of our Development Partners (DPs) towards the successful implementation of the Census, we
wish to specifically acknowledge the Department for Foreign Affairs, Trade and
Development (DFATD) formerly the Canadian International Development Agency (CIDA)
and the Danish International Development Agency (DANIDA) for providing resources for
the preparation of all the 216 district reports. Our gratitude also goes to the Metropolitan,
Municipal and District Assemblies, the Ministry of Local Government, Consultant Guides,
Consultant Editors, Project Steering Committee members and their respective institutions for
their invaluable support during the report writing exercise. Finally, we wish to thank all the
report writers, including the GSS staff who contributed to the preparation of the reports, for
their dedication and diligence in ensuring the timely and successful completion of the district
census reports.
Dr. Philomena Nyarko
Government Statistician
iv
TABLE OF CONTENTS
PREFACE AND ACKNOWLEDGEMENT ....................................................................... iii
LIST OF TABLES .................................................................................................................. vi
LIST OF FIGURES ............................................................................................................... vii
ACRONYMS AND ABBREVIATIONS ............................................................................ viii
EXECUTIVE SUMMARY .................................................................................................... ix
CHAPTER ONE: INTRODUCTION ................................................................................... 1 1.1 Introduction .................................................................................................................... 1
1.2 Physical Features ........................................................................................................... 1
1.3 Political and Administrative Structure ........................................................................... 3
1.4 Cultural and Social Structure ......................................................................................... 3
1.5 Economy ........................................................................................................................ 3
1.6 Census Methodology, Concepts and Definitions ........................................................... 3
1.7 Organization of the Report........................................................................................... 13
CHAPTER TWO: DEMOGRAPHIC CHARACTERISTICS ......................................... 15 2.1 Introduction .................................................................................................................. 15
2.2 Population size and distribution ................................................................................... 15
2.3 Age-sex structure ......................................................................................................... 16
2.4 Fertility, Mortality and Migration ................................................................................ 17
CHAPTER THREE: SOCIAL CHARACTERISTICS .................................................... 22 3.1 Introduction .................................................................................................................. 22
3.2 Household size, composition and headship ................................................................. 22
3.3 Marital status ................................................................................................................ 24
3.4 Nationality.................................................................................................................... 28
3.5 Religious Affiliation .................................................................................................... 29
3.6 Literacy and Education ................................................................................................ 29
CHAPTER FOUR: ECONOMIC CHARACTERISTICS ............................................... 32 4.1 Introduction .................................................................................................................. 32
4.2 Economic activity status .............................................................................................. 32
4.3 Occupation ................................................................................................................... 34
4.4 Industry ........................................................................................................................ 35
4.5 Employment status ....................................................................................................... 35
4.6 Employment Sector ...................................................................................................... 36
CHAPTER FIVE: INFORMATION COMMUNICATION TECHNOLOGY .............. 37 5.1 Introduction .................................................................................................................. 37
5.2 Ownership of mobile phones ....................................................................................... 37
5.3 Use of Internet.............................................................................................................. 37
5.4 Households Ownership of Desktop or Laptop Computer ............................................ 38
CHAPTER SIX: DISABILITY ........................................................................................... 39 6.1 Introduction .................................................................................................................. 39
6.2 Population with Disability (PWD) ............................................................................... 39
6.3 Type of disability ......................................................................................................... 40
6.4 Disability and activity status ........................................................................................ 41
v
6.5 Disability and Education .............................................................................................. 42
CHAPTER SEVEN: AGRICULTURAL ACTIVITIES ................................................... 44 7.1 Introduction .................................................................................................................. 44
7.2 Households in Agriculture ........................................................................................... 44
7.3 Types of Farming Activities ........................................................................................ 45
7.4 Types of livestock, other animals reared and keepers ................................................. 45
CHAPTER EIGHT: HOUSING CONDITIONS ............................................................... 47 8.1 Introduction .................................................................................................................. 47
8.2 Housing stock............................................................................................................... 47
8.3 Type of dwelling, holding and tenancy arrangement ................................................... 47
8.4 Construction materials ................................................................................................. 49
8.5 Room Occupancy ......................................................................................................... 51
8.6 Access to Utilities and Household Facilities ............................................................... 52
8.7 Main source of Water for Drinking and for other Domestic Use ................................ 54
8.8 Bathing and Toilet Facilities ........................................................................................ 54
8.9 Method of Waste Disposal ........................................................................................... 56
CHAPTER NINE: SUMMARY OF FINDINGS CONCLUSIONS AND POLICY
IMPLICATIONS ................................................................................. 58 9.1 Summary of Findings ................................................................................................... 58
9.2 Policy Recommendations............................................................................................. 62
REFERENCES ....................................................................................................................... 64
APPENDICES ........................................................................................................................ 65
LIST OF CONTRIBUTORS ................................................................................................ 69
vi
LIST OF TABLES
Table 2.1: Population by age, sex and type of locality ........................................................... 15
Table 2.2: Reported total fertility rate, general fertility rate and crude birth rate by district . 18
Table 2.3: Female population 12 years and older by age, children ever born, children
surviving and sex of child ...................................................................................... 19
Table 2.4: Total population, deaths in households and crude death rate ................................ 19
Table 2.5: Birthplace by duration of residence of migrants .................................................... 21
Table 3.1: Household size by locality of residence ................................................................ 22
Table 3.2: Household population by composition and sex ..................................................... 23
Table 3.3: Household population by structure and sex ........................................................... 24
Table 3.3: Marital status of persons 12 years and older by sex and age-group ...................... 25
Table 3.4: Marital status of persons 12 years and older by sex and level of education .......... 27
Table 3.5: Marital status of persons 12 years and older by sex and economic activity status 28
Table 3.6: Population by nationality and sex .......................................................................... 28
Table 3.7: Population by religion and sex .............................................................................. 29
Table 3.8: Level of education for persons 3 years and older by school attendance and sex .. 31
Table 4.1: Activity status of persons 15 years and older by sex ............................................. 32
Table 4.2: Economic activity status of population 15 years and older by sex and age .......... 33
Table 4.3: Employed population 15 years and older by occupation and sex .......................... 34
Table 4.4: Employed population 15 years and older by industry and sex .............................. 35
Table 5.1: Population 12 years and older by mobile phone ownership, internet facility
usage and sex ........................................................................................................ 37
Table 5.2: Households having desktop/laptop computers and sex of head ........................... 38
Table 6.1: Population by type of locality, disability type and sex .......................................... 39
Table 6.2: Persons 15 years and older with disability by economic activity status and sex .. 42
Table 6.3: Population 3 years and older by sex, disability type and level of education ......... 43
Table 7.1: Households by agricultural activities and locality ................................................. 44
Table 7.2: Distribution of livestock, other animals and keepers............................................. 46
Table 8.1: Stock of houses and households by type of locality .............................................. 47
Table 8.2: Type of dwelling by sex of household head and type of locality .......................... 48
Table 8.3: Type of occupied dwelling unit by sex of household head and type of locality ... 49
Table 8.4: Main construction materials for outer wall of dwelling unit by type of locality ... 49
Table 8.5: Main construction materials for the floor of dwelling unit by type of locality ..... 50
Table 8.6: Main construction material for roofing of dwelling unit by type of locality ......... 51
Table 8.7: Households by size and number of sleeping rooms occupied in dwelling unit ..... 52
Table 8.8: Main source of cooking fuel and cooking space used by households ................... 53
Table 8.9: Bathing and toilet facilities used by households .................................................... 55
Table 8.10:Method of rubbish and liquid waste disposal by households ................................ 57
Table A1: Population 3 years and older by sex, disability type and level of education ......... 65
Table A2: Population by sex, number of households and houses in the 20 largest
communities ........................................................................................................... 67
Table A3: Population by age group in the 20 largest communities ........................................ 68
vii
LIST OF FIGURES
Figure 1.1: Awutu Senya District Map ..................................................................................... 2
Figure 2.1: Population pyramid .............................................................................................. 16
Figure 2.2: Age-specific deaths rates ...................................................................................... 20
Figure 3.1: Marital status of persons 12 years and older ........................................................ 25
Figure 3.2: Language of literacy ............................................................................................. 30
Figure 4.1: Employment status of population 15 years and older by sex ............................... 36
Figure 4.2: Employment sector of population 15 years and older .......................................... 36
Figure 6.1: Type of disability................................................................................................... 41
Figure 7.1: Households in agriculture ..................................................................................... 45
Figure 8.1: Sources of lighting to households ........................................................................ 52
Figure 8.2: Main sources of water for drinking ...................................................................... 54
Figure 8.3: Toilet facilities ...................................................................................................... 56

viii
ACRONYMS AND ABBREVIATIONS
AIDS Acquired Immune Deficiency Syndrome
CHIPS Community Health Planning Services
DANIDA Danish International Development Agency
DFATD Department of Foreign Affairs, Trade and Development (formerly CIDA)
DPs Development Partners
ECOWAS Economic Community of West African States
EU European Union
GDP Gross Domestic product
GSS Ghana Statistical Service
HIV Human Immune Virus
HND Higher National Diploma
ICT Information and Communication Technology
JHS Junior High School
JSS Junior Secondary School
LI Legislative Instrument
MCE Municipal Chief Executive
MP Member of Parliament
NGOs Non-Governmental Organisations
PHC Population and Housing Census
PWDs Persons with disabilities
SHS Senior High School
SSS Senior Secondary School
TLMs Teaching and Learning Materials
UN United Nations
UNDP United Nations Development Programme
WC Water Closet

ix
EXECUTIVE SUMMARY
Introduction
The district census report is the first of its kind since the first post-independence census was
conducted in 1960. The report provides basic information about the district. It gives a brief
background of the district, describing its physical features, political and administrative
structure, socio-cultural structure and economy. Using data from the 2010 Population and
Housing Census (2010 PHC), the report discusses the population characteristics of the district,
fertility, mortality, migration, marital status, literacy and education, economic activity status,
occupation, employment; Information Communication Technology (ICT), disability,
agricultural activities and housing conditions of the district. The key findings of the analysis are
as follows (references are to the relevant sections of the report):
Population size, structure and composition
The population of Awutu Senya District, according to the 2010 Population and Housing
Census, is 86,884 representing 3.9 percent of the region’s total population. Males constitute
47.1 percent and females represent 52.9 percent. The proportion of the population living in
urban areas is 48 percent compared to 52 percent in the rural areas. The district has a sex ratio
of 89. The population of the district is youthful (41.7%) depicting a broad base population
pyramid which tapers off with a small number of elderly persons (6.5%). The total age
dependency ratio for the District is 90.8, the age dependency ratio for males is higher (92.3)
than that of females (89.3).
Fertility, mortality and migration
The Total Fertility Rate for the district 3.9. The General Fertility Rate is 114.8 births per 1000
women aged 15-49 years which is the second highest for the region. The Crude Birth Rate
(CBR) is 28.7 per 1000 population. The crude death rate for the district is 7.5 per 1000. The
death rate for males is highest for age 70. There are a total of 25,312 migrants in the District
forming 29.1 percent of the population of the District. The largest proportion (26.7%) is
residents between 1-4 years while the lowest proportion of migrants (15 percent) has resided in
the District between 5-9 years. Most of the migrants were born in Eastern and Greater Accra
Regions.
Household size, composition and structure
The district has a household population of 84,505 with a total number of 20,955 households.
The average household size in the district is 4.0 persons per household. Children constitute the
largest proportion of the household structure accounting for 42.7 percent. Spouses form about
9.7 percent. Nuclear family households (head, spouse(s) and children) constitute 28.9 percent
of the total number of households in the district.
Marital status
About 37 percent of the population aged 12 years and older are married, 38.6 percent have
never married, 12.4 percent are in consensual unions, 6.0 percent are widowed, 3.9 percent
are divorced and 2.2 percent are separated. By age 25-29 years, 47.5 percent of females are
married compared to a little above one-third of males (30.1%). At age 65 and above,
widowed females account for as high as 60.6 percent while widowed males account for only
12.8 percent. Among the married, 36.8 percent have no education while about 8.2 percent of

x
the unmarried have never been to school. More than eight in ten of the married persons
(86.6%), those in consensual union (89.3%), the separated (84.6%) and the widowed (84.4%)
are employed. Similar pattern is observed among the sexes. A greater proportion of those
who have never married (59.8%) are economically not active with 3.4 percent unemployed.
Nationality and religion
Ghanaians (by birth, dual nationality or by naturalization) constitute 98.4 percent of the
population with the rest being non-Ghanaians (1.6%). Christian constitute 78.1 percent of the
population while Muslims account for 6.3 percent of the population in the District. Followers
of traditional African religions constitute 2.0 percent of the population. People who have no
religious preferences or do not practice any religion are 10.2% of the population.
Literacy and education
Almost half (48.3%) of the population 11 years and older in the district is literate in English.
The second highest proportion of the literate population is English and Ghanaian language
only (46.1%) followed by Ghanaian Language only (4.6%). In spite of attempts being made
towards encouraging literacy in French, only 0.5 percent of literate population 11 years and
older are literate in English and French. A total of 31,951 children are attending school made
up of 16,402 males and 15,549 females; 27,787 have attended school in the past also with
14,436 males and 13,351 females.
Economic activity status
About 75.1 percent of the population aged 15 years and older are economically active while
24.9 per cent are economically not active. Of the economically active population, 95.7
percent are employed while 4.3 percent are unemployed. For those who are economically not
active, a larger percentage of them are students (52.3%), 18.8% perform household duties and
5.9 percent are disabled or too sick to work. Almost six out of ten (58.7%) unemployed are
seeking work for the first time.
Occupation
Skilled agricultural forestry and fishery (43.5%) is the most common occupation for persons
aged 15years and older in the district. This is followed by Service and Sales (19.8%) and
Crafts and Related Trade Workers (19.5%). Managers (1.7%) and professionals (4.0%) are
least. There are however more female managers (2.0 percent) than males (1.7%).
Employment status and sector
Of the population 15 years and older 71.3 percent are self-employed without employees, 16.5
percent are employees and contributing family workers (6.8%).The private informal sector is
the largest employer in the district, employing 91.7 percent of the population followed by the
private formal sector with 4.7 percent.
Information Communication Technology
Of the population 12 years and above, 39.5 percent have mobile phones. Men who own
mobile phones constitute 48.5 percent as compared to 32 percent of females. A little below
three percent (2.9%) of the population 12 years and older use internet facilities in the district.
Only 643 households representing 3.1 percent of the total households in the district have
desktop/laptop computers.

xi
Disability
About 3.1percent of the district’s total population has one form of disability or the other. The
proportion of the male population with disability is slightly lower (3.1%) than females
(3.2%). The types of disability in the district include sight, hearing, speech, physical,
intellect, and emotion. Persons with sight disability recorded the highest of 34 percent
followed by physical disability (29.9%). There are slightly higher people with disability in
the urban areas (3.7%) than in the rural areas (2.6%). Of the district population with disability
15 years and older, 59.3 percent are employed, 2.5 percent are unemployed while 38.5
percent are economically not active. Of the population disabled, 47.2 percent have never been
to school.
Agriculture
A greater Proportion (53.8%) of households in the district are engaged in agriculture. Rural
households (71.5%) dominate agricultural activities. The highest proportion of household
engaged in agricultural activities is into crop farming (75.8%). Also, 23.6 percent are engaged
in livestock rearing. Tree planting and fish farming are undertaken by less than one percent of
households in agriculture.
Housing
The housing stock of Awutu Senya District is 12,312 representing 3.6 percent of the total
number of houses in the Central Region. The average number of persons per house is 7.1.
Type, tenancy arrangement and ownership of dwelling units
The most common form of dwelling unit used by 55.1 percent of households in the district is
the compound house. The next major type of dwelling unit is the separate house, which
accounts for 30.7 percent of households; 6.4 percent of households dwell in semi-detached
houses while 2.8 percent dwell in huts/buildings (same compound).
Material for construction of outer wall, floor and roof
The main construction materials for outer walls of dwelling units in the district are
cement/concrete (64.5%) and mud/mud bricks or earth (32.1%). Cement (91.7%) and
mud/earth (6.4%) are the two main materials used in the construction of floors of dwelling
units in the district. Metal sheets (67.9%) and slates/asbestos (26.5%) are the main roofing
material for dwelling units in the district.
Room occupancy
One room constitutes the highest percentage (70.6%) of sleeping rooms occupied by
households in housing units in the district. About 20.6 percent of households with 10 or more
members occupy single rooms.
Utilities and household facilities
The three main sources of lighting in dwelling units in the district are electricity (60.8%),
kerosene lamp (29.9%) and flashlight/torch (7.2%). The main sources of fuel for cooking for
most households in the district are wood (52%) and charcoal (33.4%). The proportion using
wood is higher for rural (74.1%) than for urban (30.5%). The four main sources of water in
the district are borehole, river stream, public tap and pipe borne water. River/stream is an
important source of drinking water for 17.1 percent of households.
xii
The most important toilet facility used in the district is public toilet (WC, KVIP, Pit, Pan)
representing 32.9 percent followed by KVIP (19.7%). About 23.9 percent of the population in
the district has no toilet facility. More than a third of households (35.7%) in the district share
open cubicle bathrooms while 15.1 percent own bathrooms for their exclusive use.
Waste disposal
The most widely method of solid waste disposal is by public dump in the open space
accounting for 68 percent. About 8.3 percent dump their solid waste indiscriminately. House
to house waste collection accounts for 1.2 percent. For liquid waste disposal, throwing waste
onto the compound (56.5%) and onto the street (28%) are the two most common methods
used by households in the district.

1
CHAPTER ONE
INTRODUCTION
1.1 Introduction
The Administrative Capital of the Awutu-Senya District is Awutu Bereku. Until Awutu Senya
East Municipal was carved out in 2012, the District was described as the Gateway to the Central
Region from the Greater Accra Region. The District Assembly was established by LI 1376 of
2007 and inaugurated on 29 February 2008.
1.2 Physical Features
1.2.1 Location and size
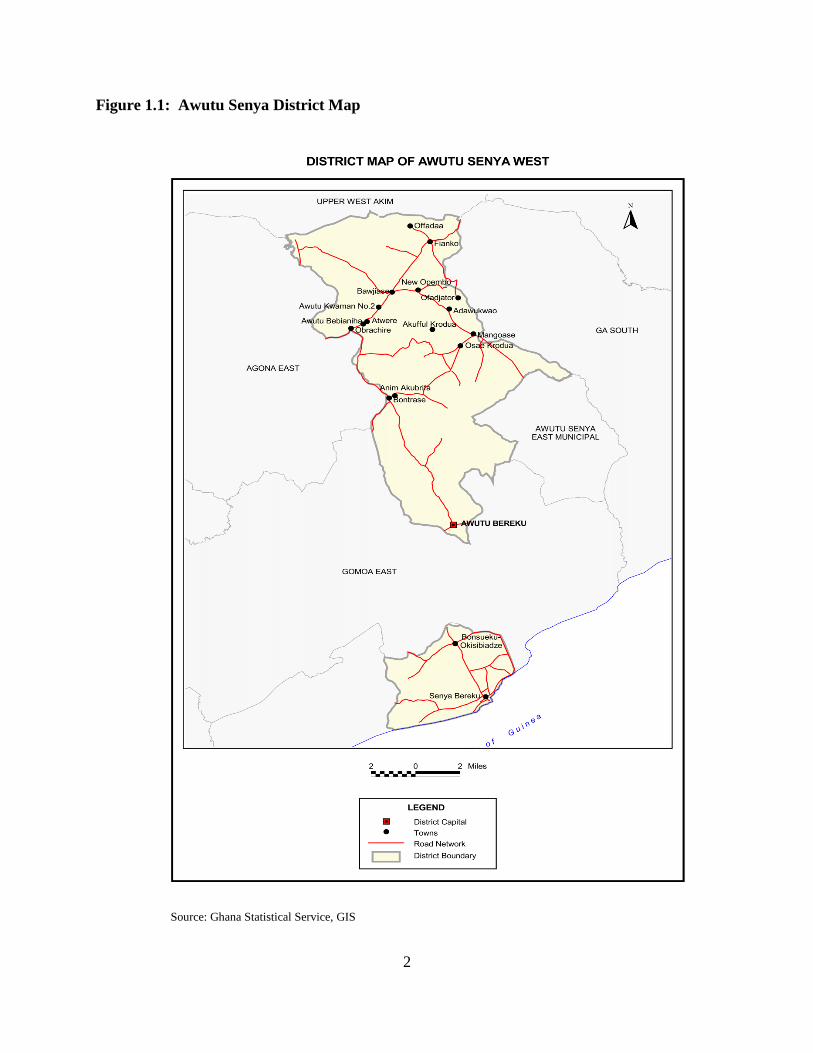
The Awutu-Senya District is located in the Central Region of Ghana. It covers a surface area of
244.473sq.km. The Gomoa East District has dotted enclaves within the district. The Southern
part of the district is bounded by the Gulf of Guinea, to the East by Awutu Senya Municipal, to
the West by Gomoa East and Agona East Districts, and the North-Eastern part by West Akim
District.
1.2.2 Relief and drainage
The Awutu-Senya district is characterised by isolated undulating highlands. The coastline of
Senya has Lowlands with isolated hills. Two major rivers, Ayensu and Okrudu in the district
drain into the sea. There are also streams and small rivers that traverse the lowland plains
stretching from Winneba to the coastal plains of Senya.
1.2.3 Climate
The District has mean annual minimum and maximum temperatures of 22°C and 38°C,
respectively. It experiences two main seasons, rainy and dry seasons. There is a major rainy
season from April to July and a minor season from August to November. The dry season starts
from November and ends in March. The annual rainfall figures of the district are quite low
(40cm-50cm) along the coast but are higher in the hinterland (50cm-70cm).
1.2.4 Vegetation
The Northern part of the District is made up of a degraded tropical semi-deciduous forest cover
and the Southern part by savannah grassland.
1.2.5 Soil
The District is underlain by Birrimian rocks which consist of granites and phyllites. In the semi-
deciduous forest zone of the district, the soil type is loamy-sandy making the place suitable for
arable farming. It supports the growth of several crops like pineapple, cassava, yam, maize and
citrus among others. Soil found in the southern zone are characterised by clay with high salinity
and therefore do not support the cultivation of many crops, but provides opportunities for
ceramic and pottery industries.
2
Figure 1.1: Awutu Senya District Map
Source: Ghana Statistical Service, GIS

3
1.3 Political and Administrative Structure
Awutu Senya District Assembly is made up of one Urban Council, namely Senya and 5 Area
Councils which are Bawjiase, Jei-Krodua, Awutu Bereku, Bontrase and Obrachire. It has 25
elected and 11 appointed members and the District Chief Executive bringing the total number
to 37. It also has a Member of Parliament who is an ex- officio member. Currently, eight
decentralised departments have been established out of the 11 at the District level.
The Assembly is empowered with legislative, deliberative and executive functions within the
district. There is a Presiding Member who is elected from the Assembly Members and chairs
all Assembly as well as Public Relations and Complaints committee (PRCC) meetings.
The Assembly has five statutory sub- committees namely; Justice and Security, Development
Planning, Works, Social Services and Finance and Administration. There is an Executive
Committee which reviews the work of the sub-committees before the General Assembly
meeting. The Executive Committee, which is made up of the chairpersons of the various sub-
committees is chaired by the District Chief Executive.
1.4 Cultural and Social Structure
1.4.1 Ethnicity and Religion
The indigenous people of Awutu and Senya are of the Guan ethnic stock and celebrate the
Akomase and Awubia Festivals. These two constitute the largest group in a region which is
predominantly Akan in ethnicity. There are other settler ethnic groups including Gas, Akans,
Ewes, Walas/Dagartis, Moshis and Basares. Indigenous Languages which are mainly spoken
is Bereku (Awutu) while Akan and English are dominant languages used at centres of vibrant
commerce.
The vast majority of the population is Christian dominated by Pentecostals and Charismatics.
There are also significant proportions of followers of Islam and Traditional African religions
who in total make up 8.2 percent of the population of the district. About 12.4 percent of the
population do not belong to any religious group and do not have any religious preferences.
1.5 Economy
The District is a hub for agriculture and its related activities. Agriculture employs
approximately 54 percent of households in the District. Agricultural activities include crop
farming, tree planting, livestock rearing and fish farming.
The availability of natural water bodies can be tapped for irrigation to boost food crop
production especially during the minor season. Bamboo is another natural resource that can
be tapped to generate jobs and increase income of households. Other economic industrial
activities within the District include mining and quarrying, manufacturing, construction,
transportation, financial and insurance.
1.6 Census Methodology, Concepts and Definitions
1.6.1 Introduction
Ghana Statistical Service (GSS) was guided by the principle of international comparability
and the need to obtain accurate information in the 2010 Population and Housing Census
(2010 PHC). The Census was, therefore, conducted using all the essential features of a
4
modern census as contained in the United Nations Principles and Recommendations for
countries taking part in the 2010 Round of Population and Housing Censuses.
Experience from previous post independence censuses of Ghana (1960, 1970, 1984 and 2000)
was taken into consideration in developing the methodologies for conducting the 2010 PHC.
The primary objective of the 2010 PHC was to provide information on the number,
distribution and social, economic and demographic characteristics of the population of Ghana
necessary to facilitate the socio-economic development of the country.
1.6.2 Pre-enumeration activities
Development of census project document and work plans
A large scale statistical operation, such as the 2010 Population and Housing Census required
meticulous planning for its successful implementation. A working group of the Ghana
Statistical Service prepared the census project document with the assistance of two
consultants. The document contains the rationale and objectives of the census, census
organisation, a work plan as well as a budget. The project document was launched in
November 2008 as part of the Ghana Statistics Development Plan (GSDP) and reviewed in
November 2009.
Census secretariat and committees
A well-structured management and supervisory framework that outlines the responsibilities
of the various stakeholders is essential for the effective implementation of a population and
housing census. To implement the 2010 PHC, a National Census Secretariat was set up in
January 2008 and comprised professional and technical staff of GSS as well as staff of other
Ministries, Departments and Agencies (MDAs) seconded to GSS. The Census Secretariat was
primarily responsible for the day-to-day planning and implementation of the census activities.
The Secretariat had seven units, namely; census administration, cartography, recruitment and
training, publicity and education, field operations and logistics management, data processing,
and data analysis and dissemination.
The Census Secretariat was initially headed by an acting Census Coordinator engaged by the
United Nations Population Fund (UNFPA) in 2008 to support GSS in the planning of the
Census. In 2009, the Census Secretariat was re-organised with the Government Statistician
as the National Chief Census Officer and overall Coordinator, assisted by a Census
Management Team and a Census Coordinating Team. The Census Management Team had
oversight responsibility for the implementation of the Census. It also had the responsibility of
taking critical decisions on the census in consultation with other national committees. The
Census Coordinating Team, on the other hand, was responsible for the day-to-day
implementation of the Census programme.
A number of census committees were also set up at both national and sub-national levels to
provide guidance and assistance with respect to resource mobilization and technical advice.
At the national level, the committees were the National Census Steering Committee (NCSC),
the National Census Technical Advisory Committee (NCTAC) and the National Census
Publicity and Education Committee (NCPEC). At the regional and district levels, the
committees were the Regional Census Implementation Committee and the District Census
Implementation Committee, respectively.
The Regional and District Census Implementation Committees were inter-sectoral in their
composition. Members of the Committees were mainly from decentralized departments with

5
the Regional and District Coordinating Directors chairing the Regional Census
Implementation Committee and District Census Implementation Committee, respectively.
The Committees contributed to the planning of district, community and locality level
activities in areas of publicity and field operations. They supported the Regional and District
Census Officers in the recruitment and training of field personnel (enumerators and
supervisors), as well as mobilizing logistical support for the census.
Selection of census topics
The topics selected for the 2010 Population and Housing Census were based on
recommendations contained in the UN Principles and Recommendations for 2010 Round of
Population and Housing Censuses and the African Addendum to that document as well as the
needs of data users. All the core topics recommended at the global level, i.e., geographical
and internal migration characteristics, international migration, household characteristics,
demographic and social characteristics such as age, date of birth, sex, and marital status,
fertility and mortality, educational and economic characteristics, issues relating to disability
and housing conditions and amenities were included in the census.
Some topics that were not considered core by the UN recommendations but which were
found to be of great interest and importance to Ghana and were, therefore, included in the
2010 PHC are religion, ethnicity, employment sector and place of work, agricultural activity,
as well as housing topics, such as, type of dwelling, materials for outer wall, floor and roof,
tenure/holding arrangement, number of sleeping rooms, cooking fuel, cooking space and
Information Communication Technology (ICT).
Census mapping
A timely and well implemented census mapping is pivotal to the success of any population
and housing census. Mapping delineates the country into enumeration areas to facilitate
smooth enumeration of the population. The updating of the 2000 Census Enumeration Area
(EA) maps started in the last quarter of 2007 with the acquisition of topographic sheets of all
indices from the Survey and Mapping Division of the Lands Commission. In addition, digital
sheets were also procured for the Geographical Information System Unit.
The Cartography Unit of the Census Secretariat collaborated with the Survey and Mapping
Division of the Lands Commission and the Centre for Remote Sensing and Geographic
Information Services (CERSGIS) of the Department of Geography and Resource
Development, University of Ghana, to determine the viability of migrating from analog to
digital mapping for the 2010 PHC, as recommended in the 2000 PHC Administrative Report.
Field cartographic work started in March 2008 and was completed in February 2010.
Development of questionnaire and manuals
For effective data collection, there is the need to design appropriate documents to solicit the
required information from respondents. GSS consulted widely with main data users in the
process of the questionnaire development. Data users including MDAs, research institutions,
civil society organisations and development partners were given the opportunity to indicate
the type of questions they wanted to be included in the census questionnaire.
Documents developed for the census included the questionnaire and manuals, and field
operation documents. The field operation documents included Enumerator’s Visitation
Record Book, Supervisor’s Record Book, and other operational control forms. These record

6
books served as operational and quality control tools to assist enumerators and supervisors to
control and monitor their field duties respectively.
Pre-tests and trial census
It is internationally recognized that an essential element in census planning is the pre-testing
of the questionnaire and related instructions. The objective of the pre-test is to test the
questionnaire, the definition of its concepts and the instructions for filling out the
questionnaire.
The census questionnaire was pre-tested twice in the course of its development. The first pre-
test was carried out in March 2009 to find out the suitability of the questions and the
instructions provided. It also tested the adequacy and completeness of the responses and how
respondents understood the questions. The second pre-test was done in 10 selected
enumeration areas in August, 2009. The objective of the second pre-test was to examine the
sequence of the questions, test the new questions, such as, date of birth and migration, and
assess how the introduction of ‘date of birth’ could help to reduce ‘age heaping’. With regard
to questions on fertility, the pre-tests sought to find out the difference, if any, between proxy
responses and responses by the respondents themselves. Both pre-tests were carried in the
Greater Accra Region. Experience from the pre-tests was used to improve the final census
questionnaire.
A trial census which is a dress rehearsal of all the activities and procedures that are planned
for the main census was carried out in October/November 2009. These included recruitment
and training, distribution of census materials, administration of the questionnaire and other
census forms, enumeration of the various categories of the population (household,
institutional and floating population), and data processing. The trial census was held in six
selected districts across the country namely; Saboba (Northern Region), Chereponi (Northern
Region), Sene (Brong Ahafo Region), Bia (Western Region), Awutu Senya (Central Region),
and Osu Klottey Sub-Metro (Greater Accra Region). A number of factors were considered in
selecting the trial census districts. These included: administrative boundary issues, ecological
zone, and accessibility, enumeration of floating population/outdoor-sleepers, fast growing
areas, institutional population, and enumeration areas with scattered settlements.
The trial census provided GSS with an opportunity to assess its plans and procedures as well
as the state of preparedness for the conduct of the 2010 PHC. The common errors found
during editing of the completed questionnaires resulted in modifications to the census
questionnaire, enumerator manuals and other documents. The results of the trial census
assisted GSS to arrive at technically sound decisions on the ideal number of persons per
questionnaire, number of persons in the household roster, migration questions, placement of
the mortality question, serial numbering of houses/housing structures and method of
collection of information on community facilities. Lessons learnt from the trial census also
guided the planning of the recruitment process, the procedures for training of census field
staff and the publicity and education interventions.
1.6.3 Census enumeration
Method of enumeration and field work
All post- independence censuses (1960, 1970, 1984, and 2000) conducted in Ghana used the
de facto method of enumeration where people are enumerated at where they were on census
night and not where they usually reside. The same method was adopted for the 2010 PHC.

7
The de facto count is preferred because it provides a simple and straight forward way of
counting the population since it is based on a physical fact of presence and can hardly be
misinterpreted. It is thought that the method also minimizes the risks of under-enumeration
and over enumeration. The canvasser method, which involves trained field personnel visiting
houses and households identified in their respective enumeration areas, was adopted for the
2010 PHC.
The main census enumeration involved the canvassing of all categories of the population by
trained enumerators, using questionnaires prepared and tested during the pre-enumeration
phase. Specific arrangements were made for the coverage of special population groups, such
as the homeless and the floating population. The fieldwork began on 21st September 2010
with the identification of EA boundaries, listing of structures, enumeration of institutional
population and floating population.
The week preceding the Census Night was used by field personnel to list houses and other
structures in their enumeration areas. Enumerators were also mobilized to enumerate
residents/inmates of institutions, such as, schools and prisons. They returned to the
institutions during the enumeration period to reconcile the information they obtained from
individuals and also to cross out names of those who were absent from the institutions on
Census Night. Out-door sleepers (floating population) were also enumerated on the Census
Night.
Enumeration of the household population started on Monday, 27th
September, 2010.
Enumerators visited houses, compounds and structures in their enumeration areas and started
enumerating all households including visitors who spent the Census Night in the households.
Enumeration was carried out in the order in which houses/structures were listed and where
the members of the household were absent, the enumerator left a call-back-card indicating
when he/she would come back to enumerate the household. The enumeration process took off
smoothly with enumerators poised on completing their assignments on schedule since many
of them were teachers and had to return to school. However, many enumerators ran short of
questionnaires after a few days’ work.
Enumeration resumed in all districts when the questionnaire shortage was resolved and by
17th
October, 2010, enumeration was completed in most districts. Enumerators who had
finished their work were mobilized to assist in the enumeration of localities that were yet to
be enumerated in some regional capitals and other fast growing areas. Flooded areas and
other inaccessible localities were also enumerated after the end of the official enumeration
period. Because some enumeration areas in fast growing cities and towns, such as, Accra
Metropolitan Area, Kumasi, Kasoa and Techiman were not properly demarcated and some
were characterized by large EAs, some enumerators were unable to complete their assigned
tasks within the stipulated time.
1.6.4 Post enumeration survey
In line with United Nations recommendations, GSS conducted a Post Enumeration Survey
(PES) in April, 2011 to check content and coverage error. The PES was also to serve as an
important tool in providing feedback regarding operational matters such as concepts and
procedures in order to help improve future census operations. The PES field work was
carried out for 21 days in April 2011 and was closely monitored and supervised to ensure
quality output. The main findings of the PES were that:

8
97.0 percent of all household residents who were in the country on Census Night (26th
September, 2010) were enumerated.
1.3 percent of the population was erroneously included in the census.
Regional differentials are observed. Upper East region recorded the highest coverage
rate of 98.2 percent while the Volta region had the lowest coverage rate of 95.7
percent.
Males (3.3%) were more likely than females (2.8%) to be omitted in the census. The
coverage rate for males was 96.7 percent and the coverage rate for females was 97.2
percent. Also, the coverage rates (94.1%) for those within the 20-29 and 30-39 age
groups are relatively lower compared to the coverage rates of the other age groups.
There was a high rate of agreement between the 2010 PHC data and the PES data for
sex (98.8%), marital status (94.6%), relationship to head of household (90.5%) and
age (83.0%).
1.6.5 Release and dissemination of results
The provisional results of the census were released in February 2011 and the final results in
May 2012. A National Analytical report, six thematic reports, a Census Atlas, 10 Regional
Reports and a report on Demographic, Social, Economic and Housing were prepared and
disseminated in 2013.
1.6.6 Concepts and definitions
The 2010 Population and Housing Census of Ghana followed the essential concepts and
definitions of a modern Population and Housing Census as recommended by the United
Nations (UN). It is important that the concepts, definitions and recommendations are adhered
to since they form the basis upon which Ghana could compare her data with that of other
countries.
The concepts and definitions in this report cover all sections of the 2010 Population and
Housing Census questionnaires (PHC1A and PHC1B). The sections were: geographical
location of the population, Household and Non-household population, Literacy and
Education, Emigration, Demographic and Economic Characteristics, Disability, Information
Communication Technology (ICT), Fertility, Mortality, Agricultural Activity and Housing
Conditions.
The concepts and definitions are provided to facilitate understanding and use of the data
presented in this report. Users are therefore advised to use the results of the census within the
context of these concepts and definitions.
Region
There were ten (10) administrative regions in Ghana during the 2010 Population and Housing
Census as they were in 1984 and 2000.
District
In 1988, Ghana changed from the local authority system of administration to the district
assembly system. In that year, the then existing 140 local authorities were demarcated into
110 districts. In 2004, 28 new districts were created; this increased the number of districts in

9
the country to 138. In 2008, 32 additional districts were created bringing the total number of
districts to 170. The 2010 Population and Housing Census was conducted in these 170
administrative districts (these are made-up of 164 districts/municipals and 6 metropolitan
areas). In 2012, 46 new districts were created to bring the total number of districts to 216.
There was urgent need for data for the 46 newly created districts for planning and decision-
making. To meet this demand, the 2010 Census data was re-programmed into 216 districts
after carrying out additional fieldwork and consultations with stakeholders in the districts
affected by the creation of the new districts.
Locality
A locality was defined as a distinct population cluster (also designated as inhabited place,
populated centre, settlement) which has a NAME or LOCALLY RECOGNISED STATUS. It
included fishing hamlets, mining camps, ranches, farms, market towns, villages, towns, cities
and many other types of population clusters, which meet the above criteria. There were two
main types of localities, rural and urban. As in previous censuses, the classification of
localities into ‘urban’ and ‘rural’ was based on population size. Localities with 5,000 or more
persons were classified as urban while localities with less than 5,000 persons were classified
as rural.
Population
The 2010 Census was a “de facto” count and each person present in Ghana, irrespective of
nationality, was enumerated at the place where he/she spent the midnight of 26th September
2010.
Household
A household was defined as a person or a group of persons, who lived together in the same
house or compound and shared the same house-keeping arrangements. In general, a
household consisted of a man, his wife, children and some other relatives or a house help who
may be living with them. However, it is important to remember that members of a household
are not necessarily related (by blood or marriage) because non-relatives (e.g. house helps)
may form part of a household.
Head of household
The household head was defined as a male or female member of the household recognised as
such by the other household members. The head of household is generally the person who has
economic and social responsibility for the household. All relationships are defined with
reference to the head.
Household and non-household population
Household population comprised of all persons who spent the census night in a household
setting. All persons who did not spend the census night in a household setting (except
otherwise stated) were classified as non-household population. Persons who spent census
night in any of the under listed institutions and locations were classified as non-household
population:
a) Educational institutions
b) Children's and old people’s homes

10
c) Hospitals and healing centres
d) Hotels
e) Prisons
f) Service barracks
g) Soldiers on field exercise
h) Floating population: The following are examples of persons in this category:
i. All persons who slept in lorry parks, markets, in front of stores and offices, public
bathrooms, petrol filling stations, railway stations, verandas, pavements, and all
such places which are not houses or compounds.
ii. Hunting and fishing camps.
iii. Beggars and vagrants (mentally sick or otherwise).
Age
The age of every person was recorded in completed years disregarding fractions of days and
months. For those persons who did not know their birthdays, the enumerator estimated their
ages using a list of district, regional and national historical events.
Nationality
Nationality is defined as the country to which a person belongs. A distinction is made
between Ghanaians and other nationals. Ghanaian nationals are grouped into Ghanaian by
birth, Ghanaian with dual nationality and Ghanaian by naturalization. Other nationals are
grouped into ECOWAS nationals, Africans other than ECOWAS nationals, and non-
Africans.
Ethnicity
Ethnicity refers to the ethnic group that a person belonged to. This information is collected
only from Ghanaians by birth and Ghanaians with dual nationality. The classification of
ethnic groups in Ghana is that officially provided by the Bureau of Ghana Languages and
which has been in use since the 1960 census.
Birthplace
The birthplace of a person refers to the locality of usual residence of the mother at the time of
birth. If after delivery a mother stayed outside her locality of usual residence for six months
or more or had the intention of staying in the new place for six or more months, then the
actual town/village of physical birth becomes the birthplace of the child.
Duration of residence
Duration of residence refers to the number of years a person has lived in a particular place.
This question is only asked of persons not born in the place where enumeration took place.
Breaks in duration of residence lasting less than 12 months are disregarded. The duration of
residence of persons who made multiple movements of one (1) year or more is assumed to be
the number of years lived in the locality (town or village) since the last movement.
11
Religion
Religion refers to the individual’s religious affiliation as reported by the respondent,
irrespective of the religion of the household head or the head’s spouse or the name of the
person. No attempt was made to find out if respondents actually practiced the faith they
professed.
Marital status
Marital status refers to the respondent’s marital status as at Census Night. The question on
marital status was asked only of persons 12 years and older. The selection of the age limit of
12 years was based on the average age at menarche and also on the practice in some parts of
the country where girls as young as 12 years old could be given in marriage.
Literacy
The question on literacy referred to the respondent's ability to read and write in any language.
A person was considered literate if he/she could read and write a simple statement with
understanding. The question on literacy was asked only of persons 11 years and older.
Education
School attendance
Data was collected on school attendance for all persons three (3) years and older. School
attendance refers to whether a person has ever attended, was currently attending or has never
attended school. In the census, school meant an educational institution where a person
received at least four hours of formal education.
Although the lower age limit of formal education is six years for primary one, eligibility for
the school attendance question was lowered to three years because pre-school education has
become an important phenomenon in the country.
Level of education
Level of education refers to the highest level of formal school that a person ever attended or
was attending. This information was obtained for persons 3 years and older.
Activity status
Activity status refers to economic or non-economic activity of respondents during the 7 days
preceding census night. Information on type of activity was collected on persons 5 years and
older. A person was regarded as economically active if he/she:
a. Worked for pay or profit or family gain for at least 1 hour within the 7 days preceding
Census Night. This included persons who were in paid employment or self-
employment or contributing family workers.
b. Did not work, but had jobs to return to.
c. Were unemployed.
The economically not active were persons who did not work and were not seeking for work.
They were classified by reasons for not being economically active. Economically not active
persons included homemakers, students, retired persons, the disabled and persons who were
unable to work due to their age or ill-health.
12
Occupation
This referred to the type of work the person was engaged in at the establishment where he/she
worked. This was asked only of persons 5 years and older who worked 7 days before the
census night, and those who did not work but had a job to return to as well as those
unemployed who had worked before. All persons who worked during the 7 days before the
census night were classified by the kind of work they were engaged in. The emphasis was on
the work the person did during the reference period and not what he/she was trained to do.
For those who did not work but had a job to return to, their occupation was the job they
would go back to after the period of absence. Also, for persons who had worked before and
were seeking for work and available for work, their occupation was on the last work they did
before becoming unemployed. If a person was engaged in more than one occupation, only the
main one was considered.
Industry
Industry referred to the type of product produced or service rendered at the respondent’s work
place. Information was collected only on the main product produced or service rendered in
the establishment during the reference period.
Employment status
Employment status refers to the status of a person in the establishment where he/she currently
works or previously worked. Eight employment status categories were provided: employee,
self-employed without employees, self-employed with employees, casual worker,
contributing family worker, apprentice, domestic employee (house help). Persons who could
not be classified under any of the above categories were classified as “other”.
Employment sector
This refers to the sector in which a person worked. The employment sectors covered in the
census were public, private formal, private informal, semi-public/parastatal, NGOs and
international organizations.
Disability
Persons with disability were defined as those who were unable to or were restricted in the
performance of specific tasks/activities due to loss of function of some part of the body as a
result of impairment or malformation. Information was collected on persons with visual/sight
impairment, hearing impairment, mental retardation, emotional or behavioural disorders and
other physical challenges.
Information Communication Technology (ICT)
Information Communication Technology (ICT) questions were asked for both individuals and
households. Persons having mobile phones refer to respondents 12 years and older who
owned mobile phones (irrespective of the number of mobile phones owned by each person).
Persons using internet facility refers to those who had access to internet facility at home,
internet cafe, on mobile phone or other mobile device. Internet access is assumed to be not
only via computer, but also by mobile phones, PDA, game machine and digital television.
Households having personal computers/laptops refer to households who own desktops/laptop
computers. The fixed telephone line refers to a telephone line connecting a customer’s
13
terminal equipment (e.g. telephone set, facsimile machine) to the public switch telephone
network.
Fertility
Two types of fertility data were collected: lifetime fertility and current fertility. Lifetime
fertility refers to the total number of live births that females 12 years and older had ever had
during their life time. Current fertility refers to the number of live births that females 12-54
years old had in the 12 months preceding the Census Night.
Mortality
Mortality refers to all deaths that occurred in the household during the 12 months preceding
the Census Night. The report presents information on deaths due to accidents, violence,
homicide and suicide. In addition, data were collected on pregnancy-related deaths of
females 12-54 years.
Agriculture
The census sought information on household members who are engaged in agricultural
activities, including the cultivation of crops or tree planting, rearing of livestock or breeding
of fish for sale or family consumption. Information was also collected on their farms, types of
crops and number and type of livestock.
Housing conditions and facilities
The UN recommended definition of a house as “a structurally separate and independent place
of abode such that a person or group of persons can isolate themselves from the hazards of
climate such as storms and the sun’’ was adopted. The definition, therefore, covered any type
of shelter used as living quarters, such as separate houses, semi-detached houses,
flats/apartments, compound houses, huts, tents, kiosks and containers.
Living quarters or dwelling units refer to a specific area or space occupied by a particular
household and therefore need not necessarily be the same as the house of which the dwelling
unit may be a part.
Information collected on housing conditions included the type of dwelling unit, main
construction materials for walls, floor and roof, holding/tenure arrangement, ownership type,
type of lighting, source of water supply and toilet facilities. Data was also collected on
method of disposal of solid and liquid waste.
1.7 Organization of the Report
The report consists of nine chapters. Chapter one provides basic information about the
district. It gives a brief background of the district, describing its physical features, political
and administrative structure, social and cultural structure, economy and the methodology and
concepts used in the report. Chapter two discusses the population size, composition and age
structure. It further discusses the migratory pattern in the district as well as fertility and
mortality.
In chapter three, the focus is on household size, composition and headship as well as the
marital characteristics and nationality of the inhabitants of the district. The chapter also
discusses the religious affiliations and the educational statuses of the members of the district.
Chapter four focuses on economic characteristics such as economic activity status,
14
occupation, industries and the employment status and sectors that the people are employed.
Information Communication Technology (ICT) is discussed in chapter five. It analyses
mobile phone ownership, internet use and ownership of desktop/laptop computers while
chapter six is devoted to Persons living with disabilities (PWDs) and their socio-demographic
characteristics. Chapter seven concentrates on the agricultural activities of the households,
describing the types of farming activities, livestock rearing and numbers of livestock reared.
In chapter eight, housing conditions such as housing stock, type of dwelling and construction
materials, room occupancy, holding and tenancy, lighting and cooking facilities, bathing and
toilet facilities, waste disposal and source of water for drinking or for other domestic use in
the district are discussed and analyzed in detail. The final chapter, Chapter nine presents the
summary of findings and conclusions. It also discusses the policy implications of the findings
for the district.
15
CHAPTER TWO
DEMOGRAPHIC CHARACTERISTICS
2.1 Introduction
An important characteristic of a population is its age-sex structure. All demographic trends
are influenced by age and sex. An understanding the age and sex structure of a population
provides insights into changing population composition and highlights social and economic
challenges. Government uses information on age and sex composition of the population in
planning and provision of services. This chapter presents information on the population size,
age and sex composition of Awutu Senya District in 2010.
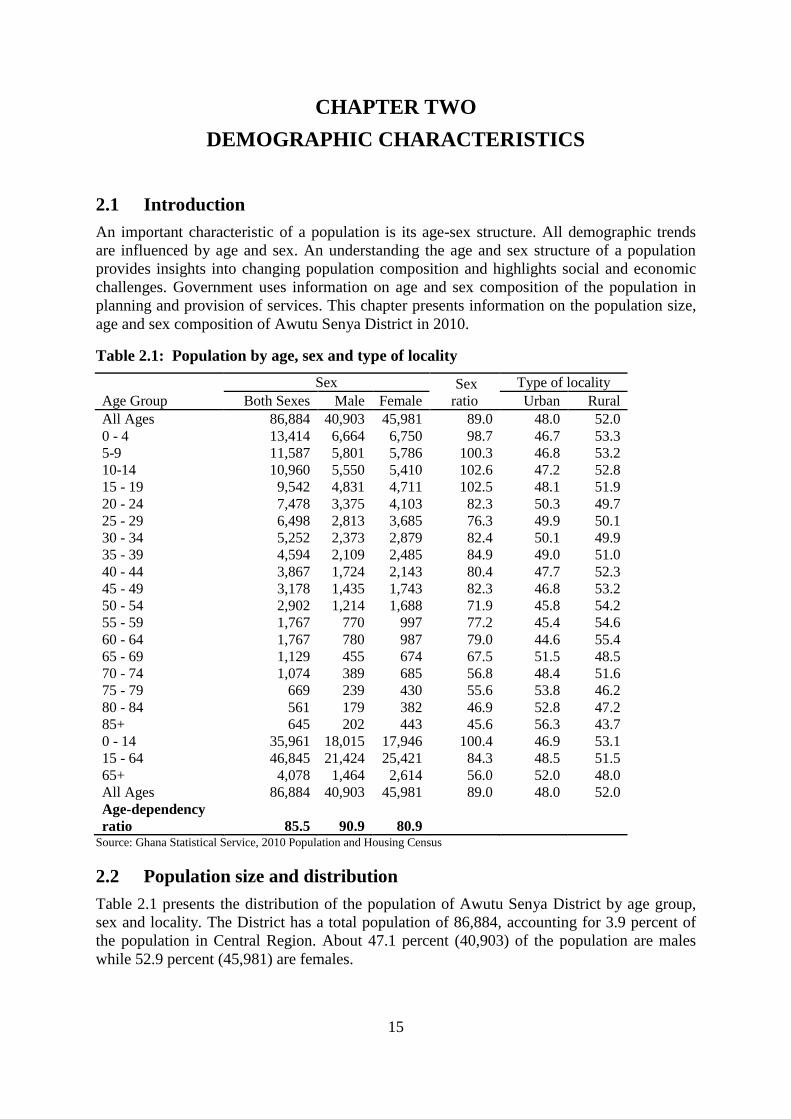
Table 2.1: Population by age, sex and type of locality
Age Group
Sex Sex
ratio
Type of locality
Both Sexes Male Female Urban Rural
All Ages 86,884 40,903 45,981 89.0 48.0 52.0
0 - 4 13,414 6,664 6,750 98.7 46.7 53.3
5-9 11,587 5,801 5,786 100.3 46.8 53.2
10-14 10,960 5,550 5,410 102.6 47.2 52.8
15 - 19 9,542 4,831 4,711 102.5 48.1 51.9
20 - 24 7,478 3,375 4,103 82.3 50.3 49.7
25 - 29 6,498 2,813 3,685 76.3 49.9 50.1
30 - 34 5,252 2,373 2,879 82.4 50.1 49.9
35 - 39 4,594 2,109 2,485 84.9 49.0 51.0
40 - 44 3,867 1,724 2,143 80.4 47.7 52.3
45 - 49 3,178 1,435 1,743 82.3 46.8 53.2
50 - 54 2,902 1,214 1,688 71.9 45.8 54.2
55 - 59 1,767 770 997 77.2 45.4 54.6
60 - 64 1,767 780 987 79.0 44.6 55.4
65 - 69 1,129 455 674 67.5 51.5 48.5
70 - 74 1,074 389 685 56.8 48.4 51.6
75 - 79 669 239 430 55.6 53.8 46.2
80 - 84 561 179 382 46.9 52.8 47.2
85+ 645 202 443 45.6 56.3 43.7
0 - 14 35,961 18,015 17,946 100.4 46.9 53.1
15 - 64 46,845 21,424 25,421 84.3 48.5 51.5
65+ 4,078 1,464 2,614 56.0 52.0 48.0
All Ages 86,884 40,903 45,981 89.0 48.0 52.0
Age-dependency
ratio 85.5 90.9 80.9 Source: Ghana Statistical Service, 2010 Population and Housing Census
2.2 Population size and distribution
Table 2.1 presents the distribution of the population of Awutu Senya District by age group,
sex and locality. The District has a total population of 86,884, accounting for 3.9 percent of
the population in Central Region. About 47.1 percent (40,903) of the population are males
while 52.9 percent (45,981) are females.
16
The District depicts a highly youthful population. The proportion of the population below 15
years is 41.7 percent compared to the regional average of 39.5 percent. The District has a sex
ratio of 89.0 meaning there are about 89 males for every 100 females in the population. The
proportion of the population living in urban areas is 48 percent compared to 52 percent in the
rural areas.
2.2.1 Dependency ratio
The dependency ratio which measures the ratio of dependent population (population aged
under 15 years and above 64 years) to population in the “working-age group” (population
aged 15-64 years) is one of the key indicators of socioeconomic development. Generally the
ratio is high in developing regions of the world than developed regions, reflecting
demographic experiences of the two regions. Table 2.1 further provides information on
dependency ratios for Awutu Senya district. The district total age dependency of 85.5
dependents (child and old age) to 100 working population is quite high. The dependency ratio
is relatively high for the male population (90.9) than the female population (80.9).
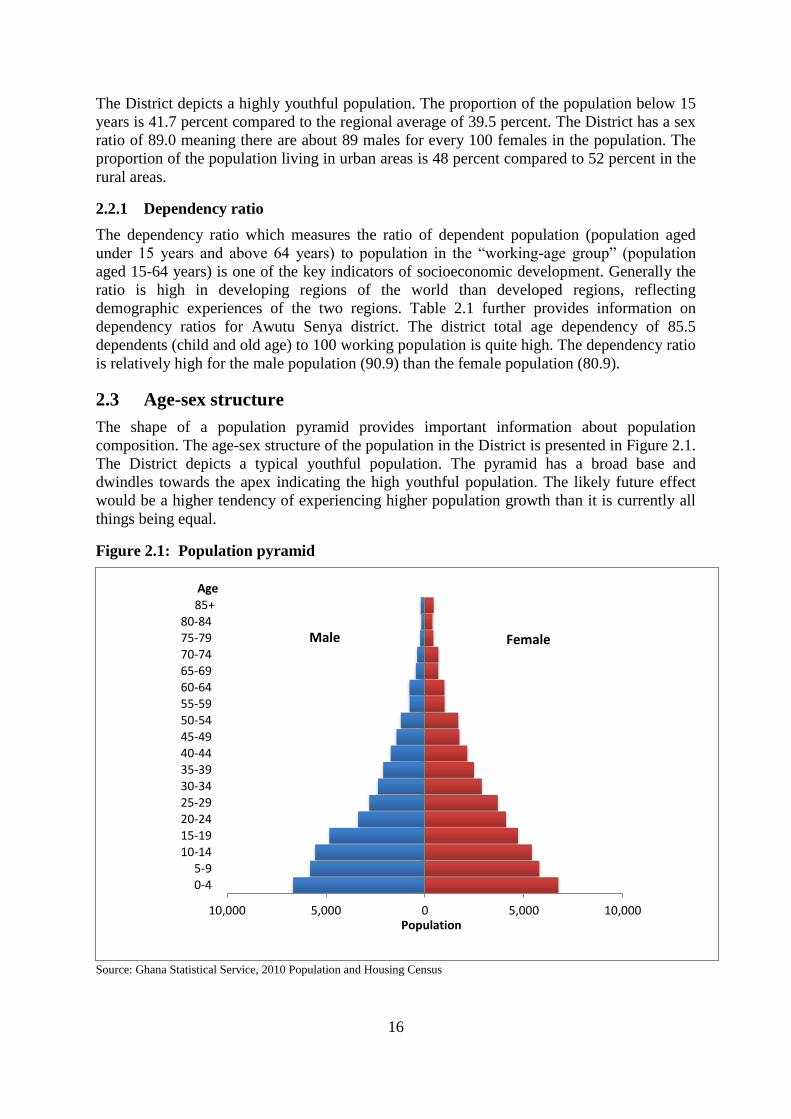
2.3 Age-sex structure
The shape of a population pyramid provides important information about population
composition. The age-sex structure of the population in the District is presented in Figure 2.1.
The District depicts a typical youthful population. The pyramid has a broad base and
dwindles towards the apex indicating the high youthful population. The likely future effect
would be a higher tendency of experiencing higher population growth than it is currently all
things being equal.
Figure 2.1: Population pyramid
Source: Ghana Statistical Service, 2010 Population and Housing Census
10,000 5,000 0 5,000 10,000
0-4 5-9
10-14 15-19 20-24 25-29 30-34 35-39 40-44 45-49 50-54 55-59 60-64 65-69 70-74 75-79 80-84
85+
Population
Age
Female Male

17
2.4 Fertility, Mortality and Migration
Fertility, mortality and migration are the three components of population change that
determine the size, age-sex composition and distribution of the population at a particular
point in time. Data on these three components are critical for planning the overall
socioeconomic development of the district. The objective of this section of the report is to
provide analysis of fertility, mortality and migration patterns in the district using data from
the 2010 population and housing census.
2.4.1 Fertility
Measures of fertility are important in determining the size and structure of the population.
Information on fertility in the district is therefore critical for the management of the
population for social and economic development. This section reports on fertility levels in
the district.
Two types of fertility measures are used to examine levels of fertility in the district. These are
current fertility measures and cumulative fertility measures. Current fertility measures such as
total fertility rate (TFR) are based on data covering a short period of time such as a year ( in
the case of population censuses) or five years (in surveys), while cumulative measures such
as mean children ever born are based on retrospective fertility data covering women’s
reproductive performance over their lifetime.
The most commonly used measures of current fertility are the total fertility rate (TFR). It is
defined as the number of children a woman would have by the end of her childbearing years
if she were to experience the currently observed age-specific fertility rates. Table 2.2
provides information on total fertility rate, general fertility rate and crude birth rate by district
for Central Region.
A total of 2,496 births occurred in the district in the 12 months preceding the census. The
Total Fertility Rate (TFR) for the district is 3.9, which is higher than the regional average of
3.6. This means that a woman living in the district would have, on average, 3.9 children at the
end of her reproductive period (15-49 years) if the current age specific fertility rates continue
to prevail.
The General Fertility Rate which indicates the number of births per 1,000 women of
reproductive age (15-49 years) is 114.8 compared to the regional average of 105.3. Similarly,
Awutu Senya District’s Crude Birth Rate of 28.7 per 1,000 population is higher than that of
the regional average at 26.5 per 1,000 population.

18
Table 2.2: Reported total fertility rate, general fertility rate and crude birth rate
by district
District Population
Number of
women 15-
49 years
Number of
births in last
12 months
Total
Fertility
Rate
*General
Fertility
Rate
**Crude
Birth
Rate
All Districts 2,201,863 553,384 58,292 3.6 105.3 26.5
Gomoa East 207,071 54,787 6,159 3.7 112.4 29.7
Cape Coast Metropolis 169,894 51,308 3,009 2.2 58.6 17.7
Assin North Municipal 161,341 38,331 4,687 4.1 122.3 29.1
Komenda-Edina-Egyafo-Abirem
Municipal 144,705 33,902 3,561 3.6 105.0 24.6
Mfantsiman 144,332 39,462 3,537 3.4 89.6 24.5
Ajumako-Enyan-Essiam 138,046 31,419 3,600 4.0 114.6 26.1
Gomoa West 135,189 32,740 3,657 3.8 111.7 27.1
Abura-Asebu-Kwamankese 117,185 27,603 3,308 4.1 119.8 28.2
Agona West Municipal 115,358 29,580 2,679 3.1 90.6 23.2
Asikuma-Odoben Brakwa 112,706 25,731 3,470 4.7 134.9 30.8
Awutu Senya East Municipal 108,422 30,770 2,749 3.0 89.3 25.4
Assin South 104,244 23,709 2,986 4.3 125.9 28.6
Awutu Senya 86,884 21,749 2,496 3.9 114.8 28.7
Agona East 85,920 20,368 2,408 4.0 118.2 28.0
Upper Denkyira East Municipal 72,810 18,690 1,972 3.5 105.5 27.1
Effutu Municipal 68,597 19,261 1,629 2.9 84.6 23.7
Twifo Ati Morkwa 61,743 15,283 1,822 4.1 119.2 29.5
Upper Denkyira West 60,054 13,789 1,862 4.5 135.0 31.0
Twifo Heman Lower Denkyira 55,131 13,308 1,411 3.6 106.0 25.6
Ekumfi 52,231 11,594 1,290 4.0 111.3 24.7 Source: Ghana Statistical Service, 2010 Population and Housing Census
Note: * Number of live births per 1,000 women aged 15-49 years ** Number of live births per 1,000 population
Children Ever Born and Children Surviving
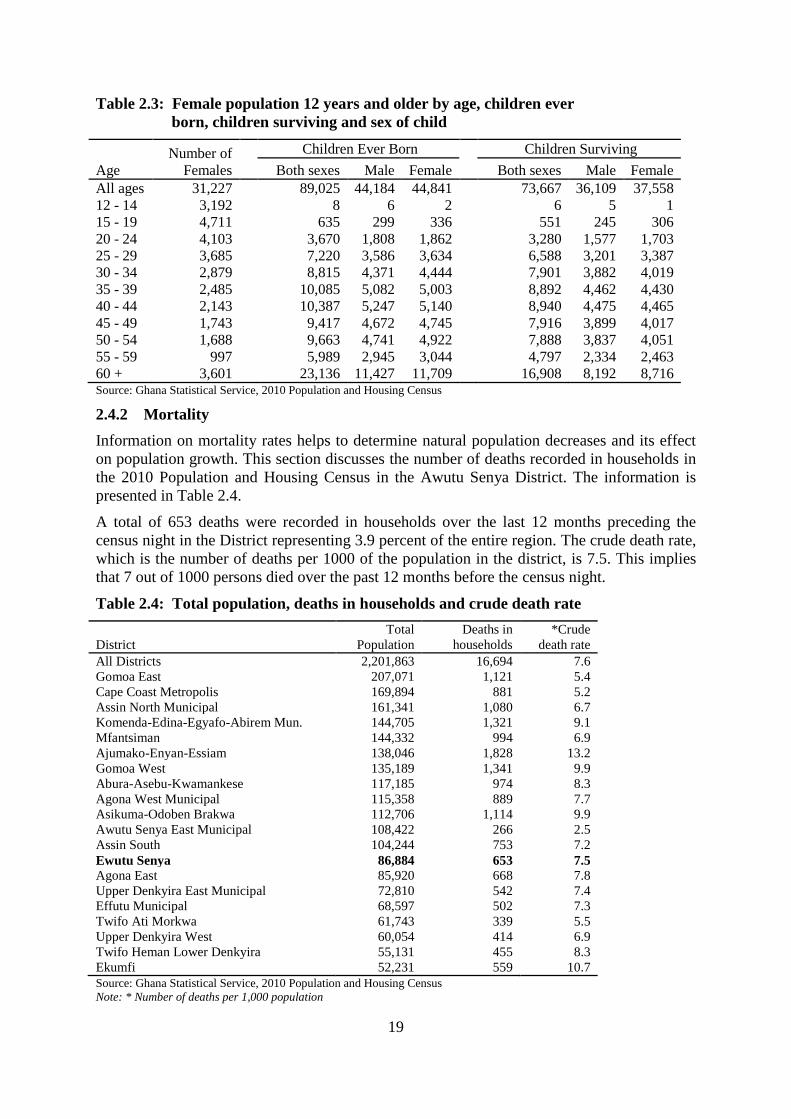
Table 2.3 provides information on children ever born and children surviving by females 12
years and older by age group. It is interesting to note that child bearing starts as early as ages
12-14 with children ever born to this age bracket in the Awutu Senya District being eight for
children ever born and six children surviving. The number of children ever born to females
12 years and older increases progressively from eight for the youthful ages 12-19 years to
10,387 in the mid ages 40-44.
Children surviving refer to the number of children ever born alive to female population 12
years and older and were living as at the time of the enumeration. The table shows that
73,667 out of 89,025 children ever born are surviving. This is made up of 36,109 males and
37,558 females.
19
Table 2.3: Female population 12 years and older by age, children ever
born, children surviving and sex of child
Age
Number of
Females
Children Ever Born Children Surviving
Both sexes Male Female Both sexes Male Female
All ages 31,227
89,025 44,184 44,841
73,667 36,109 37,558
12 - 14 3,192
8 6 2
6 5 1
15 - 19 4,711
635 299 336
551 245 306
20 - 24 4,103
3,670 1,808 1,862
3,280 1,577 1,703
25 - 29 3,685
7,220 3,586 3,634
6,588 3,201 3,387
30 - 34 2,879
8,815 4,371 4,444
7,901 3,882 4,019
35 - 39 2,485
10,085 5,082 5,003
8,892 4,462 4,430
40 - 44 2,143
10,387 5,247 5,140
8,940 4,475 4,465
45 - 49 1,743
9,417 4,672 4,745
7,916 3,899 4,017
50 - 54 1,688
9,663 4,741 4,922
7,888 3,837 4,051
55 - 59 997
5,989 2,945 3,044
4,797 2,334 2,463
60 + 3,601 23,136 11,427 11,709 16,908 8,192 8,716 Source: Ghana Statistical Service, 2010 Population and Housing Census
2.4.2 Mortality
Information on mortality rates helps to determine natural population decreases and its effect
on population growth. This section discusses the number of deaths recorded in households in
the 2010 Population and Housing Census in the Awutu Senya District. The information is
presented in Table 2.4.
A total of 653 deaths were recorded in households over the last 12 months preceding the
census night in the District representing 3.9 percent of the entire region. The crude death rate,
which is the number of deaths per 1000 of the population in the district, is 7.5. This implies
that 7 out of 1000 persons died over the past 12 months before the census night.
Table 2.4: Total population, deaths in households and crude death rate
District
Total
Population
Deaths in
households
*Crude
death rate
All Districts 2,201,863 16,694 7.6
Gomoa East 207,071 1,121 5.4
Cape Coast Metropolis 169,894 881 5.2
Assin North Municipal 161,341 1,080 6.7
Komenda-Edina-Egyafo-Abirem Mun. 144,705 1,321 9.1
Mfantsiman 144,332 994 6.9
Ajumako-Enyan-Essiam 138,046 1,828 13.2
Gomoa West 135,189 1,341 9.9
Abura-Asebu-Kwamankese 117,185 974 8.3
Agona West Municipal 115,358 889 7.7
Asikuma-Odoben Brakwa 112,706 1,114 9.9
Awutu Senya East Municipal 108,422 266 2.5
Assin South 104,244 753 7.2
Ewutu Senya 86,884 653 7.5
Agona East 85,920 668 7.8
Upper Denkyira East Municipal 72,810 542 7.4
Effutu Municipal 68,597 502 7.3
Twifo Ati Morkwa 61,743 339 5.5
Upper Denkyira West 60,054 414 6.9
Twifo Heman Lower Denkyira 55,131 455 8.3
Ekumfi 52,231 559 10.7
Source: Ghana Statistical Service, 2010 Population and Housing Census
Note: * Number of deaths per 1,000 population
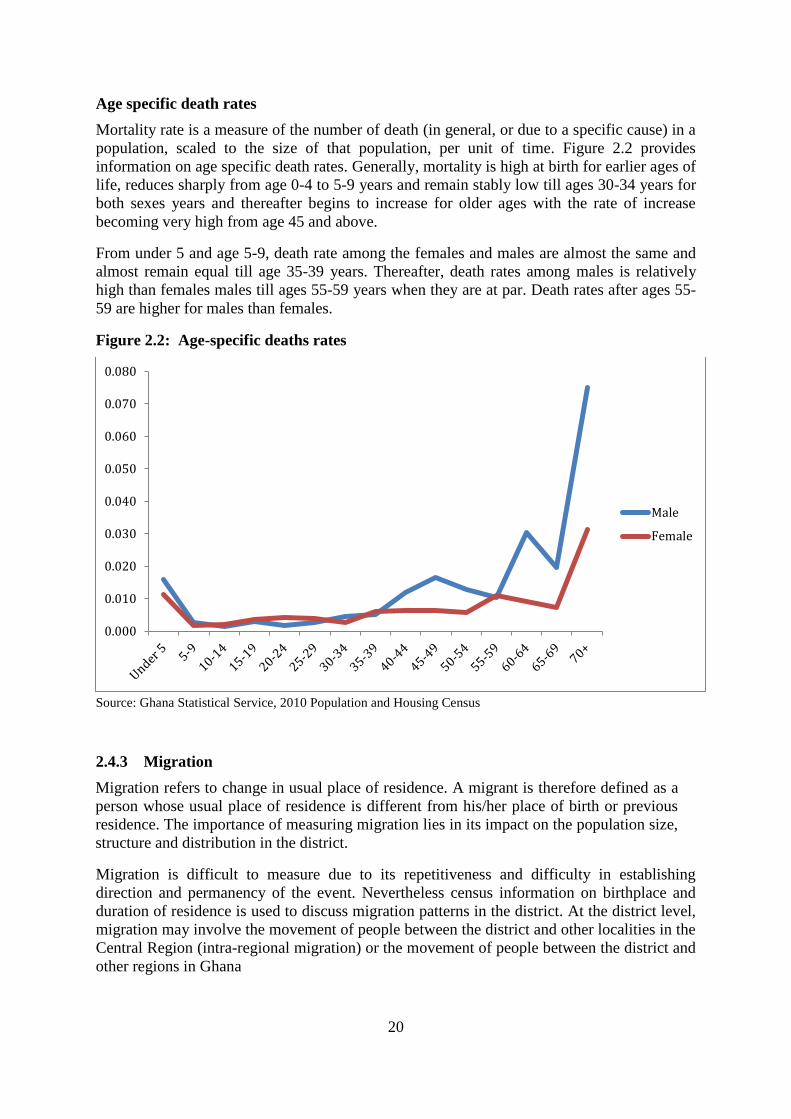
20
Age specific death rates
Mortality rate is a measure of the number of death (in general, or due to a specific cause) in a
population, scaled to the size of that population, per unit of time. Figure 2.2 provides
information on age specific death rates. Generally, mortality is high at birth for earlier ages of
life, reduces sharply from age 0-4 to 5-9 years and remain stably low till ages 30-34 years for
both sexes years and thereafter begins to increase for older ages with the rate of increase
becoming very high from age 45 and above.
From under 5 and age 5-9, death rate among the females and males are almost the same and
almost remain equal till age 35-39 years. Thereafter, death rates among males is relatively
high than females males till ages 55-59 years when they are at par. Death rates after ages 55-
59 are higher for males than females.
Figure 2.2: Age-specific deaths rates
Source: Ghana Statistical Service, 2010 Population and Housing Census
2.4.3 Migration
Migration refers to change in usual place of residence. A migrant is therefore defined as a
person whose usual place of residence is different from his/her place of birth or previous
residence. The importance of measuring migration lies in its impact on the population size,
structure and distribution in the district.
Migration is difficult to measure due to its repetitiveness and difficulty in establishing
direction and permanency of the event. Nevertheless census information on birthplace and
duration of residence is used to discuss migration patterns in the district. At the district level,
migration may involve the movement of people between the district and other localities in the
Central Region (intra-regional migration) or the movement of people between the district and
other regions in Ghana
0.000
0.010
0.020
0.030
0.040
0.050
0.060
0.070
0.080
Male
Female
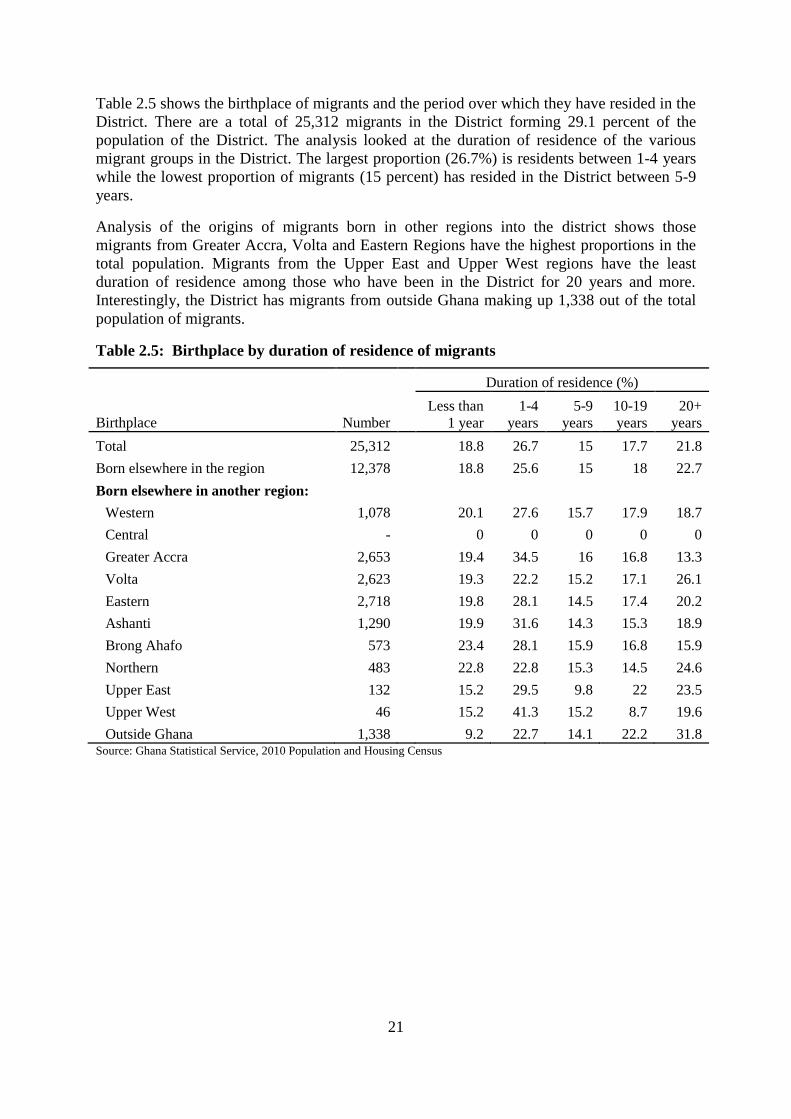
21
Table 2.5 shows the birthplace of migrants and the period over which they have resided in the
District. There are a total of 25,312 migrants in the District forming 29.1 percent of the
population of the District. The analysis looked at the duration of residence of the various
migrant groups in the District. The largest proportion (26.7%) is residents between 1-4 years
while the lowest proportion of migrants (15 percent) has resided in the District between 5-9
years.
Analysis of the origins of migrants born in other regions into the district shows those
migrants from Greater Accra, Volta and Eastern Regions have the highest proportions in the
total population. Migrants from the Upper East and Upper West regions have the least
duration of residence among those who have been in the District for 20 years and more.
Interestingly, the District has migrants from outside Ghana making up 1,338 out of the total
population of migrants.
Table 2.5: Birthplace by duration of residence of migrants
Birthplace Number
Duration of residence (%)
Less than
1 year
1-4
years
5-9
years
10-19
years
20+
years
Total 25,312
18.8 26.7 15 17.7 21.8
Born elsewhere in the region 12,378
18.8 25.6 15 18 22.7
Born elsewhere in another region:
Western 1,078
20.1 27.6 15.7 17.9 18.7
Central -
0 0 0 0 0
Greater Accra 2,653
19.4 34.5 16 16.8 13.3
Volta 2,623
19.3 22.2 15.2 17.1 26.1
Eastern 2,718
19.8 28.1 14.5 17.4 20.2
Ashanti 1,290
19.9 31.6 14.3 15.3 18.9
Brong Ahafo 573
23.4 28.1 15.9 16.8 15.9
Northern 483
22.8 22.8 15.3 14.5 24.6
Upper East 132
15.2 29.5 9.8 22 23.5
Upper West 46
15.2 41.3 15.2 8.7 19.6
Outside Ghana 1,338 9.2 22.7 14.1 22.2 31.8 Source: Ghana Statistical Service, 2010 Population and Housing Census
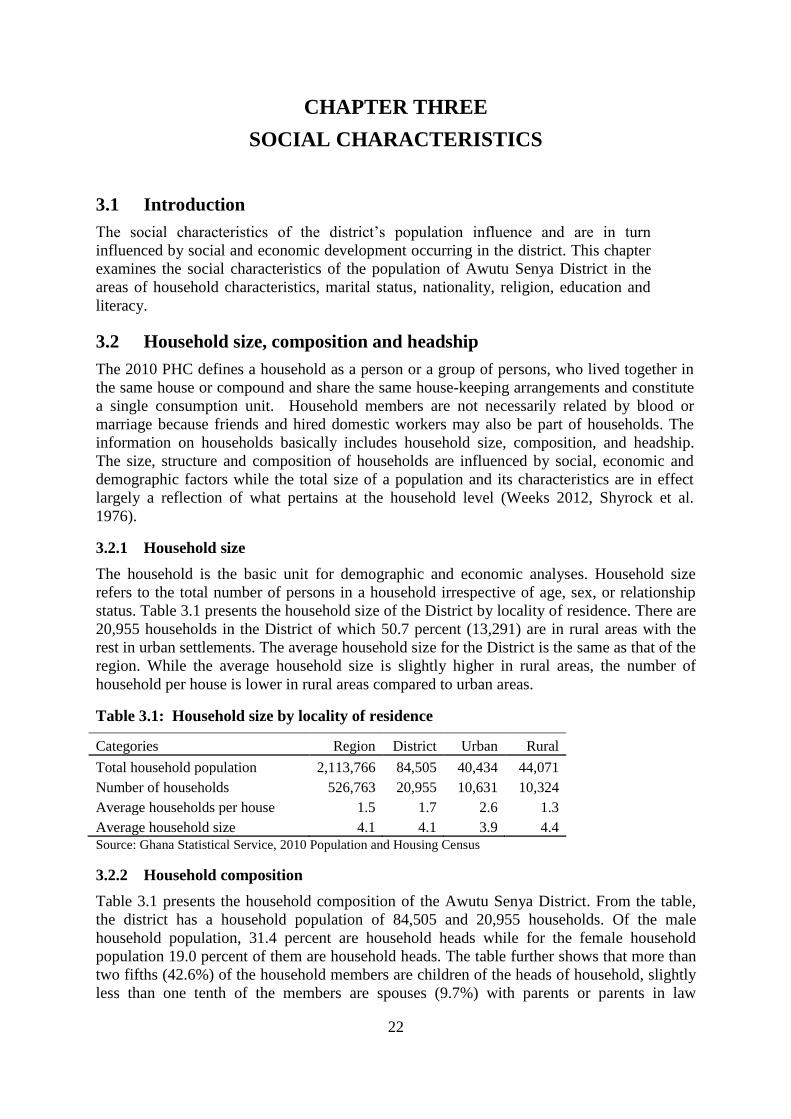
22
CHAPTER THREE
SOCIAL CHARACTERISTICS
3.1 Introduction
The social characteristics of the district’s population influence and are in turn
influenced by social and economic development occurring in the district. This chapter
examines the social characteristics of the population of Awutu Senya District in the
areas of household characteristics, marital status, nationality, religion, education and
literacy.
3.2 Household size, composition and headship
The 2010 PHC defines a household as a person or a group of persons, who lived together in
the same house or compound and share the same house-keeping arrangements and constitute
a single consumption unit. Household members are not necessarily related by blood or
marriage because friends and hired domestic workers may also be part of households. The
information on households basically includes household size, composition, and headship.
The size, structure and composition of households are influenced by social, economic and
demographic factors while the total size of a population and its characteristics are in effect
largely a reflection of what pertains at the household level (Weeks 2012, Shyrock et al.
1976).
3.2.1 Household size
The household is the basic unit for demographic and economic analyses. Household size
refers to the total number of persons in a household irrespective of age, sex, or relationship
status. Table 3.1 presents the household size of the District by locality of residence. There are
20,955 households in the District of which 50.7 percent (13,291) are in rural areas with the
rest in urban settlements. The average household size for the District is the same as that of the
region. While the average household size is slightly higher in rural areas, the number of
household per house is lower in rural areas compared to urban areas.
Table 3.1: Household size by locality of residence
Categories Region District Urban Rural
Total household population 2,113,766 84,505 40,434 44,071
Number of households 526,763 20,955 10,631 10,324
Average households per house 1.5 1.7 2.6 1.3
Average household size 4.1 4.1 3.9 4.4
Source: Ghana Statistical Service, 2010 Population and Housing Census
3.2.2 Household composition
Table 3.1 presents the household composition of the Awutu Senya District. From the table,
the district has a household population of 84,505 and 20,955 households. Of the male
household population, 31.4 percent are household heads while for the female household
population 19.0 percent of them are household heads. The table further shows that more than
two fifths (42.6%) of the household members are children of the heads of household, slightly
less than one tenth of the members are spouses (9.7%) with parents or parents in law

23
constituting less than one percent of the household population. Adopted/foster children
constitute a low 0.03 percent of the household population. The relatively high proportion of
grandchildren (10.3%) of the household population reflects a common living arrangement
that encourages the grandchildren of the household head and/or spouse to live in the
household rather than with their own nuclear families. Other relatives make up 6.4 percent of
households. However, 1.6 percent of household members are not related to the head of
household.
Table 3.2: Household population by composition and sex
Household composition
Total Male Female
Number Percent Number Percent Number Percent
Total 84,505 100.0
39,768 100.0
44,737 100.0
Head 20,955 24.8
12,469 31.4
8,486 19.0
Spouse (wife/husband) 8,224 9.7
523 1.3
7,701 17.2
Child (son/daughter) 36,002 42.6
17,738 44.6
18,264 40.8
Parent/parent in-law 620 0.7
66 0.2
554 1.2
Son/daughter in-law 327 0.4
79 0.2
248 0.6
Grandchild 8,671 10.3
4,204 10.6
4,467 10.0
Brother/Sister 2,176 2.6
1,164 2.9
1,012 2.3
Step child 590 0.7
306 0.8
284 0.6
Adopted/foster child 214 0.3
91 0.2
123 0.3
Other relative 5,404 6.4
2,361 5.9
3,043 6.8
Non-relative 1,322 1.6 767 1.9 555 1.2 Source: Ghana Statistical Service, 2010 Population and Housing Census
3.2.3 Household and population structure
The characteristics of any population usually reflect the features of its individual household
members within the population. The population size, composition, and structure of
households are influenced by socio-economic and demographic factors such as age at first
marriage, birth, length of time spent in school, cultural practices, occupation, material or
financial abilities, capabilities of parents and couples, fertility and mortality rates, and
migration. Knowledge of household structure and composition provide important statistical
tool for social and economic planning. A study of households also provides the basis for a
reasonable projection of the future size of population and planning of housing needs.
Table 3.3 summaries information about the household population and structure by sex for the
district. Living arrangement is an important aspect of the cultural settings in Ghana. The
table shows that 42,063 households are nuclear while 42,442 households are extended. This
indicates a slight dominance of extended family households in the District. For the nuclear
family households, the majority of households in the district are composed of head, spouse(s)
and children (28.9%) followed by single parenthood nuclear household (14.2%). Nearly five
percent of households in the district are heads only or single-person households. Households
comprising of the head and his or her spouse constitute 1.8 percent of total household
population.
Households with single parenthood and extended family members (19.3%) constitute the
largest proportion among the extended family category, followed by extended family
households consisting of the head, spouse(s), children and head’s relatives (16.8%). Head
with other composition but no spouse (9.2%) comes next.
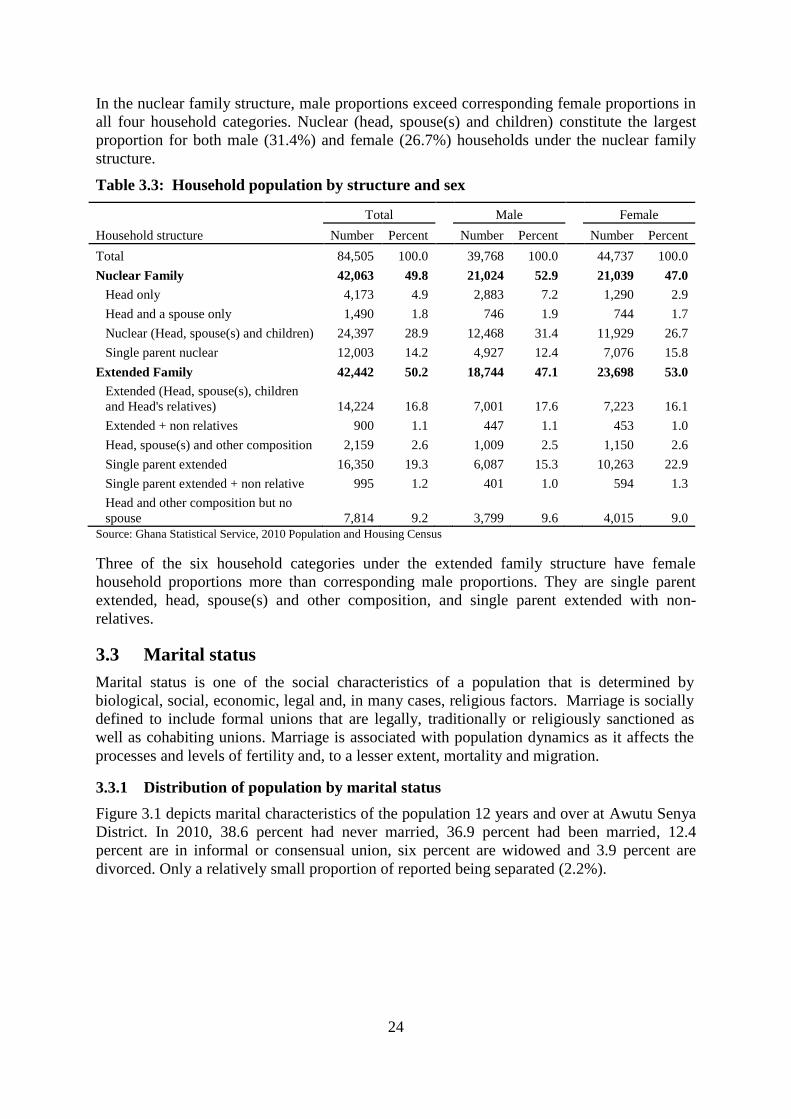
24
In the nuclear family structure, male proportions exceed corresponding female proportions in
all four household categories. Nuclear (head, spouse(s) and children) constitute the largest
proportion for both male (31.4%) and female (26.7%) households under the nuclear family
structure.
Table 3.3: Household population by structure and sex
Household structure
Total Male Female
Number Percent Number Percent Number Percent
Total 84,505 100.0
39,768 100.0
44,737 100.0
Nuclear Family 42,063 49.8
21,024 52.9
21,039 47.0
Head only 4,173 4.9
2,883 7.2
1,290 2.9
Head and a spouse only 1,490 1.8
746 1.9
744 1.7
Nuclear (Head, spouse(s) and children) 24,397 28.9
12,468 31.4
11,929 26.7
Single parent nuclear 12,003 14.2
4,927 12.4
7,076 15.8
Extended Family 42,442 50.2
18,744 47.1
23,698 53.0
Extended (Head, spouse(s), children
and Head's relatives) 14,224 16.8
7,001 17.6
7,223 16.1
Extended + non relatives 900 1.1
447 1.1
453 1.0
Head, spouse(s) and other composition 2,159 2.6
1,009 2.5
1,150 2.6
Single parent extended 16,350 19.3
6,087 15.3
10,263 22.9
Single parent extended + non relative 995 1.2
401 1.0
594 1.3
Head and other composition but no
spouse 7,814 9.2 3,799 9.6 4,015 9.0
Source: Ghana Statistical Service, 2010 Population and Housing Census
Three of the six household categories under the extended family structure have female
household proportions more than corresponding male proportions. They are single parent
extended, head, spouse(s) and other composition, and single parent extended with non-
relatives.
3.3 Marital status
Marital status is one of the social characteristics of a population that is determined by
biological, social, economic, legal and, in many cases, religious factors. Marriage is socially
defined to include formal unions that are legally, traditionally or religiously sanctioned as
well as cohabiting unions. Marriage is associated with population dynamics as it affects the
processes and levels of fertility and, to a lesser extent, mortality and migration.
3.3.1 Distribution of population by marital status
Figure 3.1 depicts marital characteristics of the population 12 years and over at Awutu Senya
District. In 2010, 38.6 percent had never married, 36.9 percent had been married, 12.4
percent are in informal or consensual union, six percent are widowed and 3.9 percent are
divorced. Only a relatively small proportion of reported being separated (2.2%).

25
Figure 3.1: Marital status of persons 12 years and older
Source: Ghana Statistical Service, 2010 Population and Housing Census
3.3.2 Marital status by age and sex
The distribution of marital characteristics by age and sex in the district is shown in Table 3.3.
As expected the majority (91.4%) of the never married population are adolescents who may
still be in school or training. The proportion married increases with age up to age group 45-49
years and then starts to decline for older ages.
Divorce is more prevalent after age 45-49 years probably as a result of effect duration of
marriage. Widowhood is also more common at the older ages, particularly among those 65
years and older (40.8%). Similar pattern is observed for both sexes but widowhood is
relatively higher among females compared to males. However, 47.0 percent of the never
married are males compared to 31.7 of females.
Table 3.3: Marital status of persons 12 years and older by sex and age-group
Sex/Age-
group Number Total
Never
married
Informal/
consensual
union/living
together Married Separated Divorced Widowed
Both Sexes Total 57,317 100.0 38.6 12.4 36.9 2.2 3.9 6.0
12-14 6,394 100.0 91.4 2.2 6.4 0.0 0.0 0.0
15 - 19 9,542 100.0 88.9 4.3 6.1 0.2 0.3 0.1
20 - 24 7,478 100.0 58.9 17.8 21.2 1.0 0.7 0.3
25 - 29 6,498 100.0 29.8 25.1 40.0 2.2 2.3 0.7
30 - 34 5,252 100.0 13.3 22.0 56.6 2.8 4.0 1.4
35 - 39 4,594 100.0 5.9 19.0 64.0 4.1 4.7 2.3
40 - 44 3,867 100.0 3.9 14.4 67.1 3.7 6.8 4.1
45 - 49 3,178 100.0 3.0 11.1 66.6 4.3 8.4 6.6
50 - 54 2,902 100.0 1.8 7.5 64.3 4.7 10.2 11.6
55 - 59 1,767 100.0 1.8 7.2 59.4 4.4 11.2 16.0
60 - 64 1,767 100.0 2.2 5.8 52.8 4.7 10.1 24.3
65+ 4,078 100.0 3.2 4.5 37.1 2.9 8.9 43.4
38.6%
12.4%
36.9%
2.2%
3.9% 6.0%
Never married
Informal/ Consensualunion/Living together
Married
Separated
Divorced
Widowed
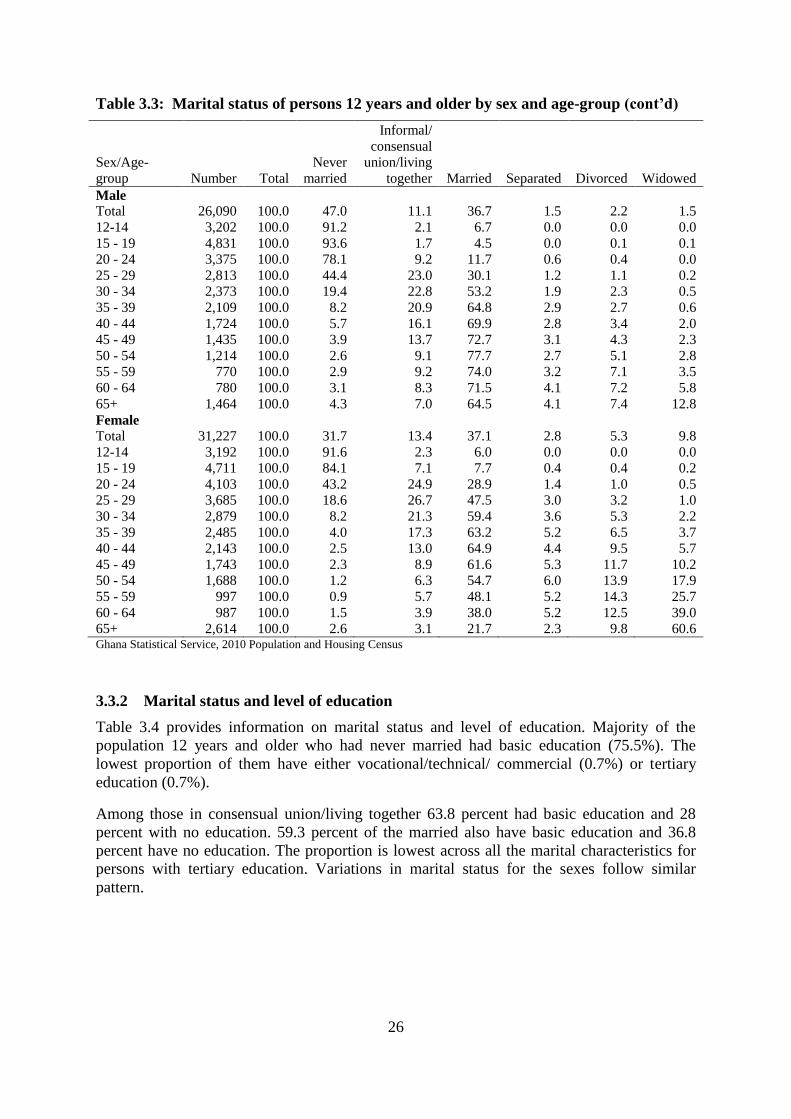
26
Table 3.3: Marital status of persons 12 years and older by sex and age-group (cont’d)
Sex/Age-
group Number Total
Never
married
Informal/
consensual
union/living
together Married Separated Divorced Widowed
Male Total 26,090 100.0 47.0 11.1 36.7 1.5 2.2 1.5
12-14 3,202 100.0 91.2 2.1 6.7 0.0 0.0 0.0
15 - 19 4,831 100.0 93.6 1.7 4.5 0.0 0.1 0.1
20 - 24 3,375 100.0 78.1 9.2 11.7 0.6 0.4 0.0
25 - 29 2,813 100.0 44.4 23.0 30.1 1.2 1.1 0.2
30 - 34 2,373 100.0 19.4 22.8 53.2 1.9 2.3 0.5
35 - 39 2,109 100.0 8.2 20.9 64.8 2.9 2.7 0.6
40 - 44 1,724 100.0 5.7 16.1 69.9 2.8 3.4 2.0
45 - 49 1,435 100.0 3.9 13.7 72.7 3.1 4.3 2.3
50 - 54 1,214 100.0 2.6 9.1 77.7 2.7 5.1 2.8
55 - 59 770 100.0 2.9 9.2 74.0 3.2 7.1 3.5
60 - 64 780 100.0 3.1 8.3 71.5 4.1 7.2 5.8
65+ 1,464 100.0 4.3 7.0 64.5 4.1 7.4 12.8
Female
Total 31,227 100.0 31.7 13.4 37.1 2.8 5.3 9.8
12-14 3,192 100.0 91.6 2.3 6.0 0.0 0.0 0.0
15 - 19 4,711 100.0 84.1 7.1 7.7 0.4 0.4 0.2
20 - 24 4,103 100.0 43.2 24.9 28.9 1.4 1.0 0.5
25 - 29 3,685 100.0 18.6 26.7 47.5 3.0 3.2 1.0
30 - 34 2,879 100.0 8.2 21.3 59.4 3.6 5.3 2.2
35 - 39 2,485 100.0 4.0 17.3 63.2 5.2 6.5 3.7
40 - 44 2,143 100.0 2.5 13.0 64.9 4.4 9.5 5.7
45 - 49 1,743 100.0 2.3 8.9 61.6 5.3 11.7 10.2
50 - 54 1,688 100.0 1.2 6.3 54.7 6.0 13.9 17.9
55 - 59 997 100.0 0.9 5.7 48.1 5.2 14.3 25.7
60 - 64 987 100.0 1.5 3.9 38.0 5.2 12.5 39.0
65+ 2,614 100.0 2.6 3.1 21.7 2.3 9.8 60.6 Ghana Statistical Service, 2010 Population and Housing Census
3.3.2 Marital status and level of education
Table 3.4 provides information on marital status and level of education. Majority of the
population 12 years and older who had never married had basic education (75.5%). The
lowest proportion of them have either vocational/technical/ commercial (0.7%) or tertiary
education (0.7%).
Among those in consensual union/living together 63.8 percent had basic education and 28
percent with no education. 59.3 percent of the married also have basic education and 36.8
percent have no education. The proportion is lowest across all the marital characteristics for
persons with tertiary education. Variations in marital status for the sexes follow similar
pattern.

27
Table 3.4: Marital status of persons 12 years and older by sex and level of education
Sex/Marital status Number
All
levels
No
Education Basic1
Secon-
dary2
Voc./
Tech/
Comm.
Post middle/
secondary
certificate/
diploma3 Tertiary
4
Both Sexes
Total 57,317 100.0 27.6 60.7 7.9 1.1 1.9 0.7
Never married 22,141 100.0 8.2 75.5 13.3 0.7 1.7 0.7
Informal/consensual
union/living together 7,082 100.0 28.0 63.8 5.5 1.1 1.4 0.2
Married 21,154 100.0 36.8 53.0 5.1 1.5 2.6 1.0
Separated 1,276 100.0 46.6 47.0 3.1 1.3 1.2 0.8
Divorced 2,220 100.0 49.3 45.3 2.6 1.3 1.3 0.3
Widowed 3,444 100.0 75.1 22.1 1.0 0.9 0.8 0.1
Male
Total 26,090 100.0 16.9 67.5 10.3 1.3 2.9 1.1
Never married 12,255 100.0 7.8 75.2 13.6 0.6 2.0 0.8
Informal/consensual
union/living together 2,908 100.0 18.1 69.9 8.2 1.3 2.2 0.3
Married 9,566 100.0 25.1 59.3 7.6 1.9 4.3 1.8
Separated 403 100.0 31.0 57.3 5.5 2.2 2.5 1.5
Divorced 563 100.0 30.0 58.6 5.3 2.3 3.2 0.5
Widowed 395 100.0 55.4 37.0 2.8 2.5 1.8 0.5
Female
Total 31,227 100.0 36.6 55.0 5.9 0.9 1.2 0.3
Never married 9,886 100.0 8.6 75.8 12.8 0.8 1.4 0.5
Informal/consensual
union/living together 4,174 100.0 34.9 59.5 3.7 1.0 0.7 0.1
Married 11,588 100.0 46.4 47.9 3.1 1.1 1.3 0.3
Separated 873 100.0 53.8 42.3 2.1 0.8 0.6 0.5
Divorced 1,657 100.0 55.9 40.8 1.6 0.9 0.6 0.2
Widowed 3,049 100.0 77.6 20.2 0.8 0.7 0.7 0.0 Ghana Statistical Service, 2010 Population and Housing Census
*Basic: Middle and JSS/JHS, *Secondary: SSS/SHS and Secondary
*Post middle/ Sec. Cert./Diploma: Teacher training/ college of education, Agricultural, nursing etc.
3.3.3 Marital status and economic activity status
Activity status of persons provides an indication of ability to marry and support a spouse
financially in some cultures in Ghana. Table 3.5 presents information on persons 12 years and
older by sex, marital status and economic activity status. It is seen from the table that 65.5
percent are employed, 2.9 percent are unemployed while 31.6 percent are not economically
active. Nearly 60 percent of the district’s population who have never married are
economically not active and the female proportion of this category (63.3%) is higher than the
corresponding male proportion (57.1%). More than eight in ten of the married persons
(86.6%), those in consensual union (89.3%), the separated (84.6%) and the widowed (84.4%)
are employed. Similar pattern is observed among the sexes. Unemployment figures for both
males and females in all marriage categories are less than 5 percent except for females in
informal/consensual union.

28
Table 3.5: Marital status of persons 12 years and older by sex and economic
activity status
Sex/Marital status
Total
Employed
Unemployed
Economically
not active
Number Percent Number Percent Number Percent Number Percent
Both Sexes
Total 57,317 100.0
37,552 65.5
1,639 2.9
18,126 31.6
Never married 22,141 100.0
8,135 36.7
757 3.4
13,249 59.8
Informal/consensual
union/living together 7,082 100.0
5,865 82.8
310 4.4
907 12.8
Married 21,154 100.0
18,319 86.6
433 2.0
2,402 11.4
Separated 1,276 100.0
1,079 84.6
44 3.4
153 12.0
Divorced 2,220 100.0
1,873 84.4
56 2.5
291 13.1
Widowed 3,444 100.0
2,281 66.2
39 1.1
1,124 32.6
Male
Total 26,090 100.0
16,875 64.7
696 2.7
8,519 32.7
Never married 12,255 100.0
4,805 39.2
457 3.7
6,993 57.1
Informal/consensual
union/living together 2,908 100.0
2,596 89.3
64 2.2
248 8.5
Married 9,566 100.0
8,407 87.9
143 1.5
1,016 10.6
Separated 403 100.0
341 84.6
12 3.0
50 12.4
Divorced 563 100.0
449 79.8
18 3.2
96 17.1
Widowed 395 100.0
277 70.1
2 0.5
116 29.4
Female
Total 31,227 100.0
20,677 66.2
943 3.0
9,607 30.8
Never married 9,886 100.0
3,330 33.7
300 3.0
6,256 63.3
Informal/consensual
union/living together 4,174 100.0
3,269 78.3
246 5.9
659 15.8
Married 11,588 100.0
9,912 85.5
290 2.5
1,386 12.0
Separated 873 100.0
738 84.5
32 3.7
103 11.8
Divorced 1,657 100.0
1,424 85.9
38 2.3
195 11.8
Widowed 3,049 100.0 2,004 65.7 37 1.2 1,008 33.1
Ghana Statistical Service, 2010 Population and Housing Census
3.4 Nationality
The nationality of the population of Awutu Senya District is shown in Table 3.6. Persons of
Ghanaian parentage, as expected, constitute the largest percentage of the population (95%)
and Ghanaians with dual citizenship form 1.7 percent. Almost three percent (2.8%) of the
population in the district are each from ECOWAS countries (2.1%), Africa and other
ECOWAS (0.4%) and other countries (0.3%) countries.
Table 3.6: Population by nationality and sex
Nationality
Both sexes Male Female
Number Percent Number Percent Number Percent
Total 86,884 100
40,903 100.0
45,981 100.0
Ghanaian by birth 82,525 95
38,808 94.9
43,717 95.1
Dual nationality (Ghanaian & Other) 1,458 1.7
654 1.6
804 1.7
Ghanaian by naturalization 463 0.5
192 0.5
271 0.6
ECOWAS 1,860 2.1
976 2.4
884 1.9
African other than ECOWAS 320 0.4
151 0.4
169 0.4
Other 258 0.3 122 0.3 136 0.3 Ghana Statistical Service, 2010 Population and Housing Census
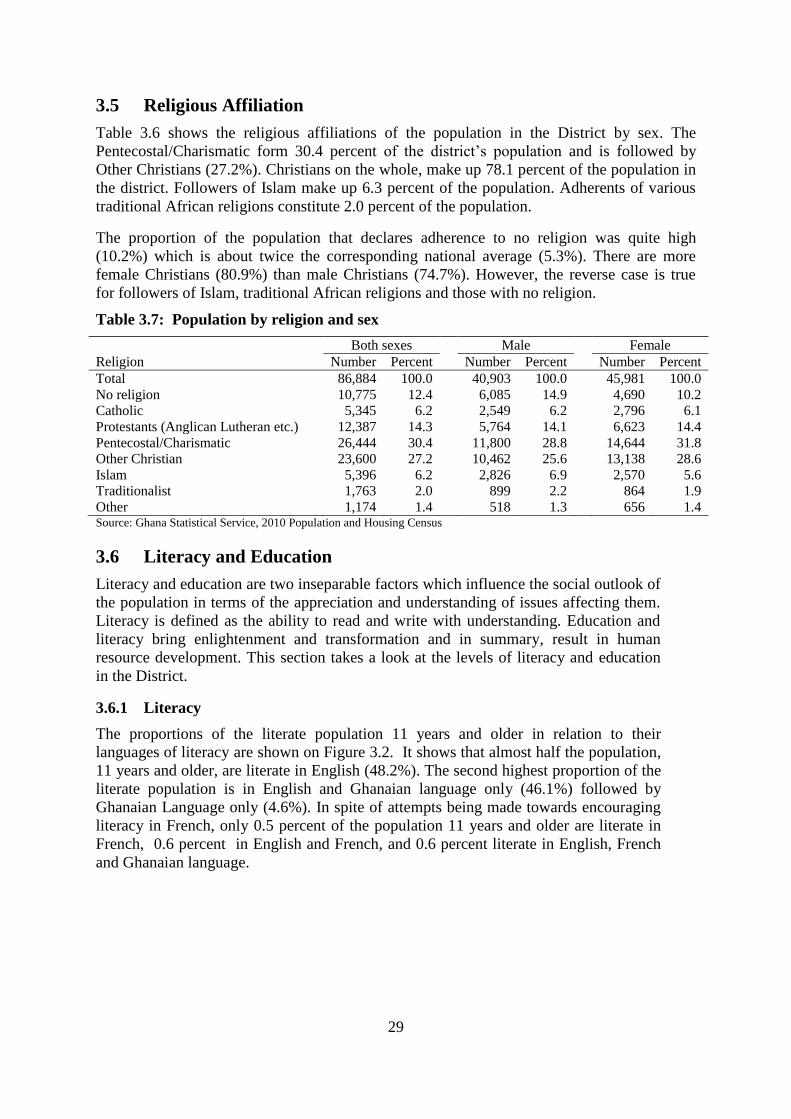
29
3.5 Religious Affiliation
Table 3.6 shows the religious affiliations of the population in the District by sex. The
Pentecostal/Charismatic form 30.4 percent of the district’s population and is followed by
Other Christians (27.2%). Christians on the whole, make up 78.1 percent of the population in
the district. Followers of Islam make up 6.3 percent of the population. Adherents of various
traditional African religions constitute 2.0 percent of the population.
The proportion of the population that declares adherence to no religion was quite high
(10.2%) which is about twice the corresponding national average (5.3%). There are more
female Christians (80.9%) than male Christians (74.7%). However, the reverse case is true
for followers of Islam, traditional African religions and those with no religion.
Table 3.7: Population by religion and sex
Religion
Both sexes
Male
Female
Number Percent Number Percent Number Percent
Total 86,884 100.0
40,903 100.0
45,981 100.0
No religion 10,775 12.4
6,085 14.9
4,690 10.2
Catholic 5,345 6.2
2,549 6.2
2,796 6.1
Protestants (Anglican Lutheran etc.) 12,387 14.3
5,764 14.1
6,623 14.4
Pentecostal/Charismatic 26,444 30.4
11,800 28.8
14,644 31.8
Other Christian 23,600 27.2
10,462 25.6
13,138 28.6
Islam 5,396 6.2
2,826 6.9
2,570 5.6
Traditionalist 1,763 2.0
899 2.2
864 1.9
Other 1,174 1.4 518 1.3 656 1.4 Source: Ghana Statistical Service, 2010 Population and Housing Census
3.6 Literacy and Education
Literacy and education are two inseparable factors which influence the social outlook of
the population in terms of the appreciation and understanding of issues affecting them.
Literacy is defined as the ability to read and write with understanding. Education and
literacy bring enlightenment and transformation and in summary, result in human
resource development. This section takes a look at the levels of literacy and education
in the District.
3.6.1 Literacy
The proportions of the literate population 11 years and older in relation to their
languages of literacy are shown on Figure 3.2. It shows that almost half the population,
11 years and older, are literate in English (48.2%). The second highest proportion of the
literate population is in English and Ghanaian language only (46.1%) followed by
Ghanaian Language only (4.6%). In spite of attempts being made towards encouraging
literacy in French, only 0.5 percent of the population 11 years and older are literate in
French, 0.6 percent in English and French, and 0.6 percent literate in English, French
and Ghanaian language.

30
Figure 3.2: Language of literacy
Source: Ghana Statistical Service, 2010 Population and Housing Census
3.6.2 Education
Table 3.9 shows population three years and older by level of current school attendance and
educational attendance. A total of 31,951 children are attending school. Of this total, 15,515
representing the highest proportion (48.6 percent) are in primary school. The proportion in
Kindergarten and Junior High School are 1.9 percent and 17.5 percent respectively. Only 1.0
percent of the population are in tertiary schools. With the exception of SSS/SHS, there is not
much variation between males and females at the various schooling levels.
A total of 27,787 have attended school in the past. Of this total, 10,127 representing 36.4
percent have attended JHS constituting the highest proportion of this group. There exist
variations among males and females who have attended school in the past at the various
levels. Apart from the primary and JSS/JHS lower levels where females are more than males,
males are more than females at all levels of higher school attainment from the middle to the
tertiary level. For example 2.1 percent of males and 1.9 percent of females attained
vocational/technical/commercial education while as many as 4.2 percent of males and 1.3
percent of females had attained tertiary education.
48.2
4.6
46.1
0.5 0.6 0
English only
Ghanaian language only
English and a Ghanaianlanguage
English and French
English, French and aGhanaian language
Others
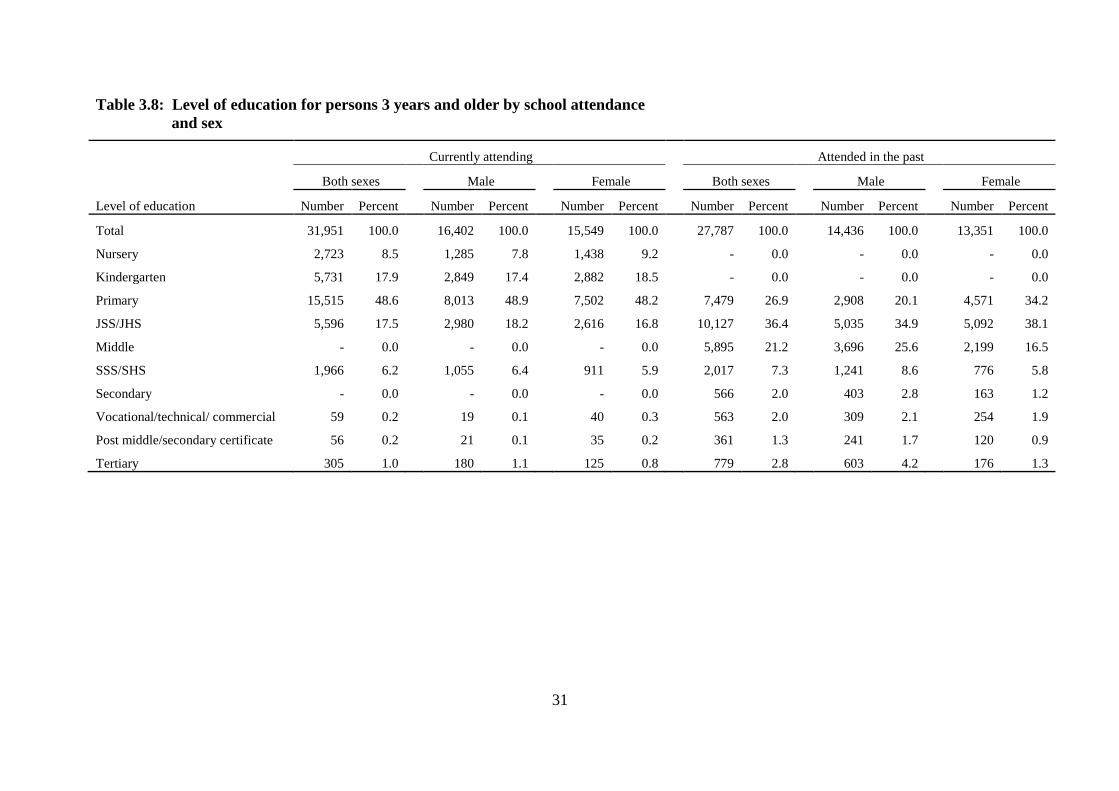
31
Table 3.8: Level of education for persons 3 years and older by school attendance
and sex
Level of education
Currently attending Attended in the past
Both sexes
Male
Female
Both sexes
Male
Female
Number Percent Number Percent Number Percent Number Percent Number Percent Number Percent
Total 31,951 100.0
16,402 100.0
15,549 100.0
27,787 100.0
14,436 100.0
13,351 100.0
Nursery 2,723 8.5
1,285 7.8
1,438 9.2
- 0.0
- 0.0
- 0.0
Kindergarten 5,731 17.9
2,849 17.4
2,882 18.5
- 0.0
- 0.0
- 0.0
Primary 15,515 48.6
8,013 48.9
7,502 48.2
7,479 26.9
2,908 20.1
4,571 34.2
JSS/JHS 5,596 17.5
2,980 18.2
2,616 16.8
10,127 36.4
5,035 34.9
5,092 38.1
Middle - 0.0
- 0.0
- 0.0
5,895 21.2
3,696 25.6
2,199 16.5
SSS/SHS 1,966 6.2
1,055 6.4
911 5.9
2,017 7.3
1,241 8.6
776 5.8
Secondary - 0.0
- 0.0
- 0.0
566 2.0
403 2.8
163 1.2
Vocational/technical/ commercial 59 0.2
19 0.1
40 0.3
563 2.0
309 2.1
254 1.9
Post middle/secondary certificate 56 0.2
21 0.1
35 0.2
361 1.3
241 1.7
120 0.9
Tertiary 305 1.0 180 1.1 125 0.8 779 2.8 603 4.2 176 1.3

32
CHAPTER FOUR
ECONOMIC CHARACTERISTICS
4.1 Introduction
This chapter discusses the economic activities of persons 15 years and older in the Awutu
Senya district. The nature, type and size of the labour force are critical factors in the
production of goods and services. For economic growth, labour force participation is a key
driver. The information on labour force is also used to formulate employment policies, to
determine training needs and to calculate the expected working life of the male and female
population as well as the rate of accession to retirement from economic activity. Emphasis is
given to the type of activity namely economically active which includes the employed and the
unemployed, economically not active, main occupation, industry and employment status of
individuals in the district.
4.2 Economic activity status
Table 4.1 presents the summary information on the economic activity status of persons 15
years and older in the district. The table shows that three quarters (75.1%) of the population
are economically active with one quarter (24.9%) not economically active. In addition, 95.7
percent of the economically active people are employed while 4.3 percent are unemployed.
For the employed category, 95.0 percent are employed and working, 4.7 percent are not
working but have jobs to go back to and 0.3% work on a voluntary basis without pay. Of the
4.3 percent unemployed, 41.3 percent haven worked before, are available and seeking for
work while 58.7 percent are seeking work for the first time. There exist not much variations
between the proportions of males and females who are either economically active, employed
or unemployed.
Table 4.1: Activity status of persons 15 years and older by sex
Activity status
Total
Male
Female
Number Percent Number Percent Number Percent
Total 50,923 100.0
22,888 100.0
28,035 100.0
Economically active 38,229 75.1
17,110 74.8
21,119 75.3
Employed 36,601 95.7
16,419 96.0
20,182 95.6
Worked 34,776 95.0
15,733 95.8
19,043 94.4
Did not work but had job to go back to 1,726 4.7
643 3.9
1,083 5.4
Did voluntary work without pay 99 0.3
43 0.3
56 0.3
Unemployed 1,628 4.3
691 4.0
937 4.4
Worked before, seeking work and
available 673 41.3
240 34.7
433 46.2
Seeking work for the first time and
available 955 58.7
451 65.3
504 53.8
Economically not active 12,694 24.9
5,778 25.2
6,916 24.7
Did home duties (household chore) 2,385 18.8
694 12.0
1,691 24.5
Full time education 6,636 52.3
3,582 62.0
3,054 44.2
Pensioner/retired 237 1.9
172 3.0
65 0.9
Disabled/sick 744 5.9
300 5.2
444 6.4
Too old/young 1,597 12.6
411 7.1
1,186 17.1
Other 1,095 8.6 619 10.7 476 6.9 Source: Ghana Statistical Service, 2010 Population and Housing Census
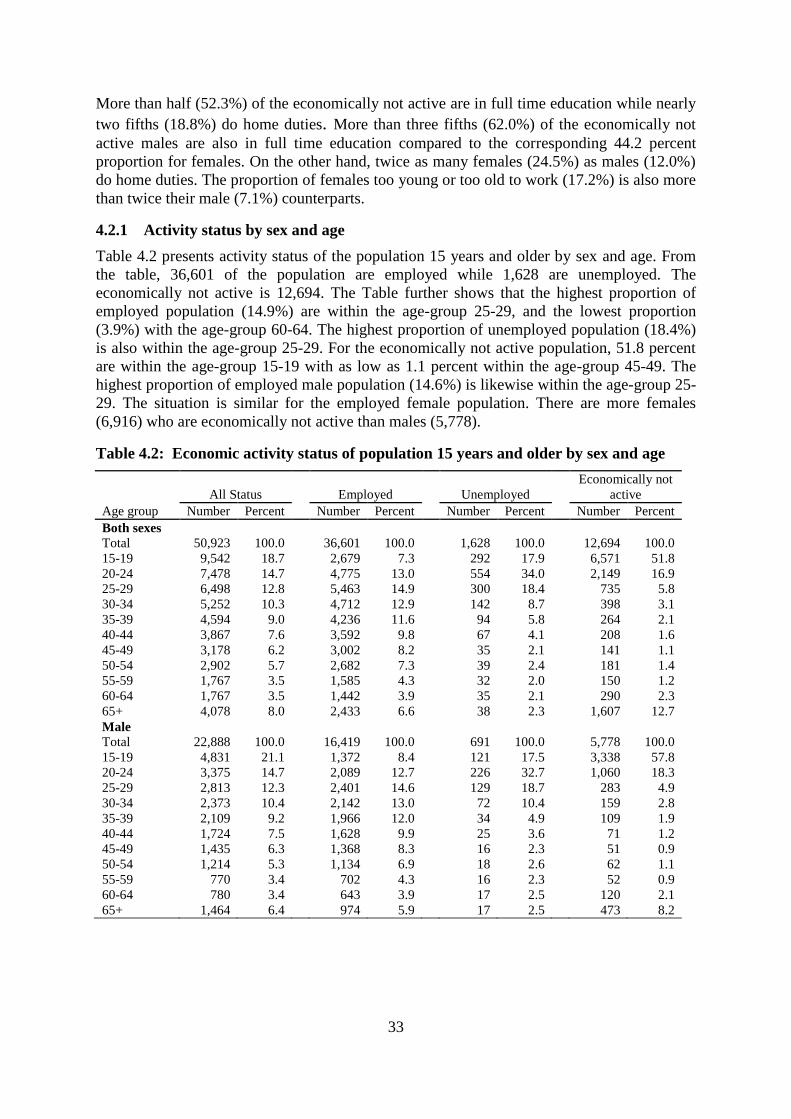
33
More than half (52.3%) of the economically not active are in full time education while nearly
two fifths (18.8%) do home duties. More than three fifths (62.0%) of the economically not
active males are also in full time education compared to the corresponding 44.2 percent
proportion for females. On the other hand, twice as many females (24.5%) as males (12.0%)
do home duties. The proportion of females too young or too old to work (17.2%) is also more
than twice their male (7.1%) counterparts.
4.2.1 Activity status by sex and age
Table 4.2 presents activity status of the population 15 years and older by sex and age. From
the table, 36,601 of the population are employed while 1,628 are unemployed. The
economically not active is 12,694. The Table further shows that the highest proportion of
employed population (14.9%) are within the age-group 25-29, and the lowest proportion
(3.9%) with the age-group 60-64. The highest proportion of unemployed population (18.4%)
is also within the age-group 25-29. For the economically not active population, 51.8 percent
are within the age-group 15-19 with as low as 1.1 percent within the age-group 45-49. The
highest proportion of employed male population (14.6%) is likewise within the age-group 25-
29. The situation is similar for the employed female population. There are more females
(6,916) who are economically not active than males (5,778).
Table 4.2: Economic activity status of population 15 years and older by sex and age
Age group
All Status Employed Unemployed
Economically not
active
Number Percent Number Percent Number Percent Number Percent
Both sexes
Total 50,923 100.0
36,601 100.0
1,628 100.0
12,694 100.0
15-19 9,542 18.7
2,679 7.3
292 17.9
6,571 51.8
20-24 7,478 14.7
4,775 13.0
554 34.0
2,149 16.9
25-29 6,498 12.8
5,463 14.9
300 18.4
735 5.8
30-34 5,252 10.3
4,712 12.9
142 8.7
398 3.1
35-39 4,594 9.0
4,236 11.6
94 5.8
264 2.1
40-44 3,867 7.6
3,592 9.8
67 4.1
208 1.6
45-49 3,178 6.2
3,002 8.2
35 2.1
141 1.1
50-54 2,902 5.7
2,682 7.3
39 2.4
181 1.4
55-59 1,767 3.5
1,585 4.3
32 2.0
150 1.2
60-64 1,767 3.5
1,442 3.9
35 2.1
290 2.3
65+ 4,078 8.0
2,433 6.6
38 2.3
1,607 12.7
Male
Total 22,888 100.0
16,419 100.0
691 100.0
5,778 100.0
15-19 4,831 21.1
1,372 8.4
121 17.5
3,338 57.8
20-24 3,375 14.7
2,089 12.7
226 32.7
1,060 18.3
25-29 2,813 12.3
2,401 14.6
129 18.7
283 4.9
30-34 2,373 10.4
2,142 13.0
72 10.4
159 2.8
35-39 2,109 9.2
1,966 12.0
34 4.9
109 1.9
40-44 1,724 7.5
1,628 9.9
25 3.6
71 1.2
45-49 1,435 6.3
1,368 8.3
16 2.3
51 0.9
50-54 1,214 5.3
1,134 6.9
18 2.6
62 1.1
55-59 770 3.4
702 4.3
16 2.3
52 0.9
60-64 780 3.4
643 3.9
17 2.5
120 2.1
65+ 1,464 6.4
974 5.9
17 2.5
473 8.2
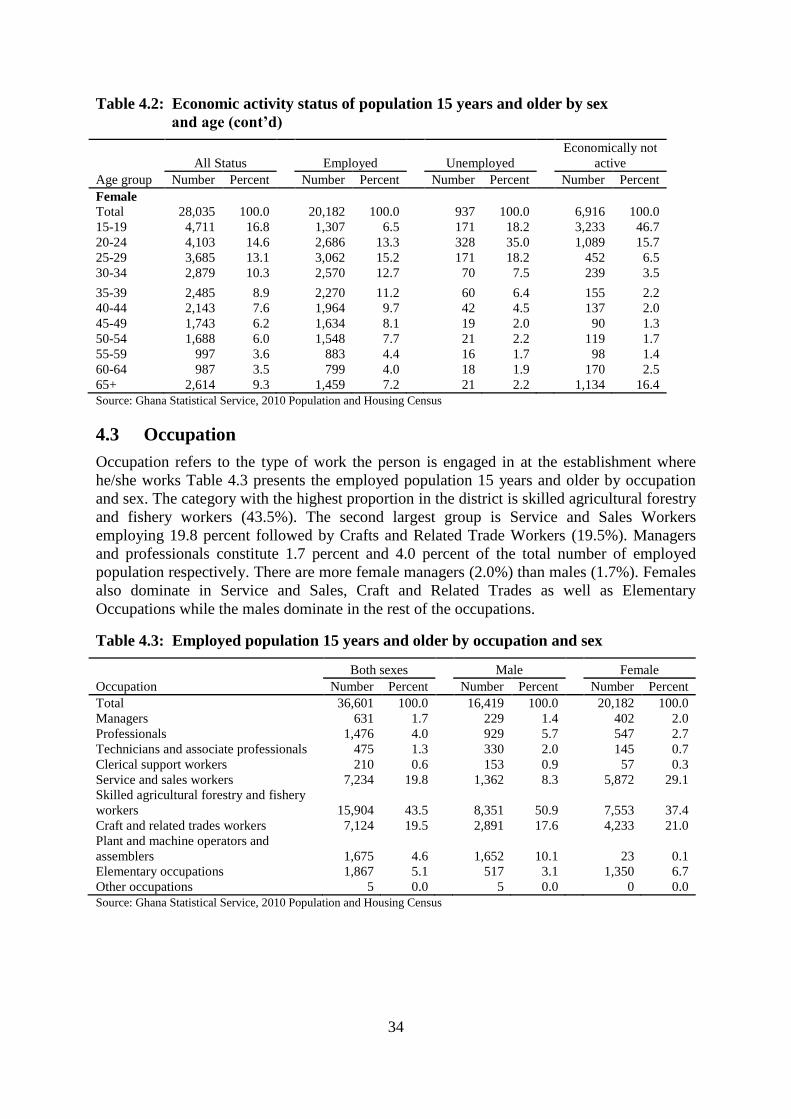
34
Table 4.2: Economic activity status of population 15 years and older by sex
and age (cont’d)
Age group
All Status Employed Unemployed
Economically not
active
Number Percent Number Percent Number Percent Number Percent
Female
Total 28,035 100.0
20,182 100.0
937 100.0
6,916 100.0
15-19 4,711 16.8
1,307 6.5
171 18.2
3,233 46.7
20-24 4,103 14.6
2,686 13.3
328 35.0
1,089 15.7
25-29 3,685 13.1
3,062 15.2
171 18.2
452 6.5
30-34 2,879 10.3
2,570 12.7
70 7.5
239 3.5
35-39 2,485 8.9
2,270 11.2
60 6.4
155 2.2
40-44 2,143 7.6
1,964 9.7
42 4.5
137 2.0
45-49 1,743 6.2
1,634 8.1
19 2.0
90 1.3
50-54 1,688 6.0
1,548 7.7
21 2.2
119 1.7
55-59 997 3.6
883 4.4
16 1.7
98 1.4
60-64 987 3.5
799 4.0
18 1.9
170 2.5
65+ 2,614 9.3 1,459 7.2 21 2.2 1,134 16.4
Source: Ghana Statistical Service, 2010 Population and Housing Census
4.3 Occupation
Occupation refers to the type of work the person is engaged in at the establishment where
he/she works Table 4.3 presents the employed population 15 years and older by occupation
and sex. The category with the highest proportion in the district is skilled agricultural forestry
and fishery workers (43.5%). The second largest group is Service and Sales Workers
employing 19.8 percent followed by Crafts and Related Trade Workers (19.5%). Managers
and professionals constitute 1.7 percent and 4.0 percent of the total number of employed
population respectively. There are more female managers (2.0%) than males (1.7%). Females
also dominate in Service and Sales, Craft and Related Trades as well as Elementary
Occupations while the males dominate in the rest of the occupations.
Table 4.3: Employed population 15 years and older by occupation and sex
Occupation
Both sexes Male Female
Number Percent Number Percent Number Percent
Total 36,601 100.0
16,419 100.0
20,182 100.0
Managers 631 1.7
229 1.4
402 2.0
Professionals 1,476 4.0
929 5.7
547 2.7
Technicians and associate professionals 475 1.3
330 2.0
145 0.7
Clerical support workers 210 0.6
153 0.9
57 0.3
Service and sales workers 7,234 19.8
1,362 8.3
5,872 29.1
Skilled agricultural forestry and fishery
workers 15,904 43.5
8,351 50.9
7,553 37.4
Craft and related trades workers 7,124 19.5
2,891 17.6
4,233 21.0
Plant and machine operators and
assemblers 1,675 4.6
1,652 10.1
23 0.1
Elementary occupations 1,867 5.1
517 3.1
1,350 6.7
Other occupations 5 0.0 5 0.0 0 0.0
Source: Ghana Statistical Service, 2010 Population and Housing Census
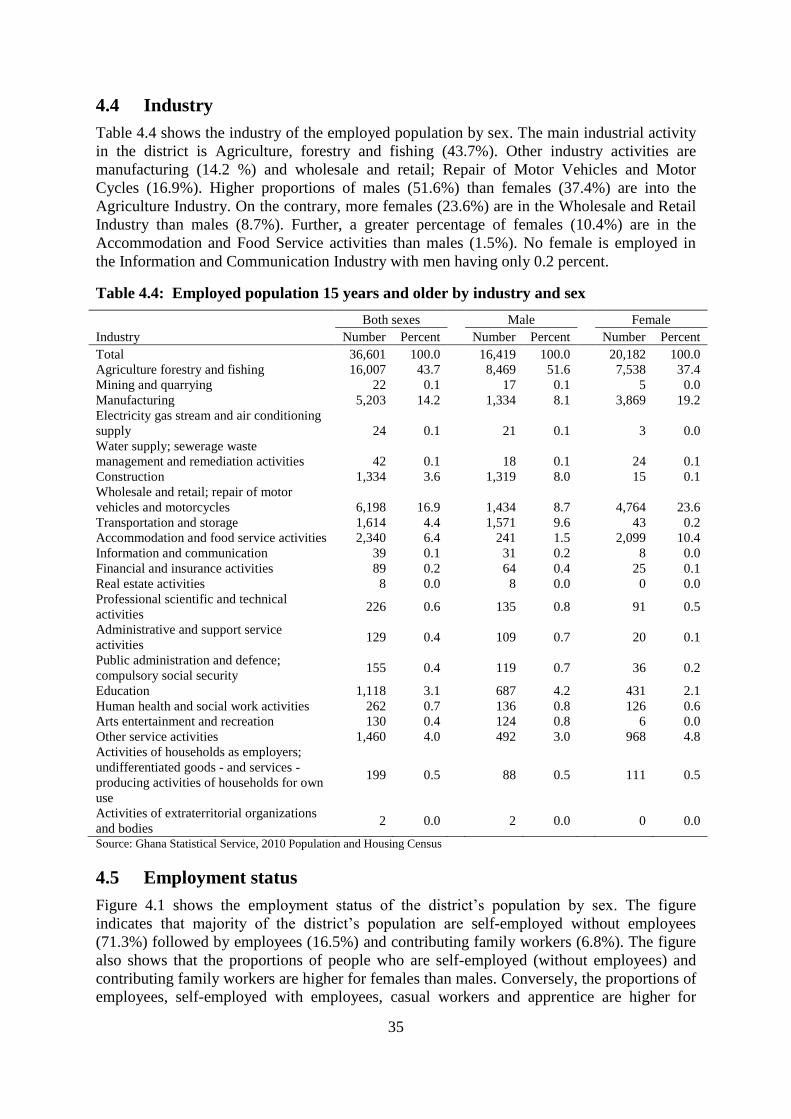
35
4.4 Industry
Table 4.4 shows the industry of the employed population by sex. The main industrial activity
in the district is Agriculture, forestry and fishing (43.7%). Other industry activities are
manufacturing (14.2 %) and wholesale and retail; Repair of Motor Vehicles and Motor
Cycles (16.9%). Higher proportions of males (51.6%) than females (37.4%) are into the
Agriculture Industry. On the contrary, more females (23.6%) are in the Wholesale and Retail
Industry than males (8.7%). Further, a greater percentage of females (10.4%) are in the
Accommodation and Food Service activities than males (1.5%). No female is employed in
the Information and Communication Industry with men having only 0.2 percent.
Table 4.4: Employed population 15 years and older by industry and sex
Industry
Both sexes
Male
Female
Number Percent Number Percent Number Percent
Total 36,601 100.0
16,419 100.0
20,182 100.0
Agriculture forestry and fishing 16,007 43.7
8,469 51.6
7,538 37.4
Mining and quarrying 22 0.1
17 0.1
5 0.0
Manufacturing 5,203 14.2
1,334 8.1
3,869 19.2
Electricity gas stream and air conditioning
supply 24 0.1
21 0.1
3 0.0
Water supply; sewerage waste
management and remediation activities 42 0.1
18 0.1
24 0.1
Construction 1,334 3.6
1,319 8.0
15 0.1
Wholesale and retail; repair of motor
vehicles and motorcycles 6,198 16.9
1,434 8.7
4,764 23.6
Transportation and storage 1,614 4.4
1,571 9.6
43 0.2
Accommodation and food service activities 2,340 6.4
241 1.5
2,099 10.4
Information and communication 39 0.1
31 0.2
8 0.0
Financial and insurance activities 89 0.2
64 0.4
25 0.1
Real estate activities 8 0.0
8 0.0
0 0.0
Professional scientific and technical
activities 226 0.6
135 0.8
91 0.5
Administrative and support service
activities 129 0.4
109 0.7
20 0.1
Public administration and defence;
compulsory social security 155 0.4
119 0.7
36 0.2
Education 1,118 3.1
687 4.2
431 2.1
Human health and social work activities 262 0.7
136 0.8
126 0.6
Arts entertainment and recreation 130 0.4
124 0.8
6 0.0
Other service activities 1,460 4.0
492 3.0
968 4.8
Activities of households as employers;
undifferentiated goods - and services -
producing activities of households for own
use
199 0.5
88 0.5
111 0.5
Activities of extraterritorial organizations
and bodies 2 0.0 2 0.0 0 0.0
Source: Ghana Statistical Service, 2010 Population and Housing Census
4.5 Employment status
Figure 4.1 shows the employment status of the district’s population by sex. The figure
indicates that majority of the district’s population are self-employed without employees
(71.3%) followed by employees (16.5%) and contributing family workers (6.8%). The figure
also shows that the proportions of people who are self-employed (without employees) and
contributing family workers are higher for females than males. Conversely, the proportions of
employees, self-employed with employees, casual workers and apprentice are higher for
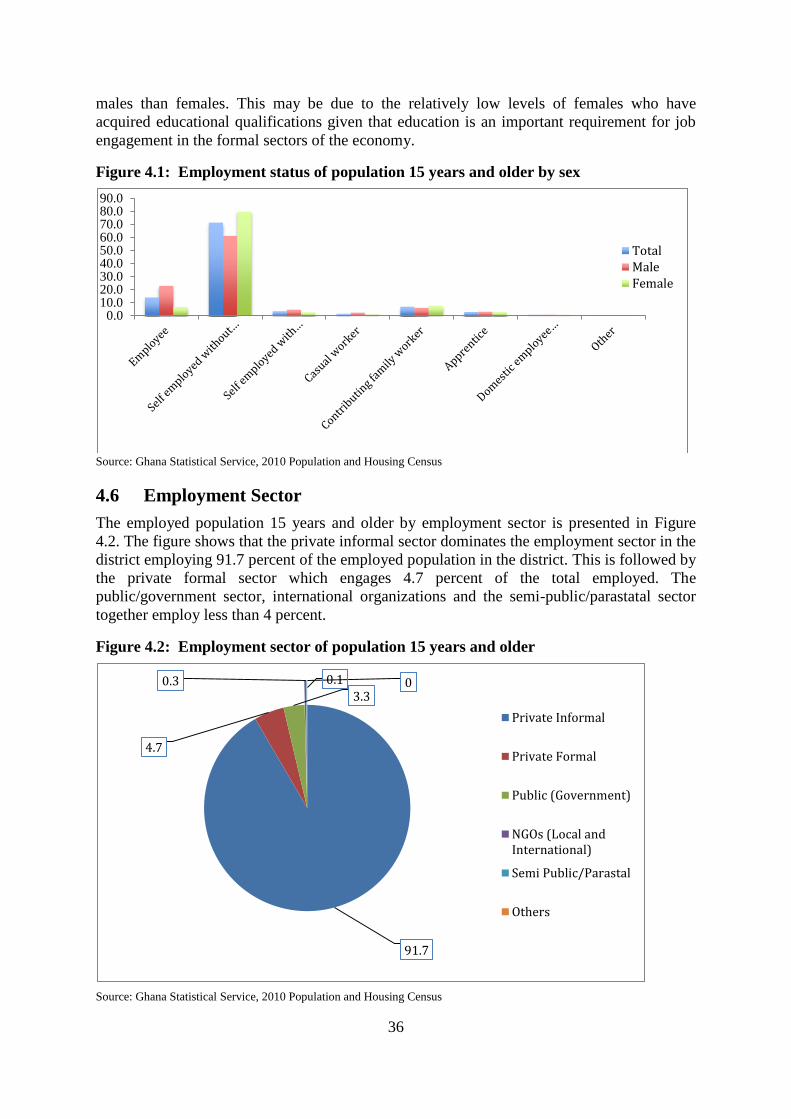
36
males than females. This may be due to the relatively low levels of females who have
acquired educational qualifications given that education is an important requirement for job
engagement in the formal sectors of the economy.
Figure 4.1: Employment status of population 15 years and older by sex
Source: Ghana Statistical Service, 2010 Population and Housing Census
4.6 Employment Sector
The employed population 15 years and older by employment sector is presented in Figure
4.2. The figure shows that the private informal sector dominates the employment sector in the
district employing 91.7 percent of the employed population in the district. This is followed by
the private formal sector which engages 4.7 percent of the total employed. The
public/government sector, international organizations and the semi-public/parastatal sector
together employ less than 4 percent.
Figure 4.2: Employment sector of population 15 years and older
Source: Ghana Statistical Service, 2010 Population and Housing Census
0.010.020.030.040.050.060.070.080.090.0
TotalMaleFemale
91.7
4.7
3.3 0.3 0.1 0
Private Informal
Private Formal
Public (Government)
NGOs (Local andInternational)
Semi Public/Parastal
Others

37
CHAPTER FIVE
INFORMATION COMMUNICATION TECHNOLOGY
5.1 Introduction
In Ghana, Information Communication Technologies (ICT) developments have taken place
with significant growth over the past decade. ICTs bring about social and economic
development and transformation by creating an enabling environment for accelerating
economic growth. ICT can be applied in all sectors: Economics, Education, Communication,
Health and Manufacturing.
For the first time, the 2010 PHC had a module on ICT and questions were asked for
individuals and households 12 years and older. Development in ICT has helped Ghanaians
and particularly the people in the Awutu Senya District in information sharing and
increasing people’s knowledge on what goes on around them and beyond. Internet and
mobile phones are increasingly bringing market information, financial services, and health
services to remote areas, and is helping to change people's lives in unprecedented ways. This
chapter looks at ownership of mobile phones, use of Internet, household ownership of fixed
telephone lines and household ownership of desktop or laptop computers.
5.2 Ownership of mobile phones
Table 5.1 shows the distribution of mobile phone ownership and usage of Internet facility for
persons 12 years and older in the District by sex. The proportion of persons 12 years and
older in the Awutu Senya District who own mobile phones is 39.5 percent. Mobile phone
ownership is higher among males (48.5%) than in females (32.0%).
Table 5.1: Population 12 years and older by mobile phone ownership,
internet facility usage and sex
Sex
Population 12
years and older
Population
having mobile
phone
Population using
internet facility
Number Percent Number Percent Number Percent
Total 57,317 100.0
22,659 39.5
1,684 2.90
Male 26,090 45.5
12,663 48.5
1,162 4.50
Female 31,227 54.5 9,996 32.0 522 1.70
Source: Ghana Statistical Service, 2010 Population and Housing Census
5.3 Use of Internet
Internet accessibility and its use are essential in this current global economy. Table 5.1 shows
the usage of Internet facility. For the entire District, only 2.9 percent of persons 12 years and
older use the Internet. The relatively low usage of Internet at the household level is more
likely due to inadequate levels of Internet facilities in the area. About 4.5 percent of the total
male population in the district use the Internet compared to the corresponding value of 1.6
percent for females.
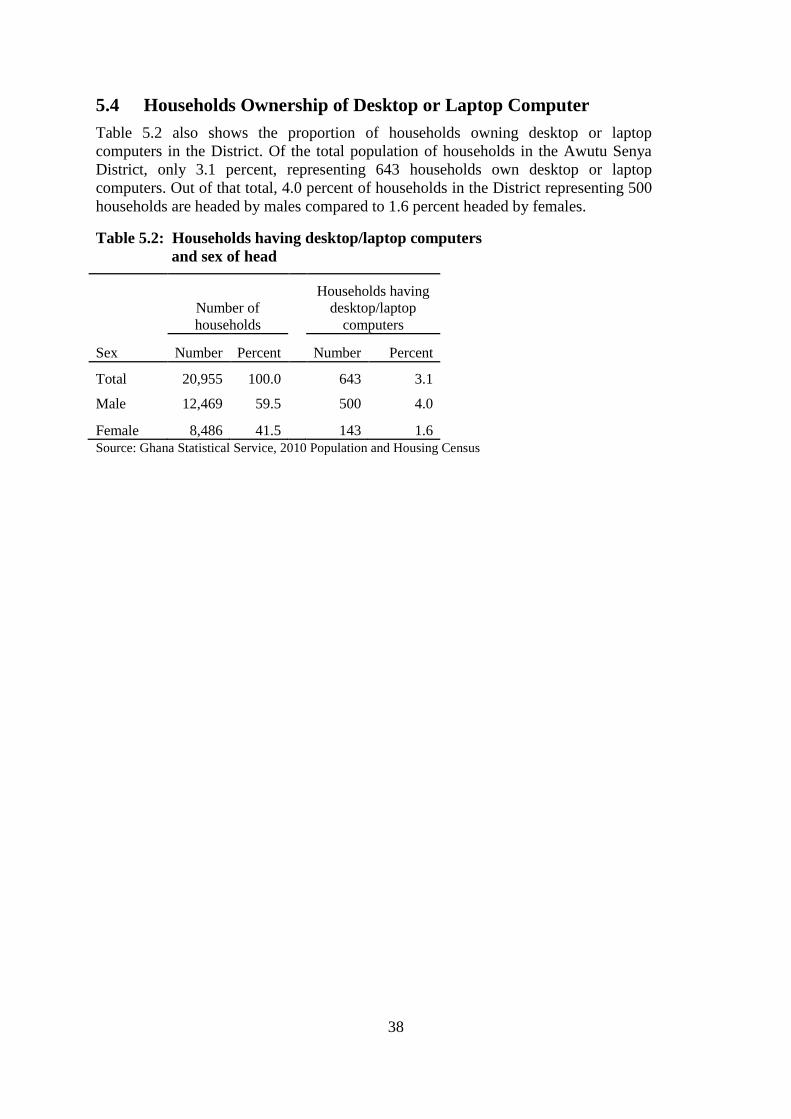
38
5.4 Households Ownership of Desktop or Laptop Computer
Table 5.2 also shows the proportion of households owning desktop or laptop
computers in the District. Of the total population of households in the Awutu Senya
District, only 3.1 percent, representing 643 households own desktop or laptop
computers. Out of that total, 4.0 percent of households in the District representing 500
households are headed by males compared to 1.6 percent headed by females.
Table 5.2: Households having desktop/laptop computers
and sex of head
Sex
Number of
households
Households having
desktop/laptop
computers
Number Percent Number Percent
Total 20,955 100.0
643 3.1
Male 12,469 59.5
500 4.0
Female 8,486 41.5 143 1.6
Source: Ghana Statistical Service, 2010 Population and Housing Census

39
CHAPTER SIX
DISABILITY
6.1 Introduction
There has been an international consensus on the recognition of the rights of persons with
disabilities over the past few decades, with emphasis on the promotion of their dignity for
inclusive development. Evidence is needed for more informed decisions on sustainable
policies and programmes for the disabled. Knowing the characteristics and understanding the
numbers of people with disabilities (PWDs) and their circumstances can enhance policies that
address barriers that prevent PWDs from participating more effectively in national
development. The 2010 PHC for the first time included a module on disability. Questions
were asked to all household members whether or not they had any form of disabilities. This
chapter presents data on the prevalence of disabilities and the socio-demographic
characteristics of the PWDs in the district. The chapter focuses on population with disability,
type of disability, distribution by type of locality, disability and economic activity status,
education and literacy.
6.2 Population with Disability (PWD)
Table 6.1 shows population by type of locality, disability status and type by sex in Awutu
Senya District. The District has a total of 2,720 persons with disability made up of 1,248
males and 1,472 females. The most common type of disability is sight impairment with
recorded 34.0 percent of the total number of disability cases in the district. This proportion is
lower than the regional average of 43 percent. The second highest disability is physical
impairment constituting 29.9 percent and the least is other form of disabilities (6.9%).
Table 6.1: Population by type of locality, disability type and sex
Disability Type
Both sexes Male Female
Number Percent Number Percent Number Percent
All Localities
Total 86,884 100.0
40,903 100.0
45,981 100.0
No disability 84,164 96.9
39,655 96.9
44,509 96.8
With a disability 2,720 3.1
1,248 3.1
1,472 3.2
Sight 925 34.0
411 32.9
514 34.9
Hearing 374 13.8
158 12.7
216 14.7
Speech 380 14.0
196 15.7
184 12.5
Physical 812 29.9
374 30.0
438 29.8
Intellectual 593 21.8
253 0.6
340 0.7
Emotional 315 11.6
159 12.7
156 10.6
Other 188 6.9
90 7.2
98 6.7
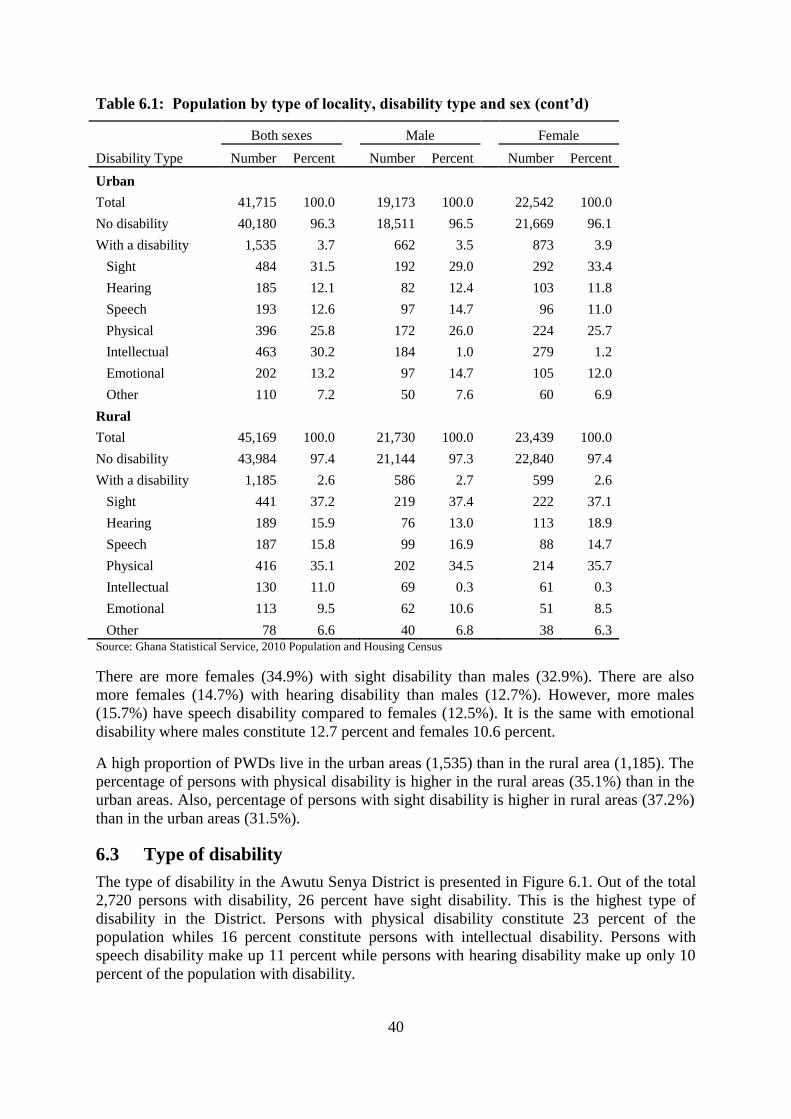
40
Table 6.1: Population by type of locality, disability type and sex (cont’d)
Disability Type
Both sexes Male Female
Number Percent Number Percent Number Percent
Urban
Total 41,715 100.0
19,173 100.0
22,542 100.0
No disability 40,180 96.3
18,511 96.5
21,669 96.1
With a disability 1,535 3.7
662 3.5
873 3.9
Sight 484 31.5
192 29.0
292 33.4
Hearing 185 12.1
82 12.4
103 11.8
Speech 193 12.6
97 14.7
96 11.0
Physical 396 25.8
172 26.0
224 25.7
Intellectual 463 30.2
184 1.0
279 1.2
Emotional 202 13.2
97 14.7
105 12.0
Other 110 7.2
50 7.6
60 6.9
Rural
Total 45,169 100.0
21,730 100.0
23,439 100.0
No disability 43,984 97.4
21,144 97.3
22,840 97.4
With a disability 1,185 2.6
586 2.7
599 2.6
Sight 441 37.2
219 37.4
222 37.1
Hearing 189 15.9
76 13.0
113 18.9
Speech 187 15.8
99 16.9
88 14.7
Physical 416 35.1
202 34.5
214 35.7
Intellectual 130 11.0
69 0.3
61 0.3
Emotional 113 9.5
62 10.6
51 8.5
Other 78 6.6 40 6.8 38 6.3 Source: Ghana Statistical Service, 2010 Population and Housing Census
There are more females (34.9%) with sight disability than males (32.9%). There are also
more females (14.7%) with hearing disability than males (12.7%). However, more males
(15.7%) have speech disability compared to females (12.5%). It is the same with emotional
disability where males constitute 12.7 percent and females 10.6 percent.
A high proportion of PWDs live in the urban areas (1,535) than in the rural area (1,185). The
percentage of persons with physical disability is higher in the rural areas (35.1%) than in the
urban areas. Also, percentage of persons with sight disability is higher in rural areas (37.2%)
than in the urban areas (31.5%).
6.3 Type of disability
The type of disability in the Awutu Senya District is presented in Figure 6.1. Out of the total
2,720 persons with disability, 26 percent have sight disability. This is the highest type of
disability in the District. Persons with physical disability constitute 23 percent of the
population whiles 16 percent constitute persons with intellectual disability. Persons with
speech disability make up 11 percent while persons with hearing disability make up only 10
percent of the population with disability.
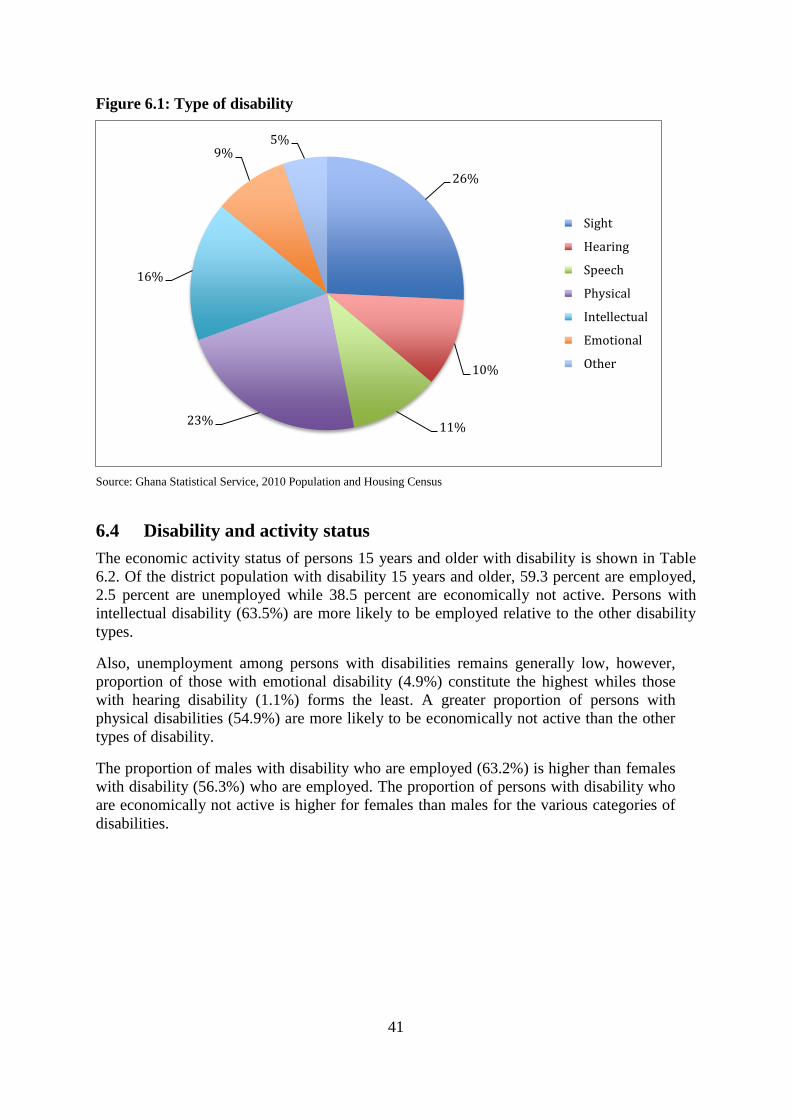
41
Figure 6.1: Type of disability
Source: Ghana Statistical Service, 2010 Population and Housing Census
6.4 Disability and activity status
The economic activity status of persons 15 years and older with disability is shown in Table
6.2. Of the district population with disability 15 years and older, 59.3 percent are employed,
2.5 percent are unemployed while 38.5 percent are economically not active. Persons with
intellectual disability (63.5%) are more likely to be employed relative to the other disability
types.
Also, unemployment among persons with disabilities remains generally low, however,
proportion of those with emotional disability (4.9%) constitute the highest whiles those
with hearing disability (1.1%) forms the least. A greater proportion of persons with
physical disabilities (54.9%) are more likely to be economically not active than the other
types of disability.
The proportion of males with disability who are employed (63.2%) is higher than females
with disability (56.3%) who are employed. The proportion of persons with disability who
are economically not active is higher for females than males for the various categories of
disabilities.
26%
10%
11% 23%
16%
9% 5%
Sight
Hearing
Speech
Physical
Intellectual
Emotional
Other

42
Table 6.2: Persons 15 years and older with disability by economic activity status
and sex
Sex/Disability type
All status
Employed
Unemployed
Economically not
active
Number Percent Number Percent Number Percent Number Percent
Both Sexes
Total 51,404 100.0 36,953 71.9 1,633 3.2 12,818 24.9
No disability 49,166 100.0 35,625 72.5 1,577 3.2 11,964 24.3
With a disability 2,238 100.0 1,328 59.3 56 2.5 854 38.2
Sight 839 100.0 493 58.8 23 2.7 323 38.5
Hearing 262 100.0 158 60.3 3 1.1 101 38.5
Speech 246 100.0 145 58.9 4 1.6 97 39.4
Physical 699 100.0 304 43.5 11 1.6 384 54.9
Intellectual 427 100.0 271 63.5 8 1.9 148 34.7
Emotional 244 100.0 133 54.5 12 4.9 99 40.6
Other 140 100.0 73 52.1 3 2.1 64 45.7
Male
Total 23,142 100.0 16,606 71.8 694 3.0 5,842 25.2
No disability 22,153 100.0 15,981 72.1 672 3.0 5,500 24.8
With a disability 989 100.0 625 63.2 22 2.2 342 34.6
Sight 368 100.0 245 66.6 9 2.4 114 31.0
Hearing 101 100.0 69 68.3 1 1.0 31 30.7
Speech 123 100.0 84 68.3 2 1.6 37 30.1
Physical 304 100.0 144 47.4 7 2.3 153 50.3
Intellectual 161 100.0 102 63.4 2 1.2 57 35.4
Emotional 118 100.0 68 57.6 4 3.4 46 39.0
Other 63 100.0 37 58.7 1 1.6 25 39.7
Female
Total 28,262 100.0 20,347 72.0 939 3.3 6,976 24.7
No disability 27,013 100.0 19,644 72.7 905 3.4 6,464 23.9
With a disability 1,249 100.0 703 56.3 34 2.7 512 41.0
Sight 471 100.0 248 52.7 14 3.0 209 44.4
Hearing 161 100.0 89 55.3 2 1.2 70 43.5
Speech 123 100.0 61 49.6 2 1.6 60 48.8
Physical 395 100.0 160 40.5 4 1.0 231 58.5
Intellectual 266 100.0 169 63.5 6 2.3 91 34.2
Emotional 126 100.0 65 51.6 8 6.3 53 42.1
Other 77 100.0 36 46.8 2 2.6 39 50.6 Source: Ghana Statistical Service, 2010 Population and Housing Census
6.5 Disability and Education
The distribution of persons three years and older with disability by educational level is shown
in Table 6.3. The percentage of persons with disabilities (PWDs) who have never attended
school is 47.2 with those with intellectual disability (62.7%) constituting the highest
proportion. Among the PWDs who have basic education (43%), those with hearing
disabilities (47.2%) form the highest proportion with basic education.
The proportion of females PWD with no education (59.5%) is higher than their male
counterparts (32.4%). Similar pattern is observed for the various categories of disability for
both sexes

43
Table 6.3: Population 3 years and older by sex, disability type and level of education
Sex/Disability
type
Number Percent
Total Never
Pre-
school Basic
Sec/ SHS
and
higher Total Never
Pre-
school Basic
Sec/SHS
and
higher
Both Sexes
Total 79,452 19,132 8,535 45,023 6,762
100.0 24.1 10.7 56.7 8.5
No disability 76,807 17,883 8,445 43,885 6,594
100.0 23.3 11.0 57.1 8.6
With a disability 2,645 1,249 90 1,138 168
100.0 47.2 3.4 43.0 6.4
Sight 925 407 24 411 83
100.0 44.0 2.6 44.4 9.0
Hearing 354 157 20 167 10
100.0 44.4 5.6 47.2 2.8
Speech 344 183 18 128 15
100.0 53.2 5.2 37.2 4.4
Physical 794 405 18 323 48
100.0 51.0 2.3 40.7 6.0
Intellectual 541 339 20 174 8
100.0 62.7 3.7 32.2 1.5
Emotional 297 111 10 155 21
100.0 37.4 3.4 52.2 7.1
Other 177 81 9 76 11
100.0 45.8 5.1 42.9 6.2
Male
Total 37,204 6,046 4,163 22,865 4,130
100.0 16.3 11.2 61.5 11.1
No disability 36,005 5,657 4,117 22,217 4,014
100.0 15.7 11.4 61.7 11.1
With a disability 1,199 389 46 648 116
100.0 32.4 3.8 54.0 9.7
Sight 411 110 15 229 57
100.0 26.8 3.6 55.7 13.9
Hearing 144 45 10 83 6
100.0 31.3 6.9 57.6 4.2
Speech 172 82 6 78 6
100.0 47.7 3.5 45.3 3.5
Physical 356 113 7 200 36
100.0 31.7 2.0 56.2 10.1
Intellectual 221 114 10 92 5
100.0 51.6 4.5 41.6 2.3
Emotional 145 37 2 92 14
100.0 25.5 1.4 63.4 9.7
Other 82 28 3 41 10
100.0 34.1 3.7 50.0 12.2
Female
Total 42,248 13,086 4,372 22,158 2,632
100.0 31.0 10.3 52.4 6.2
No disability 40,802 12,226 4,328 21,668 2,580
100.0 30.0 10.6 53.1 6.3
With a disability 1,446 860 44 490 52
100.0 59.5 3.0 33.9 3.6
Sight 514 297 9 182 26
100.0 57.8 1.8 35.4 5.1
Hearing 210 112 10 84 4
100.0 53.3 4.8 40.0 1.9
Speech 172 101 12 50 9
100.0 58.7 7.0 29.1 5.2
Physical 438 292 11 123 12
100.0 66.7 2.5 28.1 2.7
Intellectual 320 225 10 82 3
100.0 70.3 3.1 25.6 0.9
Emotional 152 74 8 63 7
100.0 48.7 5.3 41.4 4.6
Other 95 53 6 35 1 100.0 55.8 6.3 36.8 1.1
Source: Ghana Statistical Service, 2010 Population and Housing Census

44
CHAPTER SEVEN
AGRICULTURAL ACTIVITIES
7.1 Introduction
Agriculture is a key sector that can drive the ambition of the government to effectively reduce
poverty in Ghana and help the country to achieve the Millennium Development Goals
(MDGs) in Ghana. The Food and Agriculture Organization (FAO) has noted that despite the
importance of agriculture, it is arguably the least known sector of many economies in terms
of hard facts and statistics (FAO, 2012). Any strategy for reducing poverty and food
insecurity must be based on timely and accurate information that measure the impact of
agricultural policies and programmes.
In the past, one of the major difficulties encountered during the assessment of contributions
of men and women to agricultural development was the non-availability of gender-
disaggregated data with respect to the roles of women and men in agriculture production. The
2010 PHC for the first time administered questionnaires for households in agriculture. This
chapter briefly discusses the households engaged in agricultural activities and the type of
activities, which include crop farming, tree growing, livestock rearing and fish farming.
7.2 Households in Agriculture
Table 7.1 shows the distribution of households in agriculture in the District by locality of
residence. The major agricultural activities captured in the 2010 Census are crop farming,
tree planting, livestock rearing and fish farming. The table shows that agricultural
activities are more dominant in the rural areas (71.5%) than the urban areas. Crop faming
is the most important agricultural activity (10,655 households) for 26.7 percent of
agricultural households in the urban areas and 73.3 percent in the rural areas.
Table 7.1: Households by agricultural activities and locality
Type of agriculture
Total Urban Rural
Number Percent Number Percent Number Percent
Total households 20,955 100.0
10,631 50.7
10,324 49.3
Households engaged in Agriculture 11,278 100.0
3,218 28.5
8,060 71.5
Crop farming 10,655 100.0
2,846 26.7
7,809 73.3
Tree planting 79 100.0
14 17.7
65 82.3
Livestock rearing 3,316 100.0
693 20.9
2,623 79.1
Fish farming 7 100.0 1 14.3 6 85.7 Source: Ghana Statistical Service, 2010 Population and Housing Census
Livestock farming which is the second most practiced agricultural activity has 20.9
percent and 79.1 percent of the agricultural households in the urban and rural areas
respectively undertaking this activity. Fish farming has the lowest proportion of
households engaged in agriculture with 14.3 percent in the urban areas and 85.7 percent in
the rural areas.

45
7.3 Types of Farming Activities
Figure 7.1 presents distribution of households in agriculture. The table shows that the
highest proportion (75.8%) of households in the district are engaged in crop farming
followed by livestock rearing (23.6%) with only 0.6 percent engaged in tree planting
activities. Fish farming is rarely practiced in the District.
Figure 7.1: Households in agriculture
Source: Ghana Statistical Service, 2010 Population and Housing Census
7.4 Types of livestock, other animals reared and keepers
Table 7.1 shows the distribution of livestock and keepers in Awutu Senya District. There
are a total of 80,654 livestock reared by 4,700 keepers with an average of 17 animals per
keeper. Chicken is the most popular animal kept (50,392) followed by goats (17,494) and
sheep (4,116). Other animals include cattle, ducks and grass cutters. Chicken again has the
highest number of keepers (2,427) followed by goats (1,552) and sheep (366). The highest
average animal per keeper is snail (73 per keeper) followed by glasscutter (42 per keeper),
ostrich (33 per keeper), cattle (24 per keeper) and chicken (21 per keeper).
75.8%
0.6%
23.6%
0.0% 0.0%
10.0%
20.0%
30.0%
40.0%
50.0%
60.0%
70.0%
80.0%
Crop Farming Tree Planting Livestock Rearing Fish Farming

46
Table 7.2: Distribution of livestock, other animals and keepers
Livestock/Other
animals
Number of
livestock, birds,
fishes and others
Number of
keepers
Average
per
Keeper
All livestock 80,654
4,700
17
Beehives 23
3
8
Cattle 1,494
63
24
Chicken 50,392
2,427
21
Dove 196
12
16
Duck 1,207
87
14
Goat 17,494
1,552
11
Grass-cutter 1,085
26
42
Guinea fowl 293
19
15
Ostrich 331
10
33
Pig 1,299
46
28
Rabbit 223
16
14
Sheep 4,116
366
11
Silk worm 9
3
3
Snail 219
3
73
Turkey 55
8
7
Other 307
50
6
Fish farming 1,905
8
238
Inland fishing 0
0
0
Marine fishing 6 1 6
Source: Ghana Statistical Service, 2010 Population and Housing Census
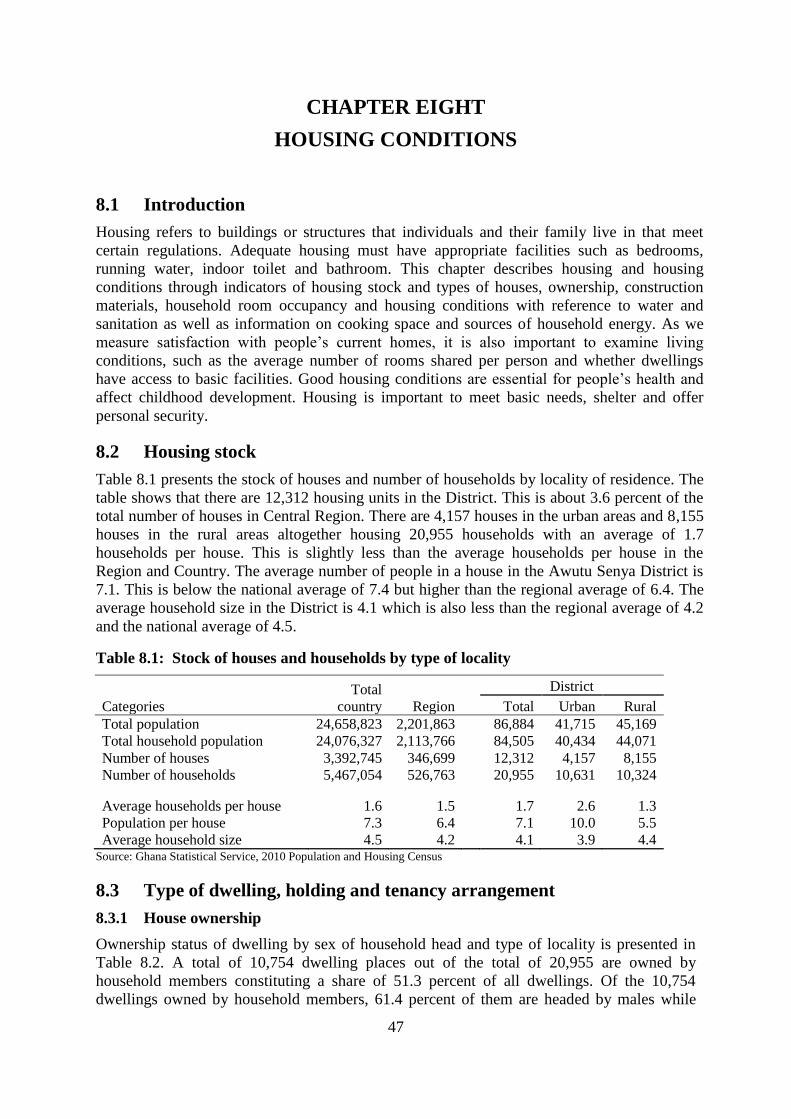
47
CHAPTER EIGHT
HOUSING CONDITIONS
8.1 Introduction
Housing refers to buildings or structures that individuals and their family live in that meet
certain regulations. Adequate housing must have appropriate facilities such as bedrooms,
running water, indoor toilet and bathroom. This chapter describes housing and housing
conditions through indicators of housing stock and types of houses, ownership, construction
materials, household room occupancy and housing conditions with reference to water and
sanitation as well as information on cooking space and sources of household energy. As we
measure satisfaction with people’s current homes, it is also important to examine living
conditions, such as the average number of rooms shared per person and whether dwellings
have access to basic facilities. Good housing conditions are essential for people’s health and
affect childhood development. Housing is important to meet basic needs, shelter and offer
personal security.
8.2 Housing stock
Table 8.1 presents the stock of houses and number of households by locality of residence. The
table shows that there are 12,312 housing units in the District. This is about 3.6 percent of the
total number of houses in Central Region. There are 4,157 houses in the urban areas and 8,155
houses in the rural areas altogether housing 20,955 households with an average of 1.7
households per house. This is slightly less than the average households per house in the
Region and Country. The average number of people in a house in the Awutu Senya District is
7.1. This is below the national average of 7.4 but higher than the regional average of 6.4. The
average household size in the District is 4.1 which is also less than the regional average of 4.2
and the national average of 4.5.
Table 8.1: Stock of houses and households by type of locality
Categories
Total
country Region
District
Total Urban Rural
Total population 24,658,823 2,201,863
86,884 41,715 45,169
Total household population 24,076,327 2,113,766
84,505 40,434 44,071
Number of houses 3,392,745 346,699
12,312 4,157 8,155
Number of households 5,467,054 526,763
20,955 10,631 10,324
Average households per house 1.6 1.5
1.7 2.6 1.3
Population per house 7.3 6.4
7.1 10.0 5.5
Average household size 4.5 4.2 4.1 3.9 4.4 Source: Ghana Statistical Service, 2010 Population and Housing Census
8.3 Type of dwelling, holding and tenancy arrangement
8.3.1 House ownership
Ownership status of dwelling by sex of household head and type of locality is presented in
Table 8.2. A total of 10,754 dwelling places out of the total of 20,955 are owned by
household members constituting a share of 51.3 percent of all dwellings. Of the 10,754
dwellings owned by household members, 61.4 percent of them are headed by males while
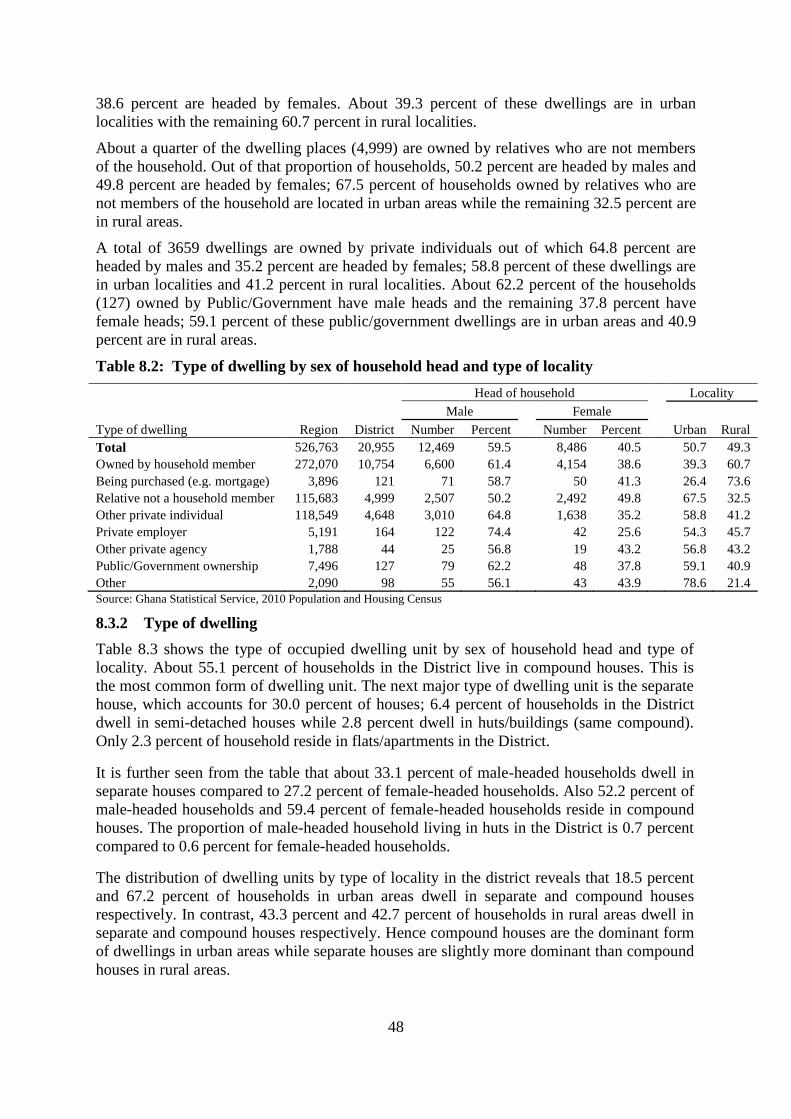
48
38.6 percent are headed by females. About 39.3 percent of these dwellings are in urban
localities with the remaining 60.7 percent in rural localities.
About a quarter of the dwelling places (4,999) are owned by relatives who are not members
of the household. Out of that proportion of households, 50.2 percent are headed by males and
49.8 percent are headed by females; 67.5 percent of households owned by relatives who are
not members of the household are located in urban areas while the remaining 32.5 percent are
in rural areas.
A total of 3659 dwellings are owned by private individuals out of which 64.8 percent are
headed by males and 35.2 percent are headed by females; 58.8 percent of these dwellings are
in urban localities and 41.2 percent in rural localities. About 62.2 percent of the households
(127) owned by Public/Government have male heads and the remaining 37.8 percent have
female heads; 59.1 percent of these public/government dwellings are in urban areas and 40.9
percent are in rural areas.
Table 8.2: Type of dwelling by sex of household head and type of locality
Type of dwelling Region District
Head of household Locality
Male
Female
Urban Rural Number Percent Number Percent
Total 526,763 20,955 12,469 59.5
8,486 40.5
50.7 49.3
Owned by household member 272,070 10,754 6,600 61.4
4,154 38.6
39.3 60.7
Being purchased (e.g. mortgage) 3,896 121 71 58.7
50 41.3
26.4 73.6
Relative not a household member 115,683 4,999 2,507 50.2
2,492 49.8
67.5 32.5
Other private individual 118,549 4,648 3,010 64.8
1,638 35.2
58.8 41.2
Private employer 5,191 164 122 74.4
42 25.6
54.3 45.7
Other private agency 1,788 44 25 56.8
19 43.2
56.8 43.2
Public/Government ownership 7,496 127 79 62.2
48 37.8
59.1 40.9
Other 2,090 98 55 56.1 43 43.9 78.6 21.4
Source: Ghana Statistical Service, 2010 Population and Housing Census
8.3.2 Type of dwelling
Table 8.3 shows the type of occupied dwelling unit by sex of household head and type of
locality. About 55.1 percent of households in the District live in compound houses. This is
the most common form of dwelling unit. The next major type of dwelling unit is the separate
house, which accounts for 30.0 percent of houses; 6.4 percent of households in the District
dwell in semi-detached houses while 2.8 percent dwell in huts/buildings (same compound).
Only 2.3 percent of household reside in flats/apartments in the District.
It is further seen from the table that about 33.1 percent of male-headed households dwell in
separate houses compared to 27.2 percent of female-headed households. Also 52.2 percent of
male-headed households and 59.4 percent of female-headed households reside in compound
houses. The proportion of male-headed household living in huts in the District is 0.7 percent
compared to 0.6 percent for female-headed households.
The distribution of dwelling units by type of locality in the district reveals that 18.5 percent
and 67.2 percent of households in urban areas dwell in separate and compound houses
respectively. In contrast, 43.3 percent and 42.7 percent of households in rural areas dwell in
separate and compound houses respectively. Hence compound houses are the dominant form
of dwellings in urban areas while separate houses are slightly more dominant than compound
houses in rural areas.
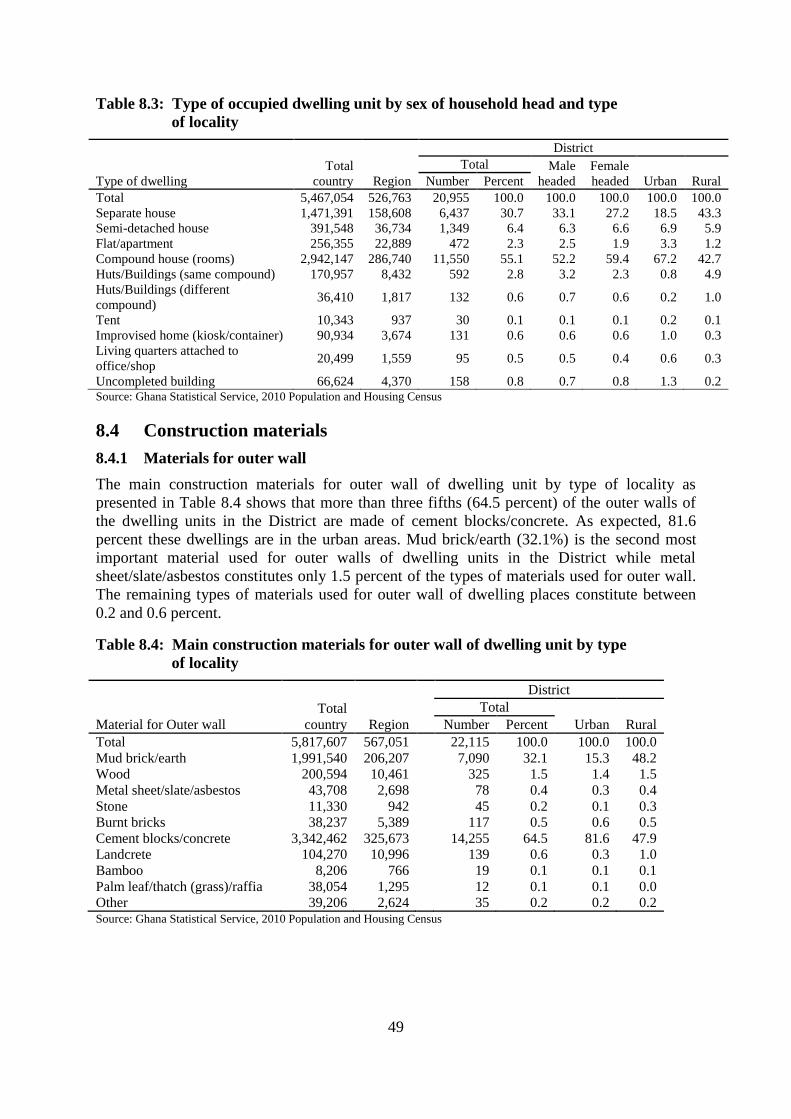
49
Table 8.3: Type of occupied dwelling unit by sex of household head and type
of locality
Type of dwelling
Total
country Region
District
Total Male
headed
Female
headed Urban Rural Number Percent
Total 5,467,054 526,763 20,955 100.0 100.0 100.0 100.0 100.0
Separate house 1,471,391 158,608 6,437 30.7 33.1 27.2 18.5 43.3
Semi-detached house 391,548 36,734 1,349 6.4 6.3 6.6 6.9 5.9
Flat/apartment 256,355 22,889 472 2.3 2.5 1.9 3.3 1.2
Compound house (rooms) 2,942,147 286,740 11,550 55.1 52.2 59.4 67.2 42.7
Huts/Buildings (same compound) 170,957 8,432 592 2.8 3.2 2.3 0.8 4.9
Huts/Buildings (different
compound) 36,410 1,817 132 0.6 0.7 0.6 0.2 1.0
Tent 10,343 937 30 0.1 0.1 0.1 0.2 0.1
Improvised home (kiosk/container) 90,934 3,674 131 0.6 0.6 0.6 1.0 0.3
Living quarters attached to
office/shop 20,499 1,559 95 0.5 0.5 0.4 0.6 0.3
Uncompleted building 66,624 4,370 158 0.8 0.7 0.8 1.3 0.2 Source: Ghana Statistical Service, 2010 Population and Housing Census
8.4 Construction materials
8.4.1 Materials for outer wall
The main construction materials for outer wall of dwelling unit by type of locality as
presented in Table 8.4 shows that more than three fifths (64.5 percent) of the outer walls of
the dwelling units in the District are made of cement blocks/concrete. As expected, 81.6
percent these dwellings are in the urban areas. Mud brick/earth (32.1%) is the second most
important material used for outer walls of dwelling units in the District while metal
sheet/slate/asbestos constitutes only 1.5 percent of the types of materials used for outer wall.
The remaining types of materials used for outer wall of dwelling places constitute between
0.2 and 0.6 percent.
Table 8.4: Main construction materials for outer wall of dwelling unit by type
of locality
Material for Outer wall
Total
country Region
District
Total
Urban Rural Number Percent
Total 5,817,607 567,051
22,115 100.0 100.0 100.0
Mud brick/earth 1,991,540 206,207
7,090 32.1 15.3 48.2
Wood 200,594 10,461
325 1.5 1.4 1.5
Metal sheet/slate/asbestos 43,708 2,698
78 0.4 0.3 0.4
Stone 11,330 942
45 0.2 0.1 0.3
Burnt bricks 38,237 5,389
117 0.5 0.6 0.5
Cement blocks/concrete 3,342,462 325,673
14,255 64.5 81.6 47.9
Landcrete 104,270 10,996
139 0.6 0.3 1.0
Bamboo 8,206 766
19 0.1 0.1 0.1
Palm leaf/thatch (grass)/raffia 38,054 1,295
12 0.1 0.1 0.0
Other 39,206 2,624 35 0.2 0.2 0.2 Source: Ghana Statistical Service, 2010 Population and Housing Census

50
8.4.2 Materials for floor
Table 8.5 shows the main construction material for the floor of dwelling unit by type of
locality. Main materials used for the floors of building include cement/concrete and
earth/mud. 91.7 percent of households dwell in housing units with floor made with cement.
Only 6.4 percent of households in the District dwell in houses in which floors are made of
mainly earth/mud. Table 8.5 further shows that less than two percent of households dwell in
housing units in which the floors are made of materials other than cement/concrete and
earth/mud. These materials are stone (0.3%), burnt brick (0.1%), wood (0.2%), vinyl tiles
(0.2%), ceramic/porcelain/granite/marble tiles (0.7%), and terrazzo/terrazzo tiles (0.2%).
Table 8.5: Main construction materials for the floor of dwelling unit by type of locality
Materials for the floor
Total
country Region
District
Total
Urban Rural Number Percent
Total 5,467,054 526,763
21,107 100.0 100.0 100.0
Earth/mud 872,161 59,543
1,360 6.4 4.3 8.6
Cement/concrete 4,255,611 448,599
19,347 91.7 93.3 90.0
Stone 32,817 2,192
59 0.3 0.2 0.4
Burnt brick 6,537 718
12 0.1 0.0 0.1
Wood 52,856 1,924
75 0.4 0.6 0.1
Vinyl tiles 57,032 3,378
50 0.2 0.3 0.1
Ceramic/porcelain/granite/marble tiles 88,500 5,534
139 0.7 0.7 0.6
Terrazzo/terrazzo tiles 85,973 3,669
34 0.2 0.3 0.1
Other 15,567 1,206 31 0.1 0.2 0.1 Source: Ghana Statistical Service, 2010 Population and Housing Census
8.4.3 Materials for roofing
Just as there are different materials for constructing floors, the materials used for roofing also
vary. Households with roofs made from corrugated metal sheets constitute 67.9 percent of
the materials used for roofing in the district (Table 8.6). About 26.5% of households dwell in
housing units whose roofs are made of slate/asbestos. Only 3.1 percent of households dwell
in houses with roofs made from thatch/palm leaf/raffia. Table 8.6 further shows that
relatively small proportions of households dwell in housing units in which the roofs are made
of materials other than corrugated metal roofs and slate/asbestos. These materials are
mud/bricks/earth (0.4%), wood (0.4%), cement/concrete (0.9%) roofing tiles (0.1%) and
bamboo (0.2%).
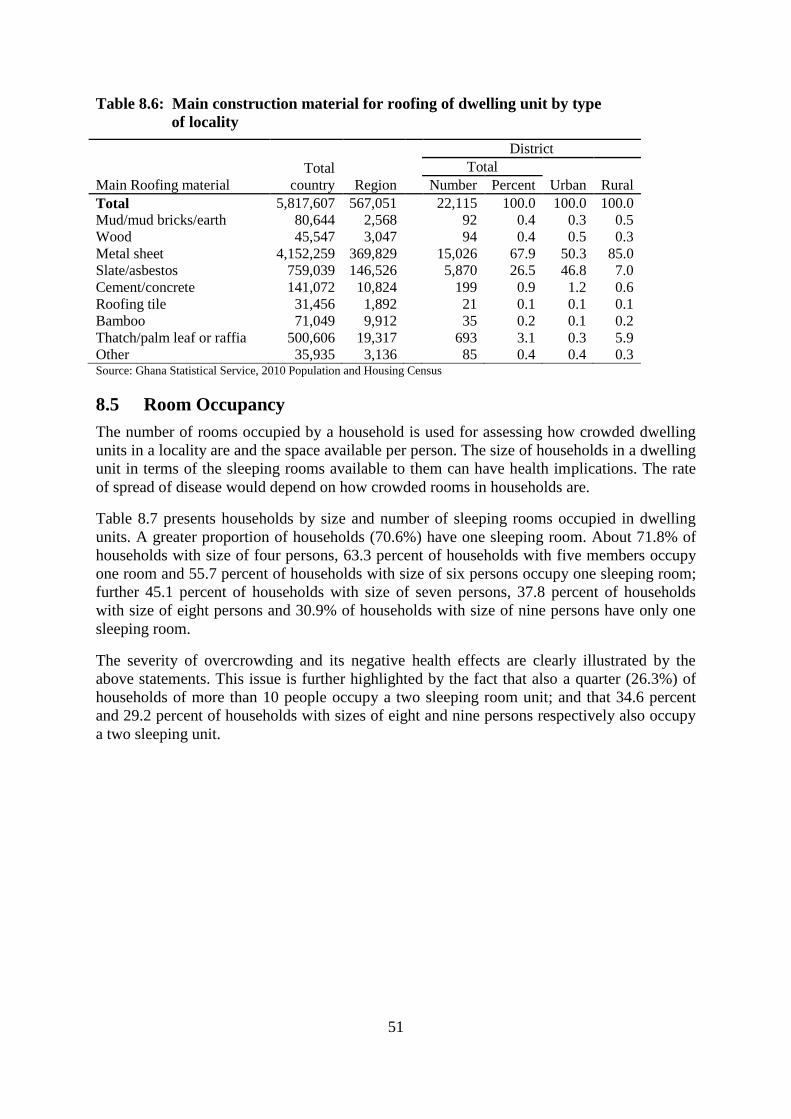
51
Table 8.6: Main construction material for roofing of dwelling unit by type
of locality
Main Roofing material
Total
country Region
District
Total
Urban Rural Number Percent
Total 5,817,607 567,051
22,115 100.0 100.0 100.0
Mud/mud bricks/earth 80,644 2,568
92 0.4 0.3 0.5
Wood 45,547 3,047
94 0.4 0.5 0.3
Metal sheet 4,152,259 369,829
15,026 67.9 50.3 85.0
Slate/asbestos 759,039 146,526
5,870 26.5 46.8 7.0
Cement/concrete 141,072 10,824
199 0.9 1.2 0.6
Roofing tile 31,456 1,892
21 0.1 0.1 0.1
Bamboo 71,049 9,912
35 0.2 0.1 0.2
Thatch/palm leaf or raffia 500,606 19,317
693 3.1 0.3 5.9
Other 35,935 3,136
85 0.4 0.4 0.3 Source: Ghana Statistical Service, 2010 Population and Housing Census
8.5 Room Occupancy
The number of rooms occupied by a household is used for assessing how crowded dwelling
units in a locality are and the space available per person. The size of households in a dwelling
unit in terms of the sleeping rooms available to them can have health implications. The rate
of spread of disease would depend on how crowded rooms in households are.
Table 8.7 presents households by size and number of sleeping rooms occupied in dwelling
units. A greater proportion of households (70.6%) have one sleeping room. About 71.8% of
households with size of four persons, 63.3 percent of households with five members occupy
one room and 55.7 percent of households with size of six persons occupy one sleeping room;
further 45.1 percent of households with size of seven persons, 37.8 percent of households
with size of eight persons and 30.9% of households with size of nine persons have only one
sleeping room.
The severity of overcrowding and its negative health effects are clearly illustrated by the
above statements. This issue is further highlighted by the fact that also a quarter (26.3%) of
households of more than 10 people occupy a two sleeping room unit; and that 34.6 percent
and 29.2 percent of households with sizes of eight and nine persons respectively also occupy
a two sleeping unit.

52
Table 8.7: Households by size and number of sleeping rooms occupied in
dwelling unit
House-
hold
size
Number of sleeping rooms
One
room
Two
rooms
Three
rooms
Four
rooms
Five
rooms
Six
rooms
Seven
rooms
Eight
rooms
Nine
rooms
or
more
Total
Number Percent
Total 20,955 100.0 70.6 19.1 5.8 2.6 0.9 0.4 0.2 0.1 0.2
1 4,173 100.0 94.6 4.1 0.3 0.5 0.2 0.0 0.1 0.1 0.1
2 2,931 100.0 83.4 14.5 1.3 0.5 0.2 0.1 0.0 0.0 0.1
3 3,054 100.0 78.2 16.9 3.4 0.9 0.2 0.2 0.0 0.1 0.1
4 2,977 100.0 71.8 20.4 5.5 1.5 0.4 0.1 0.1 0.0 0.1
5 2,514 100.0 63.3 25.9 6.9 2.7 0.6 0.2 0.1 0.1 0.1
6 1,951 100.0 55.7 29.4 8.9 3.8 1.1 0.6 0.1 0.2 0.2
7 1,261 100.0 45.1 34.1 11.7 5.6 2.2 0.4 0.2 0.3 0.3
8 849 100.0 37.8 34.6 15.9 7.3 2.0 1.1 0.7 0.2 0.4
9 469 100.0 30.9 29.2 23.5 9.8 3.6 1.7 0.4 0.4 0.4
10+ 776 100.0 20.6 26.3 20.9 15.7 7.7 3.9 1.7 1.3 1.9
Source: Ghana Statistical Service, 2010 Population and Housing Census
8.6 Access to Utilities and Household Facilities
8.6.1 Main source of lighting to dwelling units
Figure 8.1 illustrates the main sources of lighting of dwelling unit by type of locality. The
main sources of lighting in the district are electricity (60.8%) and kerosene lamp (29.9%).
Flashlight (7.2%) is also of some importance. Another source of lighting with almost one
percent usage is private generators (0.7%). Other sources of lighting barely used are gas lamp
(0.1%), solar energy (0.1%), candle (0.5%), firewood (0.2%) and crop residue (0.1%).
Figure 8.1: Sources of lighting to households
Source: Ghana Statistical Service, 2010 Population and Housing Census
60.8%
0.7%
29.9%
0.1% 0.1% 0.5%
7.2%
0.2% 0.1% 0.3% 0.0%
10.0%
20.0%
30.0%
40.0%
50.0%
60.0%
70.0%

53
8.6.2 Main sources of cooking fuel
Table 8.8 shows the main sources of cooking fuel and cooking space used by households.
The main source of fuel for cooking in the District is wood. Wood is used by 52 percent of
households in the district, and by more rural (74.1%) than urban (30.5%) households. This is
followed by charcoal (33.4%) for which more urban households (49.9%) than rural
households (16.3%) use for cooking.
One in 16 households (6.7%) in the district use gas for cooking, and more of urban
households (9.1%) use gas as compared to rural households (4.3%). About 8.0 percent of
households do not use any sources of cooking fuel; there are more urban (10.1%) than rural
households (5.8%). Only one percent of households use kerosene, crop residue and electricity
as cooking fuels put together.
The most important cooking space used by both urban (29.9%) and rural (30.2%) households
are open spaces in compound. Verandas (29.3%) of dwellings are the next most important
cooking space used by urban households followed by exclusive separate rooms. Rural
households have exclusive separate rooms (22.8%) as the second most common facility for
cooking followed by structures with roof but without walls (22.1%). More urban households
(10.1%) than rural households (5.8%) do not have cooking spaces.
Table 8.8: Main source of cooking fuel and cooking space used by households
Cooking fuel/ cooking space
Total
Country Region
District
Total
Urban Rural Number Percent
Source of cooking fuel
Total 5,467,054 526,763 20,955 100.0 100.0 100.0
None no cooking 306,118 26,767 1,453 6.9 9.4 4.3
Wood 2,197,083 232,964 10,891 52.0 30.5 74.1
Gas 996,518 65,955 1,409 6.7 9.1 4.3
Electricity 29,794 1,221 33 0.2 0.2 0.1
Kerosene 29,868 2,935 105 0.5 0.6 0.4
Charcoal 1,844,290 194,256 6,989 33.4 49.9 16.3
Crop residue 45,292 1,477 57 0.3 0.2 0.4
Saw dust 8,000 514 6 0.0 0.0 0.0
Animal waste 2,332 209 8 0.0 0.0 0.0
Other 7,759 465 4 0.0 0.0 0.0
Cooking space used by household
Total 5,467,054 526,763 20,955 100.0 100.0 100.0
No cooking space 386,883 34,823 1,674 8.0 10.1 5.8
Separate room for exclusive use of
household 1,817,018 176,215 3,787 18.1 13.5 22.8
Separate room shared with other
household(s) 410,765 35,850 702 3.4 4.4 2.2
Enclosure without roof 117,614 8,635 518 2.5 2.5 2.4
Structure with roof but without walls 349,832 34,193 3,152 15.0 8.2 22.1
Bedroom/hall/living room) 74,525 8,387 288 1.4 1.8 1.0
Verandah 1,173,946 108,346 4,460 21.3 29.3 13.0
Open space in compound 1,115,464 117,661 6,299 30.1 29.9 30.2
Other 21,007 2,653 75 0.4 0.3 0.4 Source: Ghana Statistical Service, 2010 Population and Housing Census

54
8.7 Main source of Water for Drinking and for other Domestic Use
8.7.1 Sources of water for drinking
Figure 8.2 shows the major sources of drinking water in the District. Pipe-borne outside
dwelling (25.6%), public tap/standpipe (19.1%) and river/stream (17.1%) are the most
widely-used sources of drinking water. Other important sources are bore-hole/pump/tube well
(9.4%), sachet water (7.2%), unprotected well (5.6%) and dugout/pond/lake/dam/canal (2%).
Bottled water, the status symbol of the middle and upper classes, is used by only 0.2% of
households in the district.
Figure 8.2: Main sources of water for drinking
Source: Ghana Statistical Service, 2010 Population and Housing Census
8.8 Bathing and Toilet Facilities
8.8.1 Bathing facilities
Table 8.9 shows toilet and bathing facilities used by households in the District. There are
three widely-used bathing facilities in the District. The first is shared open bathing cubicle
used by 7,350 households or 35.1 percent of households in the district, 54.4 percent in urban
and 45.6 percent in rural areas. The second most important facility is used by 4,968
households and this is shared separate bathroom in the same house and constitutes 23.7
percent of households, 73.9 percent in urban and 26.1 percent in rural areas. The third most
important bathing facility is own bathroom for exclusive use available for 3,171 households
making up 13.5% of households in the district, 27.4 percent in urban and 72.6 percent in rural
areas. Private open cubicles (10.1%), bathroom in another house (8.0%) and open space
around the house (6.4%) are the next three most important bathing facilities. The least
patronized bathing facilities are public bath houses and rivers/pond/lake/dam.
2.8%
25.6%
19.1%
9.4%
5.2% 3.7%
0.8% 0.2%
7.2%
0.2%
5.6%
1.2%
17.1%
2%
0% 0.0%
5.0%
10.0%
15.0%
20.0%
25.0%
30.0%
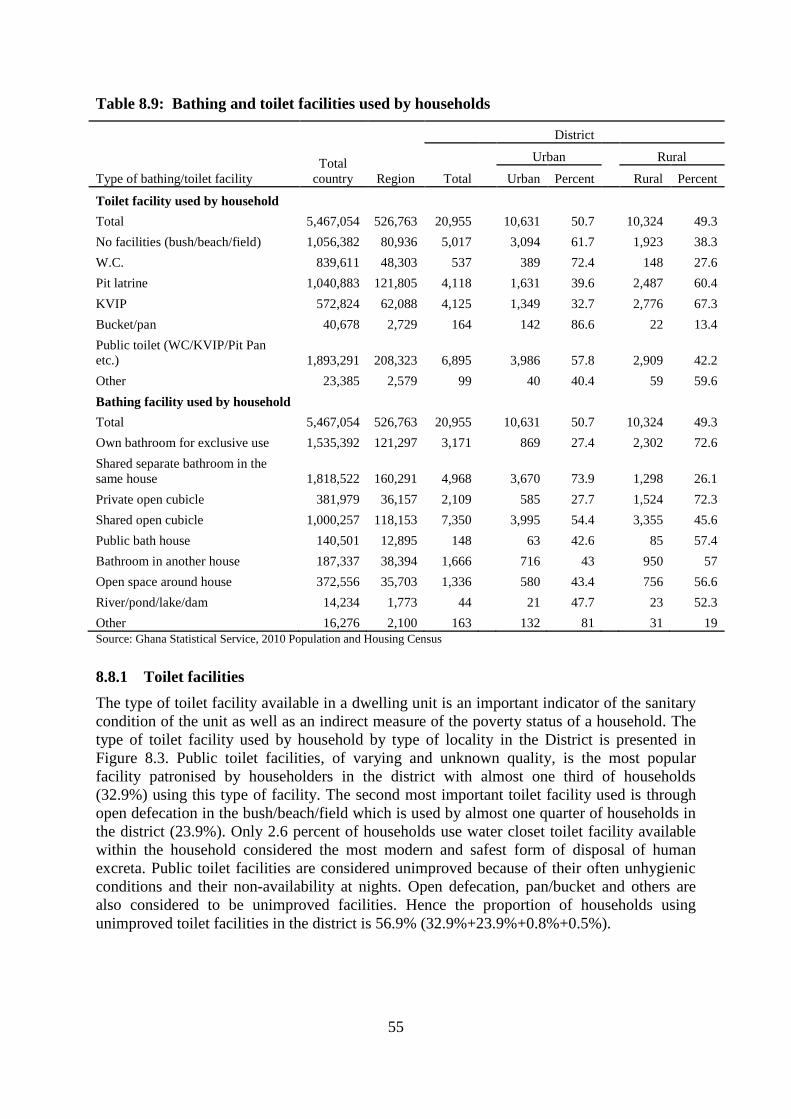
55
Table 8.9: Bathing and toilet facilities used by households
Type of bathing/toilet facility
Total
country Region
District
Total
Urban
Rural
Urban Percent Rural Percent
Toilet facility used by household
Total 5,467,054 526,763 20,955
10,631 50.7
10,324 49.3
No facilities (bush/beach/field) 1,056,382 80,936 5,017
3,094 61.7
1,923 38.3
W.C. 839,611 48,303 537
389 72.4
148 27.6
Pit latrine 1,040,883 121,805 4,118
1,631 39.6
2,487 60.4
KVIP 572,824 62,088 4,125
1,349 32.7
2,776 67.3
Bucket/pan 40,678 2,729 164
142 86.6
22 13.4
Public toilet (WC/KVIP/Pit Pan
etc.) 1,893,291 208,323 6,895
3,986 57.8
2,909 42.2
Other 23,385 2,579 99
40 40.4
59 59.6
Bathing facility used by household
Total 5,467,054 526,763 20,955
10,631 50.7
10,324 49.3
Own bathroom for exclusive use 1,535,392 121,297 3,171
869 27.4
2,302 72.6
Shared separate bathroom in the
same house 1,818,522 160,291 4,968
3,670 73.9
1,298 26.1
Private open cubicle 381,979 36,157 2,109
585 27.7
1,524 72.3
Shared open cubicle 1,000,257 118,153 7,350
3,995 54.4
3,355 45.6
Public bath house 140,501 12,895 148
63 42.6
85 57.4
Bathroom in another house 187,337 38,394 1,666
716 43
950 57
Open space around house 372,556 35,703 1,336
580 43.4
756 56.6
River/pond/lake/dam 14,234 1,773 44
21 47.7
23 52.3
Other 16,276 2,100 163 132 81 31 19
Source: Ghana Statistical Service, 2010 Population and Housing Census
8.8.1 Toilet facilities
The type of toilet facility available in a dwelling unit is an important indicator of the sanitary
condition of the unit as well as an indirect measure of the poverty status of a household. The
type of toilet facility used by household by type of locality in the District is presented in
Figure 8.3. Public toilet facilities, of varying and unknown quality, is the most popular
facility patronised by householders in the district with almost one third of households
(32.9%) using this type of facility. The second most important toilet facility used is through
open defecation in the bush/beach/field which is used by almost one quarter of households in
the district (23.9%). Only 2.6 percent of households use water closet toilet facility available
within the household considered the most modern and safest form of disposal of human
excreta. Public toilet facilities are considered unimproved because of their often unhygienic
conditions and their non-availability at nights. Open defecation, pan/bucket and others are
also considered to be unimproved facilities. Hence the proportion of households using
unimproved toilet facilities in the district is 56.9% (32.9%+23.9%+0.8%+0.5%).

56
Figure 8.3: Toilet facilities
Source: Ghana Statistical Service, 2010 Population and Housing Census
8.9 Method of Waste Disposal
Waste disposal is another means for measuring sanitation standards in an area. Table 8.10
presents method of solid and liquid waste disposal by type of locality; 68.0 percent of
households dispose their solid waste at public dump (open space). Out of this proportion,
44.5 percent are in urban households while 55.5 percent are rural; 3.1 percent of households
in the district, constituted by 89.0 percent of urban and 11.0 percent of rural households,
dispose their solid waste in public dump (container); 14.5 percent of households dispose their
solid waste disposal by burning, of which 67.5 percent are urban while 32.5 percent are rural.
Also, 8.3 percent of households in the district dump waste indiscriminately, 47.9 percent
being urban households and 52.1 rural households.
Table 8.10 shows that majority (56.5%) of households dispose waste by throwing onto
compound while a few (0.3% and 1.4%) dispose through the sewage system and through
drainage system into gutters respectively. Four means of liquid waste disposals are used by
more urban households than rural. They are throwing into gutters (84.1%), through sewerage
system (72.1%), throwing onto the street/outsides (69.0%) and through drainage system into
a gutter (67.0%). More rural households (66.0%) households than urban (34.0%) dispose
their liquid waste by throwing them onto the compound. Interestingly also, more rural
(65.2%) than urban (34.8%) households dispose liquid wastes through drainage into pits
(soak away system).
23.9%
2.6%
19.7% 19.7%
0.8%
32.9%
0.5%
0.0
5.0
10.0
15.0
20.0
25.0
30.0
35.0
No facilities
(bush/beach/field)
W.C. Pit latrine KVIP Bucket/Pan Public toilet
(WCKVIPPitPan
etc)
Other
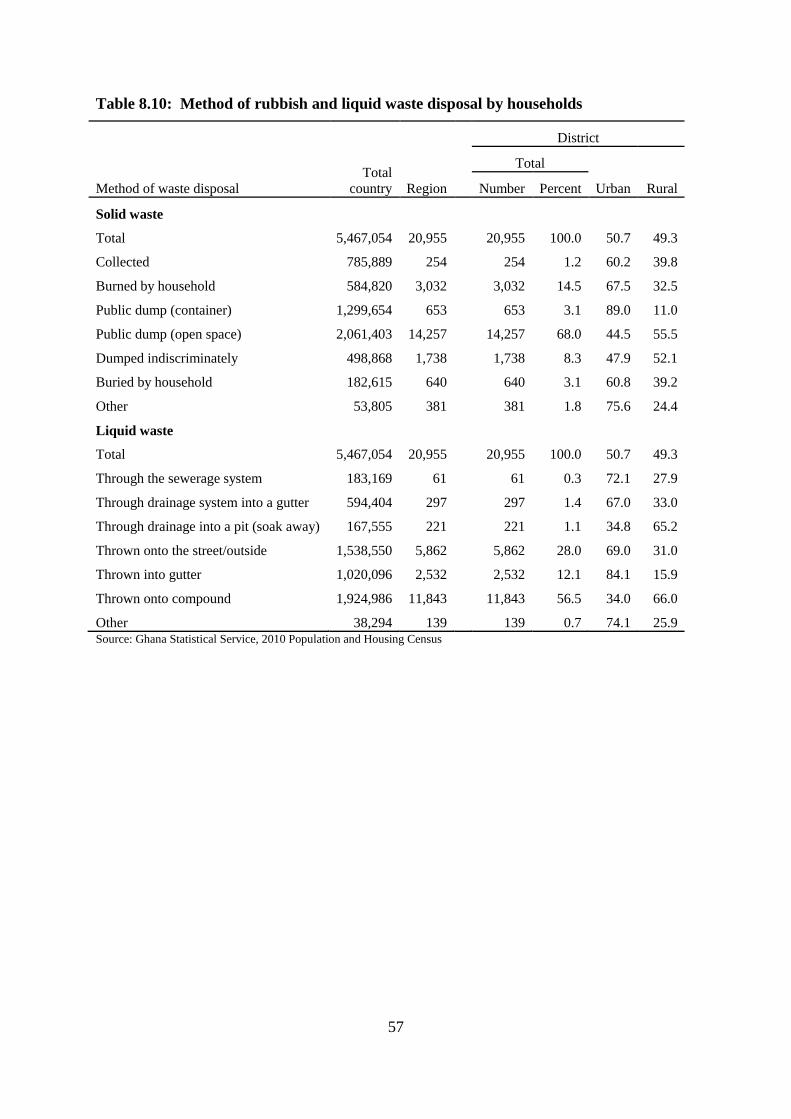
57
Table 8.10: Method of rubbish and liquid waste disposal by households
Method of waste disposal
Total
country Region
District
Total
Urban Rural Number Percent
Solid waste
Total 5,467,054 20,955
20,955 100.0 50.7 49.3
Collected 785,889 254
254 1.2 60.2 39.8
Burned by household 584,820 3,032
3,032 14.5 67.5 32.5
Public dump (container) 1,299,654 653
653 3.1 89.0 11.0
Public dump (open space) 2,061,403 14,257
14,257 68.0 44.5 55.5
Dumped indiscriminately 498,868 1,738
1,738 8.3 47.9 52.1
Buried by household 182,615 640
640 3.1 60.8 39.2
Other 53,805 381
381 1.8 75.6 24.4
Liquid waste
Total 5,467,054 20,955
20,955 100.0 50.7 49.3
Through the sewerage system 183,169 61
61 0.3 72.1 27.9
Through drainage system into a gutter 594,404 297
297 1.4 67.0 33.0
Through drainage into a pit (soak away) 167,555 221
221 1.1 34.8 65.2
Thrown onto the street/outside 1,538,550 5,862
5,862 28.0 69.0 31.0
Thrown into gutter 1,020,096 2,532
2,532 12.1 84.1 15.9
Thrown onto compound 1,924,986 11,843
11,843 56.5 34.0 66.0
Other 38,294 139 139 0.7 74.1 25.9 Source: Ghana Statistical Service, 2010 Population and Housing Census
58
CHAPTER NINE
SUMMARY OF FINDINGS CONCLUSIONS AND
POLICY IMPLICATIONS
9.1 Summary of Findings
9.1.1 Basic population characteristics
The Awutu Senya District has a population of 86,884 as captured in the 2010 Population and
Housing Census. This represents 3.9 percent of the population of the Central Region. In terms
of composition, there are 40,903 males and 45,981 females with a sex ratio of 89.0. The
District depicts a highly youthful population. The proportion of the population below 15
years is 41.7 percent compared to the regional average of 39.5 percent. The district has
dependency ratio of 85.5. The proportion of the population living in urban areas is 48 percent
compared to 52 percent in the rural areas.
The District recorded a Total Fertility Rate of 3.9, a General Fertility Rate of 114.8 and a
Crude Birth Rate of 28.7 all higher than corresponding regional rates; 653 deaths were
recorded in households over the last 12 months preceding the enumeration in the district. The
crude death rate, which is the number of deaths per 1000 of the population in the district, is
7.5 which is slightly below the regional rate. Migrants constitute 29.1 percent of the
population.
9.1.2 Social characteristics
Households
There are 84,505 households in the Awutu Senya District; 50.7 percent are urban and 49.3
percent rural. Female-headed households (52.9%) are more than male-headed households
(47.1%). More than one in two (50.2%) of households are classified as extended family
households.
Marital characteristics
About 39.0 percent of persons 12 years and older have never married compared to 36.9
percent who are married. Also 12.4 percent of persons 12 year and older are living in
informal/consensual union/living together and 6.0 percent are widowed. A greater proportion
of the married population (67.1%) are between the age group of 40 - 44.
Nationality and religious affiliation
Ghanaians (by birth, dual nationality or by naturalization) constitute 98.4 percent of the
population with the rest being non-Ghanaians (1.6%). Christian constitute 78.1 percent of the
population while Muslims account for 6.3 percent of the population in the District. Followers
of traditional African religions constitute 2.0 percent of the population. People who have no
religious preferences or do not practice any religion are 10.2% of the population.

59
Literacy
Almost half (48.3%) of the population 11 years and older in the district is literate in English.
The second highest proportion of the literate population is English and Ghanaian language
only (46.1%) followed by Ghanaian Language only (4.6%). In spite of attempts being made
towards encouraging literacy in French, only 0.5 percent of literate population 11 years and
older are literate in English and French.
Education
A total of 31,951 children are attending school made up of 16,402 males and 15,549 females;
27,787 have attended school in the past also with 14,436 males and 13,351 females. The
greatest proportion of those currently attending is in the Primary school (48.2%) while the
greatest proportion of those who attended school in the past is JSS/JHS graduates.
9.1.3 Economic characteristics
Economic activity status
Persons 15 years and older who are economically active make up 75.1 percent of the
population with the remaining 24.9 percent not economically active; 95.7 percent of the
economically active population are employed composed of 74.8 percent males and 95.6
percent females while 4.3 percent are unemployed. The largest proportion of the
economically not active are those in full time education (44.2%).
Occupation
Skilled agricultural forestry and fishery (43.5%) is the most common occupation for persons
aged 15years and older in the district. This is followed by Service and Sales (19.8%) and
Crafts and Related Trade Workers (19.5%). Managers (1.7%) and professionals (4.0%) are
least. There are however more female managers (2.0 percent) than males (1.7%).
Industry
The main industrial activity in the District is Agriculture Forestry employing 43.7 percent of
the population. Other main industrial activities in the District are manufacturing (14.2%) and
wholesale and retail; repair of motor vehicles and motor cycles (16.9 percent). Higher
proportions of males (51.6%) than females (37.4%) are into the Agriculture Industry. On the
contrary, more females (23.6%) are in the wholesale and retail industry than males (8.7%).
Employment status
Private informal sector dominates the employment sector in the district employing 91.4
percent of the employed population in the district. This is followed by the private formal
sector with 4.7 percent. The public/government sector follows with 3.3 percent. There are no
workers from international organizations. Few people are employed by the semi-
public/parastatal (0.1%) and the NGOs (0.3%).
Employment sector
The largest proportion of the employed population is in the private informal sector (93.3%).
The rest of the employed which constitute less than 8 percent are spread across the other
sectors as follows; private formal (3.5%) and the public (government) sector (2.9%), NGOs
(Local and International) (0.2%) and Semi-Public/Parastatals (0.1).
60
9.1.4 Information Communication Technology (ICT)
Persons with mobile phones
The proportion of persons 12 years and older in the Awutu Senya District who own mobile
phones is 39.5 percent. Mobile phone ownership is higher among males (48.5%) than in
females (32.0%).
Use of Internet facility
The relatively low usage of Internet at the household level (2.9% of the district population) is
more likely due to inadequate levels of Internet facilities in the area; 4.5 percent of males
only 1.6 percent of females use internet facilities in the district.
Ownership of fixed telephone lines
Less than 2 percent of households in the district own fixed telephone lines; 1.9 percent of the
male-headed households and 1.6 percent of the female-headed households own fixed
telephone lines.
Households ownership of desktop or laptop computer
There are 643 households representing 3.1 percent of households in the district who own
desktop or laptop computers. Out of that total, 4.0 percent of male headed households and 1.6
percent of female headed household own the facility.
9.1.5 Disability
Persons with disability form 3.1 percent of the population of the District. The proportion of
persons with disability (PWDs) is higher among females (3.2%) than males (3.1%). Physical
disability is the commonest type of disability in the District accounting for 29.9 percent of the
population of persons with disability. 59.3 percent of the PWDs are employed, 2.5 percent are
unemployed while 38.5 percent are economically not active.
9.1.6 Agricultural activities
Farming activities
A greater Proportion (53.8%) of households in the district are engaged in agriculture. Rural
households (71.5%) dominate agricultural activities. The highest proportion of household
engaged in agricultural activities is into crop farming (75.8%). Also, 23.6 percent are
engaged in livestock rearing. Tree planting and fish farming are undertaken by less than one
percent of households in agriculture.
9.1.7 Housing conditions
Housing stock
The District has a total of 12,312 houses. This is about 3.6 percent of the total number of
houses in Region.
House ownership
A total of 10,754 (51.3%) dwelling places are owned by household members, 61.4 percent of
them by male headed households and 38.6 percent female headed households.

61
Type of dwelling units
The most common form of dwelling unit used by 55.1 percent of households in the district is
the compound house. The next major type of dwelling unit is the separate house, which
accounts for 30.7 percent of households; 6.4 percent of households dwell in semi-detached
houses while 2.8 percent dwell in huts/buildings (same compound).
Materials for outer walls
The main material for the construction of outer walls in the district is the cement
blocks/concrete constituting 64.5 percent of all materials used for outer walls. Mud
brick/earth, which is the second highest material used for outer walls of dwelling units in the
District constitutes 32.1 percent while metal sheet/slate/asbestos constitutes only 1.5 percent.
Materials for the floor
Main material used for the floors of building cement/concrete (91.7%). Only 6.4 percent of
households in the district dwell in houses in which floors are made of earth/mud.
Materials for roofing
Main material for roofing is corrugated metal sheets (67.9%). Significant proportions of
dwellings (26.5%) also have slate /asbestos roofs. Only 3.1 percent of dwelling houses have
thatch/palm leaf/raffia roofing.
Main source of lighting
The main sources of lighting in the district are electricity (60.8%) and kerosene lamp
(29.9%). Flashlight is also widely used by 7.2 percent of the population as the main source of
lighting.
Source of cooking fuel
The main source of fuel for cooking in the district is wood followed by charcoal. More than
80 percent of households use these two facilities. Wood used by 10,891 households; 29.7
percent of households are urban while 70.3 percent are rural. Another main source of cooking
fuel is charcoal used by 6,989 households, urban households constituting 75.9 percent and
rural households (24.1%). Less than 7 percent of households use gas for cooking.
Cooking space
There are four common types of cooking spaces used by households. These are open space in
compound (30.1%), veranda (21.3%), separate room for exclusive use by household (18.1%),
and structure with roof but without walls (15.0%). Eight percent of households have no
cooking space.
Source of water for drinking
The main sources of water for drinking include pipe-borne outside dwelling (25.6%), public
tap/standpipe (19.1%) and river/stream (17.1%). Proportions of households using other
sources such as bore-hole/pump/tube well, sachet water, unprotected well and
dugout/pond/lake/dam/canal are less than 10 percent.
Bathing facilities
There are three widely-used bathing facilities in the District. The first is shared open bathing
cubicle used by 7,350 households or 35.1 percent of households in the district, 54.4 percent in
62
urban and 45.6 percent in rural areas. The second most important facility is used by 4,968
households and this is shared separate bathroom in the same house and constitutes 23.7
percent of households, 73.9 percent in urban and 26.1 percent in rural areas. The third most
important bathing facility is own bathroom for exclusive use available for 3,171 households
making up 13.5% of households in the district, 27.4 percent in urban and 72.6 percent in rural
areas.
Toilet facilities
Public toilet facilities are the main type of toilet facility used by 32.9 percent of households in
the district; 23.9 percent of households have no toilet facilities and for these households, the
bush/beach/field serves as the most convenient place. Both pit latrine and KVIP are used by
19.7 percent of households. Only 2.6 percent of households have water closet toilet facilities.
Methods of waste disposal
About 68.0 percent of households dispose their solid waste at public dump (open space). Out
of this proportion, 44.5 percent are in urban households while 55.5 percent are rural; 3.1
percent of households in the district, constituted by 89.0 percent of urban and 11.0 percent of
rural households, dispose their solid waste in public dump (container); 14.5 percent of
households dispose their solid waste disposal by burning, of which 67.5 percent are urban
while 32.5 percent are rural. Also, 8.3 percent of households in the district dump waste
indiscriminately, 47.9 percent being urban households and 52.1 rural households.
About 56.5 percent of households dispose liquid waste by throwing onto compound while a
few (0.3% and 1.4%) dispose through the sewage system and through drainage system into
gutters respectively. Four means of liquid waste disposals are used by more urban households
than rural. They are throwing into gutters (84.1%), through sewerage system (72.1%),
throwing onto the street/outsides (69.0%) and through drainage system into a gutter (67.0%).
9.2 Policy Recommendations
Due to the youthful nature of the district’s population and its high fertility concerns, an
intensive sensitization programme on teenage pregnancy and its effects on the child, the
family and the nation at large is required in the District.
Despite the non-existence of many educational institutions in the District, quite a significant
proportion of the population is literate. Generally, the District lacks qualified teachers in the
available schools. This results from the poor welfare available to them. There is therefore the
need for the construction of more educational institutions and accommodation facilities in the
District. Furthermore, the current teachers must be trained to meet the criteria of qualified
teachers to lead to an improvement in the quality of education in the District. Additionally,
the school feeding programme must be extended to more schools to encourage more children
of school going age to enroll in schools.
The District capital is advantageously positioned and needs a facelift to attract investors.
Policy makers must develop the District’s capital to reflect an urban status as it is located
along the main highway connecting Greater Accra and the Central Region. This would reduce
the out-migration of citizens for greener pastures.
Despite the countless benefits derived from ICT in the dissemination and acquisition of
information as well as boosting business transactions, a small proportion of the population in
63
the district has access. Intensive education on the use of ICT ought to be embarked upon to
expand computer ownership and the use of Internet in the District.
The use of wood and charcoal as the main sources of fuel for cooking has implications for the
rapid deforestation in the District. The intermittent shortages of gas and relatively high cost
of the product should be addressed to encourage more households to shift to the use of gas to
help save the environment.
The type of dwelling units, low standard building materials coupled with a high single room
occupancy rate by various households in the district depict relative low income levels of the
rural populace. Government intervention in the development of Awutu Senya District would
greatly increase the socio-economic status of the District.
64
REFERENCES
Progress in New Digital Age. A Ph.D. Thesis Submitted to the Faculty of Graduate School of
Art and Sciences, George University, Washington D.C, Cambridge, United States of
America.
Castells, M, Fernandez-Ardevol,M, Qiu, J.L & Sey, A (2004). The Mobile Communication: A
Cross Cultural Analysis of Available Evidence on the Social Uses of Wireless
Communication Technology. A Research Report Prepared for International Workshop
on Wireless Communication Policies and Prospects at the Annenberg School for
Communication, University of Southern California, Los Angeles.
Geser, H (2004). Towards a Sociological Theory of the Mobile Phone, Retrieved May 12,
2012 from: http//siocio.chmobile/tgeser/pdf
International Telecommunications Union (2012). Key Statistical Highlights: ITU Data
Release June 2012. ITU World Telecommunication/ICT Indicators Database.
Retrieved July, 2012 from http//www.itu.int/ITU/statistics/pdf
National Development Planning Commission (2012). 2011 GSGDA Annual Progress Report.
Government of Ghana, Accra
Seini, A. W. (2002). Agricultural Growth and Competitiveness under Policy Reforms in
Ghana (Technical Publication No. 61). Legon: Univerity of Ghana, Institute of
Statistical, Social and Economic Research (ISSER).

65
APPENDICES
Table A1: Population 3 years and older by sex, disability type and level of education
Total
Highest level of school attended or attending
Sex/ disability
type
Never
attended
Nursery
Kinder-
garten
Pri-
mary
JSS/
JHS
Middle
SSS/
SHS
Secon-
dary
Voc./
Tech/
Comm
Post middle/
secondary
certificate
Post-
secondary
diploma
Bachelor’s
degree
Post graduate
(Cert. Diploma
Masters PHD)
Total
Both Sexes 78,689 18,951 2,723 5,731 22,994 15,723 5,895 3,983 566 622 417 696 333 55
No disability 76,083 17,712 2,686 5,678 22,478 15,461 5,557 3,916 540 597 397 681 326 54
With a disability 2,606 1,239 37 53 516 262 338 67 26 25 20 15 7 1
Sight 893 401 9 15 136 78 177 29 11 12 13 7 5 -
Hearing 350 157 6 14 96 38 29 6 1 - 1 2 - -
Speech 344 183 9 9 72 32 24 7 2 4 - 2 - -
Physical 789 403 6 12 139 70 112 17 11 6 6 4 2 1
Intellectual 540 338 12 8 122 34 18 2 2 1 2 1 - -
Emotional 297 111 5 5 82 42 31 11 4 3 - 3 - -
Other 176 80 2 7 36 21 19 5 1 1 1 3 - -
Male
Both sexes 36,818 5,980 1,285 2,849 10,921 8,015 3,696 2,296 403 328 262 491 242 50
No disability 35,642 5,595 1,266 2,822 10,659 7,858 3,481 2,256 383 312 245 480 236 49
With a disability 1,176 385 19 27 262 157 215 40 20 16 17 11 6 1
Sight 393 108 6 9 64 46 107 15 9 9 11 5 4 -
Hearing 142 45 3 7 44 19 18 2 1 - 1 2 - -
Speech 172 82 3 3 43 20 15 3 1 1 - 1 - -
Physical 354 113 1 6 80 44 75 9 10 5 5 3 2 1
Intellectual 220 113 6 4 59 19 14 1 - 1 2 1 - -
Emotional 145 37 - 2 43 22 27 8 2 1 - 3 - -
Other 81 27 - 3 17 12 12 4 1 1 1 3 - -
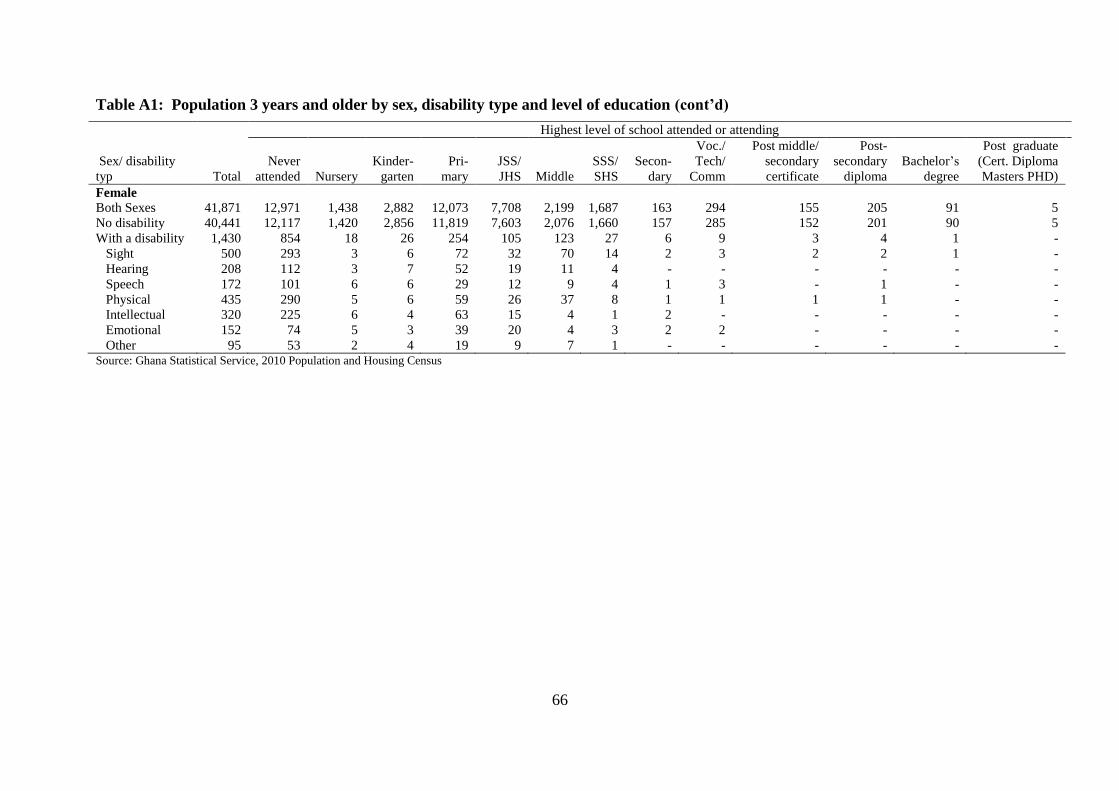
66
Table A1: Population 3 years and older by sex, disability type and level of education (cont’d)
Total
Highest level of school attended or attending
Sex/ disability
typ
Never
attended
Nursery
Kinder-
garten
Pri-
mary
JSS/
JHS
Middle
SSS/
SHS
Secon-
dary
Voc./
Tech/
Comm
Post middle/
secondary
certificate
Post-
secondary
diploma
Bachelor’s
degree
Post graduate
(Cert. Diploma
Masters PHD)
Female
Both Sexes 41,871 12,971 1,438 2,882 12,073 7,708 2,199 1,687 163 294 155 205 91 5
No disability 40,441 12,117 1,420 2,856 11,819 7,603 2,076 1,660 157 285 152 201 90 5
With a disability 1,430 854 18 26 254 105 123 27 6 9 3 4 1 -
Sight 500 293 3 6 72 32 70 14 2 3 2 2 1 -
Hearing 208 112 3 7 52 19 11 4 - - - - - -
Speech 172 101 6 6 29 12 9 4 1 3 - 1 - -
Physical 435 290 5 6 59 26 37 8 1 1 1 1 - -
Intellectual 320 225 6 4 63 15 4 1 2 - - - - -
Emotional 152 74 5 3 39 20 4 3 2 2 - - - -
Other 95 53 2 4 19 9 7 1 - - - - - - Source: Ghana Statistical Service, 2010 Population and Housing Census
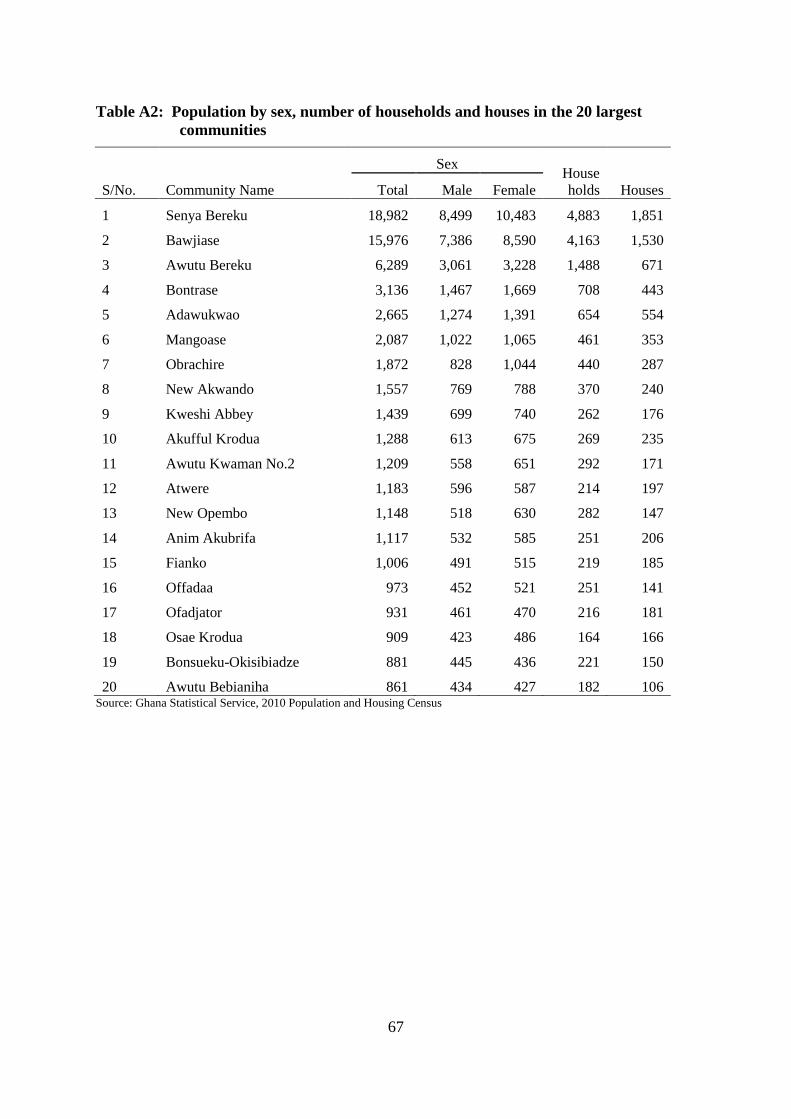
67
Table A2: Population by sex, number of households and houses in the 20 largest
communities
S/No. Community Name
Sex House
holds Houses Total Male Female
1 Senya Bereku 18,982 8,499 10,483 4,883 1,851
2 Bawjiase 15,976 7,386 8,590 4,163 1,530
3 Awutu Bereku 6,289 3,061 3,228 1,488 671
4 Bontrase 3,136 1,467 1,669 708 443
5 Adawukwao 2,665 1,274 1,391 654 554
6 Mangoase 2,087 1,022 1,065 461 353
7 Obrachire 1,872 828 1,044 440 287
8 New Akwando 1,557 769 788 370 240
9 Kweshi Abbey 1,439 699 740 262 176
10 Akufful Krodua 1,288 613 675 269 235
11 Awutu Kwaman No.2 1,209 558 651 292 171
12 Atwere 1,183 596 587 214 197
13 New Opembo 1,148 518 630 282 147
14 Anim Akubrifa 1,117 532 585 251 206
15 Fianko 1,006 491 515 219 185
16 Offadaa 973 452 521 251 141
17 Ofadjator 931 461 470 216 181
18 Osae Krodua 909 423 486 164 166
19 Bonsueku-Okisibiadze 881 445 436 221 150
20 Awutu Bebianiha 861 434 427 182 106 Source: Ghana Statistical Service, 2010 Population and Housing Census

68
Table A3: Population by age group in the 20 largest communities
S/No. Community Name
All
ages
Age Group
0-4 5-9 10-14 15-19 20-24 25-29 30-34 35-39 40-44 45-49 50-54 55-59 60-64 65-69 70-74 75+
1 Senya Bereku 18,982 2,954 2,712 2,422 2,068 1,648 1,263 1,042 937 775 674 609 358 368 299 271 582
2 Bawjiase 15,976 2,355 1,929 1,966 1,798 1,502 1,316 1,071 892 728 574 528 299 307 193 188 330
3 Awutu Bereku 6,289 888 707 718 687 575 634 487 388 325 222 179 138 99 80 60 102
4 Bontrase 3,136 512 419 399 358 235 215 157 167 136 118 129 82 74 31 48 56
5 Adawukwao 2,665 493 366 304 234 249 246 196 164 128 76 69 40 37 23 16 24
6 Mangoase 2,087 314 300 301 216 159 162 128 131 95 76 66 39 30 20 17 33
7 Obrachire 1,872 313 228 215 208 151 135 131 93 98 66 66 42 52 24 18 32
8 New Akwando 1,557 243 220 200 151 141 133 117 100 65 53 53 23 18 11 7 22
9 Kweshi Abbey 1,439 214 190 183 231 152 102 85 78 64 36 36 22 20 4 11 11
10 Akufful Krodua 1,288 209 140 154 154 121 106 72 63 65 46 31 29 42 17 11 28
11 Awutu Kwaman No.2 1,209 201 148 153 122 128 99 72 63 46 49 37 23 28 11 14 15
12 Atwere 1,183 175 184 138 146 109 85 51 68 46 49 39 19 21 14 14 25
13 New Opembo 1,148 157 118 146 128 122 93 92 71 62 46 31 27 19 7 16 13
14 Anim Akubrifa 1,117 179 160 152 111 81 88 60 70 50 39 33 24 28 14 10 18
15 Fianko 1,006 177 123 130 97 67 64 51 56 40 41 40 39 24 12 16 29
16 Offadaa 973 138 160 118 99 48 57 43 50 54 39 36 26 22 15 23 45
17 Ofadjator 931 166 130 110 108 75 59 53 41 41 27 34 10 17 16 17 27
18 Osae Krodua 909 137 111 141 121 95 65 45 24 32 32 32 20 15 11 12 16
19 Bonsueku-Okisibiadze 881 149 128 121 81 69 68 45 62 27 32 26 20 15 8 5 25
20 Awutu Bebianiha 861 141 130 104 87 95 70 54 36 31 33 25 15 19 3 5 13
Source: Ghana Statistical Service, 2010 Population and Housing Census

69
LIST OF CONTRIBUTORS
Project Secretariat
Dr. Philomena Nyarko, Government Statistician
Mr. Baah Wadieh, Deputy Government Statistician
Mr. David Yenukwa Kombat, Acting Census Coordinator
Mr. Sylvester Gyamfi, DISDAP Project Coordinator
Mrs. Abena A. Osei-Akoto, Data Processing
Mr. Rochester Appiah Kubi Boateng, Data Processing
Mrs. Jacqueline Anum, Data Processing
Mrs. Samilia Mintah, Data Processing
Mr. Yaw Misefa, Data Processing
Mr. Ernest Enyan, Data Processing
Mr. Francis Bright Mensah, Regional Statistician
Ms. Hanna Frempong Konadu, Formatting/Typesetting
Ms. Justina Yeboah, Formatting/Typesetting
Writers
Arnold Nartey Narnor
Paul Epkale
Consultant
Dr. Augustine Tanle
Dr. Akwasi Kumi-Kyereme
Editor/ Reviewers
Prof. Kwabena Asomanin Anaman
Mr. Francis Bright Mensah


