AXA IM Framlington Equities How are Automation and Digital Economy companies coping in a crisis? Mark Hargraves – Head of Framlington Global Equities Tom Riley – Portfolio Manager Jeremy Gleeson – Portfolio Manager This document is intended for professional investors only, as defined by local laws and the MIFID directive. Its distribution should be restricted accordingly. It cannot be distributed to private investors, neither in whole nor in part.
Transcript
AXA IM Framlington EquitiesHow are Automation and Digital Economy companies coping in a crisis?Mark Hargraves – Head of Framlington Global EquitiesTom Riley – Portfolio ManagerJeremy Gleeson – Portfolio Manager
This document is intended for professional investors only, as defined by local laws and the MIFID directive. Its distributionshould be restricted accordingly. It cannot be distributed toprivate investors, neither in whole nor in part.
FRAMLINGTON EQUITIES
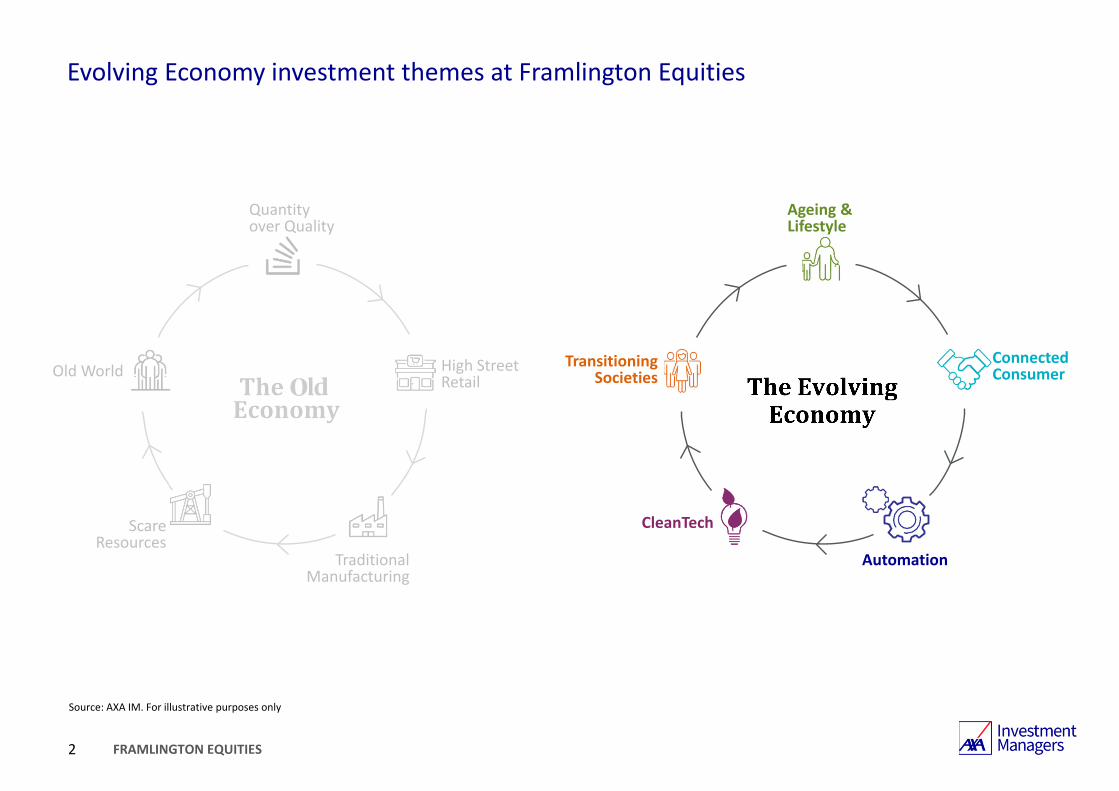
Evolving Economy investment themes at Framlington Equities
1
DEMOGRAPHY
INNOVATION
Middle Class population3.6bn (2018) 5.3bn (2030)
Share of renewable energy**9% (2020) 25% (2030)
Number of Robots2m (2019) 20m (2030)
World population aged 60+1.0bn (2018) 1.4bn (2030)
Number of connected devices30bn (2020) 500bn (2030)
TransitioningSocieties
Ageing & Lifestyle
ConnectedConsumer
CleanTech
Automation
Source: AXA IM, BofAML “Transforming World: The 2020s”, November 2019. BofAML Global Research, UN, Internet World Stats, Cybersecurity Ventures, Cisco, ITU 2015, Kharas, Brookings Institution, Oxford Economics, BNEF 2019 *EB: Exabyte. An exabyte is a unit of digital information storage used to denote the size of data. It is equivalent to 1 billion gigabytes (GB).**Renewable energy: variable renewables.
FRAMLINGTON EQUITIES
Evolving Economy investment themes at Framlington Equities
Source: AXA IM. For illustrative purposes only
2
TransitioningSocieties
Ageing & Lifestyle
ConnectedConsumer
CleanTech
Automation
Old World
Quantity over Quality
High Street Retail
Scare Resources
Traditional Manufacturing
FRAMLINGTON EQUITIES
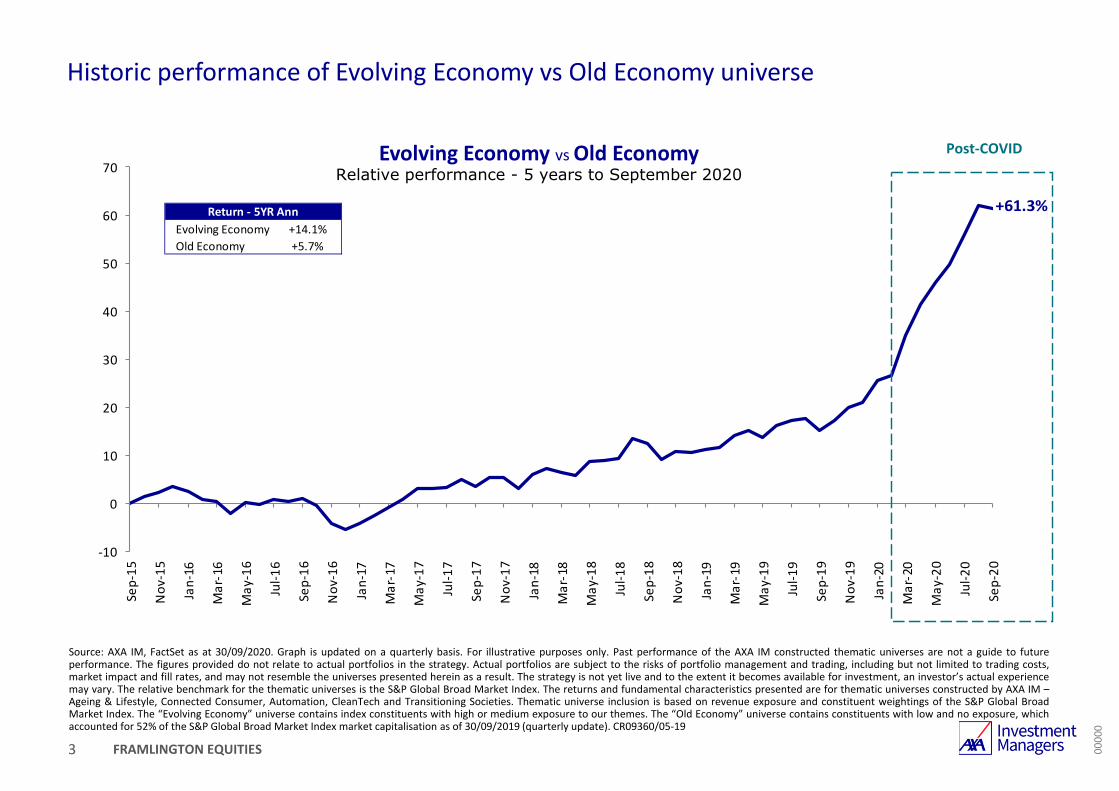
+61.3%
‐10
0
10
20
30
40
50
60
70
Sep‐15
Nov
‐15
Jan‐16
Mar‐16
May
‐16
Jul‐1
6
Sep‐16
Nov
‐16
Jan‐17
Mar‐17
May
‐17
Jul‐1
7
Sep‐17
Nov
‐17
Jan‐18
Mar‐18
May
‐18
Jul‐1
8
Sep‐18
Nov
‐18
Jan‐19
Mar‐19
May
‐19
Jul‐1
9
Sep‐19
Nov
‐19
Jan‐20
Mar‐20
May
‐20
Jul‐2
0
Sep‐20
Historic performance of Evolving Economy vs Old Economy universe
Source: AXA IM, FactSet as at 30/09/2020. Graph is updated on a quarterly basis. For illustrative purposes only. Past performance of the AXA IM constructed thematic universes are not a guide to futureperformance. The figures provided do not relate to actual portfolios in the strategy. Actual portfolios are subject to the risks of portfolio management and trading, including but not limited to trading costs,market impact and fill rates, and may not resemble the universes presented herein as a result. The strategy is not yet live and to the extent it becomes available for investment, an investor’s actual experiencemay vary. The relative benchmark for the thematic universes is the S&P Global Broad Market Index. The returns and fundamental characteristics presented are for thematic universes constructed by AXA IM –Ageing & Lifestyle, Connected Consumer, Automation, CleanTech and Transitioning Societies. Thematic universe inclusion is based on revenue exposure and constituent weightings of the S&P Global BroadMarket Index. The “Evolving Economy” universe contains index constituents with high or medium exposure to our themes. The “Old Economy” universe contains constituents with low and no exposure, whichaccounted for 52% of the S&P Global Broad Market Index market capitalisation as of 30/09/2019 (quarterly update). CR09360/05‐19
3
Evolving Economy vsOld EconomyRelative performance - 5 years to September 2020
Quarterly review • Quarterly medium‐term view on the 5 themes
Consistent portfolio construction• Typically 40‐60 names• Low turnover typically <30%• High active share typically >80%
• No tracking error limit• Risk well diversified• Theme purity typically >70% in high & medium exposure stocks
00000
Source: AXA IM as at 31/10/2020. AXA IM reserves the right to modify any of the procedures, process and controls described herein at its discretion. Diversification does not ensure a profit or protection against a loss.
FRAMLINGTON EQUITIES
Evolving Economy investment strategies at Framlington Equities
Source: FactSet as at 31/10/2020. For illustrative purposes only.
5
Emerging Markets strategyAUM: c. $380m
Longevity Economy strategyAUM: c.$310m
Digital Economy strategyAUM: c.$860m
Clean Economy strategyAUM: c.$230m
Robotech strategyAUM: c.$3.6bn
Evolving Trends strategyAUM: c.$460m
FinTech strategyAUM: c.$730m
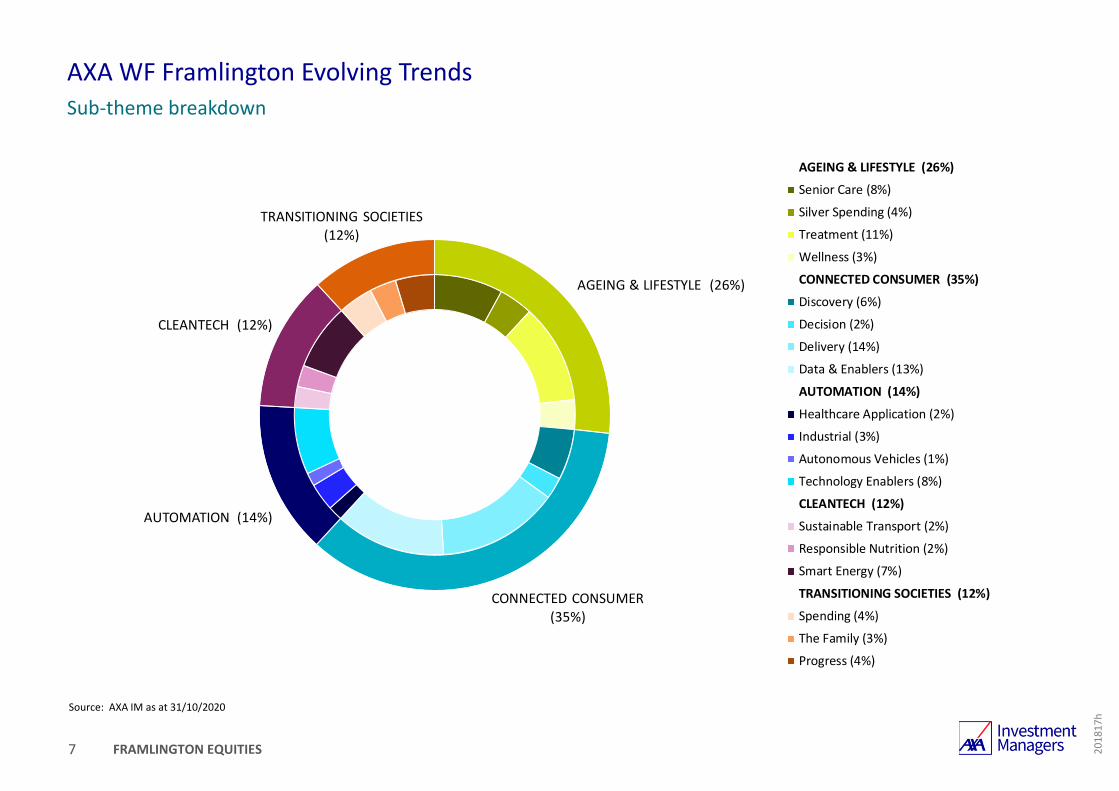
AXA WF Framlington Evolving Trends
FRAMLINGTON EQUITIES
Source: AXA IM as at 31/10/2020
7 201817h
AXA WF Framlington Evolving TrendsSub‐theme breakdown
AGEING & LIFESTYLE (26%)
CONNECTED CONSUMER (35%)
AUTOMATION (14%)
CLEANTECH (12%)
TRANSITIONING SOCIETIES (12%)
AGEING & LIFESTYLE (26%)
Senior Care (8%)
Silver Spending (4%)
Treatment (11%)
Wellness (3%)
CONNECTED CONSUMER (35%)
Discovery (6%)
Decision (2%)
Delivery (14%)
Data & Enablers (13%)
AUTOMATION (14%)
Healthcare Application (2%)
Industrial (3%)
Autonomous Vehicles (1%)
Technology Enablers (8%)
CLEANTECH (12%)
Sustainable Transport (2%)
Responsible Nutrition (2%)
Smart Energy (7%)
TRANSITIONING SOCIETIES (12%)
Spending (4%)
The Family (3%)
Progress (4%)
FRAMLINGTON EQUITIES
AXA WF Framlington Evolving TrendsTop 15 holdings and market cap breakdown
Source: AXA IM as at 31/10/2020.
8
Market cap typically >500m USD
Breakdown by market capitalisation (in USD)
201817h
AWF Evolving TrendsMSCI ACWI
Top 15 holdings
% CountryMkt cap($bn)
Theme Sub‐Theme
1 Alibaba Group Holding 4.1 China 818 Transitioning Societies Spending
2 ServiceNow 3.2 United States 97 Connected Consumer Data & Enablers
3 Qualcomm 3.1 United States 139 Automation Technology Enablers
4 Kingspan Group 3.0 Ireland 16 Cleantech Smart Energy
Source: FactSet SPAR as at 31/10/2020. Basis: I USD Acc Share Class Total Return net Annual Management Fee, MSCI All Country World Net Return in USD. *Reshaping of the portfolio from a Global strategy into a Global Thematics strategy = 31/10/2017. Please note that not all share classes might be registred or available in your jurisdiction. Please check availability with your Financial Adviser Past performance is not a guide to future performance.
5 years cumulative performance to 31/10/2020 – Net in USD
201817h
10
Reshaping of portfolio intoGlobal Thematics strategy*
82.9%
47.7%
Performance ‐ USD YTD 1YSince
Reshaping (31/10/2017)
3Y 5YSince
Reshaping (31/10/2017)
3Y 5Y
AXA WF Framlington Evolving Trends I USD ‐ Gross 17.9 27.7 50.9 50.9 90.4 14.7 14.7 13.7AXA WF Framlington Evolving Trends I USD ‐ Net 17.1 26.6 47.3 47.3 82.9 13.8 13.8 12.8MSCI AC World NR ‐1.1 4.9 17.5 17.5 47.7 5.5 5.5 8.1Net Relative 18.2 21.8 29.8 29.8 35.2 8.2 8.2 4.7
Cumulative Annualised
FRAMLINGTON EQUITIES
1 2 3 4 5 6 7
AXA WF Framlington Evolving Trends
11
Potentially lower risk Potentially higher reward
Lower risk Higher risk
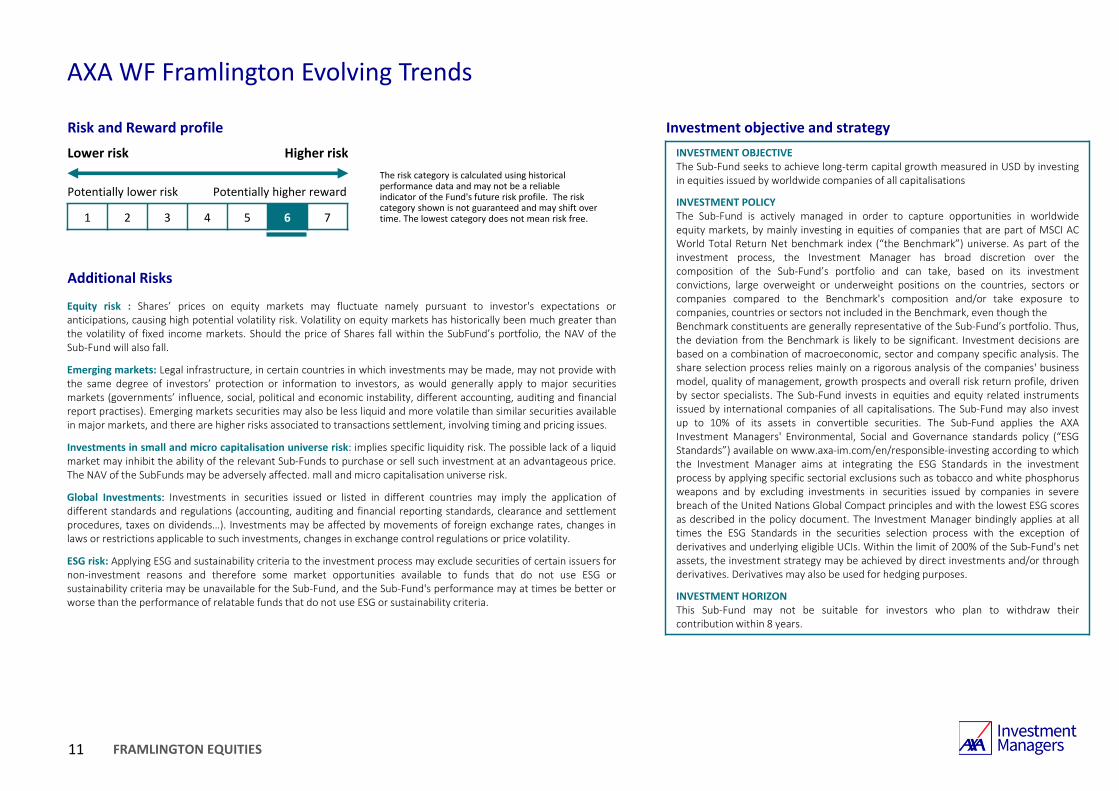
Risk and Reward profile
The risk category is calculated using historical performance data and may not be a reliable indicator of the Fund's future risk profile. The risk category shown is not guaranteed and may shift over time. The lowest category does not mean risk free.
Equity risk : Shares’ prices on equity markets may fluctuate namely pursuant to investor's expectations oranticipations, causing high potential volatility risk. Volatility on equity markets has historically been much greater thanthe volatility of fixed income markets. Should the price of Shares fall within the SubFund’s portfolio, the NAV of theSub‐Fund will also fall.
Emerging markets: Legal infrastructure, in certain countries in which investments may be made, may not provide withthe same degree of investors’ protection or information to investors, as would generally apply to major securitiesmarkets (governments’ influence, social, political and economic instability, different accounting, auditing and financialreport practises). Emerging markets securities may also be less liquid and more volatile than similar securities availablein major markets, and there are higher risks associated to transactions settlement, involving timing and pricing issues.
Investments in small and micro capitalisation universe risk: implies specific liquidity risk. The possible lack of a liquidmarket may inhibit the ability of the relevant Sub‐Funds to purchase or sell such investment at an advantageous price.The NAV of the SubFunds may be adversely affected. mall and micro capitalisation universe risk.
Global Investments: Investments in securities issued or listed in different countries may imply the application ofdifferent standards and regulations (accounting, auditing and financial reporting standards, clearance and settlementprocedures, taxes on dividends…). Investments may be affected by movements of foreign exchange rates, changes inlaws or restrictions applicable to such investments, changes in exchange control regulations or price volatility.
ESG risk: Applying ESG and sustainability criteria to the investment process may exclude securities of certain issuers fornon‐investment reasons and therefore some market opportunities available to funds that do not use ESG orsustainability criteria may be unavailable for the Sub‐Fund, and the Sub‐Fund's performance may at times be better orworse than the performance of relatable funds that do not use ESG or sustainability criteria.
INVESTMENT OBJECTIVEThe Sub‐Fund seeks to achieve long‐term capital growth measured in USD by investingin equities issued by worldwide companies of all capitalisations
INVESTMENT POLICYThe Sub‐Fund is actively managed in order to capture opportunities in worldwideequity markets, by mainly investing in equities of companies that are part of MSCI ACWorld Total Return Net benchmark index (“the Benchmark”) universe. As part of theinvestment process, the Investment Manager has broad discretion over thecomposition of the Sub‐Fund’s portfolio and can take, based on its investmentconvictions, large overweight or underweight positions on the countries, sectors orcompanies compared to the Benchmark's composition and/or take exposure tocompanies, countries or sectors not included in the Benchmark, even though theBenchmark constituents are generally representative of the Sub‐Fund’s portfolio. Thus,the deviation from the Benchmark is likely to be significant. Investment decisions arebased on a combination of macroeconomic, sector and company specific analysis. Theshare selection process relies mainly on a rigorous analysis of the companies' businessmodel, quality of management, growth prospects and overall risk return profile, drivenby sector specialists. The Sub‐Fund invests in equities and equity related instrumentsissued by international companies of all capitalisations. The Sub‐Fund may also investup to 10% of its assets in convertible securities. The Sub‐Fund applies the AXAInvestment Managers' Environmental, Social and Governance standards policy (“ESGStandards”) available on www.axa‐im.com/en/responsible‐investing according to whichthe Investment Manager aims at integrating the ESG Standards in the investmentprocess by applying specific sectorial exclusions such as tobacco and white phosphorusweapons and by excluding investments in securities issued by companies in severebreach of the United Nations Global Compact principles and with the lowest ESG scoresas described in the policy document. The Investment Manager bindingly applies at alltimes the ESG Standards in the securities selection process with the exception ofderivatives and underlying eligible UCIs. Within the limit of 200% of the Sub‐Fund's netassets, the investment strategy may be achieved by direct investments and/or throughderivatives. Derivatives may also be used for hedging purposes.
INVESTMENT HORIZONThis Sub‐Fund may not be suitable for investors who plan to withdraw theircontribution within 8 years.
Investment objective and strategy
Additional Risks
FRAMLINGTON EQUITIES
Focus on AUTOMATION and CONNECTED CONSUMER themes
12
ConnectedConsumer
Automation
Source: AXA IM for illustrative purpose only
DEMOGRAPHY
AXA WF Framlington ROBOTECH
AXA WF Framlington DIGITAL ECONOMY
INNOVATION
Focus on…
AXA WF Framlington RobotechTom Riley – Portfolio Manager
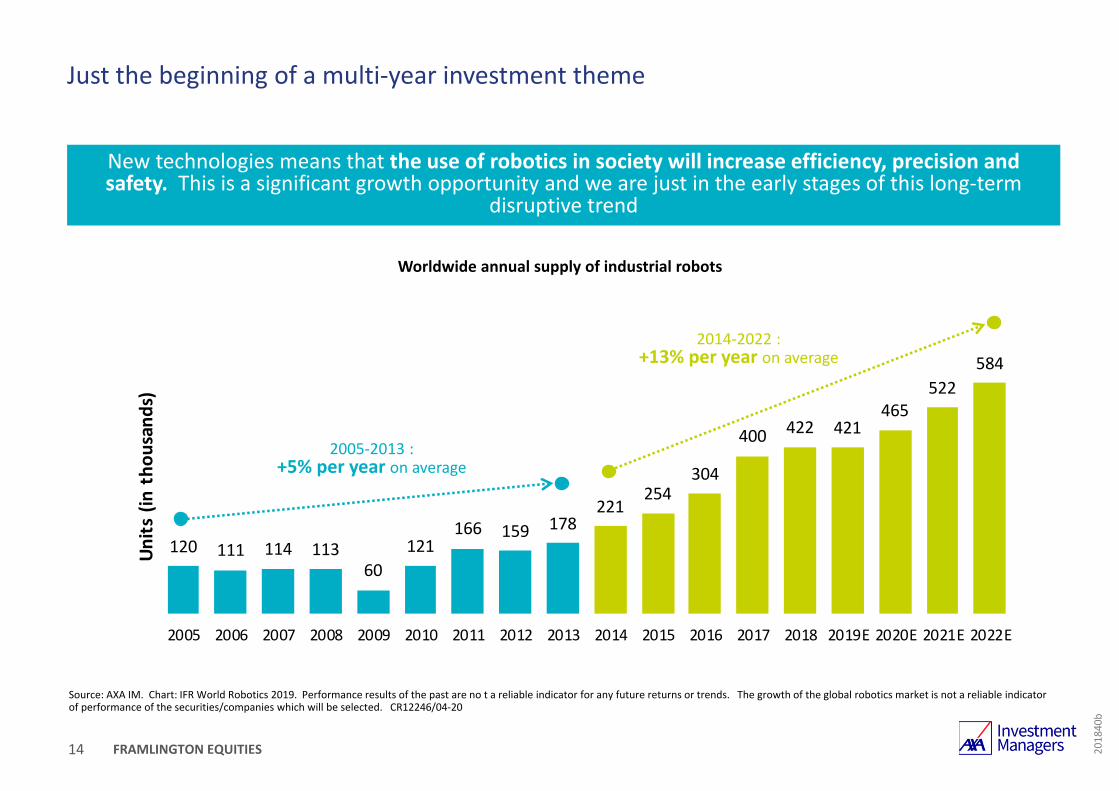
Just the beginning of a multi‐year investment theme
Source: AXA IM. Chart: IFR World Robotics 2019. Performance results of the past are no t a reliable indicator for any future returns or trends. The growth of the global robotics market is not a reliable indicator of performance of the securities/companies which will be selected. CR12246/04‐20
14
Worldwide annual supply of industrial robots
2005‐2013 :+5% per year on average
2014‐2022 :+13% per year on average
New technologies means that the use of robotics in society will increase efficiency, precision and safety. This is a significant growth opportunity and we are just in the early stages of this long‐term
disruptive trend
201840b
FRAMLINGTON EQUITIES
710
322 308
200
97
0
100
200
300
400
500
600
700
800
Rep. of Korea Germany Japan USA China
Robo
t density per 10,00
0 workers
0
5
10
15
20
1995 2000 2005 2010 2015 2020 2025
Fast growth trend supported by shifting demographics & technology
Source: Top LH Chart: BofA Merrill Lynch Thematic Investing, Robot Revolution ‐ Global Robot & AI Primer (November 2015), Oxford Economics. Bottom LH Chart: Berenberg research, United Nations World Population Prospects (2015). Top RH Chart: ABB, Economic Justification for Industrial Robotic Systems, 2007; International Federation of Robotics, World Robots; expert. Bottom RH Chart: IFR 2018. For illustrative purposes only. Performance results of the past are no indicator for any future returns or trends. The above represents our current market views only and does not constitute investment advice. CR12246/04‐20
15
Labour costs are rising …Evolution of China’s labour costs (US$/hr)
Working population are contracting … (eg Baby boomers retiring, falling fertility rates) ‐ China & Japan Working population
0
20
40
60
80
100
0
200
400
600
800
1 000
1 200
1950 1970 1990 2010 2030e 2050e
China (LHS)Japan (25 year lag; RHS)
Chi
na W
orki
ng P
opul
atio
n (m
) Japan Working Population (m
)
… & there is a huge potential for further Robotics adoptionRobot density per 10,000 workers
Average robot density world: 85
China the largest Robotic buyer is still
considerably lagging
Robot sales still growing in leading car manufacturing countries
… while Robots are cheaper & more flexibleTotal costs (US$ ‘000) of spot welding robot in US automotive industry
182
155
133117
103
down 22% in 2014‐2025E
0
50
100
150
200
250
2005 2010 2014 2020E 2025E
Costs (no
minal US$
'000
)
Project managementSystem engineering (such as programming, installation)Peripherals (such as safety barriers, sensors)Robot (including software)
201840b
12% annual growth since 2000
FRAMLINGTON EQUITIES
• The intelligence that powers and controls robotics ‐the sensors, connectivity & intelligence used to gather and analyse information
Software
Key themes
Source: AXA IM. For illustrative purposes only.
16
• Increased precision & flexibility create new opportunities in industries outside of automotive
• Wage inflation and demographics in EM causing manufacturers to rethink existing processes
201840b
INDUSTRIAL
Industrial Automation Equipment
Robotics
Logistics
• Huge focus on vehicle safety, prompted by increased regulation and consumer demand
• Pathway towards Autonomous Vehicles
TRANSPORTATION
Autonomous vehicles
• Robotic surgery & Remote Healthcare seeing new applications
• Aging society drives need for cheaper ways of administering care
HEALTHCARE
Digital Healthcare
Robotic Surgery
TECHNOLOGY ENABLERS
Semiconductors Component & Vision Systems
FRAMLINGTON EQUITIES
AXA WF Framlington RobotechSub‐theme breakdown
Source: AXA IM as at 31/10/2020.
17
201819k
14%
9%
8%
5%
9%10%
17%
21%
6%
INDUSTRIAL31%
TRANSPORTATION5%
HEALTHCARE APPLICATION18%
TECHNOLOGY ENABLERS
44%
Robotics (14%)
Logistics (9%)
Industrial Automation Equipment (8%)
Autonomous Vehicles (5%)
Robotic Surgery (9%)
Digital Healthcare (10%)
Software (17%)
Semiconductors (21%)
Components & Vision systems (6%)
FRAMLINGTON EQUITIES
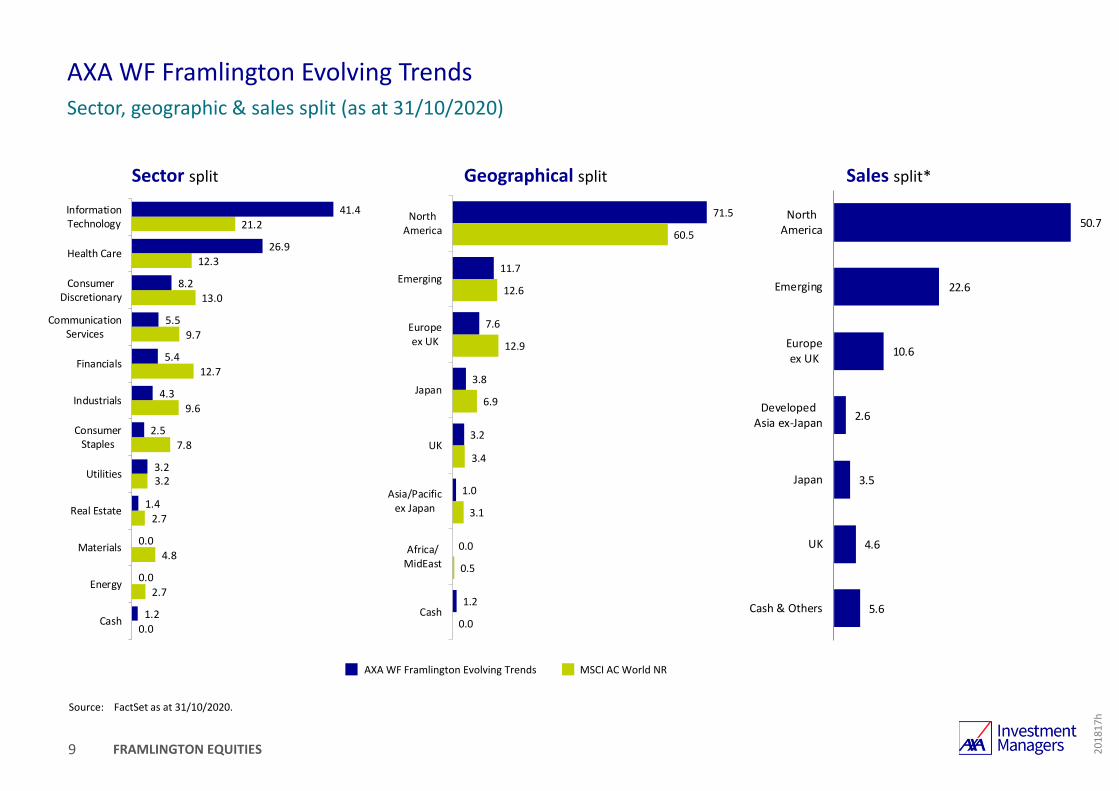
AXA WF Framlington RobotechSector, geographic & regional sales split
Source: AXA IM as at 31/10/2020.
AXA WF Framlington Robotech MSCI All Country World
AXA WF Framlington RobotechTop 15 holdings and market cap breakdown (as at 31/10/2020)
Source: AXA IM as at 31/10/2020.
19
Breakdown by market capitalisation (in USD)
Market cap typically >500m USD
Mega Cap => 100bn USD Mid Cap 5‐25bn USD
Large Cap 25‐100bn USD Small Cap 0‐5bn USD
201840b
AXA WF Framlington Robotech
MSCI AC World
Top 15 holdings Fund % Country Sector
Keyence Corporation 3.6 Japan Information Technology
QUALCOMM Incorporated 3.3 United States Information Technology
Intuitive Surgical, Inc. 3.1 United States Health Care
Alphabet Inc. 3.1 United States Communication Services
Amazon.com, Inc. 3.1 United States Consumer Discretionary
Teradyne, Inc. 2.8 United States Information Technology
Taiwan Semiconductor Ma 2.7 Taiwan Information Technology
Thermo Fisher Scientific Inc 2.7 United States Health Care
Autodesk, Inc. 2.6 United States Information Technology
NVIDIA Corporation 2.5 United States Information Technology
PTC Inc. 2.4 United States Information Technology
IPG Photonics Corporation 2.3 United States Information Technology
DexCom, Inc. 2.2 United States Health Care
Cadence Design Systems, In 2.2 United States Information Technology
Apple Inc. 2.1 United States Information Technology
Total 40.5
Number of Stocks 56
10%
29%
34%
26%
2%
22%
33%
42%
Small Mid Cap Large Cap Mega Cap
FRAMLINGTON EQUITIES
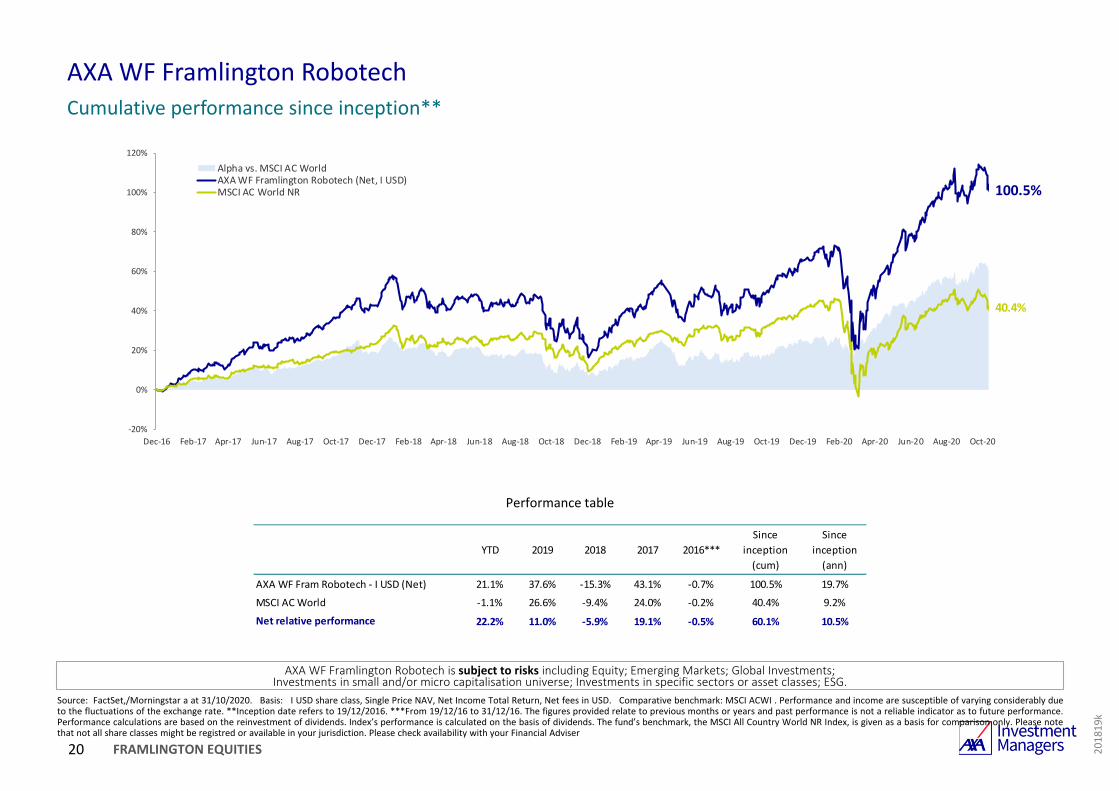
AXA WF Framlington RobotechCumulative performance since inception**
20 201819k
Source: FactSet,/Morningstar a at 31/10/2020. Basis: I USD share class, Single Price NAV, Net Income Total Return, Net fees in USD. Comparative benchmark: MSCI ACWI . Performance and income are susceptible of varying considerably dueto the fluctuations of the exchange rate. **Inception date refers to 19/12/2016. ***From 19/12/16 to 31/12/16. The figures provided relate to previous months or years and past performance is not a reliable indicator as to future performance.Performance calculations are based on the reinvestment of dividends. Index’s performance is calculated on the basis of dividends. The fund’s benchmark, the MSCI All Country World NR Index, is given as a basis for comparison only. Please notethat not all share classes might be registred or available in your jurisdiction. Please check availability with your Financial Adviser
Performance table
AXA WF Framlington Robotech is subject to risks including Equity; Emerging Markets; Global Investments; Investments in small and/or micro capitalisation universe; Investments in specific sectors or asset classes; ESG.
Alpha vs. MSCI AC WorldAXA WF Framlington Robotech (Net, I USD)MSCI AC World NR 100.5%
40.4%
YTD 2019 2018 2017 2016***Since
inception (cum)
Since inception (ann)
AXA WF Fram Robotech ‐ I USD (Net) 21.1% 37.6% ‐15.3% 43.1% ‐0.7% 100.5% 19.7%
MSCI AC World ‐1.1% 26.6% ‐9.4% 24.0% ‐0.2% 40.4% 9.2%
Net relative performance 22.2% 11.0% ‐5.9% 19.1% ‐0.5% 60.1% 10.5%
FRAMLINGTON EQUITIES
1 2 3 4 5 6 7
AXA WF Framlington Robotech
21
Potentially lower risk Potentially higher reward
Lower risk Higher risk
Risk and Reward profile
The risk category is calculated using historical performance data and may not be a reliable indicator of the Fund's future risk profile. The risk category shown is not guaranteed and may shift over time. The lowest category does not mean risk free.
Equity risk : Shares’ prices on equity markets may fluctuate namely pursuant to investor's expectations oranticipations, causing high potential volatility risk. Volatility on equity markets has historically been much greater thanthe volatility of fixed income markets. Should the price of Shares fall within the SubFund’s portfolio, the NAV of theSub‐Fund will also fall.
Emerging markets: Legal infrastructure, in certain countries in which investments may be made, may not provide withthe same degree of investors’ protection or information to investors, as would generally apply to major securitiesmarkets (governments’ influence, social, political and economic instability, different accounting, auditing and financialreport practises). Emerging markets securities may also be less liquid and more volatile than similar securities availablein major markets, and there are higher risks associated to transactions settlement, involving timing and pricing issues.
Investments in specific sectors or asset classes risk: Certain Sub‐Funds concentrate their investments in certain assetclasses (commodities, real estate) or in companies of certain sectors of the economy (such as health care, consumerstaples and services, telecommunications or real estate) and are therefore subject to the risks associated withconcentrating investments in such classes and sectors. This type of strategy may lead to adverse consequences whensuch asset classes or sectors become less valued or less liquid.
Global Investments: Investments in securities issued or listed in different countries may imply the application ofdifferent standards and regulations (accounting, auditing and financial reporting standards, clearance and settlementprocedures, taxes on dividends…). Investments may be affected by movements of foreign exchange rates, changes inlaws or restrictions applicable to such investments, changes in exchange control regulations or price volatility.
Investments in small and micro capitalisation universe risk: implies specific liquidity risk. The possible lack of a liquidmarket may inhibit the ability of the relevant Sub‐Funds to purchase or sell such investment at an advantageous price.The NAV of the SubFunds may be adversely affected. mall and micro capitalisation universe risk.
ESG risk: Applying ESG and sustainability criteria to the investment process may exclude securities of certain issuers fornon‐investment reasons and therefore some market opportunities available to funds that do not use ESG orsustainability criteria may be unavailable for the Sub‐Fund, and the Sub‐Fund's performance may at times be better orworse than the performance of relatable funds that do not use ESG or sustainability criteria.
INVESTMENT OBJECTIVEThe Sub‐Fund seeks to provide long‐term capital growth, measured in USD, from aportfolio of listed equity and equity related securities.
INVESTMENT POLICYThe Sub‐Fund is actively managed and references MSCI AC World Total Return Net (the“Benchmark”) for comparative purposes only. The Investment Manager has fulldiscretion over the composition of the portfolio of the SubFund and can take exposureto companies, countries or sectors not included in the Benchmark. There are norestrictions on the extent to which the SubFund's portfolio and performance maydeviate from the ones of the Benchmark. The Sub‐Fund will seek to achieve itsobjectives by investing at least twothirds of its total net assets in equities and equity‐related instruments issued by all capcompanies worldwide which operate within the growing theme relating to robotic androbotic related technology. Investment decisions are based on a combination ofmacroeconomic, sector and company specific analysis. Target companies will be activein industrial robotics, and also transport, healthcare, semiconductors, software andother robotics related technology. The Investment Manager will select candidates fromsuch target companies with strong management teams and which are expected toachieve a significant positive impact on their financial results on a mid to long termbasis from the design, production and use of robotics technology in their respectivebusiness areas. There is no predetermined geographical asset allocation and the Sub‐Fund may invest its nets assets in both developed and emerging markets. The Sub‐Fundmay also invest in Money Market Instruments. The Sub‐Fund applies the AXAInvestment Managers' Environmental, Social and Governance standards policy (“ESGStandards”) available on www.axa‐im.com/en/responsible‐investing according to whichthe Investment Manager aims at integrating the ESG Standards in the investmentprocess by applying specific sectorial exclusions such as tobacco and white phosphorusweapons and by excluding investments in securities issued by companies in severebreach of the United Nations Global Compact principles and with the lowest ESG scoresas described in the policy document. The Investment Manager bindingly applies at alltimes the ESG Standards in the securities selection process with the exception ofderivatives and underlying eligible UCIs. Within a limit of 200% of the Sub‐Fund's netassets, the investment strategy may be achieved by direct investments and/or throughderivatives. Derivatives may also be used for hedging purposes.
INVESTMENT HORIZONThis Sub‐Fund may not be suitable for investors who plan to withdraw theircontribution within 8 years.
Investment objective and strategy
Additional Risks
FRAMLINGTON EQUITIES
YTD 2019 2018 2017 2016 2015***Since
inception (cum)
Since inception (ann)
AXA IM Robotech strategy 20.3% 37.3% ‐16.1% 41.0% 10.7% 2.7% 122.2% 17.7%MSCI AC World 0.2% 27.2% ‐10.1% 24.0% 7.2% ‐0.6% 51.4% 8.8%Net relative performance 20.1% 10.1% ‐6.0% 17.0% 3.6% 3.3% 70.8% 8.9%
AXA IM Robotech Strategy*Performance since inception (08/12/2015) in USD
Source: Morningstar as at 31/10/2020. The figures provided relate to previous months or years and past performance is not a reliable indicator as to future performance. *AXA IM Global Robot Technology Equity Mother Fund (dedicatedmandate) is the representative account of the strategy for illustration purposes. Basis: NAV, Net income reinvested, net of fees in USD. Performance calculations are based on the reinvestment of dividends. Index’s performance is calculatedon the basis of dividends. The strategy does not have a reference index. The strategy’s performance indicator, the MSCI All Country World NR Index, is given as a basis for comparison only. (1) There is no guarantee that the strategy willachieve its goals. Since it is a Japanese investment vehicle, the daily NAV of the Robotech strategy is struck at the close of business Tokyo time (before European and US markets have opened). As such, to compare our Robotech Strategy inproper condition, we have lagged by one day the MSCI ACWI as they are calculated at close of business in US. **Merger and Acquisition. ***Cumulative performance from inception (08/12/15) to 31/12/2015.
United State eCommerce penetration (% of total retail sales)
Pre‐pandemic22% (2023E)
FRAMLINGTON EQUITIES
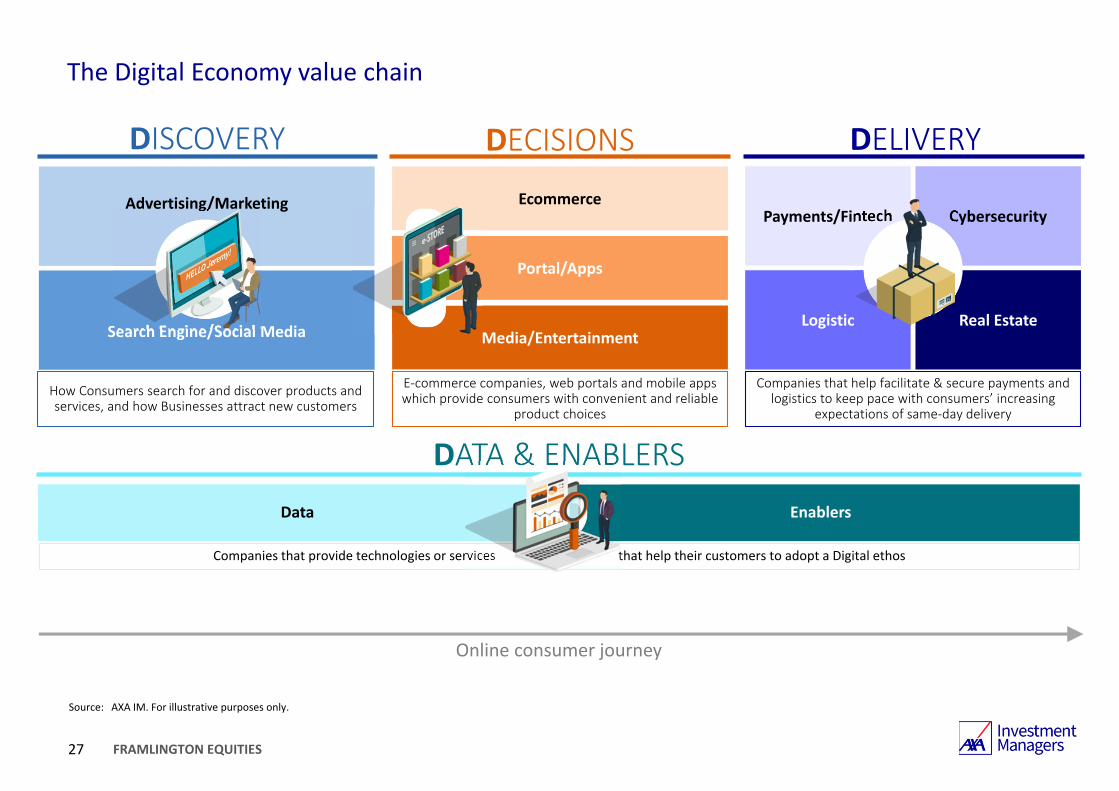
The Digital Economy value chain
Source: AXA IM. For illustrative purposes only.
27
DELIVERYDECISIONSDISCOVERY
Search Engine/Social Media
Advertising/Marketing
Data
DATA & ENABLERSEnablers
Online consumer journey
Payments/Fintech Cybersecurity
Logistic Real EstateMedia/Entertainment
Ecommerce
Portal/Apps
How Consumers search for and discover products and services, and how Businesses attract new customers
E‐commerce companies, web portals and mobile apps which provide consumers with convenient and reliable
product choices
Companies that provide technologies or services that help their customers to adopt a Digital ethos
Companies that help facilitate & secure payments and logistics to keep pace with consumers’ increasing
expectations of same‐day delivery
FRAMLINGTON EQUITIES
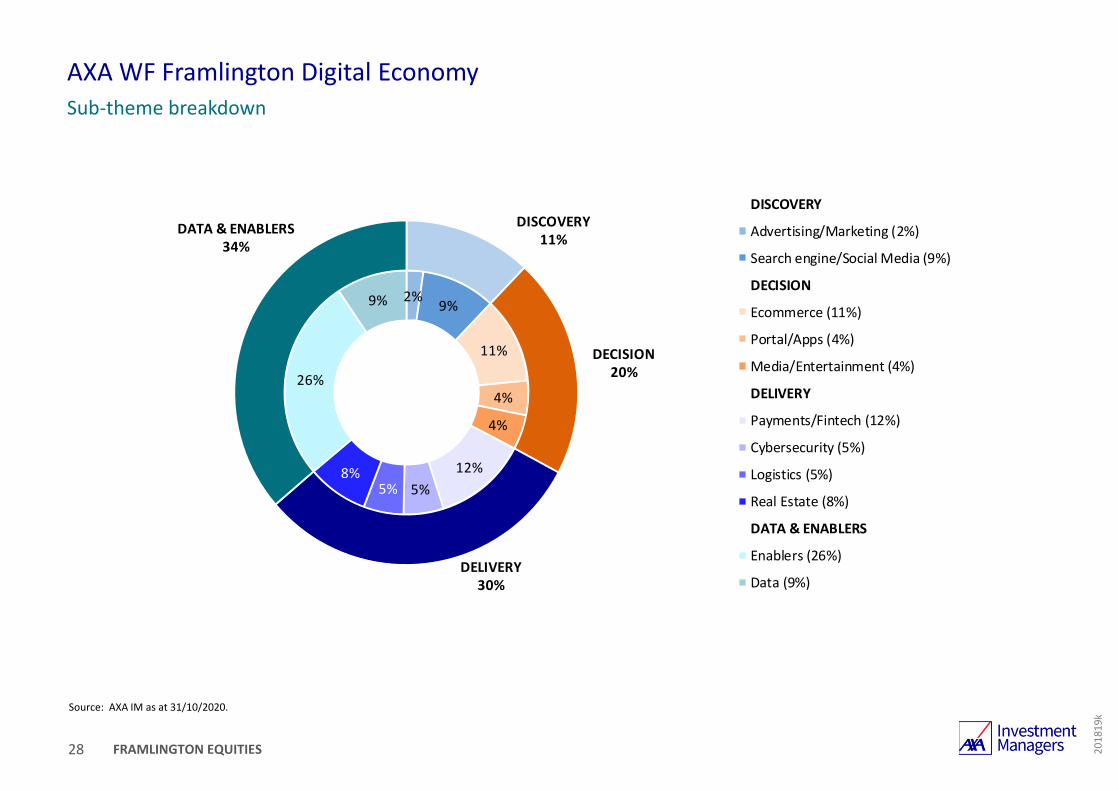
AXA WF Framlington Digital EconomySub‐theme breakdown
Source: AXA IM as at 31/10/2020.
28
201819k
2% 9%
11%
4%
4%
12%5%5%
8%
26%
9%
DISCOVERY11%
DECISION20%
DELIVERY30%
DATA & ENABLERS34%
DISCOVERY
Advertising/Marketing (2%)
Search engine/Social Media (9%)
DECISION
Ecommerce (11%)
Portal/Apps (4%)
Media/Entertainment (4%)
DELIVERY
Payments/Fintech (12%)
Cybersecurity (5%)
Logistics (5%)
Real Estate (8%)
DATA & ENABLERS
Enablers (26%)
Data (9%)
FRAMLINGTON EQUITIES
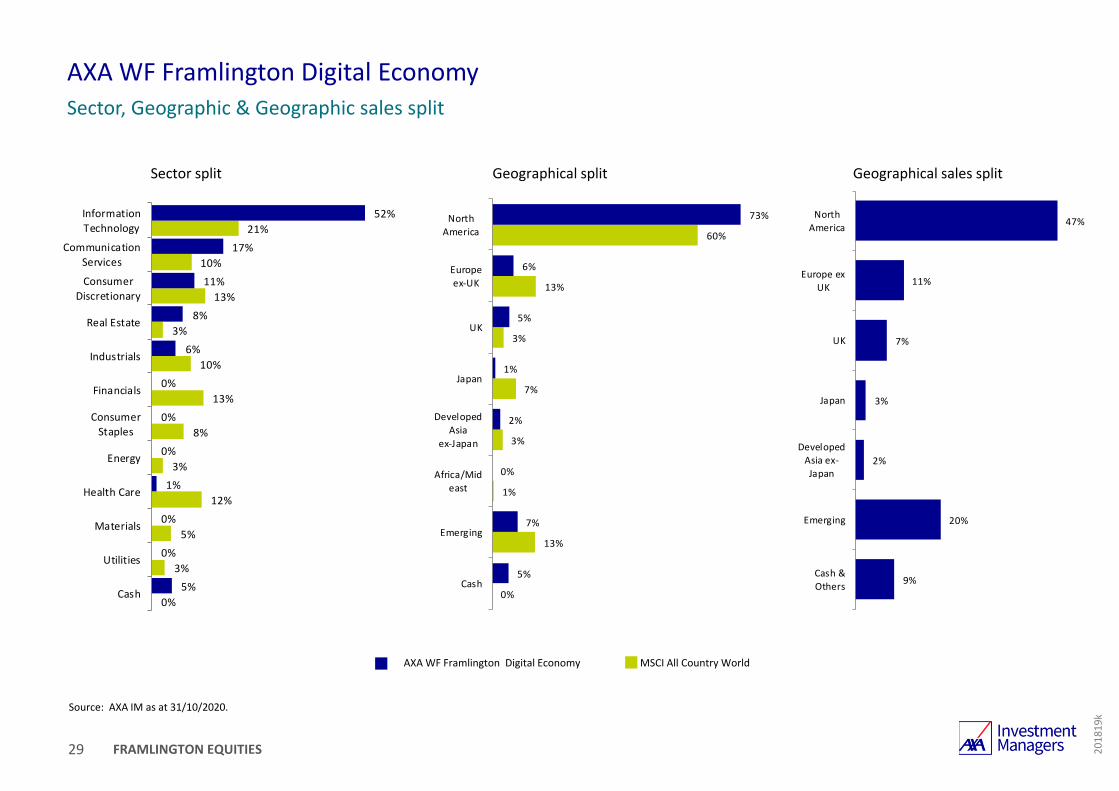
AXA WF Framlington Digital EconomySector, Geographic & Geographic sales split
Source: AXA IM as at 31/10/2020.
29
Geographical split Geographical sales split
AXA WF Framlington Digital Economy MSCI All Country World
201819k
Sector split
0%
3%
5%
12%
3%
8%
13%
10%
3%
13%
10%
21%
5%
0%
0%
1%
0%
0%
0%
6%
8%
11%
17%
52%
Cash
Utilities
Materials
Health Care
Energy
ConsumerStaples
Financials
Industrials
Real Estate
ConsumerDiscretionary
CommunicationServices
InformationTechnology
0%
13%
1%
3%
7%
3%
13%
60%
5%
7%
0%
2%
1%
5%
6%
73%
Cash
Emerging
Africa/Mideast
DevelopedAsia
ex‐Japan
Japan
UK
Europeex‐UK
NorthAmerica
9%
20%
2%
3%
7%
11%
47%
Cash &Others
Emerging
DevelopedAsia ex‐Japan
Japan
UK
Europe exUK
NorthAmerica
FRAMLINGTON EQUITIES
2%
22%
33%
42%
6%
32%
24%
37%
Small Cap(0‐5bn USD)
Mid Cap(5‐25bn USD)
Large Cap(25‐100bn USD)
Mega Cap(>100bn USD)
Top 15 holdings Fund % Country Mkt cap Theme Sub‐Theme
1 Alphabet 3.1 US $1095 bn Discovery Search Engine/Social Media
2 salesforce com 3.1 US $211 bn Data & Enablers Data
3 Alibaba Group Holding 3.1 China $818 bn Decision Ecommerce
4 Tencent Holdings 3.0 China $730 bn Discovery Search Engine/Social Media
5 Prologis Inc 3.0 US $73 bn Delivery Real Estate
6 PayPal Hldgs 3.0 US $218 bn Delivery Payments/Fintech
7 Amazon com 3.0 US $1521 bn Decision Ecommerce
8 Zendesk 2.8 US $13 bn Data & Enablers Enablers
9 Visa 2.7 US $387 bn Delivery Payments/Fintech
10 ServiceNow 2.6 US $97 bn Data & Enablers Enablers
11 Apple 2.6 US $1851 bn Delivery Payments/Fintech
12 Microsoft 2.6 US $1531 bn Data & Enablers Data
13 Facebook 2.4 US $749 bn Discovery Search Engine/Social Media
14 Five9 2.4 US $10 bn Data & Enablers Enablers
15 Goodman Group 2.4 Australia $24 bn Delivery Real Estate
Total 41.9
Number of Stocks 60
AXA WF Framlington Digital EconomyTop 15 holdings and market cap breakdown
Source: AXA IM as at 31/10/2020.
30
Breakdown by market capitalisation (in USD)
Market cap typically >500m USD
201819k
FRAMLINGTON EQUITIES
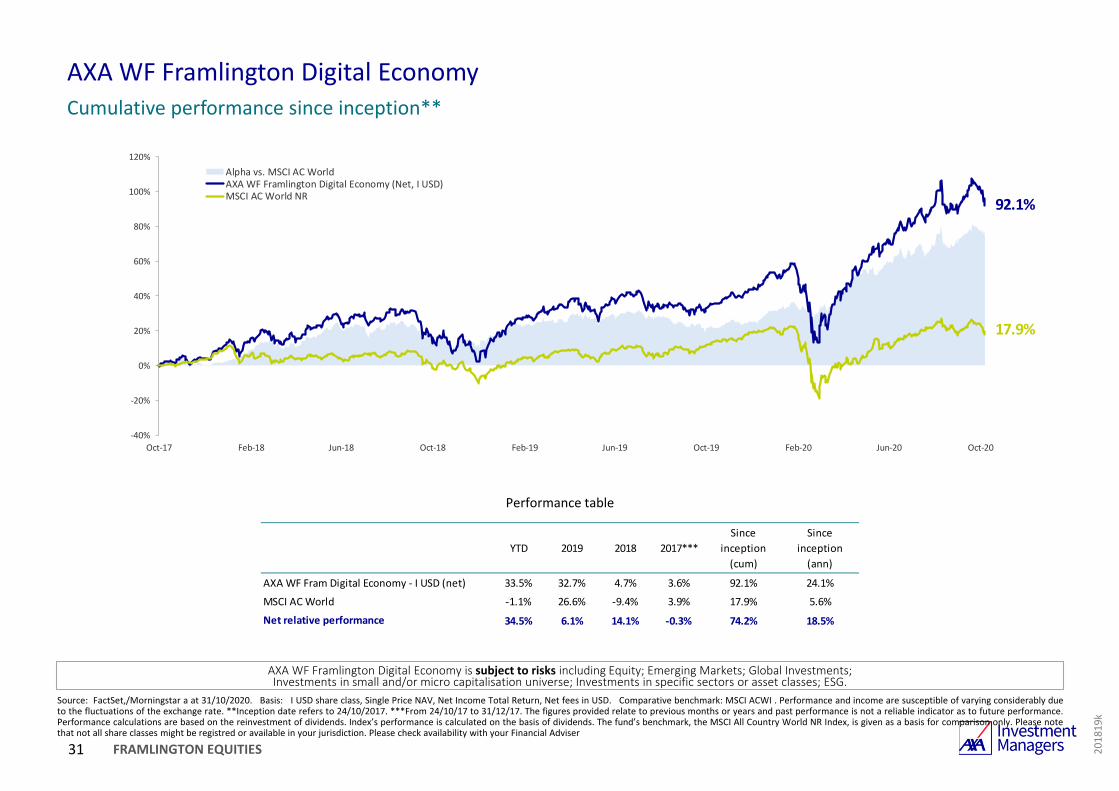
92.1%
17.9%
AXA WF Framlington Digital EconomyCumulative performance since inception**
31 201819k
Source: FactSet,/Morningstar a at 31/10/2020. Basis: I USD share class, Single Price NAV, Net Income Total Return, Net fees in USD. Comparative benchmark: MSCI ACWI . Performance and income are susceptible of varying considerably dueto the fluctuations of the exchange rate. **Inception date refers to 24/10/2017. ***From 24/10/17 to 31/12/17. The figures provided relate to previous months or years and past performance is not a reliable indicator as to future performance.Performance calculations are based on the reinvestment of dividends. Index’s performance is calculated on the basis of dividends. The fund’s benchmark, the MSCI All Country World NR Index, is given as a basis for comparison only. Please notethat not all share classes might be registred or available in your jurisdiction. Please check availability with your Financial Adviser
Performance table
AXA WF Framlington Digital Economy is subject to risks including Equity; Emerging Markets; Global Investments; Investments in small and/or micro capitalisation universe; Investments in specific sectors or asset classes; ESG.
Alpha vs. MSCI AC WorldAXA WF Framlington Digital Economy (Net, I USD)MSCI AC World NR
YTD 2019 2018 2017***Since
inception (cum)
Since inception (ann)
AXA WF Fram Digital Economy ‐ I USD (net) 33.5% 32.7% 4.7% 3.6% 92.1% 24.1%
MSCI AC World ‐1.1% 26.6% ‐9.4% 3.9% 17.9% 5.6%
Net relative performance 34.5% 6.1% 14.1% ‐0.3% 74.2% 18.5%
FRAMLINGTON EQUITIES
1 2 3 4 5 6 7
AXA WF Framlington Digital Economy
32
Potentially lower risk Potentially higher reward
Lower risk Higher risk
Risk and Reward profile
The risk category is calculated using historical performance data and may not be a reliable indicator of the Fund's future risk profile. The risk category shown is not guaranteed and may shift over time. The lowest category does not mean risk free.
Equity risk : Shares’ prices on equity markets may fluctuate namely pursuant to investor's expectations oranticipations, causing high potential volatility risk. Volatility on equity markets has historically been much greater thanthe volatility of fixed income markets. Should the price of Shares fall within the SubFund’s portfolio, the NAV of theSub‐Fund will also fall.
Emerging markets: Legal infrastructure, in certain countries in which investments may be made, may not provide withthe same degree of investors’ protection or information to investors, as would generally apply to major securitiesmarkets (governments’ influence, social, political and economic instability, different accounting, auditing and financialreport practises). Emerging markets securities may also be less liquid and more volatile than similar securities availablein major markets, and there are higher risks associated to transactions settlement, involving timing and pricing issues.
Global Investments: Investments in securities issued or listed in different countries may imply the application ofdifferent standards and regulations (accounting, auditing and financial reporting standards, clearance and settlementprocedures, taxes on dividends…). Investments may be affected by movements of foreign exchange rates, changes inlaws or restrictions applicable to such investments, changes in exchange control regulations or price volatility.
Investments in small and micro capitalisation universe risk: implies specific liquidity risk. The possible lack of a liquidmarket may inhibit the ability of the relevant Sub‐Funds to purchase or sell such investment at an advantageous price.The NAV of the SubFunds may be adversely affected. mall and micro capitalisation universe risk.
Investments in specific sectors or asset classes risk: Certain Sub‐Funds concentrate their investments in certain assetclasses (commodities, real estate) or in companies of certain sectors of the economy (such as health care, consumerstaples and services, telecommunications or real estate) and are therefore subject to the risks associated withconcentrating investments in such classes and sectors. This type of strategy may lead to adverse consequences whensuch asset classes or sectors become less valued or less liquid.
ESG risk: Applying ESG and sustainability criteria to the investment process may exclude securities of certain issuers fornon‐investment reasons and therefore some market opportunities available to funds that do not use ESG orsustainability criteria may be unavailable for the Sub‐Fund, and the Sub‐Fund's performance may at times be better orworse than the performance of relatable funds that do not use ESG or sustainability criteria.
INVESTMENT OBJECTIVEThe Sub‐Fund seeks to provide long‐term growth, in USD, from an actively managedlisted equity and equity‐related securities portfolio.
INVESTMENT POLICYThe Sub‐Fund is actively managed and references MSCI AC World Total Return Net (the“Benchmark”) for comparative purposes only. The Investment Manager has fulldiscretion over the composition of the portfolio of the SubFund and can take exposureto companies, countries or sectors not included in the Benchmark. There are norestrictions on the extent to which the SubFund's portfolio and performance maydeviate from the ones of the Benchmark. The Sub‐Fund invests in equities ofcompanies anywhere in the world that operate within the digital economy sector.Specifically, at all times the Sub‐Fund invests at least two thirds of its net assets inequities and equity‐related securities of companies active in the overall value chain ofthe digital economy, from the customers' initial discovery of products and services, tothe buying decision and then the final payment and delivery, and also in the technologyenablers providing support and data analysis to develop companies' digital presence.Investments may include companies of any market capitalisation. The investmentmanager uses a strategy that combines macro‐economic, sector and company specificanalysis. The securities selection process relies on a rigorous analysis and selection ofhigh quality companies which typically include strong management teams, robustbusiness models and healthy competitive environments and where the expandingdigital economy is expected to have a material positive impact on their financial resultson a mid to long term basis. The Sub‐Fund may also invest in money marketinstruments. The Sub‐Fund may invest up to 10% of net assets in UCITS and/or UCIs.The Sub‐Fund applies the AXA Investment Managers' Environmental, Social andGovernance standards policy (“ESG Standards”) available on www.axa‐im.com/en/responsible‐investing according to which the Investment Manager aims atintegrating the ESG Standards in the investment process by applying specific sectorialexclusions such as tobacco and white phosphorus weapons and by excludinginvestments in securities issued by companies in severe breach of the United NationsGlobal Compact principles and with the lowest ESG scores as described in the policydocument. The Investment Manager bindingly applies at all times the ESG Standards inthe securities selection process with the exception of derivatives and underlyingeligible UCIs. Within a limit of 200% of the Sub‐Fund's net assets, the investmentstrategy may be achieved by direct investments and/or through derivatives. Derivativesmay be used for efficient portfolio management and hedging purposes.
INVESTMENT HORIZONThis Sub‐Fund may not be suitable for investors who plan to withdraw theircontribution within 8 years.
Investment objective and strategy
Additional Risks
FRAMLINGTON EQUITIES
What has supported our strategies in market turbulence?
Source: AXA IM. Left chart: Kleiner Perkins, Internet Trends 2017, Zenith Advertising Expenditure Forecast , March 2017. Right picture: Kleiner Perkins, Internet Trends 2017, Facebook. CR10049/08‐19
33
• Strong balance sheets• Less debt, more cash• Strong earnings and cashflows• Strong margins
Company characteristics Exposed to more resilient end markets • Recurring revenue• Online retail and payments• Remote support & servicing• Stay at home entertainment
A post COVID world will reinforce many of the Evolving Economy secular trends
Shift to cloud based world will continue to accommodate greater IT flexibility. Consumer shift online will accelerate.
Migration to consumption based, more digital economy will accelerate in many transitioning societies.
Global supply chains will require additional automation and flexibility accelerating the need for the “Intelligent Factory”.
Investment led fiscal boost will likely focus on promoting the shift to a lower carbon economy.
Growth of telemedicine and others innovations in healthcare.
FRAMLINGTON EQUITIES34
Q&A session
Mark HargravesHead of Framlington Global Equities
Tom RileyPortfolio Manager
Jeremy GleesonPortfolio Manager
FRAMLINGTON EQUITIES
AXA World Funds ‐ Framlington Evolving Trends
Source: AXA IM & Key Investor Information Document (KIID) – 08/07/2019. For additional Risks, please read the Prospectus. NB: Not all share classes are registered in investor’s jurisdiction andregistration should be checked with the asset manager.
Legal Form Sub Fund of AXA World Funds SICAV
Legal Rules UCITS
Launch Date 1 July 2010
Currency USD
Exit Fees 0%
Maximum Management Fees ( A / E / F / I ) 1.50% / 1.50% / 0.75% / 0.60%
Maximum Subscription fees (A / E / F / I ) 5.50% / 0% / 2.00% / 0%
Minimum Initial Subscription (A / E / F/ I ) 0 / 0 / 0 / 5,000,000
Minimum Subsequent Subscription (A / E / F / I ) 0 / 0 / 0 / 1,000,000
Share Class Capitalisation and Distribution
ISIN CodeLU0503938796 (A USD), LU0503938366 (A EUR), LU0503938523 (A GBP), LU0503938879 (E EUR),LU0503938952 (F EUR), LU0503939174 (F USD), LU0503939091 (F GBP), LU0503939257 (I EUR),
LU0503939414 (I USD), LU0503939331 (I GBP), LU0503939505 (I Dist.EUR Hedged)l LU0503939687 (I Dist.GBP Hedged)
Management Company AXA Funds Management S.A., Luxembourg
Investment Manager AXA Investment Managers Paris
Custodian State Street Bank Luxembourg S.A., Luxembourg
Valuation Daily
Benchmark MSCI AC World
Risk Profile
Recommended Investment Horizon 8 years minimum
201817h
35
Legal characteristics and fees
FRAMLINGTON EQUITIES
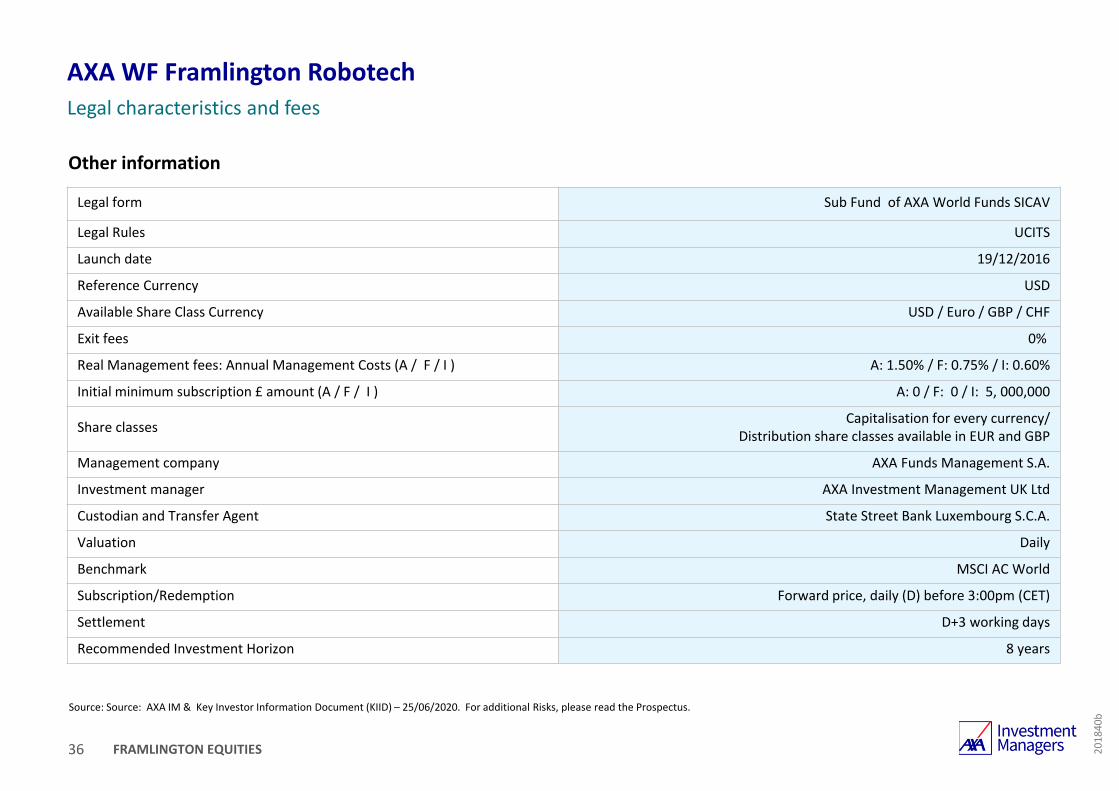
AXA WF Framlington RobotechLegal characteristics and fees
Source: Source: AXA IM & Key Investor Information Document (KIID) – 25/06/2020. For additional Risks, please read the Prospectus.
36
Other information
Legal form Sub Fund of AXA World Funds SICAV
Legal Rules UCITS
Launch date 19/12/2016
Reference Currency USD
Available Share Class Currency USD / Euro / GBP / CHF
Exit fees 0%
Real Management fees: Annual Management Costs (A / F / I ) A: 1.50% / F: 0.75% / I: 0.60%
Initial minimum subscription £ amount (A / F / I ) A: 0 / F: 0 / I: 5, 000,000
Share classes Capitalisation for every currency/ Distribution share classes available in EUR and GBP
Management company AXA Funds Management S.A.
Investment manager AXA Investment Management UK Ltd
Custodian and Transfer Agent State Street Bank Luxembourg S.C.A.
Valuation Daily
Benchmark MSCI AC World
Subscription/Redemption Forward price, daily (D) before 3:00pm (CET)
Settlement D+3 working days
Recommended Investment Horizon 8 years
201840b
FRAMLINGTON EQUITIES
AXA WF Framlington Digital EconomyLegal characteristics and fees
Source: AXA IM as at 01/04/2020.
37
Other information
Legal form Sub Fund of AXA World Funds SICAV
Legal Rules UCITS
Launch date 24/10/2017
Available Share Class Currency USD / EUR / GBP / CHF
Entry charge ( A / F / ZF / I ) A: 5.50% / F: 2.00% / ZF: 2.00% / I: 0%
Exit fees 0%
Management fee ( A / F / ZF / I ) A: 1.50% / F: 0.75% / ZF: 0.75% / I: 0.60%
Initial minimum subscription $ amount ( A / F / ZF / I ) A: 0 / F: 0 / ZF: 250,000 / I: 5,000,000
Share classes Capitalisation and Distribution for every currency
Management company AXA Funds Management S.A.
Investment manager AXA Investment Management UK Ltd
Custodian and Transfer Agent State Street Bank Luxembourg S.C.A.
Valuation Daily
Benchmark MSCI AC World
Subscription/Redemption Forward price, daily (D) before 3:00pm (CET)
Settlement D+3 working days
201819k
FRAMLINGTON EQUITIES38
Important noticeNot for Retail distribution: This document is intended exclusively for Professional, Institutional, Qualified or Wholesale Clients / Investors only, as defined by applicable local laws and regulation. Circulation must be restricted accordingly.
This promotional communication does not constitute on the part of AXA Investment Managers a solicitation or investment, legal or tax advice. This material does not contain sufficient information to support an investment decision.
Due to its simplification, this document is partial and opinions, estimates and forecasts herein are subjective and subject to change without notice. There is no guarantee forecasts made will come to pass. Data, figures, declarations, analysis, predictions and other information in this document is provided based on our state of knowledge at the time of creation of this document. Whilst every care is taken, no representation or warranty (including liability towards third parties), express or implied, is made as to the accuracy, reliability or completeness of the information contained herein. Reliance upon information in this material is at the sole discretion of the recipient. This material does not contain sufficient information to support an investment decision.
Before making an investment, investors should read the relevant Prospectus and the Key Investor Information Document / scheme documents, which provide full product details including investment charges and risks. The information contained herein is not a substitute for those documents or for professional external advice.
The products or strategies discussed in this document may not be registered nor available in your jurisdiction. Please check the countries of registration with the asset manager, or on the web site https://www.axa‐im.com/en/registration‐map, where a fund registration map is available. In particular units of the funds may not be offered, sold or delivered to U.S. Persons within the meaning of Regulation S of the U.S. Securities Act of 1933. The tax treatment relating to the holding, acquisition or disposal of shares or units in the fund depends on each investor’s tax status or treatment and may be subject to change. Any potential investor is strongly encouraged to seek advice from its own tax advisors.
AXA World Fund Framlington Digital Economy, AXA World Fund Framlington Evolving Treends and AXA World Fund Framlington Robotech are sub‐funds of AXA World Funds. AXA WORLD FUNDS ‘s registered office is 49, avenue J.F Kennedy L‐1885 Luxembourg. The Company is registered under the number B. 63.116 at the “Registre de Commerce et des Sociétés” The Company is a Luxembourg SICAV UCITS IV approved by the CSSF and managed by AXA Funds Management, a société anonyme organized under the laws of Luxembourg with the Luxembourg Register Number B 32 223RC, and whose registered office is located at 49, Avenue J.F. Kennedy L‐1885 Luxembourg.
Past performance is not a guide to current or future performance, and any performance or return data displayed does not take into account commissions and costs incurred when issuing or redeeming units. References to league tables and awards are not an indicator of future performance or places in league tables or awards and should not be construed as an endorsement of any AXA IM company or their products or services. Please refer to the websites of the sponsors/issuers for information regarding the criteria on which the awards/ratings are based. The value of investments, and the income from them, can fall as well as rise and investors may not get back the amount originally invested. Exchange‐rate fluctuations may also affect the value of their investment. Due to this and the initial charge that is usually made, an investment is not usually suitable as a short term holding.
Neither MSCI nor any other party involved in or related to compiling, computing or creating the MSCI data makes any express or implied warranties or representations with respect to such data (or the results to be obtained by the use thereof), and all such parties hereby expressly disclaim all warranties of originality, accuracy, completeness, merchantability or fitness for a particular purpose with respect to any of such data. Without limiting any of the foregoing, in no event shall MSCI, any of its affiliates or any third party involved in or related to compiling, computing or creating the data have any liability for any direct, indirect, special, punitive, consequential or any other damages (including lost profits) even if notified of the possibility of such damages. No further distribution or dissemination of the MSCI data is permitted without MSCI’s express written consent.
Issued in the U.K. by AXA Investment Managers UK Limited, which is authorised and regulated by theFinancial Conduct Authority in the U.K. Registered in England and Wales, No: 01431068. Registered Office: 155 Bishopsgate, London, EC2M 3YD (until 31st December 2020); 22 Bishopsgate, London, EC2N 4BQ (from 1st January 2021).
FRAMLINGTON EQUITIES39
Austria ‐ The current prospectus of the fund AXA World Fund Framlington Digital Economy, The AXA World Fund Framlington Evolving Trends and the AXA World Fund FramlingtonRobotech as well as the Key Investor Information Documents were published in electronic form on www.axa‐im.at on and by deposition at AXA Investment Managers Deutschland GmbH Thurn‐und‐Taxis‐Platz 6, D‐60313 Frankfurt am Main, Germany, as well as at the information centre and paying agent UniCredit Bank Austria, Schottengasse 6‐8, 1010 Wien, Austria. Investors and interested persons in Austria receive the prospectus in German language, the Key Investor Information Documents in German, the fund rules (Fondsbestimmungen) and the annual and semi‐annual report of the AXA World Fund Framlington Digital Economy fund, The AXA World Fund Framlington Evolving Trends and the AXA World Fund FramlingtonRobotech free of charge at AXA Investment Managers Deutschland GmbH, at the information centre and paying agent mentioned above and on www.axa‐im.at. With this information and paying agent, further information and documents regarding the product may be examined as well as redemption requests may be filed. The issue prices and redemption prices are also available at this information centre and paying agent and on www.axa‐im.at.Belgium ‐ In Belgium, this document is intended for Professional Clients only, as defined by local laws and the MIFID directive, and is distributed by AXA IM Benelux SA/NV, 1 Place du Trône – 1000 Brussels Belgium. Germany ‐ For professional clients only. Not for retail investors. This is promotional material, not a regular mandatory document and is not suitable for any kind of sales services, consulting or financial services vis‐à‐vis retail clients. The information in this document is exclusively addressed to professional clients who receive this document directly from AXA Investment Managers Deutschland GmbH / its affiliated companies. It is to be treated strictly confidential. The recipients are not allowed to pass this document and the information contained herein on to a third party, in whole or in part, without the prior written consent of AXA Investment Managers Deutschland GmbH / its affiliated companies. You will receive the latest prospectus in German, Key Investor Information Document (“KIID”) in your national language and the most recent annual and semi‐annual report upon request free of charge and in paper form at AXA Investment Managers Deutschland GmbH Thurn‐und‐Taxis‐Platz 6, D‐60313 Frankfurt am Main, Germany or from our distribution partners or under www.axa‐im.de.Denmark, Finland, Norway, Sweden ‐ The current prospectus of the fund AXA World Fund Framlington Digital Economy, The AXA World Fund Framlington Evolving Trends and the AXA World Fund Framlington Robotech as well as the Key Investor Information Documents (KIID) are published in electronic form online and by deposition at AXA Investment Managers Deutschland GmbH Thurn‐und‐Taxis‐Platz 6, D‐60313 Frankfurt am Main, Germany as well as at the information centre and paying agent. Investors and interested persons receive the prospectus in your national language or English, the KIID in national language or English, the fund rules and the annual and semi‐annual report of the AXA World Fund Framlington Digital Economy fund, The AXA World Fund Framlington Evolving Trends and the AXA World Fund Framlington Robotech free of charge at AXA Investment Managers Deutschland GmbH, at the information centre and paying agent mentioned above and online. With this information centre and paying agent, further information and documents regarding the product may be examined as well as redemption requests may be filed. The issue prices and redemption prices are publicly available every trading day and are also available at the information centre, paying agent and online. France ‐ In France, this document has been edited by AXA INVESTMENT MANAGERS SA, a company incorporated under the laws of France, having its registered office located at Tour Majunga, 6 place de la Pyramide, 92800 Puteaux, registered with the Nanterre Trade and Companies Register under number 393 051 826.Luxembourg ‐ In Luxembourg, this document is intended for Professional Clients only, as defined by local laws and the MIFID directive, and is distributed by AXA IM Benelux SA/NV, 1 Place du Trône – 1000 Brussels Belgium. Netherlands ‐ In the Netherlands, this document is intended for Professional Clients only, as defined by local laws and the MIFID directive, and is distributed by AXA IM Benelux‐Netherlands Branch, Beethoven 500 – 4th Floor, Beethovenstraat 518 – 1082 PR Amsterdam ‐ the Netherlands.Spain ‐ This document is intended for informational purposes only, and in no event is intended for retail customers and/or end investors. The information contained herein is for professional clients and eligible counterparties as they are defined in Articles 78bis and 79 ter of the Spanish Securities Market Act (Ley del Mercado de Valores), it is presumed, therefore, experience, knowledge and expertise to make their own investment decisions and properly assess their risks.
FRAMLINGTON EQUITIES40
Switzerland ‐ This document is intended exclusively for Qualified Investors according to Swiss law. Circulation must be restricted accordingly. Any reproduction of this information, in whole or in part, is prohibited.The Swiss representative for the Luxembourg‐domiciled SICAV (société d’investissement à capital variable) AXA World Funds is First Independent Fund Services Ltd, Klausstrasse 33, CH‐8008 Zurich. The Swiss paying agent is Credit Suisse Ltd, Paradeplatz 8, CH‐8001 Zurich. The current prospectus, the Key Investor Information Document (the ”KIID”) as well as the annual and semi‐annual reports can be obtained free of charge from the Swiss representative. In respect of the units distributed in Switzerland, the place of performance and jurisdiction is Zurich, Switzerland.Portugal ‐ In Portugal, this document is distributed by AXA Investment Managers GS Limited, Spanish Branch, has its registered office in Madrid, Paseo de la Castellana no. 93, 6th floor, is registered in the Madrid Mercantile Register, sheet M‐301801, and is registered with the CNMV under 19 number as ESI of the European Economic Space, with Branch.UK ‐ The AXA World Fund Framlington Digital Economy fund, The AXA World Fund Framlington Evolving Trends and the AXA World Fund Framlington Robotech are recognised by the UK Financial Conduct Authority and are available for sale in the UK. Liechtenstein ‐ Investors and interested persons in the Principality of Liechtenstein receive the prospectus, the Key Investor Information Documents in German language, the annual and semi‐annual report of the AXA World Fund Framlington Digital Economy fund, The AXA World Fund Framlington Evolving Trends and the AXA World Fund Framlington Robotech free of charge at AXA Investment Managers Deutschland GmbH Thurn‐und‐Taxis‐Platz 6, D‐60313 Frankfurt am Main, Germany or in electronic form on www.axa‐im.li. or free of charge at the following paying agent: LGT Bank AG, Herrengasse 12, FL‐9490 VaduzMonaco ‐ The AXA World Fund Framlington Digital Economy fund, The AXA World Fund Framlington Evolving Trends and the AXA World Fund Framlington Robotech may not be offered or sold, directly or indirectly, to the public in Monaco other than by a Monaco Bank or a duly authorized Monegasque intermediary acting as a professional institutional investor which has such knowledge and experience in financial and business matters as to be capable of evaluating the risks and merits of an investment in the Fund. Consequently, this Prospectus may only be communicated to (i) banks, and (ii) portfolio management companies duly licensed by the “Commission de Contrôle des Activités Financières” by virtue of Law n° 1.338, of September 7, 2007, and authorized under Law n° 1.144 of July 26, 1991. Such regulated intermediaries may in turn communicate this Document to potential investors under their own liability.Hong‐Kong ‐ In Hong Kong, this document is issued by AXA Investment Managers Asia Limited (SFC License No. AAP809), which is authorized and regulated by Securities and Futures Commission. This document is to be used only by persons defined as “professional investor” under Part 1 of Schedule 1 to the Securities and Futures Ordinance (SFO) and other regulations, rules, guidelines or circulars which reference “professional investor” as defined under Part 1 of Schedule 1 to the SFO. This document must not be relied upon by retail investors. Circulation must be restricted accordingly.Singapore ‐ In Singapore, this document is issued by AXA Investment Managers Asia (Singapore) Ltd. (Registration No. 199001714W) and is intended for the use of Institutional Investors only as defined in Section 4A of the Securities and Futures Act (Cap. 289) and must not be relied upon by retail investors. Circulation must be restricted accordingly.Korea ‐ In Korea, AXA Investment Managers Asia (Singapore) Ltd is a registered Cross Border Investment Advisor/Discretionary Investment Management Company under the Financial Investment Services and Capital Markets Act (the “Act”). The activities referenced under the Act are 5‐2‐2 Investment Advisory Business and 6‐2‐2 Discretionary Investment Management Business, respectively. Its financial services are available in Korea only to Professional Investors within the meaning of Article 10 of Enforcement Decree of the Financial Investment Services and Capital Markets Act.To the extent that any fund is mentioned in this document, neither the fund nor AXA IM Asia is making any representation with respect to the eligibility of any recipients of this document to acquire the units/shares in the fund under the laws of Korea, including but without limitation the Foreign Exchange Transaction Act and Regulations thereunder. The units/shares have not been registered under the Financial Investment Services and Capital Markets Act of Korea, and none of the units/shares may be offered, sold or delivered, or offered or sold to any person for re‐offering or resale, directly or indirectly, in Korea or to any resident of Korea except pursuant to applicable laws and regulations of Korea.
FRAMLINGTON EQUITIES41
Taiwan ‐ In Taiwan, this document is issued by AXA Investment Managers Asia Limited (SFC License No. AAP809), which is authorized and regulated by Securities and Futures Commission. This document and the information contained herein are intended for the use of professional or institutional investors and should not be relied upon by retail investors. They have been prepared and issued for private informational and educational purposes only at the sole request of the specified recipients, and not intended for general circulation. They are strictly confidential, and must not be reproduced, circulated, distributed, redistributed or otherwise used, in whole or in part, in any way without the prior written consent of AXA IM Asia. They are not intended for distribution to any persons or in any jurisdictions for which it is prohibited.If any fund is highlighted in this communication (the “Fund”), its offering document or prospectus contains important information on selling restrictions and risk factors, you should read them carefully before entering into any transaction. It is your responsibility to be aware of and to observe all applicable laws and regulations of any relevant jurisdiction. AXA IM Asia does not intend to offer any Fund in any country where such offering is prohibited.The offer, distribution, sale or re‐sale of fund units/shares in Taiwan requires approval from and/or registration with Taiwanese regulatory authorities. To the extent that any units/shares of the Funds are not so licensed or registered, such units/shares are made available in Taiwan on a private placement basis only to banks, bills houses, trust enterprises, financial holding companies and other qualified entities or institutions (collectively, “Qualified Institutions”) and other entities and individuals meeting specific criteria (“Other Qualified Investors”) pursuant to the private placement provisions of the Rules Governing Offshore Funds. No other offer or sale of such units/shares in Taiwan is permitted. Taiwanese purchasers of such units/shares may not sell or otherwise dispose of their holdings except by redemption, transfer to a Qualified Institution or Other Qualified Investor, transfer by operation of law or other means approved by the Taiwan Financial Supervisory Commission.Malaysia ‐ For Malaysian investors: As the recognition by the Malaysian Securities Commission pursuant to Section 212 of the Malaysian Capital Markets and Services Act 2007 has not been / will not be obtained nor will this document be lodged or registered with the Malaysian Securities Commission, the shares referred to hereunder (if any) are not being and will not be deemed to be issued, made available, offered for subscription or purchase in Malaysia and neither this document nor any other document or other material in connection therewith should be distributed, caused to be distributed or circulated in Malaysia.Thailand ‐ For Thailand investors: Nothing in this document shall constitute in any manner whatsoever a proposal to make available, offer for subscription or purchase or to issue an invitation to purchase or subscribe for any securities in Thailand or a proposal to implement any of the foregoing in Thailand nor has this document been approved by or registered with the Securities and Exchange Commission of Thailand (“SEC”). No person receiving a copy of this document may treat the same as constituting an invitation or offer to him in Thailand and such person shall not distribute or make available this document in Thailand. The issuer of this document shall not be liable in any manner whatsoever in the event this document is distributed or made available to any person in Thailand receiving a copy of this document. Since no application for approval has been or will be made to the SEC for the offering of the securities, or for the registration of this document, the securities shall not be offered for subscription or purchased or made available, whether directly or indirectly, in Thailand. It is the sole responsibility of recipients wishing to take any action upon this document to satisfy themselves as to the full observance of the laws of Thailand, to comply with all relevant government and regulatory approvals, and to comply with all applicable laws, including but not limited to exchange control laws.China ‐ For Investors in People’s Republic of China (PRC): This document does not constitute a public offer of the product., whether by sale or subscription in the PRC. The product is not being offered or sold directly or indirectly in the PRC to or for the benefit of, legal or natural persons of the PRC. Further, no legal or natural persons of the PRC may directly or indirectly purchase any of the product or any beneficial interest herein without obtaining all prior PRC’s governmental approvals that are required, whether statutorily or otherwise. Persons who come into possession of this document are required by the issuer and its representatives to observe these restrictions.Chile ‐ For Chilean investors: This private offer commences on 24/09/2020, and it avails itself of the General Regulation No. 345 of the Superintendence of Securities and Insurance. This offer relates to securities not registered with the Securities Registry or the Registry of Foreign Securities of the Superintendence of Securities and Insurance, and therefore such shares are not subject to oversight by the latter. Being unregistered securities, there is no obligation on the issuer to provide public information in Chile regarding such securities; and These securities may not be subject to a public offer until they are registered in the corresponding Securities Registry.ESTA OFERTA PRIVADA SE INICIA EL DIA 24/09/2020 SE ACOGE A LAS DISPOSICIONES DE LA NORMA DE CARÁCTER GENERAL Nº 336 DE LA SUPERINTENDENCIA DE VALORES Y SEGUROS; ESTA OFERTA VERSA SOBRE VALORES NO INSCRITOS EN EL REGISTRO DE VALORES O EN EL REGISTRO DE VALORES EXTRANJEROS QUE LLEVA LA SUPERINTENDENCIA DE VALORES Y SEGUROS, POR LO QUE TALES VALORES NO ESTÁN SUJETOS A LA FISCALIZACIÓN DE ÉSTA; POR TRATAR DE VALORES NO INSCRITOS NO EXISTE LA OBLIGACIÓN POR PARTE DEL EMISOR DE ENTREGAR EN CHILE INFORMACIÓN PÚBLICA RESPECTO DE LOS VALORES SOBRE LOS QUE VERSA ESTA OFERTA; ESTOS VALORES NO PODRÁN SER OBJETO DE OFERTA PÚBLICA MIENTRAS NO SEAN INSCRITOS EN EL REGISTRO DE VALORES CORRESPONDIENTE.