V International Conference on Computational Methods in Marine Engineering MARINE 2013 B. Brinkmann and P. Wriggers (Eds) AXISYMMETRIC TRANSIENT MODELLING OF A WIND TURBINE FOUNDATION IN COHESIONLESS SOIL USING THE PREVOST’S MODEL B. CERFONTAINE ∗,† , S. LEVASSEUR † AND R. CHARLIER † ∗ FRIA, FRS-FNRS, National Fund for Scientific Research Brussels, Belgium e-mail: [email protected]† Geomechanics and Geological Engineering Department ArGEnCo, University of Liege Sart-Tilman, Liege, Belgium Key words: Prevost’s Model, Suction Caisson, Constitutive Law Abstract. Suction caissons are more and more used for offshore foundations. This paper deals with the cyclic modelling of suction caissons using the Prevost’s model. The case study is a 8m large diameter caisson embedded in dense No. 0 Lundsand. Parameters for the model are calibrated using drained triaxial tests. A parametric study concerning the influence of the constitutive law, the skirt length and permeability is carried out. 1 INTRODUCTION Nowadays, offshore power plants are gathering momentum [1]. Developers are planning new wind farms in deeper waters and further away from the coasts for economical and environmental purpose as well. Wind turbines are growing in size and power, increasing the foundation requirements. Developing an accurate design approach is a crucial issue for private companies that aim to decrease building costs. Foundation costs may represent up to 30 % of the total [2]! Suction caissons are a serious alternative to piling for offshore structures. These are lighter, easier to install and cheaper than classical foundations [3]. The caisson is set up by reducing the water pressure inside the bucket by pumping. The differential pressure on the top of the caisson induces a downward force that digs the foundation into the soil. Numerical modelling of this kind of offshore foundations is not trivial. Simple numer- ical models exist, based on in-situ test measurements, semi-empirical methods or macro- elements [3, 4, 5, 6]. Classical isotropic-hardening models are not able to truly represent the cyclic loading paths which involve elastic and plastic deformations in both loading and unloading cases. One should consider more sophisticated models such as the Prevost’s 1
Transcript
V International Conference on Computational Methods in Marine EngineeringMARINE 2013
B. Brinkmann and P. Wriggers (Eds)
AXISYMMETRIC TRANSIENT MODELLING OF A WINDTURBINE FOUNDATION IN COHESIONLESS SOIL USING
THE PREVOST’S MODEL
B. CERFONTAINE∗,†, S. LEVASSEUR† AND R. CHARLIER†
∗FRIA, FRS-FNRS, National Fund for Scientific ResearchBrussels, Belgium
† Geomechanics and Geological EngineeringDepartment ArGEnCo, University of Liege
Sart-Tilman, Liege, Belgium
Key words: Prevost’s Model, Suction Caisson, Constitutive Law
Abstract. Suction caissons are more and more used for offshore foundations. This paperdeals with the cyclic modelling of suction caissons using the Prevost’s model. The casestudy is a 8m large diameter caisson embedded in dense No. 0 Lundsand. Parameters forthe model are calibrated using drained triaxial tests. A parametric study concerning theinfluence of the constitutive law, the skirt length and permeability is carried out.
1 INTRODUCTION
Nowadays, offshore power plants are gathering momentum [1]. Developers are planningnew wind farms in deeper waters and further away from the coasts for economical andenvironmental purpose as well. Wind turbines are growing in size and power, increasingthe foundation requirements. Developing an accurate design approach is a crucial issuefor private companies that aim to decrease building costs. Foundation costs may representup to 30 % of the total [2]!
Suction caissons are a serious alternative to piling for offshore structures. These arelighter, easier to install and cheaper than classical foundations [3]. The caisson is set upby reducing the water pressure inside the bucket by pumping. The differential pressureon the top of the caisson induces a downward force that digs the foundation into the soil.
Numerical modelling of this kind of offshore foundations is not trivial. Simple numer-ical models exist, based on in-situ test measurements, semi-empirical methods or macro-elements [3, 4, 5, 6]. Classical isotropic-hardening models are not able to truly representthe cyclic loading paths which involve elastic and plastic deformations in both loading andunloading cases. One should consider more sophisticated models such as the Prevost’s
1
B. CERFONTAINE, S. LEVASSEUR AND R. CHARLIER
model [7] which is dedicated to represent cyclic behaviour of cohesive or frictionless soils.An improved version of this model is available in [8] in the scope of earthquake modelling.An application to offshore gravity structures is available in [9] for cohesive soil.
The Prevost’s model is applied in this paper to a suction caisson case study to highlightthe main features of the cyclic loading of offshore foundations. The main objective is totest the possibilities and limitations of the model for this purpose. A parametric study iscarried out on both skirt length and permeability.
2 THE PREVOST’MODEL
2.1 Definitions
The sign convention of soil mechanics is adopted : compressive stresses and strains arepositive. The Macauley brackets 〈〉 are defined according to
〈f〉 =
{
0, f < 0f, f ≥ 0
(1)
The symbol”:” indicates a dot product between two tensors (in bold characters). Forexample, if σ′ is the effective (Cauchy) stress tensor, the product σ′ : σ′ = σij · σij inindex notation. The identity tensor is written δ, then the mean effective stress is definedas p′ = 1/3 · σ′ : δ. The deviatoric stress tensor and the invariant of deviatoric stressesare defined through
s = σ′ − p′ · δ and q =
√
3
2· s : s (2)
2.2 Constitutive equations
The Prevost’s model lies within the framework of elasto-plasticity. Constitutive equa-tions are written in incremental form. The equation below links the effective stress rateσ′ to the elastic deformation rate ǫ− ǫp
σ′ = E : ǫ− ǫp (3)
where E is the fourth-order tensor of elastic coefficients, ǫ is the total deformation rateand ǫp is the plastic deformation rate defined through
ǫp = P · 〈L〉 (4)
P is a symmetric second-order tensor defining a non-associated plastic potential. Theplastic loading function, L, is a scalar that depicts the amount of plasticity deformationand is defined in the following
L =1
H′·Q : σ′ (5)
where Q is a second-order tensor defining the unit outer normal to the yield surface andH’ the plastic modulus associated to this surface. This normal tensor can be decomposedinto its deviatoric and volumetric part as
Q = Q′ +Q” · δ (6)
2
B. CERFONTAINE, S. LEVASSEUR AND R. CHARLIER
2.3 Yield functions
The model is made of conical nested yield surfaces in principal stress space [7]. Theirapex is fixed at the origin of axes but could be translated on the hydrostatic axis to takecohesion into account if necessary. The i-th surface is the locus of the stress states thatverify
f i ≡3
2·(
s− p′ ·αi)
:(
s− p′ ·αi)
−(
p′ ·Mi)2
= 0 (7)
where αi is a kinematic deviatoric stress tensor defining the coordinates of the yieldsurface centre in deviatoric space and Mi is a material parameter denoting the apertureof the cone.
2.4 Plastic flow rule
The plastic potential P = P′ + P” · δ is decomposed into its deviatoric part which isassociative
P′ = Q′ (8)
and its volumetric part which is non-associative
P” =1
3·η2 − η2
η2 + η2where η =
√
3/2 · s : s
p′=
q
p′(9)
The material parameter η takes into account the phase transformation line defined byIshihara [10]. This parameter rules the dilationnal behaviour and separates the p’-q planeinto two zones. Stress ratios (η) lower than η indicate a plastic contractive behaviourwhilst the other zone depicts a dilative plastic behaviour.
2.5 Hardening rule
The hardening rule of the surfaces is purely kinematic. During loading, the activesurface moves up to come into contact with the next one. All surfaces inside the activeone stay tangential at the current stress state. The relationship between plastic functionand kinematic hardening is determined through the consistency condition [7] and leads to
p′ ·αi =H′
Q′ : µ· 〈L〉 · µ (10)
where µ is a tensor defining the direction of translation of the active surface in thedeviatoric space. At this step, any direction of translation could be used dependingon the strategy used to integrate the constitutive law (explicit or implicit). The onlyrequirement is that the outermost activated surface has to be at most tangential to thenext one, at the end of a given step. Overlapping of the surfaces is then avoided. In thispaper, an implicit integration is adopted.
3
B. CERFONTAINE, S. LEVASSEUR AND R. CHARLIER
3 CALIBRATION
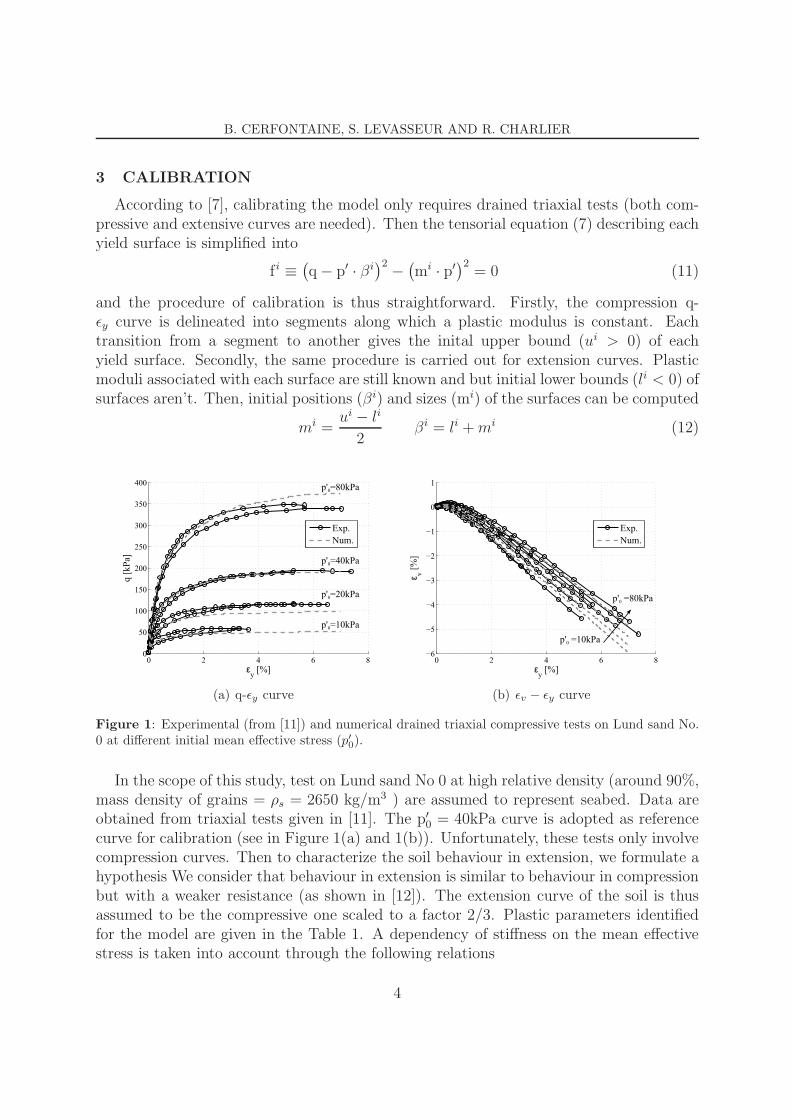
According to [7], calibrating the model only requires drained triaxial tests (both com-pressive and extensive curves are needed). Then the tensorial equation (7) describing eachyield surface is simplified into
f i ≡(
q− p′ · βi)2
−(
mi · p′)2
= 0 (11)
and the procedure of calibration is thus straightforward. Firstly, the compression q-ǫy curve is delineated into segments along which a plastic modulus is constant. Eachtransition from a segment to another gives the inital upper bound (ui > 0) of eachyield surface. Secondly, the same procedure is carried out for extension curves. Plasticmoduli associated with each surface are still known and but initial lower bounds (li < 0) ofsurfaces aren’t. Then, initial positions (βi) and sizes (mi) of the surfaces can be computed
mi =ui − li
2βi = li +mi (12)
0 2 4 6 80
50
100
150
200
250
300
350
400
εy
[%]
q [
kP
a]
p'0=10kPa
p'0=20kPa
p'0=40kPa
p'0=80kPa
Exp.
Num.
(a) q-ǫy curve
0 2 4 6 8−6
−5
−4
−3
−2
−1
0
1
εy
[%]
εv
[%]
Exp.
Num.
p'0 =10kPa
p'0 =80kPa
(b) ǫv − ǫy curve
Figure 1: Experimental (from [11]) and numerical drained triaxial compressive tests on Lund sand No.0 at different initial mean effective stress (p′
0).
In the scope of this study, test on Lund sand No 0 at high relative density (around 90%,mass density of grains = ρs = 2650 kg/m3 ) are assumed to represent seabed. Data areobtained from triaxial tests given in [11]. The p′
0 = 40kPa curve is adopted as referencecurve for calibration (see in Figure 1(a) and 1(b)). Unfortunately, these tests only involvecompression curves. Then to characterize the soil behaviour in extension, we formulate ahypothesis We consider that behaviour in extension is similar to behaviour in compressionbut with a weaker resistance (as shown in [12]). The extension curve of the soil is thusassumed to be the compressive one scaled to a factor 2/3. Plastic parameters identifiedfor the model are given in the Table 1. A dependency of stiffness on the mean effectivestress is taken into account through the following relations
4
B. CERFONTAINE, S. LEVASSEUR AND R. CHARLIER
X(p′) = X0 ·
(
p′
pref
)n
where X = [G,K,H′] and pref = 100kPa (13)
The reference shear and bulk moduli are taken equal to 47MPa and 65MPa respectively.The permeability of the soil is assessed equal to 10−5 m/s, [3].
Table 1: Parameters describing the soil for the Prevost’s model : initial position of the surfaces (α),aperture of the surfaces (M), reference plastic modulus associated (H′
0), parameter defining the volumetric
plastic potential (η), n for the dependency of stiffness on the mean effective stress.
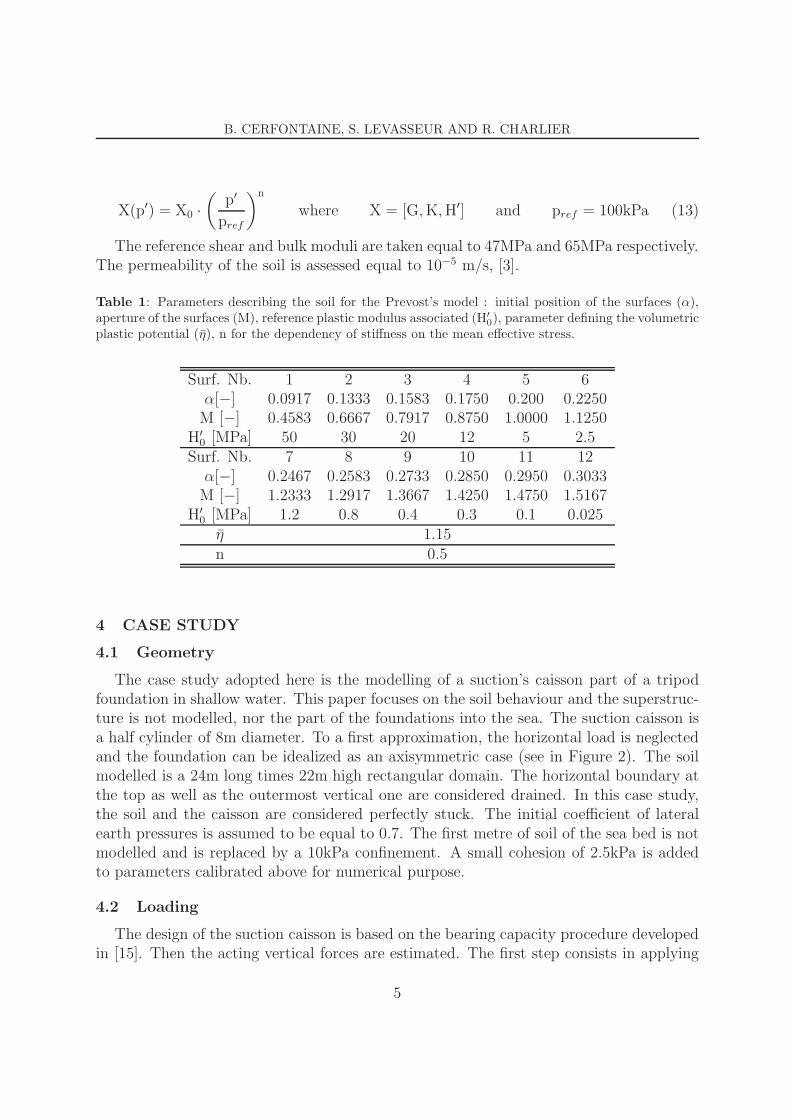
The case study adopted here is the modelling of a suction’s caisson part of a tripodfoundation in shallow water. This paper focuses on the soil behaviour and the superstruc-ture is not modelled, nor the part of the foundations into the sea. The suction caisson isa half cylinder of 8m diameter. To a first approximation, the horizontal load is neglectedand the foundation can be idealized as an axisymmetric case (see in Figure 2). The soilmodelled is a 24m long times 22m high rectangular domain. The horizontal boundary atthe top as well as the outermost vertical one are considered drained. In this case study,the soil and the caisson are considered perfectly stuck. The initial coefficient of lateralearth pressures is assumed to be equal to 0.7. The first metre of soil of the sea bed is notmodelled and is replaced by a 10kPa confinement. A small cohesion of 2.5kPa is addedto parameters calibrated above for numerical purpose.
4.2 Loading
The design of the suction caisson is based on the bearing capacity procedure developedin [15]. Then the acting vertical forces are estimated. The first step consists in applying
5
B. CERFONTAINE, S. LEVASSEUR AND R. CHARLIER
4.5m
cro
ss s
ecti
on
1
cro
ss s
ecti
on
2
cyclic + static stresses
confinement
skir
t le
ng
th
point 1
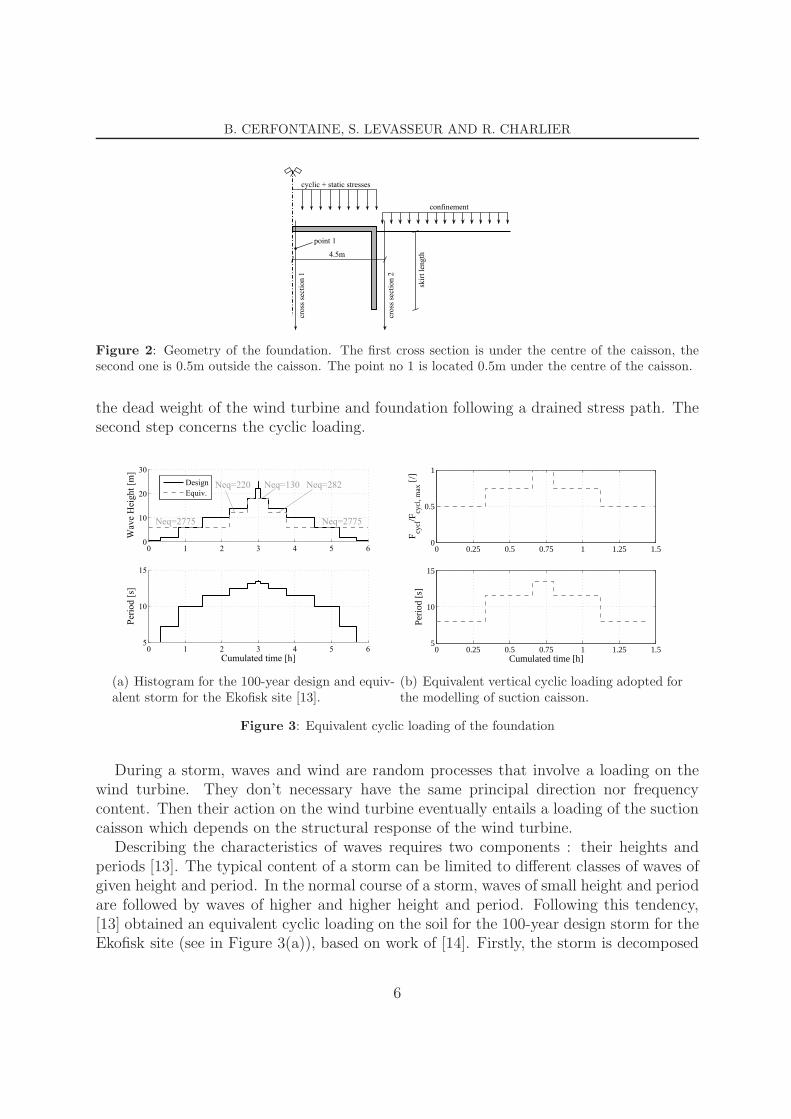
Figure 2: Geometry of the foundation. The first cross section is under the centre of the caisson, thesecond one is 0.5m outside the caisson. The point no 1 is located 0.5m under the centre of the caisson.
the dead weight of the wind turbine and foundation following a drained stress path. Thesecond step concerns the cyclic loading.
0 1 2 3 4 5 60
10
20
30
Wav
e H
eight
[m]
Design
Neq=2775
Neq=220 Neq=130 Neq=282
Neq=2775
Equiv.
0 1 2 3 4 5 65
10
15
Per
iod [
s]
Cumulated time [h]
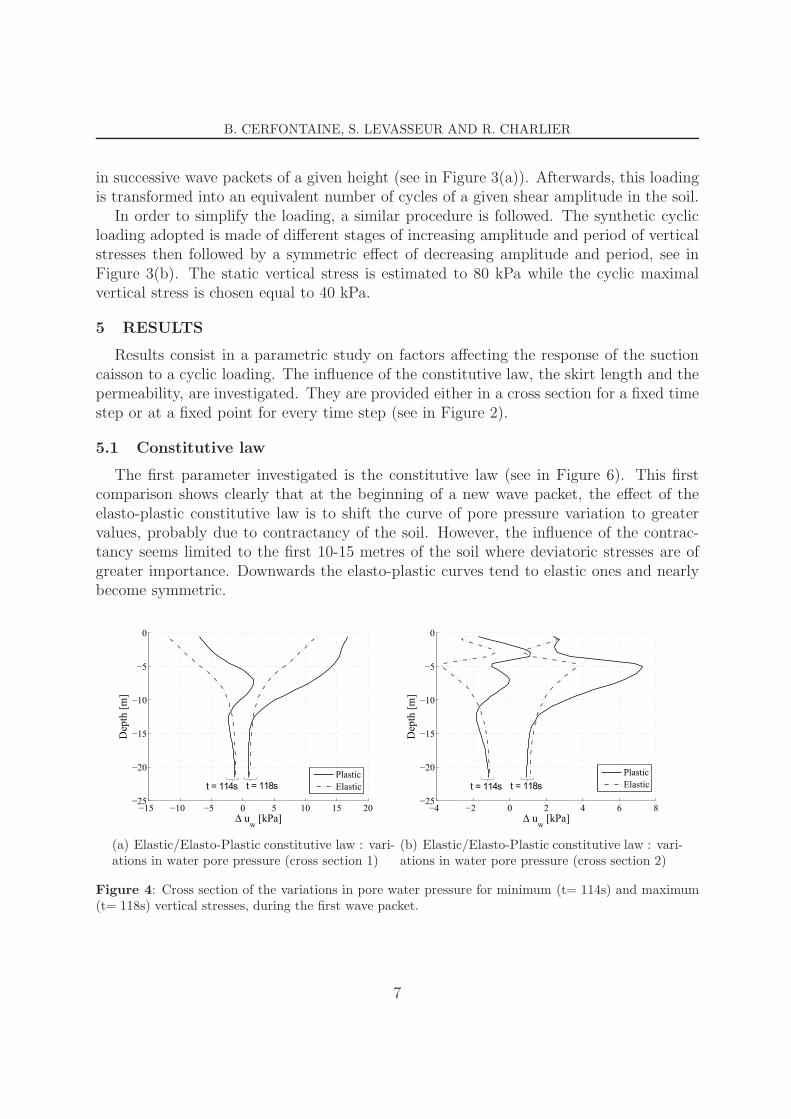
(a) Histogram for the 100-year design and equiv-alent storm for the Ekofisk site [13].
Figure 3: Equivalent cyclic loading of the foundation
During a storm, waves and wind are random processes that involve a loading on thewind turbine. They don’t necessary have the same principal direction nor frequencycontent. Then their action on the wind turbine eventually entails a loading of the suctioncaisson which depends on the structural response of the wind turbine.
Describing the characteristics of waves requires two components : their heights andperiods [13]. The typical content of a storm can be limited to different classes of waves ofgiven height and period. In the normal course of a storm, waves of small height and periodare followed by waves of higher and higher height and period. Following this tendency,[13] obtained an equivalent cyclic loading on the soil for the 100-year design storm for theEkofisk site (see in Figure 3(a)), based on work of [14]. Firstly, the storm is decomposed
6
B. CERFONTAINE, S. LEVASSEUR AND R. CHARLIER
in successive wave packets of a given height (see in Figure 3(a)). Afterwards, this loadingis transformed into an equivalent number of cycles of a given shear amplitude in the soil.
In order to simplify the loading, a similar procedure is followed. The synthetic cyclicloading adopted is made of different stages of increasing amplitude and period of verticalstresses then followed by a symmetric effect of decreasing amplitude and period, see inFigure 3(b). The static vertical stress is estimated to 80 kPa while the cyclic maximalvertical stress is chosen equal to 40 kPa.
5 RESULTS
Results consist in a parametric study on factors affecting the response of the suctioncaisson to a cyclic loading. The influence of the constitutive law, the skirt length and thepermeability, are investigated. They are provided either in a cross section for a fixed timestep or at a fixed point for every time step (see in Figure 2).
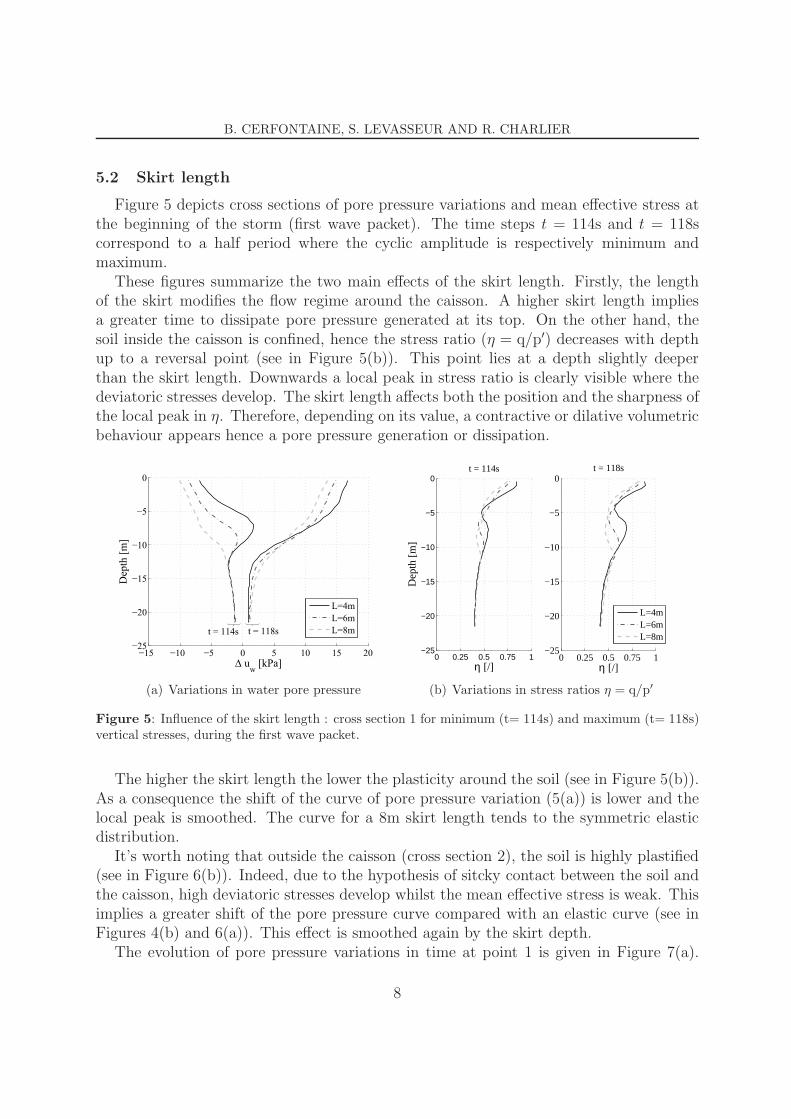
5.1 Constitutive law
The first parameter investigated is the constitutive law (see in Figure 6). This firstcomparison shows clearly that at the beginning of a new wave packet, the effect of theelasto-plastic constitutive law is to shift the curve of pore pressure variation to greatervalues, probably due to contractancy of the soil. However, the influence of the contrac-tancy seems limited to the first 10-15 metres of the soil where deviatoric stresses are ofgreater importance. Downwards the elasto-plastic curves tend to elastic ones and nearlybecome symmetric.
−15 −10 −5 0 5 10 15 20−25
−20
−15
−10
−5
0
∆ uw
[kPa]
Dep
th [
m]
Plastic
Elastict = 114s t = 118s
(a) Elastic/Elasto-Plastic constitutive law : vari-ations in water pore pressure (cross section 1)
−4 −2 0 2 4 6 8−25
−20
−15
−10
−5
0
∆ uw
[kPa]
Dep
th [
m]
Plastic
Elastict = 114s t = 118s
(b) Elastic/Elasto-Plastic constitutive law : vari-ations in water pore pressure (cross section 2)
Figure 4: Cross section of the variations in pore water pressure for minimum (t= 114s) and maximum(t= 118s) vertical stresses, during the first wave packet.
7
B. CERFONTAINE, S. LEVASSEUR AND R. CHARLIER
5.2 Skirt length
Figure 5 depicts cross sections of pore pressure variations and mean effective stress atthe beginning of the storm (first wave packet). The time steps t = 114s and t = 118scorrespond to a half period where the cyclic amplitude is respectively minimum andmaximum.
These figures summarize the two main effects of the skirt length. Firstly, the lengthof the skirt modifies the flow regime around the caisson. A higher skirt length impliesa greater time to dissipate pore pressure generated at its top. On the other hand, thesoil inside the caisson is confined, hence the stress ratio (η = q/p′) decreases with depthup to a reversal point (see in Figure 5(b)). This point lies at a depth slightly deeperthan the skirt length. Downwards a local peak in stress ratio is clearly visible where thedeviatoric stresses develop. The skirt length affects both the position and the sharpness ofthe local peak in η. Therefore, depending on its value, a contractive or dilative volumetricbehaviour appears hence a pore pressure generation or dissipation.
−15 −10 −5 0 5 10 15 20−25
−20
−15
−10
−5
0
∆ uw
[kPa]
Dep
th [
m]
L=4m
L=6m
L=8mt = 114s t = 118s
(a) Variations in water pore pressure
0 0.25 0.5 0.75 1−25
−20
−15
−10
−5
0
η [/]
Dep
th [m
]
t = 114s
0 0.25 0.5 0.75 1−25
−20
−15
−10
−5
0
η [/]
t = 118s
L=4mL=6mL=8m
(b) Variations in stress ratios η = q/p′
Figure 5: Influence of the skirt length : cross section 1 for minimum (t= 114s) and maximum (t= 118s)vertical stresses, during the first wave packet.
The higher the skirt length the lower the plasticity around the soil (see in Figure 5(b)).As a consequence the shift of the curve of pore pressure variation (5(a)) is lower and thelocal peak is smoothed. The curve for a 8m skirt length tends to the symmetric elasticdistribution.
It’s worth noting that outside the caisson (cross section 2), the soil is highly plastified(see in Figure 6(b)). Indeed, due to the hypothesis of sitcky contact between the soil andthe caisson, high deviatoric stresses develop whilst the mean effective stress is weak. Thisimplies a greater shift of the pore pressure curve compared with an elastic curve (see inFigures 4(b) and 6(a)). This effect is smoothed again by the skirt depth.
The evolution of pore pressure variations in time at point 1 is given in Figure 7(a).
8
B. CERFONTAINE, S. LEVASSEUR AND R. CHARLIER
−4 −2 0 2 4 6 8−25
−20
−15
−10
−5
0
∆ uw
[kPa]
Dep
th [
m]
L=4m
L=6m
L=8mt = 114s t = 118s
(a) Variations in water pore pressure
0 0.5 1 1.5−25
−20
−15
−10
−5
0
η [/]
Dep
th [m
]
t = 114s
0 0.5 1 1.5−25
−20
−15
−10
−5
0
η [/]
t = 118s
L=4mL=6mL=8m
(b) Variations in stress ratios η = q/p′
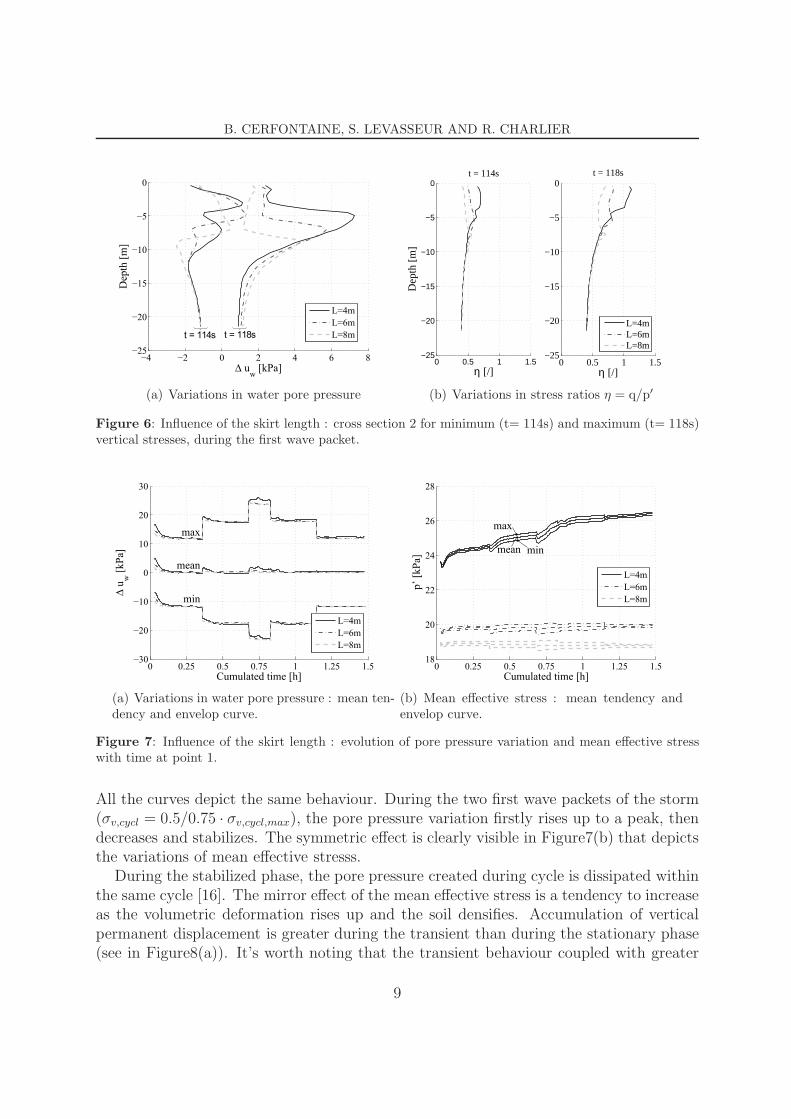
Figure 6: Influence of the skirt length : cross section 2 for minimum (t= 114s) and maximum (t= 118s)vertical stresses, during the first wave packet.
0 0.25 0.5 0.75 1 1.25 1.5−30
−20
−10
0
10
20
30
Cumulated time [h]
∆u
w[k
Pa]
L=4m
L=6m
L=8m
max
mean
min
(a) Variations in water pore pressure : mean ten-dency and envelop curve.
0 0.25 0.5 0.75 1 1.25 1.518
20
22
24
26
28
Cumulated time [h]
p’
[kP
a]
max
mean min
L=4m
L=6m
L=8m
(b) Mean effective stress : mean tendency andenvelop curve.
Figure 7: Influence of the skirt length : evolution of pore pressure variation and mean effective stresswith time at point 1.
All the curves depict the same behaviour. During the two first wave packets of the storm(σv,cycl = 0.5/0.75 · σv,cycl,max), the pore pressure variation firstly rises up to a peak, thendecreases and stabilizes. The symmetric effect is clearly visible in Figure7(b) that depictsthe variations of mean effective stresss.
During the stabilized phase, the pore pressure created during cycle is dissipated withinthe same cycle [16]. The mirror effect of the mean effective stress is a tendency to increaseas the volumetric deformation rises up and the soil densifies. Accumulation of verticalpermanent displacement is greater during the transient than during the stationary phase(see in Figure8(a)). It’s worth noting that the transient behaviour coupled with greater
9
B. CERFONTAINE, S. LEVASSEUR AND R. CHARLIER
0 0.25 0.5 0.75 1 1.25 1.5−9
−8
−7
−6
−5
−4
−3
−2
−1x 10
−3
Cumulated time [h]
Dis
p. [m
]
L=4mL=6mL=8m
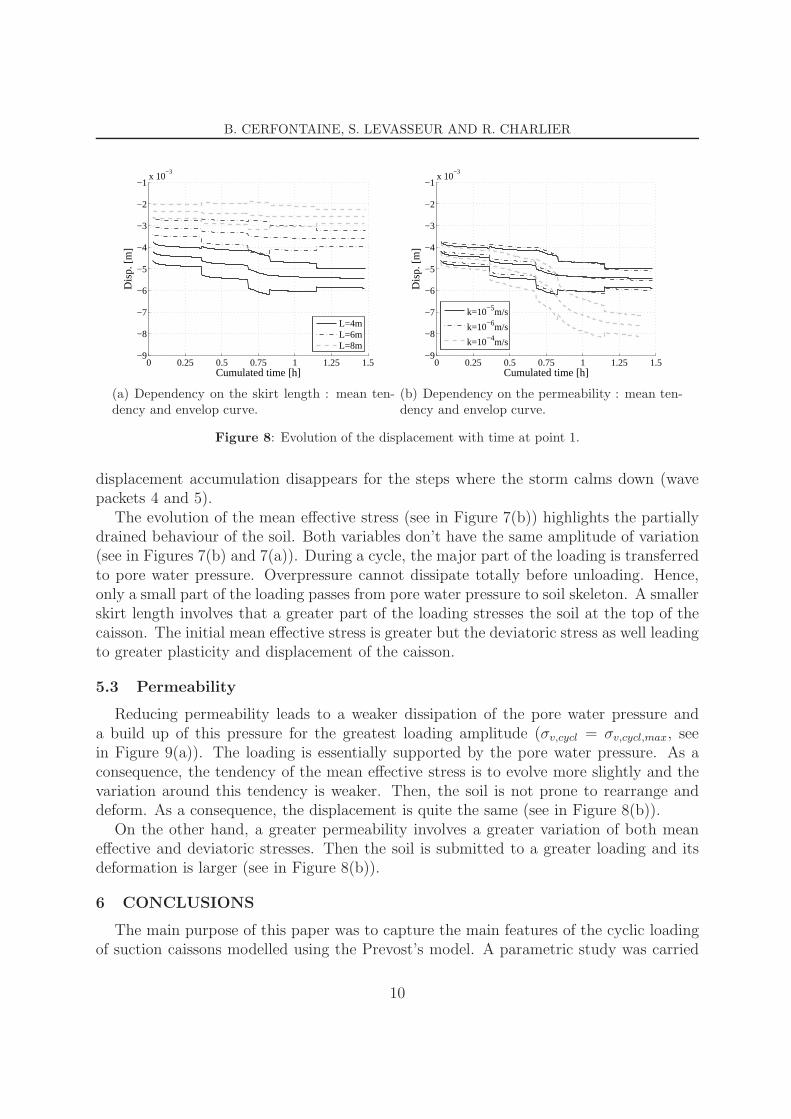
(a) Dependency on the skirt length : mean ten-dency and envelop curve.
0 0.25 0.5 0.75 1 1.25 1.5−9
−8
−7
−6
−5
−4
−3
−2
−1x 10
−3
Cumulated time [h]
Dis
p. [m
]
k=10−5m/s
k=10−6m/s
k=10−4m/s
(b) Dependency on the permeability : mean ten-dency and envelop curve.
Figure 8: Evolution of the displacement with time at point 1.
displacement accumulation disappears for the steps where the storm calms down (wavepackets 4 and 5).
The evolution of the mean effective stress (see in Figure 7(b)) highlights the partiallydrained behaviour of the soil. Both variables don’t have the same amplitude of variation(see in Figures 7(b) and 7(a)). During a cycle, the major part of the loading is transferredto pore water pressure. Overpressure cannot dissipate totally before unloading. Hence,only a small part of the loading passes from pore water pressure to soil skeleton. A smallerskirt length involves that a greater part of the loading stresses the soil at the top of thecaisson. The initial mean effective stress is greater but the deviatoric stress as well leadingto greater plasticity and displacement of the caisson.
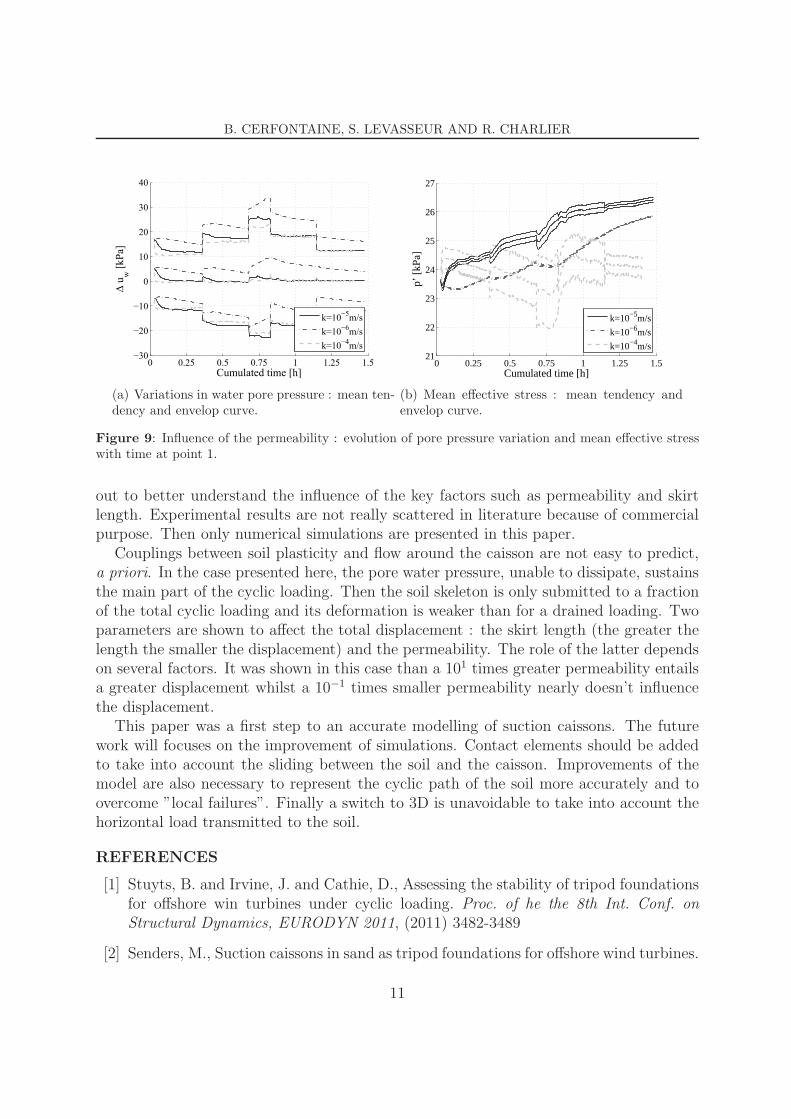
5.3 Permeability
Reducing permeability leads to a weaker dissipation of the pore water pressure anda build up of this pressure for the greatest loading amplitude (σv,cycl = σv,cycl,max, seein Figure 9(a)). The loading is essentially supported by the pore water pressure. As aconsequence, the tendency of the mean effective stress is to evolve more slightly and thevariation around this tendency is weaker. Then, the soil is not prone to rearrange anddeform. As a consequence, the displacement is quite the same (see in Figure 8(b)).
On the other hand, a greater permeability involves a greater variation of both meaneffective and deviatoric stresses. Then the soil is submitted to a greater loading and itsdeformation is larger (see in Figure 8(b)).
6 CONCLUSIONS
The main purpose of this paper was to capture the main features of the cyclic loadingof suction caissons modelled using the Prevost’s model. A parametric study was carried
10
B. CERFONTAINE, S. LEVASSEUR AND R. CHARLIER
0 0.25 0.5 0.75 1 1.25 1.5−30
−20
−10
0
10
20
30
40
Cumulated time [h]
∆uw[kPa]
k=10−5m/s
k=10−6m/s
k=10−4m/s
(a) Variations in water pore pressure : mean ten-dency and envelop curve.
0 0.25 0.5 0.75 1 1.25 1.521
22
23
24
25
26
27
Cumulated time [h]
p’ [k
Pa]
k=10−5m/s
k=10−6m/s
k=10−4m/s
(b) Mean effective stress : mean tendency andenvelop curve.
Figure 9: Influence of the permeability : evolution of pore pressure variation and mean effective stresswith time at point 1.
out to better understand the influence of the key factors such as permeability and skirtlength. Experimental results are not really scattered in literature because of commercialpurpose. Then only numerical simulations are presented in this paper.
Couplings between soil plasticity and flow around the caisson are not easy to predict,a priori. In the case presented here, the pore water pressure, unable to dissipate, sustainsthe main part of the cyclic loading. Then the soil skeleton is only submitted to a fractionof the total cyclic loading and its deformation is weaker than for a drained loading. Twoparameters are shown to affect the total displacement : the skirt length (the greater thelength the smaller the displacement) and the permeability. The role of the latter dependson several factors. It was shown in this case than a 101 times greater permeability entailsa greater displacement whilst a 10−1 times smaller permeability nearly doesn’t influencethe displacement.
This paper was a first step to an accurate modelling of suction caissons. The futurework will focuses on the improvement of simulations. Contact elements should be addedto take into account the sliding between the soil and the caisson. Improvements of themodel are also necessary to represent the cyclic path of the soil more accurately and toovercome ”local failures”. Finally a switch to 3D is unavoidable to take into account thehorizontal load transmitted to the soil.
REFERENCES
[1] Stuyts, B. and Irvine, J. and Cathie, D., Assessing the stability of tripod foundationsfor offshore win turbines under cyclic loading. Proc. of he the 8th Int. Conf. on
[2] Senders, M., Suction caissons in sand as tripod foundations for offshore wind turbines.
11
B. CERFONTAINE, S. LEVASSEUR AND R. CHARLIER
Thesis, University of Western Australia, (2008)
[3] Byrne, B.W and Houlsby, G.T., Experimental investigations of response of suctioncaissons to transient vertical loading. J. of the Geotech. and Geoenv. Eng., (2002)128:926-939
[4] Houlsby, G.T., Suction caissons for wind turbines. Proceedings of the international
symposium on frontiers in offshore geotechnics, (2005) 75-94
[5] Houlsby, G.T. and Kelly, R.B. and Huxtable, J. and Byrne B.W, Field trials ofsuction caissons in sand for offshore wind turbine foundations Geotechnique, (2006)56:3-10
[6] Taiebat, H.A., Three dimensional liquefaction analysis of offshore foundations. The-sis, University of Sydney, (1999)
[7] Prevost, J.H., A simple plasticity theory for frictional cohesionless soils. Soil Dynam-
ics and Earthquake Engineering, (1985) 4:9-17
[8] Yang,Z. and Elgamal, A., Multi-surface cyclic plasticity sand model with lode angleeffect. Geotechnical and Geological Engineering, (2008) 26:335-348
[9] Prevost, J.H. and Hughes, T.J.R. and Cohen, M.F., Analysis of gravity offshorestructure foundations Journal of Petroleum Technology, (1980) 32:199-209
[10] Ishihara, K. and Tatsuoka, F. and Yasuda, S. , Undrained deformation and liquefac-tion of sand under cyclic stress. Soils and Foundations, (1975) 15:29-44
[11] Ibsen, L.B. and Jakobsen, F.R. , Lund sand No 0, Data Report 8401, 8402, 8801 &
[12] Hyodo, M. and Hyde, A.F.L. and Aramaki, N. and Nakata, Y., Undrained monotonicand cyclic shear behaviour of sand under low and high confining stresses. Soils and
Foundations, (2002) 42:63-76
[13] Rahman, M.S. and Seed, H.B. and Booker, J.R., Pore pressure development underoffshore gravity structures. J. of the Geotech. Eng. Div. ASCE, (1977) 103:1419-1436
[14] Lee, K.L. and Focth, J.A., Liquefaction potential at Ekofisk tank in North Sea J. of
the Geotech. Eng. Div. ASCE, (1975) 101:1-18
[15] DNV, Foundations, classification notes No 30.4, - Foundations, Det Norske Veritas,Høvik, Norway, (1992)
[16] Ibsen, L.B., The mechanism controlling static liquefaction and cyclic strength of sandProc. of Int. Workshop on Physics and Mechanics of Soil Liquefaction, Baltimore,(1998) Soil Mechanichs Laboratory, Aalborg University, Denmark