Azadinium obesum (Dinophyceae), a new nontoxic species in the genus that can produce azaspiracid toxins URBAN TILLMANN 1 *, MALTE ELBRA ¨ CHTER 2 ,UWE JOHN 1 ,BERND KROCK 1 AND ALLAN CEMBELLA 1 1 Alfred Wegener Institute for Polar and Marine Research, Am Handelshafen 12, D-27570 Bremerhaven, Germany 2 Deutsches Zentrum fu ¨r Marine Biodiversita ¨tsforschung, Forschungsinstitut Senckenberg, Wattenmeerstation Sylt, Hafenstr. 43, D-25992 List/Sylt, Germany TILLMANN U., ELBRA ¨ CHTER M., JOHN U., KROCK B. AND CEMBELLA A. 2010. Azadinium obesum (Dinophyceae), a new nontoxic species in the genus that can produce azaspiracid toxins. Phycologia 49: 169–182. DOI: 10.2216/09-35.1 The novel dinoflagellate taxon we describe here as Azadinium obesum sp. nov. was isolated as clone 2E10 from the North Sea along the Scottish east coast, the same locality as for Azadinium spinosum Elbra ¨chter et Tillmann, the type and formerly only species for this genus. In contrast to A. spinosum, a known producer of azaspiracid (AZA) toxins, the isolate of A. obesum produces no known AZA analogues detectable by liquid chromatography coupled with tandem mass spectrometry. Azadinium obesum is a small (13–18 mm length; 10–14 mm width) photosynthetic dinoflagellate with a thin theca exhibiting the Kofoidean plate tabulation: Po, cp, X, 49, 3a, 60, 6C, 5?S, 690,200. This species is morphologically distinguished from A. spinosum by slightly larger mean cell size, consistent absence of an antapical spine, the lack of a stalked pyrenoid and several details of the plate configuration. Among these thecal features, the first precingular (10) plate of A. obesum does not touch the first epithecal intercalary plate and is four sided rather than five sided as in A. spinosum. Furthermore, in A. obesum the lower half of the first apical (19) plate is very narrow and tongue- like, and precingular plates 10 and 60 are very close together, whereas these diverge in A. spinosum. DNA sequence and phylogenetic analysis elucidates and supports the separation (but close affinity) of A. obesum and A. spinosum, as well as the description of the former as a distinct species. Phylogenetic interpretation of the four genes analysed – internal transcribed spacer, 18S rDNA, 28S rDNA (D1/D2) and cytochrome oxidase I – further validates the recently erected genus Azadinium Elbra ¨cher et Tillmann but does not clarify the position of the genus with respect to higher taxonomic levels within the subclass Peridiniphycidae. KEY WORDS: Dinoflagellates, Taxonomy, Phylogeny, New species, Azadinium INTRODUCTION Azaspiracids (AZAs) are a relatively recently discovered group of lipophilic marine biotoxins associated with human incidents of shellfish poisoning. After the first case of human poisoning in 1995 (McMahon and Silke 1996), AZA toxins have been reported from several countries mainly of western Europe but also from Morocco (Satake et al. 1998; Ito et al. 2002; James et al. 2002; Magdalena et al. 2003; Taleb et al. 2006; Vale et al. 2008). Considerable work has been done to understand the chemistry, toxicology and ecology of azaspiracid shellfish poisoning (AZP) (recently reviewed by Twiner et al. 2008). However, it took about a decade before the first correct and unambiguous identifi- cation of an organism responsible for production of azaspiracids (Krock et al. 2009, Tillmann et al. 2009). The species, a small photosynthetic dinoflagellate, described as Azadinium spinosum Elbra ¨chter & Tillmann, was isolated from coastal waters off the Scottish east coast but was also detected by molecular methods in samples taken from the Danish coast (Krock et al. 2009), indicating a wide distribution in the North Sea. Azadinium spinosum, a new species in a newly erected genus, clearly belongs to the subclass Peridiniphycidae; however, neither morphology nor phylogeny was able to provide sufficient and conclusive arguments for a definite placement of A. spinosum at higher taxonomic levels (Tillmann et al. 2009). The successful isolation of A. spinosum was facilitated by the targeted guidance of liquid chromatography coupled with tandem mass spectrometry (LC-MS/MS) screening of a large number of raw cultures on the presence of azaspiracids (Krock et al. 2008, 2009). Here we report the isolation and identification of a dinoflagellate species from one of the raw cultures found to be negative in the AZA-screening but which attracted attention by a swimming pattern identical to that described for A. spinosum. Further morphological and molecular analysis revealed this isolate as a representative of a new species within the genus Azadinium, which does not produce AZAs in measurable amounts. MATERIAL AND METHODS Isolation and culture of the dinoflagellate The culture of Azadinium obesum sp. nov., provisionally designated as dinoflagellate isolate 2E10, was established from a water sample collected in June 2007 by Niskin bottle from a rosette sampler cast in the North Sea along the Scottish east coast at 57u3.99N, 02u30.29W, the type locality for A. spinosum. From a prescreened (20-mm Nitex gauze) sample, three dilutions (1:10, 1:100, 1:400) were prepared with sterile-filtered seawater (0.2-mm VacuCap filters, * Corresponding author ([email protected]). Phycologia (2010) Volume 49 (2), 169–182 Published 3 March 2010 169
Transcript
Azadinium obesum (Dinophyceae), a new nontoxic species in the genus that can
produce azaspiracid toxins
URBAN TILLMANN1*, MALTE ELBRACHTER
2, UWE JOHN1, BERND KROCK
1AND ALLAN CEMBELLA
1
1Alfred Wegener Institute for Polar and Marine Research, Am Handelshafen 12, D-27570 Bremerhaven, Germany2Deutsches Zentrum fur Marine Biodiversitatsforschung, Forschungsinstitut Senckenberg, Wattenmeerstation Sylt, Hafenstr.
43, D-25992 List/Sylt, Germany
TILLMANN U., ELBRACHTER M., JOHN U., KROCK B. AND CEMBELLA A. 2010. Azadinium obesum (Dinophyceae), a newnontoxic species in the genus that can produce azaspiracid toxins. Phycologia 49: 169–182. DOI: 10.2216/09-35.1
The novel dinoflagellate taxon we describe here as Azadinium obesum sp. nov. was isolated as clone 2E10 from the NorthSea along the Scottish east coast, the same locality as for Azadinium spinosum Elbrachter et Tillmann, the type andformerly only species for this genus. In contrast to A. spinosum, a known producer of azaspiracid (AZA) toxins, theisolate of A. obesum produces no known AZA analogues detectable by liquid chromatography coupled with tandemmass spectrometry. Azadinium obesum is a small (13–18 mm length; 10–14 mm width) photosynthetic dinoflagellate witha thin theca exhibiting the Kofoidean plate tabulation: Po, cp, X, 49, 3a, 60, 6C, 5?S, 690, 200. This species ismorphologically distinguished from A. spinosum by slightly larger mean cell size, consistent absence of an antapicalspine, the lack of a stalked pyrenoid and several details of the plate configuration. Among these thecal features, the firstprecingular (10) plate of A. obesum does not touch the first epithecal intercalary plate and is four sided rather than fivesided as in A. spinosum. Furthermore, in A. obesum the lower half of the first apical (19) plate is very narrow and tongue-like, and precingular plates 10 and 60 are very close together, whereas these diverge in A. spinosum. DNA sequence andphylogenetic analysis elucidates and supports the separation (but close affinity) of A. obesum and A. spinosum, as well asthe description of the former as a distinct species. Phylogenetic interpretation of the four genes analysed – internaltranscribed spacer, 18S rDNA, 28S rDNA (D1/D2) and cytochrome oxidase I – further validates the recently erectedgenus Azadinium Elbracher et Tillmann but does not clarify the position of the genus with respect to higher taxonomiclevels within the subclass Peridiniphycidae.
KEY WORDS: Dinoflagellates, Taxonomy, Phylogeny, New species, Azadinium
INTRODUCTION
Azaspiracids (AZAs) are a relatively recently discovered
group of lipophilic marine biotoxins associated with human
incidents of shellfish poisoning. After the first case of
human poisoning in 1995 (McMahon and Silke 1996), AZA
toxins have been reported from several countries mainly of
western Europe but also from Morocco (Satake et al. 1998;
Ito et al. 2002; James et al. 2002; Magdalena et al. 2003;
Taleb et al. 2006; Vale et al. 2008). Considerable work has
been done to understand the chemistry, toxicology and
ecology of azaspiracid shellfish poisoning (AZP) (recently
reviewed by Twiner et al. 2008). However, it took about a
decade before the first correct and unambiguous identifi-
cation of an organism responsible for production of
azaspiracids (Krock et al. 2009, Tillmann et al. 2009). The
species, a small photosynthetic dinoflagellate, described as
Azadinium spinosum Elbrachter & Tillmann, was isolated
from coastal waters off the Scottish east coast but was also
detected by molecular methods in samples taken from the
Danish coast (Krock et al. 2009), indicating a wide
distribution in the North Sea. Azadinium spinosum, a new
species in a newly erected genus, clearly belongs to the
subclass Peridiniphycidae; however, neither morphology
nor phylogeny was able to provide sufficient and conclusive
arguments for a definite placement of A. spinosum at higher
taxonomic levels (Tillmann et al. 2009).
The successful isolation of A. spinosum was facilitated by
the targeted guidance of liquid chromatography coupled
with tandem mass spectrometry (LC-MS/MS) screening of a
large number of raw cultures on the presence of azaspiracids
(Krock et al. 2008, 2009). Here we report the isolation and
identification of a dinoflagellate species from one of the raw
cultures found to be negative in the AZA-screening but
which attracted attention by a swimming pattern identical to
that described for A. spinosum. Further morphological and
molecular analysis revealed this isolate as a representative of
a new species within the genus Azadinium, which does not
produce AZAs in measurable amounts.
MATERIAL AND METHODS
Isolation and culture of the dinoflagellate
The culture of Azadinium obesum sp. nov., provisionally
designated as dinoflagellate isolate 2E10, was established
from a water sample collected in June 2007 by Niskin bottle
from a rosette sampler cast in the North Sea along the
Scottish east coast at 57u3.99N, 02u30.29W, the type locality
for A. spinosum. From a prescreened (20-mm Nitex gauze)
sample, three dilutions (1:10, 1:100, 1:400) were prepared
with sterile-filtered seawater (0.2-mm VacuCap filters,* Corresponding author ([email protected]).
Phycologia (2010) Volume 49 (2), 169–182 Published 3 March 2010
169
Dreieich, Germany) from the same station and enriched
with 1/10-strength K-medium (Keller et al. 1987). From
each dilution, four 96-well plates were filled with 200 ml per
well. Plates were sealed with parafilm and incubated at
10uC and at a photon flux density of c. 20 mmol m22 s21
(16:8-h light:dark photocycle) in a controlled environment
growth chamber throughout the cruise. After the cruise,
cultures were transferred to a laboratory incubator
maintained at 15uC and 50 mmol m22 s21 on a 16:8-h
light:dark photocycle.
The main aim of the serial dilution setup was to isolate
potential producers of azaspiracids (Krock et al. 2009).
Screening for toxins of the crude plankton cultures initiated
on board ship revealed that only one multispecies culture
contained AZA. Later on, a dinoflagellate from this well
was isolated in unialgal culture and described as A.
spinosum Elbrachter & Tillmann (Tillmann et al. 2009). A
large number of other crude cultures negative in the
azaspiracid screening were still maintained but without
attracting further interest until a cursory microscopic
screening at low magnification revealed small dinoflagellate
cells in one well with a swimming pattern typical for the
newly characterized A. spinosum (Tillmann et al. 2009).
Pure unialgal cultures of the small dinoflagellate present in
this well were prepared by transferring and washing groups
of individual cells by microcapillary into wells of 96-well
plates with 1/10-strength K-medium. As soon as subcul-
tures were free of autotrophic contaminants, culture
volume was gradually increased, and cultures were routine-
ly kept in 70-ml tissue culture flasks containing 1/10-
strength K medium (Keller et al. 1987), supplemented with
selenite (Dahl et al. 1989), but without addition of NHz4 .
The growth medium was prepared from sterile-filtered
(VacuCap 0.2 mm Pall Life Sciences) natural North Sea
water (salinity: 32 psu, pH adjusted to 8.0). Experimental
cultures for photosynthetic pigment and toxin analysis were
grown separately in Erlenmeyer flasks at 20uC under a
photon irradiance of 25 mmol m22 s21 on a 16:8-h light:-
dark photocycle.
Light microscopy
Observation of live cultured cells was carried out with a
stereomicroscope (Olympus SZH-ILLD) and with an
inverted microscope (Axiovert 200 M, Zeiss, Germany)
equipped with epifluorescence and differential interference
contrast optics. Light microscopic examination of the thecal
plate tabulation was performed on formalin-fixed cells (1%
final concentration) stained with calcofluor white (Fritz &
Triemer 1985). The shape and localisation of the nucleus was
determined after staining of formalin-fixed cells for 10 min
with 49-6-diamidino-2-phenylindole (0.1 mg ml21 final con-
centration). Photographs were taken with a digital camera
(Axiocam MRc5, Zeiss, Germany) connected to the inverted
microscope.
Scanning electron microscopy
For examination of thecal plates by scanning electron
microscopy (SEM), cells from growing cultures were fixed,
prepared and collected on 3-mm polycarbonate filters
(Millipore) as described by Tillmann et al. (2009). Filters
were mounted on stubs, sputter-coated (Emscope SC500,
Ashford, UK) with gold-palladium and viewed under a
scanning electron microscope (FEI Quanta FEG 200,
Eindhoven, Netherlands). Some SEM micrographs were
presented on a black background using Adobe Photoshop
6.0 (Adobe Systems, San Jose, CA, USA). Cell size of A.
obesum was measured from SEM images of whole cells and
was compared to cell size of A. spinosum determined by the
same image analysis method (Tillmann et al. 2009). SEM
stubs used for micrographs shown in the figures were
numbered and archived at the Alfred Wegener Institute,
Bremerhaven, Germany.
Morphological description and taxonomic assignment
We adopted the general dinoflagellate classification scheme
proposed by Fensome et al. (1993) for the assignment of
this novel taxon. In describing the thecal plate tabulation,
we employed the nomenclature of Kofoid (1909). The
designation of the putatively subdivided thecal plates is
directly adopted from Morrill & Loeblich (1981).
Photosynthetic pigment analysis
The pigment profile as a potential phenotypic marker was
analyzed by liquid chromatography coupled to diode array
detection (LC-DAD) by spectroscopy. At a cell concentra-
tion of 2.2 3 104 cells ml21 (determined by microscopical cell
counts), 60 ml of culture were gently filtered upon a glass-
fibre filter (GF/C, Whatman, Kent, UK). The filter was
immediately shock-frozen in liquid nitrogen and stored at
220uC for 10 d before being analyzed. Pigments were
extracted and analysed as described in Tillmann et al. (2009).
Chemical analysis of azaspiracids
The close putative taxonomic relationship between A.
obesum and the known AZA-producer A. spinosum
warranted an intensive analysis for the presence of AZAs.
After 2 wk of growth, 6 3 50 ml of A. obesum culture were
harvested at a cell concentration of 3.5 3 104 ml21,
determined by microscopical cell counts. Samples were
centrifuged (Eppendorf 5810R, Hamburg, Germany) at
3220 3 g for 10 min in 50-ml Falcon tubes. Cell pellets were
combined in a Eppendorf microtube and again centrifuged
(Eppendorf 5415, 16,000 3 g, 5 min). The cell pellet was
suspended in 500 ml methanol, and transferred into a
FastPrep tube containing 0.9 g of lysing matrix D (Thermo
Savant, Illkirch, France). The sample was homogenized by
reciprocal shaking at maximum speed (6.5 m s21) for 45 s
in a Bio101 FastPrep instrument (Thermo Savant, Illkirch,
France). After homogenization, samples were centrifuged
(Eppendorf 5415 R) at 16,100 3 g at 4uC for 15 min. The
supernatant (400 ml) was transferred to a 0.45-mm-pore-size
spin filter (Millipore Ultrafree, Eschborn, Germany) and
centrifuged for 30 s at 800 3 g. The filtrate was transferred
into an LC autosampler vial for LC-MS/MS analysis.
The sample was analysed for azaspiracids by LC-MS/MS
according to the methods described in detail by Tillmann et
AZA-9 and AZA-10: m/z 858 . 840 CE: 40 V and (6) AZA-
11 and AZA-12: m/z 872 . 854 CE: 40 V.
Molecular phylogenetic analysis
EXTRACTION OF GENOMIC DNA: A 10-ml sample of an
exponentially growing culture of A. obesum isolate 2E10
was centrifuged (Eppendorf 5810R) at 3220 3 g for 15 min
at room temperature. The cell pellet was frozen at 220uCfor 20 min before subjected to total DNA extraction with
the DNeasy Kit (Mini) (Qiagen, Hilden, Germany)
according to manufacturer’s instructions. The purity and
quantity of the DNA was checked by UV spectroscopy with
a NanoDrop ND-1000 system (Peqlab, Erlangen, Ger-
many), and the integrity of DNA fragments of a molecular
weight of about 20 kb was verified on a 0.8% agarose gel.
PCR AMPLIFICATION AND SEQUENCING: The extracted total
DNA from the A. obesum isolate 2E10 was subjected to
polymerase chain reaction (PCR) amplification of the
following genes: 18S ribosomal DNA, 28S ribosomal
DNA (D1/D1 region), internal transcribed spacer (ITS)
and cytochrome oxidase subunit 1 (COI). The forward and
reverse primers for amplification of full length 18S rDNA
were 1F (59-AAC CTG GTT GAT CCT GCC AGT-39)
and 1528R (59-TGA TCC TTC TGC AGG TTC ACC
TAC-39), respectively. The forward and reverse primers for
Table 1. Selected substitution model parameters obtained with Modeltest version 3.7 (Posada & Crandall 1998; Posada & Buckley 2004) foreach of the four marker regions utilized in this study.
MarkerLength ofalignment
AICmodel1 Base frequencies
Base substitutionfrequencies2
Proportion ofinvariable sites (I)
Gamma distributionshape parameter (a)
SSU 1044 GTR+I+G A 5 0.2787 A C 5 1.0012 0.3426 0.5099C 5 0.1713 A G 5 4.1105G 5 0.2552 A T 5 1.3222T 5 0.2948 C G 5 0.6423
C T 5 9.2563LSU 449 GTR+G A 5 0.2337 A C 5 0.6389 0.0820 0.7419
C 5 0.1958 A G 5 2.5942G 5 0.2783 A T 5 0.9062
C G 5 0.5688T 5 0.2922 C T 5 5.7956
ITS 538 GTR+I+G A 5 0.2281 A C 5 0.7557 0.0363 0.8373C 5 0.2035 A G 5 2.5567G 5 0.2477 A T 5 1.1170T 5 0.3207 C G 5 0.6039
C T 5 4.2067COI 620 GTR+G A 5 0.2623 A C 5 1.4505 — 0.8468
C 5 0.1811 A G 5 2.5285G 5 0.1266 A T 5 1.9068T 5 0.4300 C G 5 2.7492
C T 5 1.8572
1 Akaike information criterion.2 Relative to G T set at 1.0000.
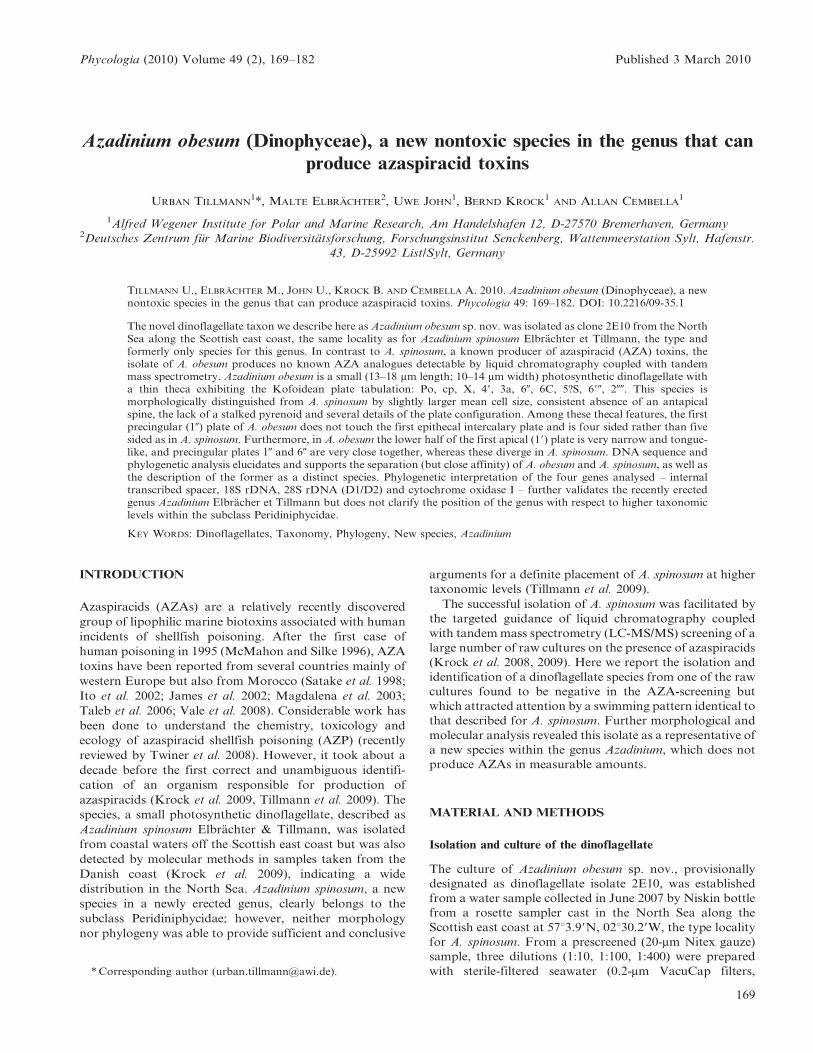
Figs 1–4. Azadinium obesum. Light microscopy. Scale bar 5 5 mm.Figs 1, 2. Light microscopy of live cells.Figs 3, 4. Light microscopy of formalin-fixed cells. APC 5 apical pore complex; N 5 nucleus.
Tillmann et al.: Azadinium obesum sp. nov. 171
amplification of 28S rDNA (D1–D2 regions) were Dir-F
(59-ACC CGC TGA ATT TAA GCA TA-39) and Dir-2CR
(59-CCT TGG TCC GTG TTT CAA GA-39), respectively.
The forward and reverse primers for amplification of the ITS
region were ITS a (59-CCA AGC TTC TAG ATC GTA
ACA AGG (ACT)TC CGT AGG T-39) and ITS b (59-CCT
GCA GTC GAC A(GT)A TGC TTA A(AG)T TCA
GC(AG) GG-39), respectively. The following primers were
used for amplification of the cytochrome oxidase 1 (COI)
gene: COIF (59-AAAAATTGTAATCATAAACGCTTA-
GG-39) and COIR (59-TGTTGAGCCACCTATAGTAAA-
CATTA-39) (Zhang et al. 2005).
For each 50-ml PCR reaction, HotMasterTaq (Eppendorf)
buffer 13, 0.1 mM of dNTPs, 0.1 mM of each forward and
reverse primer and 1.25 units of Taq polymerase were added
to 10–30 ng of the extracted genomic DNA.
For 18S and 28S rDNA amplifications, the reactions
were subjected to the following thermocycling conditions:
an initial denaturation at a temperature of 95uC for 7 min
was followed by 35 cycles of denaturation at 94uC for 45 s,
annealing temperature at 54uC for 2 min and elongation
temperature at 72uC for 1.5 min. A final extension step at
72uC was carried out for 10 min.
For ITS amplifications, the reactions were subjected to
the following thermocycling conditions: an initial denatur-
ation at a temperature of 94uC for 4 min was followed by
nine cycles of denaturation at 94uC for 50 s, annealing
temperature at 60uC for 40 s and elongation temperature at
72uC for 1 min, then 29 cycles of denaturation at 94uC for
45 s, annealing temperature at 50uC for 45 s and elongation
temperature at 72uC for 1 min. A final extension step at
72uC was carried out for 5 min.
For COI amplifications, the reactions were subjected to
the following thermocycling conditions: an initial denatur-
ation at a temperature of 94uC for 3 min was followed by
39 cycles of denaturation at 94uC for 30 s, annealing
temperature at 46uC for 30 s and elongation temperature at
70uC for 1 min. A final extension step at 70uC was carried
out for 5 min.
The completed reactions for all of the above amplifica-
tions were kept at 10uC until the next step. The PCR
amplicons were analyzed on 1% agarose by electrophoresis.
SEQUENCE ALIGNMENT FOR PHYLOGENETIC ANALYSES: Se-
quence alignment was done with CLUSTAL X software
(Thompson et al. 1997) and improved manually for all
sequences; ambiguous alignments positions were excluded
for the analysis. Alignments are available upon request, and
sequences are available at GenBank under accession
numbers GQ914935 (SSU), GQ914936 (LSU), FJ766093
(ITS), and GQ914937 (COI). Maximum likelihood phylo-
genetic trees for all genes were calculated with PhyML
(Guindon & Gascuel 2003) using a BIO-NJ (neighbour-
joining) tree as a starting tree, the WAG evolutionary
model (Whelan & Goldman 2001), with a gamma
distribution parameter estimated from the data. For the
SSU, LSU, and ITS of rDNA and the COI, we used
Oxyrrhis marina Dujardin as out-group. An optimal base
substitution model was calculated with Modeltest (Posada
(Felsenstein 1985) using maximum parsimony (MP) and NJ
using the AIC model parameters described above (Table 1).
The bootstrap analyses were done in 1000 replicates for MP
and NJ and with 100 replicates for the maximum likelihood
analysis.
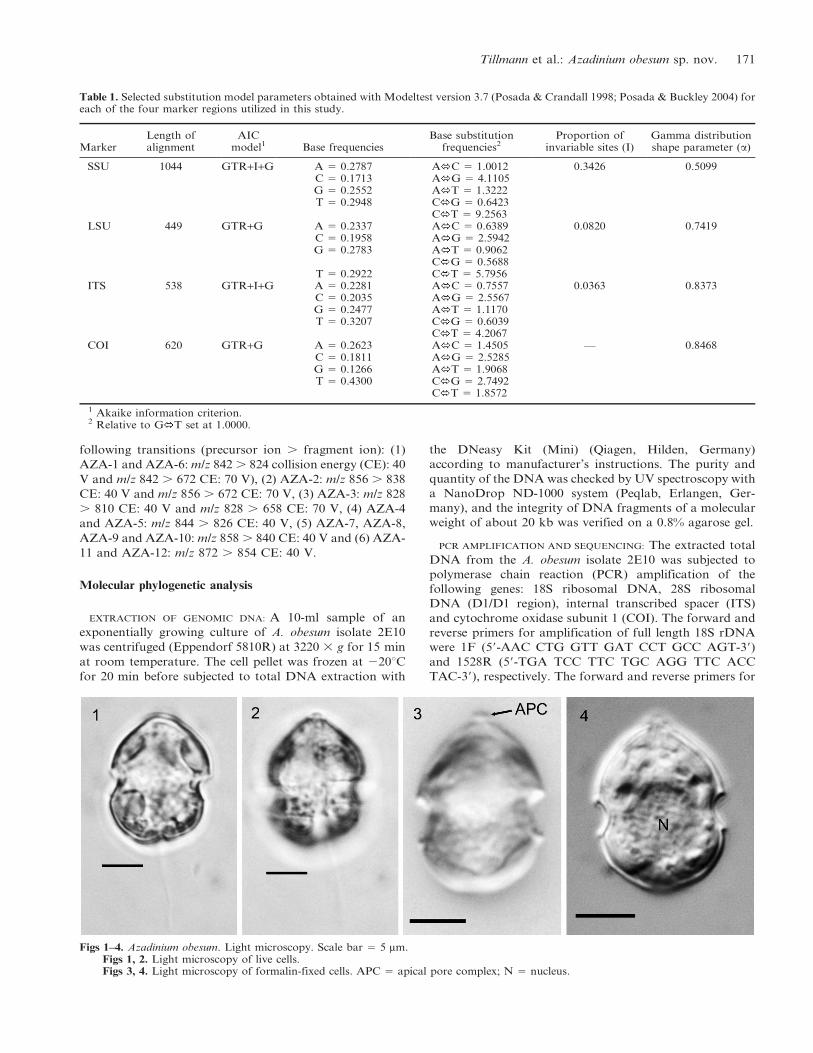
Figs 5–8. Azadinium obesum. SEM pictures of thecae of differentcells (from 14/02/08-3 and 14/02/08-5). Scale bar 5 5 mm.
Fig. 5. Cell in ventral view (14/02/08-3).Fig. 6. Cell in left-lateral view (14/02/08-5).Fig. 7. Cell in dorsal view (14/02/08-3).Fig. 8. Cell in right-lateral view (14/02/08-5).
Fig. 9. Size of Azadinium obesum as measured from SEM pictures(n 5 36), compared to size of A. spinosum (n 5 73). T test statisticsfor the comparison are given in the lower left part of each graph.
172 Phycologia, Vol. 49 (2), 2010
RESULTS
Azadinium obesum sp. nov. Tillmann & Elbrachter
Figs 1–8, 10–13, 16–33
DIAGNOSIS: Differt de A. spinosum in absencia de spinum
antapicaliter. Lamella primus praecingularis non contact
lamella primus intercalaris epithecalis. Chloroplastis sine
pyrenoideum apparente in microscopus lucidum. Formula
Differs from A. spinosum in the absence of an antapical
spine. The first precingular plate does not touch the first
epithecal intercalary plate. Chloroplast without visible
pyrenoid in the light microscope. Plate tabulation: Po, cp,
X, 49, 3a, 60, 6C, 5?S, 690, 200. Cell length is about 13–18 mm,
cell width about 10–14 mm.
HOLOTYPE: SEM-stub (original stub nr. 14/2/08-3, new
designation nr. CEDiT2009H4), deposited at the Sencken-
berg Research Institute and Natural History Museum,
Centre of Excellence for Dinophyte Taxonomy, Germany.
ISOTYPE: Formalin-fixed sample (designation CE-
DiT2009I5), deposited at the Senckenberg Research Insti-
tute and Natural History Museum, Centre of Excellence for
Dinophyte Taxonomy, Germany.
TYPE LOCALITY: 57u3.99N, 02u30.29W, North Sea off
Scotland.
HABITAT: Marine plankton.
ETYMOLOGY: The epithet refers to the obese, corpulent
appearance of the species when compared to the more
slender shape of the type, A. spinosum.
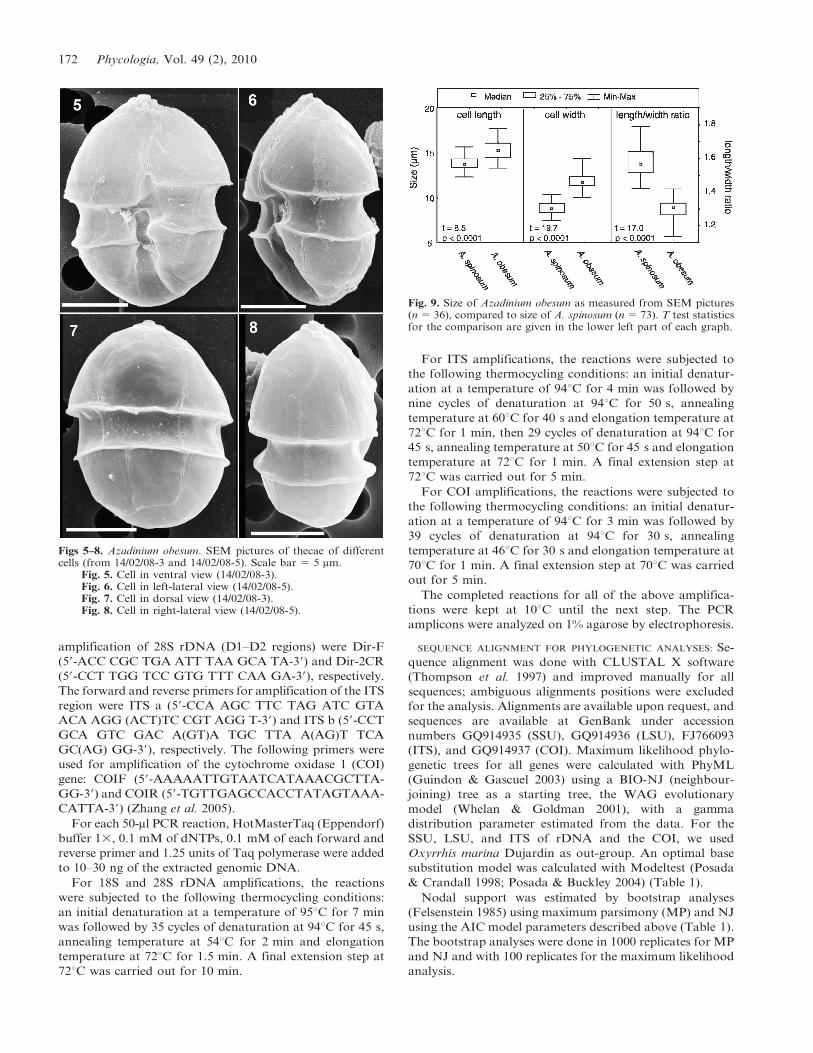
Figs 10–15. Azadinium spp. SEM pictures of different cells showing details of the apical pore complex (from 14/02/08-3, 24/06/08-3 or 02/12/08-1). Scale bar 5 0.5 mm.
Figs 10, 11. Azadinium obesum viewed from outside of the cell (14/02/08-3).Figs 12, 13. Azadinium obesum viewed from inside of the cell (14/02/08-3). Po 5 pore plate; cp 5 cover plate; X 5 X-plate.Figs 14, 15. Azadinium spinosum, APC in apical view (14: 24/06/08-3, 15: 02/12/08-1). Note that in Fig. 15 the cover plate, althoughdetached from the pore, is still connected to the finger-like protrusion of the X-plate.
Tillmann et al.: Azadinium obesum sp. nov. 173
Cell morphology
Cells of A. obesum are ovoid and dorsoventrally com-
pressed. The hemispherical episome ends with a conspicu-
ous apical pore complex (APC) and is slightly larger than
the hemispherical hyposome. The cingulum is deep and
wide, roughly accounting for one-fifth of total cell length.
Cells are small and range from 13.3 to 17.7 mm in length
and 10.0 to 14.3 mm in width (median length: 15.3, median
width 11.7 mm, n 5 36; theca measurement from SEM
images, Fig. 9) with a median length-to-width ratio of 1.3.
The large nucleus is spherical and located in the posterior
part of the cell (Fig. 4). A single chloroplast is parietally
arranged and lobed and extends into both epi- and
hyposome (Fig. 3). In the light microscope, no pyrenoid
is visible.
Under the light microscope, living cells superficially
obesum cells, however, possess delicate thecal plates, which
can be readily seen in the light microscope (Figs 2–4). The
delicate theca can be stained with calcofluor white (not
shown), but due to the small size and the delicate nature of
the plates, detailed analysis of the plate pattern using
fluorescence microscopy proved difficult. In any case, the
plate pattern resolved by SEM (Figs 16–28) was in
accordance with that analysed from calcofluor-stained cells.
Generally, the surface of the plates is smooth but irregularly
covered by pores of different size (ranging from 0.07 to
0.14 mm in diameter).
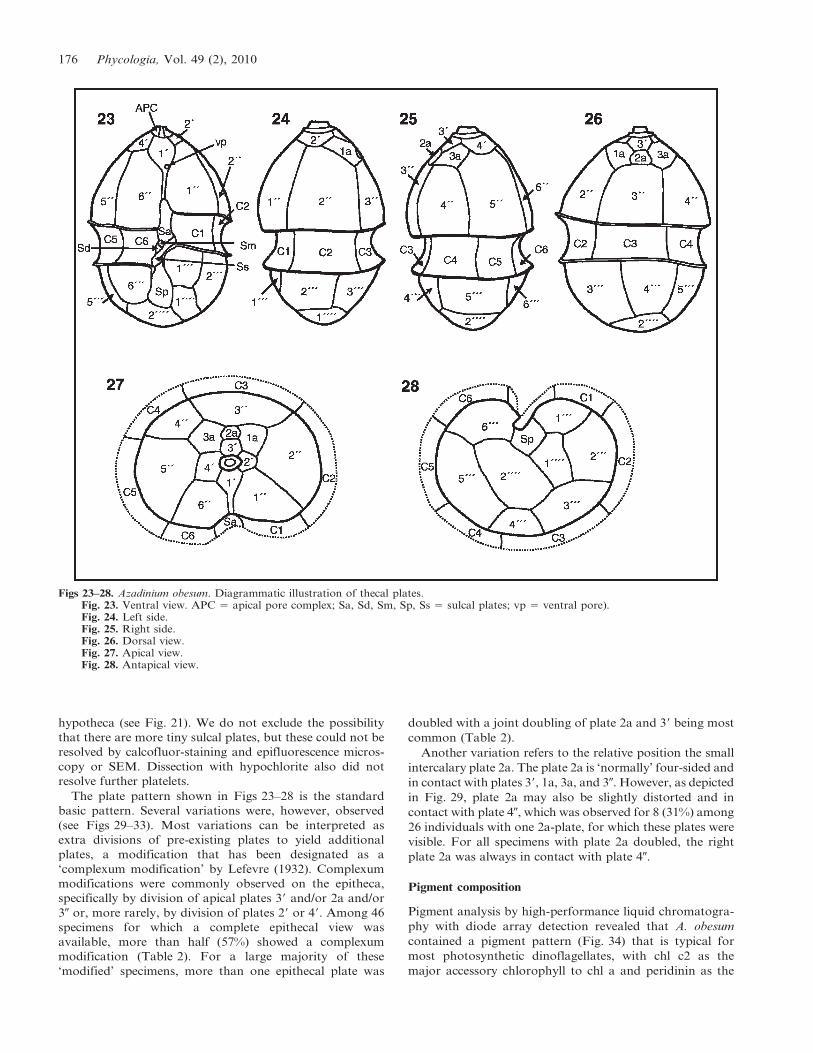
The basic thecal plate arrangement was determined as
Po, cp, X, 49, 3a, 60, 6C, 5?S, 690, 200 and is as drawn in
Figs 23–28. The apical pore is round or slightly ellipsoid; it
Figs 16–20. Azadinium obesum. SEM pictures (from 14/02/08-3 and 14/02/08-4) of different cells showing epithecal plates (Figs 16–19) andhypothecal plates (Fig. 20). Scale bar 5 2 mm.
Figs 16, 17. Apical view showing the whole series of epithecal plates (14/02/08-4).Figs 18, 19. Ventral view showing the apical pore complex (APC) with the finger-like protrusion (arrowhead) and the ventral pore(vp) (14/02/08-3).Fig. 20. Antapical view showing the whole series of hypothecal plates (14/02/08-3).
174 Phycologia, Vol. 49 (2), 2010
is located in the centre of a pore plate and is covered by a
cover plate. The pore plate is bordered by a conspicuous
rim, which runs around from dorsal to both lateral sides
but is lacking ventrally, where the pore plate abuts the first
apical plate and the small X-plate. This latter plate roughly
occupies one-third of the connection between Po and 19 and
semicircularly invades the first apical plate. Generally, the
Po-X-19 connection is slightly asymmetric in that the suture
right from the X-plate is located closer to the apical pore
compared to the left suture (Figs 10–13). The X-plate has a
very characteristic three-dimensional structure with finger-
like protrusions contacting the cover plate (Figs 10, 11).
From outside it looks as if the suture of the X-plate runs
through the whole pore-plate (Fig. 11) up to the rim of the
apical pore. However, when seen from inside the cell, it is
obvious that the X-plate is small and ovoid (Figs 12, 13).
The same apical pore complex configuration has been
recently discovered in A. spinosum (Figs 14, 15).
The apical series is composed of four plates. Plate 19 is of
the ortho pattern but slightly asymmetric, and the suture
joining plate 60 is shorter than that joining plate 10
(Figs 16–19). The lower half of plate 19 is very narrow
(Figs 5, 17, 19).
A ventral pore is present on the left margin of plate 19
(Figs 17–19). Plates 29 and 39 are small. Plate 49 is slightly
larger and obvious in ventral view; whereas, plate 29 is
displaced more dorsally, causing the asymmetry of plate 19.
The three intercalary plates are arranged more or less
symmetrically on the dorsal side of the epitheca. All
intercalary plates are quite small with the four-sided plate
2a being the smallest (Figs 16, 17). The six precingular
plates are of comparable size. Both ventral precingular
plates (10, 60) are five-sided and only in contact with three
apical plates but not with an intercalary plate (Figs 16, 17).
The hypotheca has a plate arrangement consisting of six
postcingular and two antapical plates (Fig. 20). All post-
cingular plates are of comparable size, but the four-sided
plate 490 is the smallest; whereas, plate 590 (also four-sided)
is the largest. The two antapical plates are of markedly
different size, with plate 100 slightly displaced to the left.
The cingulum is wide, descending, displaced by about half
of its width, and is composed of six plates of almost equal
size (Fig. 21). Narrow cingular lists are present, particularly
on the posterior cingulum fringe. In addition, a convexity of
the sixth cingular plate partly covers the sulcal area and the
flagellar pore region (Figs 5, 22). The plate pattern of the
deeply concave sulcus is difficult to resolve and interpret. The
large anterior sulcal plate (Sa) partly invades the epitheca;
whereas, the large posterior sulcal plate (Sp) extends two-
thirds of the way from the cingulum to the antapex. A left
sulcal plate Ss is located anterior to Sp and abuts plates 190,
C1, Sa, Sd, Sm and Sp. The right sulcal plate Sd abuts sulcal
plates Ss and Sm as well as cingular plate C6. The median
sulcal plate Sm contacts sulcal plates Sa, Ss and Sd (Fig. 22).
These plates apparently have a complicated three-dimen-
sional morphology, with large flanges invading into the
Figs 21, 22. Azadinium obesum. SEM pictures of different cells showing details of the cingulum and sulcus. Scale bar in Fig. 21 5 2 mm andin Fig. 22 5 1 mm.
Fig. 21. Hypotheca and cingulum in dorsal view. Note the internal three-dimensional structure of of sulcal plates (14/02/08-3).Fig. 22. Detailed view of the sulcal region (14/02/08-5). Sa 5 anterior sulcal plate; Sp 5 posterior sulcal plate; Ss 5 left sulcal plate;Sm 5 median sulcal plate; Sd 5 right sulcal plate.
Tillmann et al.: Azadinium obesum sp. nov. 175
hypotheca (see Fig. 21). We do not exclude the possibility
that there are more tiny sulcal plates, but these could not be
resolved by calcofluor-staining and epifluorescence micros-
copy or SEM. Dissection with hypochlorite also did not
resolve further platelets.
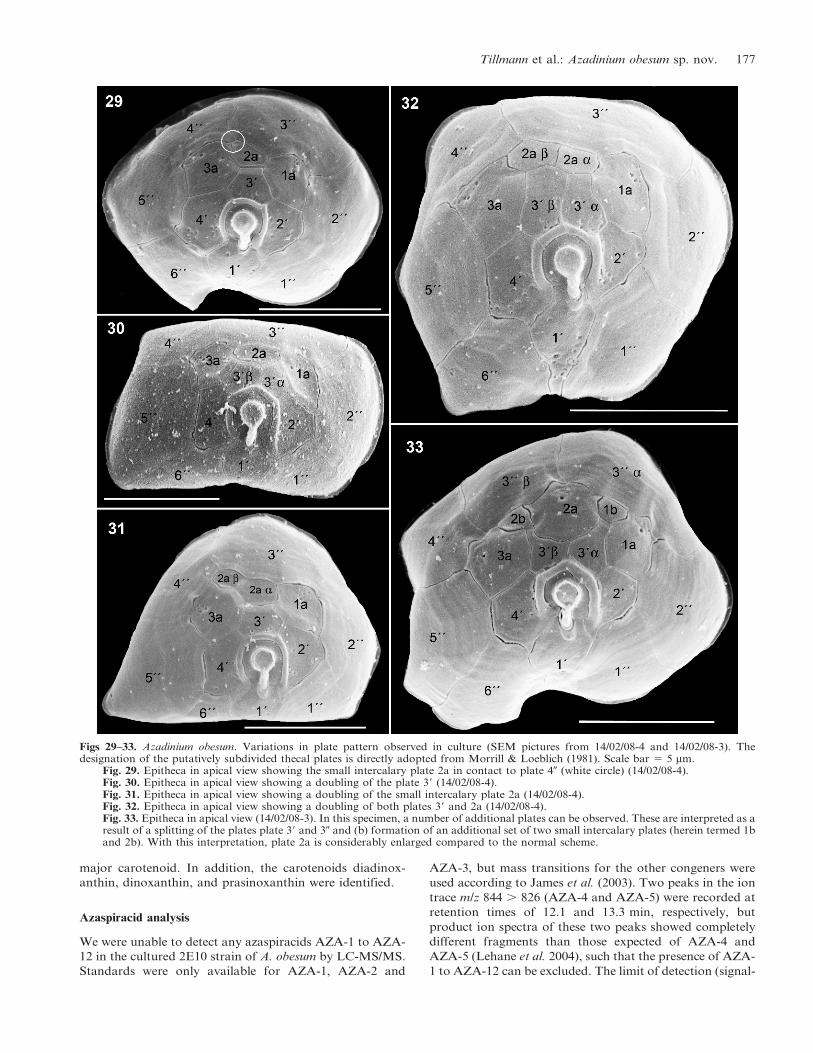
The plate pattern shown in Figs 23–28 is the standard
basic pattern. Several variations were, however, observed
(see Figs 29–33). Most variations can be interpreted as
extra divisions of pre-existing plates to yield additional
plates, a modification that has been designated as a
‘complexum modification’ by Lefevre (1932). Complexum
modifications were commonly observed on the epitheca,
specifically by division of apical plates 39 and/or 2a and/or
30 or, more rarely, by division of plates 29 or 49. Among 46
specimens for which a complete epithecal view was
available, more than half (57%) showed a complexum
modification (Table 2). For a large majority of these
‘modified’ specimens, more than one epithecal plate was
doubled with a joint doubling of plate 2a and 39 being most
common (Table 2).
Another variation refers to the relative position the small
intercalary plate 2a. The plate 2a is ‘normally’ four-sided and
in contact with plates 39, 1a, 3a, and 30. However, as depicted
in Fig. 29, plate 2a may also be slightly distorted and in
contact with plate 40, which was observed for 8 (31%) among
26 individuals with one 2a-plate, for which these plates were
visible. For all specimens with plate 2a doubled, the right
plate 2a was always in contact with plate 40.
Pigment composition
Pigment analysis by high-performance liquid chromatogra-
phy with diode array detection revealed that A. obesum
contained a pigment pattern (Fig. 34) that is typical for
most photosynthetic dinoflagellates, with chl c2 as the
major accessory chlorophyll to chl a and peridinin as the
Figs 23–28. Azadinium obesum. Diagrammatic illustration of thecal plates.Fig. 23. Ventral view. APC 5 apical pore complex; Sa, Sd, Sm, Sp, Ss 5 sulcal plates; vp 5 ventral pore).Fig. 24. Left side.Fig. 25. Right side.Fig. 26. Dorsal view.Fig. 27. Apical view.Fig. 28. Antapical view.
176 Phycologia, Vol. 49 (2), 2010
major carotenoid. In addition, the carotenoids diadinox-
anthin, dinoxanthin, and prasinoxanthin were identified.
Azaspiracid analysis
We were unable to detect any azaspiracids AZA-1 to AZA-
12 in the cultured 2E10 strain of A. obesum by LC-MS/MS.
Standards were only available for AZA-1, AZA-2 and
AZA-3, but mass transitions for the other congeners were
used according to James et al. (2003). Two peaks in the ion
trace m/z 844 . 826 (AZA-4 and AZA-5) were recorded at
retention times of 12.1 and 13.3 min, respectively, but
product ion spectra of these two peaks showed completely
different fragments than those expected of AZA-4 and
AZA-5 (Lehane et al. 2004), such that the presence of AZA-
1 to AZA-12 can be excluded. The limit of detection (signal-
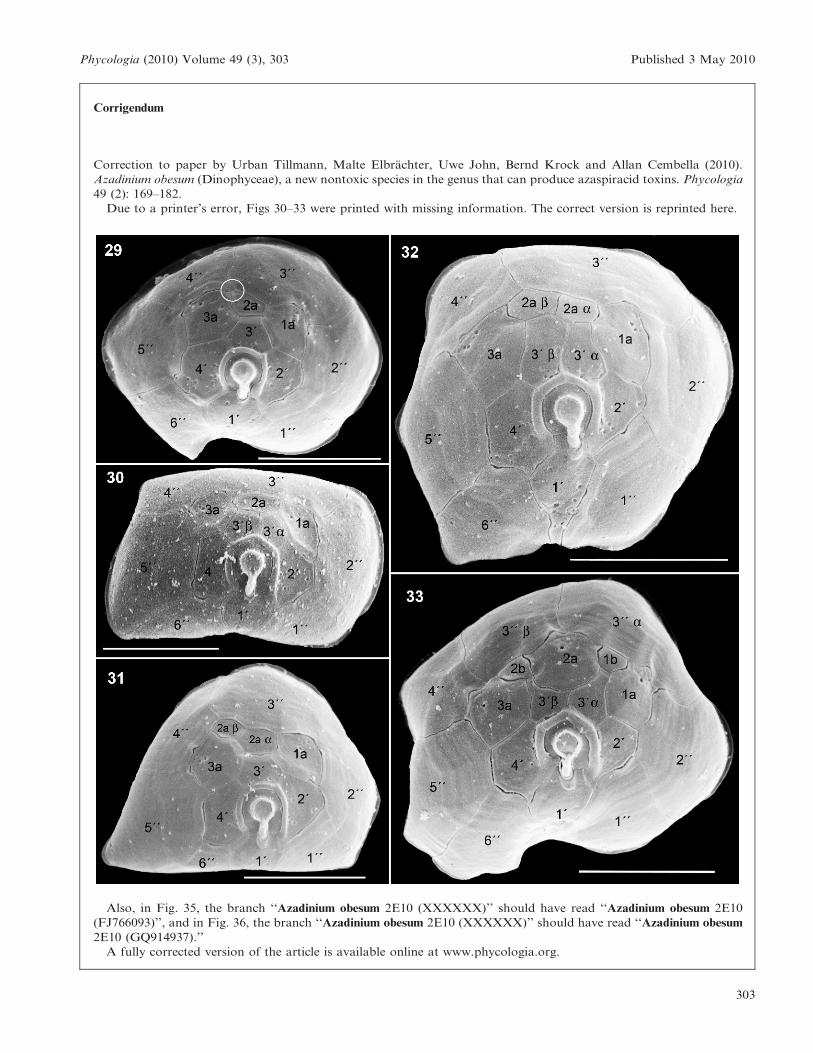
Figs 29–33. Azadinium obesum. Variations in plate pattern observed in culture (SEM pictures from 14/02/08-4 and 14/02/08-3). Thedesignation of the putatively subdivided thecal plates is directly adopted from Morrill & Loeblich (1981). Scale bar 5 5 mm.
Fig. 29. Epitheca in apical view showing the small intercalary plate 2a in contact to plate 40 (white circle) (14/02/08-4).Fig. 30. Epitheca in apical view showing a doubling of the plate 39 (14/02/08-4).Fig. 31. Epitheca in apical view showing a doubling of the small intercalary plate 2a (14/02/08-4).Fig. 32. Epitheca in apical view showing a doubling of both plates 39 and 2a (14/02/08-4).Fig. 33. Epitheca in apical view (14/02/08-3). In this specimen, a number of additional plates can be observed. These are interpreted as aresult of a splitting of the plates plate 39 and 30 and (b) formation of an additional set of two small intercalary plates (herein termed 1band 2b). With this interpretation, plate 2a is considerably enlarged compared to the normal scheme.
Tillmann et al.: Azadinium obesum sp. nov. 177
to-noise ratio 5 5) was determined as 350 fg on-column
(AZA-1 equivalents), which, for our measurement, would
be equivalent to a detectable cell quota of 3.6 ag cell21. The
toxic relative A. spinosum in turn has a AZA cell quota of
three to four orders of magnitude higher than this detection
limit (5–40 fg cell21) (Krock et al. 2009).
Molecular analysis
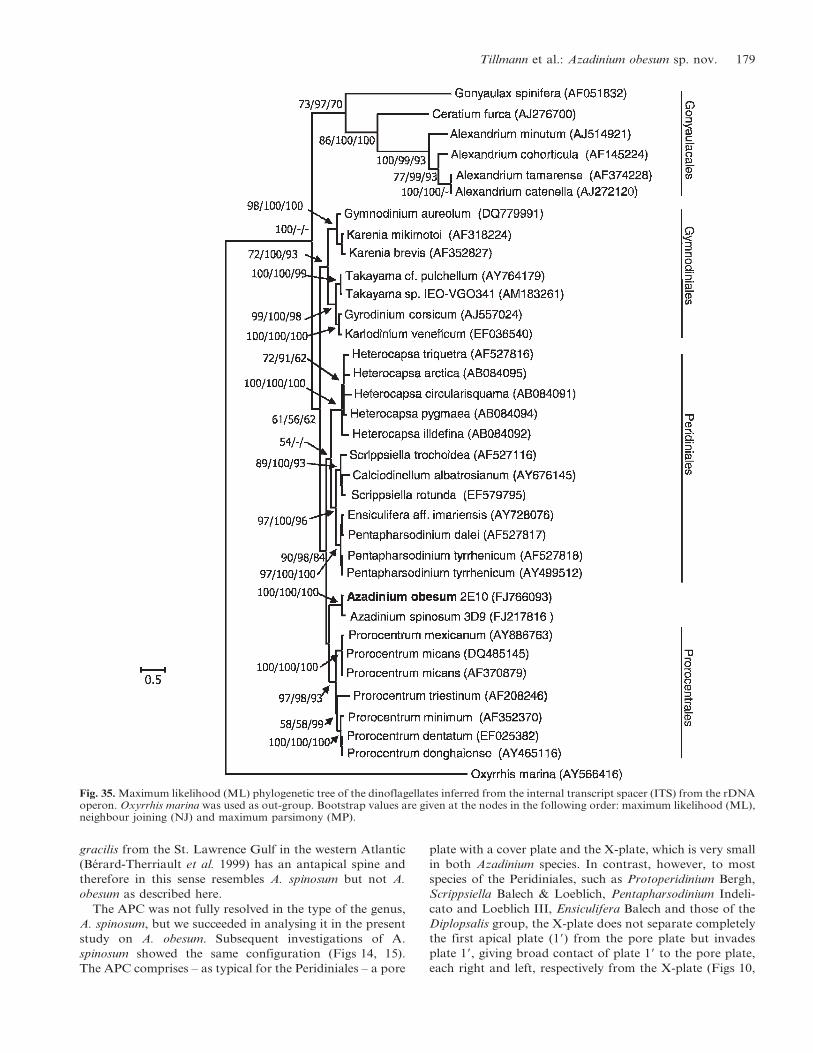
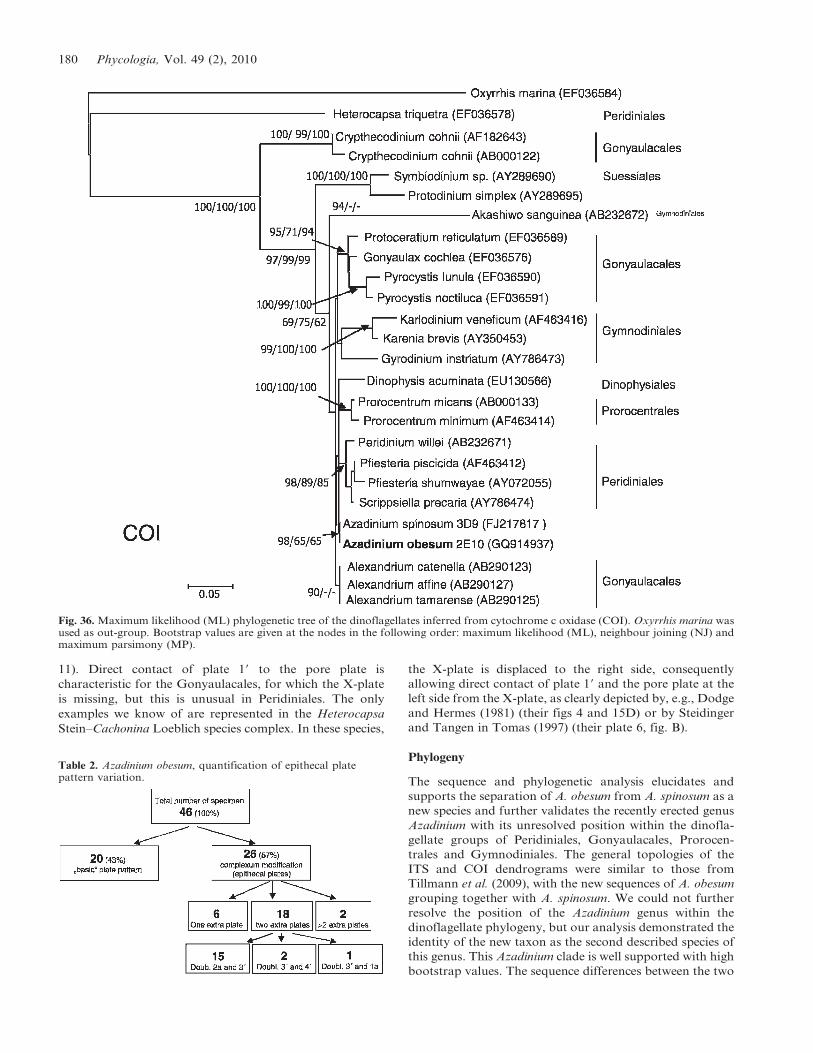
Phylogenetic analysis of the generated sequences from A.
obesum are illustrated in Figs 35 and 36 as ML dendro-
grams for the ITS and COI sequences, respectively. In both
analyses, A. obesum and A. spinosum form a well bootstrap-
supported sister group to the Gymnodiniales, Peridiniales
and Prorocentrales in the case of ITS and additionally with
members of the gonyaulacales in the COI phylogeny. The
phylogenies of the 18S rRNA and D1D2 region of the 28S
rRNA showed the same results for the Azadinium species
and were also consistent with our previous results (data not
shown). While we discovered only four base substitutions in
the 18S rRNA sequences between the two Azadinium taxa,
22 differences were exhibited in the 28S rRNA sequences,
16 for ITS and none for the COI gene (see Table 3).
DISCUSSION
Morphology
With the Kofoid tabulation Po, cp, X, 49, 3a, 60, 6C, 5?S,
690, 200, this taxon exactly fits into the newly described
dinoflagellate genus Azadinium within the subclass Peridi-
niphycidae (Tillmann et al. 2009). Unfortunately, compar-
ative morphological analysis of this taxon with the type
species of the genus, A. spinosum, does not clarify
taxonomic affinities with respect to the Gonayaulacales or
Peridiniales or other higher-level taxonomic entities.
Nevertheless, under the light microscope it can be separated
from A. spinosum by the consistent absence of an antapical
spine, which is only very rarely absent in cells from cultures
of A. spinosum and hence serves as a primary species
descriptor. Also different from A. spinosum is the lack of a
stalked pyrenoid in A. obesum. In general, A. obesum also
differs slightly but significantly (see Fig. 9) in size (slightly
longer and wider) and in shape (not so elongated) from A.
spinosum; however, there is overlap in the size range
(Fig. 9). In any case, the two species are clearly separated
by their different tabulation. The first precingular plate of
A. obesum does not touch the first epithecal intercalary
plate as in A. spinosum. For A. obesum, the first precingular
plate is four-sided, touching only plates 19, 29, 20 and the
cingulum; whereas, in A. spinosum the first precingular
plate is five-sided, touching plates 19,29, 1a, 20 and the
cingulum. In addition, the shape of the first apical plate in
A. obesum is also distinctive; the lower half of the plate is
very narrow, tongue-like, and, in consequence, the sutures
between plate 19 and both precingular plates 10 and 60 are
very close together (Figs 5, 17, 19), running more or less
parallel; whereas, these diverge in A. spinosum.
We conclude based upon cultured material that the
morphotype of A. obesum is stable albeit with some
variations and is readily differentiated from A. spinosum
in critical LM and SEM analysis, thereby warranting the
separation of A. obesum on the species level from the type
of the genus, A. spinosum. The degree of plate pattern
variability for A. obesum (Table 2, Figs 29–33) is compa-
rable to the variability described for a culture of the type of
the genus, A. spinosum (Tillmann et al. 2009). Variability
was mainly caused by subdivisions of plates in the dorsal
area of the epitheca; whereas, the hypothecal tabulation
was more stable. We did consider the possibility of
‘morphological drift’ in culture, but this does not appear
to be manifest even after more than 1 yr since isolation.
Aberrant morphotypes (loss of chain formation, rounding
of cell margins, changes in cell size, distortion of thecal
plates or sutures) is also common in dinoflagellates
undergoing life cycle transitions (gamete or planozygote
formation), but there was no evidence of sexual reproduc-
tion or cyst formation in our culture. The apparent
healthiness and rapid growth of the cultures and the
relatively short time since isolation argues that this
represents natural variation among vegetative cells rather
than induced artefacts or alternative life cycle stages.
However, SEM studies on field samples are needed to
clarify this issue.
Tillmann et al. (2009) mentioned that Gonyaulax parva
Ramsfjell (Ramsfjell 1959) may belong to the genus
Azadinium as it has the same tabulation pattern; although,
the cingular and sulcal plates are so far unknown in this
species. Gonyaulax parva differs from A. obesum by the
configuration of the epithecal plates: 29 and 49 are equal-
sized and very small, as are the three apical intercalary
plates, and plate 2a is five-sided in G. parva. In A. obesum,
plate 29 is displaced dorsally and smaller than plate 49, plate
2a is four-sided and by far the smallest of the three apical
intercalary plates. Therefore, we regard A. obesum as
distinct on species level from G. parva, for which the
cingular and sulcal plates are unknown. Schiller (1935)
invalidly described Gonyaulax gracilis Schiller without
depicting the tabulation. In shape, this dinoflagellate has
some resemblance to A. obesum, although G. gracilis is
much more elongated. The dinoflagellate depicted as G.
Fig. 34. High-performace liquid chromatography chromatogram ofphotosynthetic pigments (detection at 434 nm) of Azadiniumobesum. Only pigments corresponding to known standards arenamed. Retention time (min) on the x-axis; absorbance (AU 5arbitrary units) on the y-axis.
178 Phycologia, Vol. 49 (2), 2010
gracilis from the St. Lawrence Gulf in the western Atlantic
(Berard-Therriault et al. 1999) has an antapical spine and
therefore in this sense resembles A. spinosum but not A.
obesum as described here.
The APC was not fully resolved in the type of the genus,
A. spinosum, but we succeeded in analysing it in the present
study on A. obesum. Subsequent investigations of A.
spinosum showed the same configuration (Figs 14, 15).
The APC comprises – as typical for the Peridiniales – a pore
plate with a cover plate and the X-plate, which is very small
in both Azadinium species. In contrast, however, to most
species of the Peridiniales, such as Protoperidinium Bergh,
cato and Loeblich III, Ensiculifera Balech and those of the
Diplopsalis group, the X-plate does not separate completely
the first apical plate (19) from the pore plate but invades
plate 19, giving broad contact of plate 19 to the pore plate,
each right and left, respectively from the X-plate (Figs 10,
Fig. 35. Maximum likelihood (ML) phylogenetic tree of the dinoflagellates inferred from the internal transcript spacer (ITS) from the rDNAoperon. Oxyrrhis marina was used as out-group. Bootstrap values are given at the nodes in the following order: maximum likelihood (ML),neighbour joining (NJ) and maximum parsimony (MP).
Tillmann et al.: Azadinium obesum sp. nov. 179
11). Direct contact of plate 19 to the pore plate is
characteristic for the Gonyaulacales, for which the X-plate
is missing, but this is unusual in Peridiniales. The only
examples we know of are represented in the Heterocapsa
Stein–Cachonina Loeblich species complex. In these species,
the X-plate is displaced to the right side, consequently
allowing direct contact of plate 19 and the pore plate at the
left side from the X-plate, as clearly depicted by, e.g., Dodge
and Hermes (1981) (their figs 4 and 15D) or by Steidinger
and Tangen in Tomas (1997) (their plate 6, fig. B).
Phylogeny
The sequence and phylogenetic analysis elucidates and
supports the separation of A. obesum from A. spinosum as a
new species and further validates the recently erected genus
Azadinium with its unresolved position within the dinofla-
gellate groups of Peridiniales, Gonyaulacales, Prorocen-
trales and Gymnodiniales. The general topologies of the
ITS and COI dendrograms were similar to those from
Tillmann et al. (2009), with the new sequences of A. obesum
grouping together with A. spinosum. We could not further
resolve the position of the Azadinium genus within the
dinoflagellate phylogeny, but our analysis demonstrated the
identity of the new taxon as the second described species of
this genus. This Azadinium clade is well supported with high
bootstrap values. The sequence differences between the two
Fig. 36. Maximum likelihood (ML) phylogenetic tree of the dinoflagellates inferred from cytochrome c oxidase (COI). Oxyrrhis marina wasused as out-group. Bootstrap values are given at the nodes in the following order: maximum likelihood (ML), neighbour joining (NJ) andmaximum parsimony (MP).
Table 2. Azadinium obesum, quantification of epithecal platepattern variation.
180 Phycologia, Vol. 49 (2), 2010
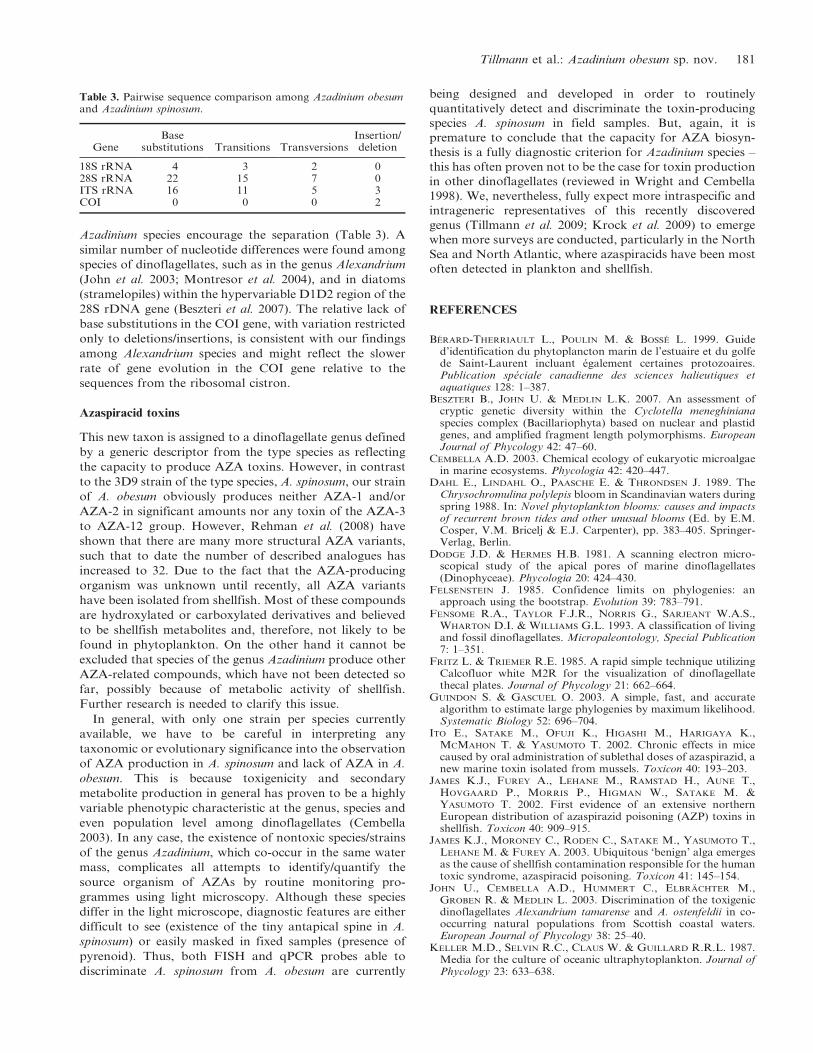
Azadinium species encourage the separation (Table 3). A
similar number of nucleotide differences were found among
species of dinoflagellates, such as in the genus Alexandrium
(John et al. 2003; Montresor et al. 2004), and in diatoms
(stramelopiles) within the hypervariable D1D2 region of the
28S rDNA gene (Beszteri et al. 2007). The relative lack of
base substitutions in the COI gene, with variation restricted
only to deletions/insertions, is consistent with our findings
among Alexandrium species and might reflect the slower
rate of gene evolution in the COI gene relative to the
sequences from the ribosomal cistron.
Azaspiracid toxins
This new taxon is assigned to a dinoflagellate genus defined
by a generic descriptor from the type species as reflecting
the capacity to produce AZA toxins. However, in contrast
to the 3D9 strain of the type species, A. spinosum, our strain
of A. obesum obviously produces neither AZA-1 and/or
AZA-2 in significant amounts nor any toxin of the AZA-3
to AZA-12 group. However, Rehman et al. (2008) have
shown that there are many more structural AZA variants,
such that to date the number of described analogues has
increased to 32. Due to the fact that the AZA-producing
organism was unknown until recently, all AZA variants
have been isolated from shellfish. Most of these compounds
are hydroxylated or carboxylated derivatives and believed
to be shellfish metabolites and, therefore, not likely to be
found in phytoplankton. On the other hand it cannot be
excluded that species of the genus Azadinium produce other
AZA-related compounds, which have not been detected so
far, possibly because of metabolic activity of shellfish.
Further research is needed to clarify this issue.
In general, with only one strain per species currently
available, we have to be careful in interpreting any
taxonomic or evolutionary significance into the observation
of AZA production in A. spinosum and lack of AZA in A.
obesum. This is because toxigenicity and secondary
metabolite production in general has proven to be a highly
variable phenotypic characteristic at the genus, species and
even population level among dinoflagellates (Cembella
2003). In any case, the existence of nontoxic species/strains
of the genus Azadinium, which co-occur in the same water
mass, complicates all attempts to identify/quantify the
source organism of AZAs by routine monitoring pro-
grammes using light microscopy. Although these species
differ in the light microscope, diagnostic features are either
difficult to see (existence of the tiny antapical spine in A.
spinosum) or easily masked in fixed samples (presence of
pyrenoid). Thus, both FISH and qPCR probes able to
discriminate A. spinosum from A. obesum are currently
being designed and developed in order to routinely
quantitatively detect and discriminate the toxin-producing
species A. spinosum in field samples. But, again, it is
premature to conclude that the capacity for AZA biosyn-
thesis is a fully diagnostic criterion for Azadinium species –
this has often proven not to be the case for toxin production
in other dinoflagellates (reviewed in Wright and Cembella
1998). We, nevertheless, fully expect more intraspecific and
intrageneric representatives of this recently discovered
genus (Tillmann et al. 2009; Krock et al. 2009) to emerge
when more surveys are conducted, particularly in the North
Sea and North Atlantic, where azaspiracids have been most
often detected in plankton and shellfish.
REFERENCES
BERARD-THERRIAULT L., POULIN M. & BOSSE L. 1999. Guided’identification du phytoplancton marin de l’estuaire et du golfede Saint-Laurent incluant egalement certaines protozoaires.Publication speciale canadienne des sciences halieutiques etaquatiques 128: 1–387.
BESZTERI B., JOHN U. & MEDLIN L.K. 2007. An assessment ofcryptic genetic diversity within the Cyclotella meneghinianaspecies complex (Bacillariophyta) based on nuclear and plastidgenes, and amplified fragment length polymorphisms. EuropeanJournal of Phycology 42: 47–60.
CEMBELLA A.D. 2003. Chemical ecology of eukaryotic microalgaein marine ecosystems. Phycologia 42: 420–447.
DAHL E., LINDAHL O., PAASCHE E. & THRONDSEN J. 1989. TheChrysochromulina polylepis bloom in Scandinavian waters duringspring 1988. In: Novel phytoplankton blooms: causes and impactsof recurrent brown tides and other unusual blooms (Ed. by E.M.Cosper, V.M. Bricelj & E.J. Carpenter), pp. 383–405. Springer-Verlag, Berlin.
DODGE J.D. & HERMES H.B. 1981. A scanning electron micro-scopical study of the apical pores of marine dinoflagellates(Dinophyceae). Phycologia 20: 424–430.
FELSENSTEIN J. 1985. Confidence limits on phylogenies: anapproach using the bootstrap. Evolution 39: 783–791.
FENSOME R.A., TAYLOR F.J.R., NORRIS G., SARJEANT W.A.S.,WHARTON D.I. & WILLIAMS G.L. 1993. A classification of livingand fossil dinoflagellates. Micropaleontology, Special Publication7: 1–351.
FRITZ L. & TRIEMER R.E. 1985. A rapid simple technique utilizingCalcofluor white M2R for the visualization of dinoflagellatethecal plates. Journal of Phycology 21: 662–664.
GUINDON S. & GASCUEL O. 2003. A simple, fast, and accuratealgorithm to estimate large phylogenies by maximum likelihood.Systematic Biology 52: 696–704.
ITO E., SATAKE M., OFUJI K., HIGASHI M., HARIGAYA K.,MCMAHON T. & YASUMOTO T. 2002. Chronic effects in micecaused by oral administration of sublethal doses of azaspirazid, anew marine toxin isolated from mussels. Toxicon 40: 193–203.
JAMES K.J., FUREY A., LEHANE M., RAMSTAD H., AUNE T.,HOVGAARD P., MORRIS P., HIGMAN W., SATAKE M. &YASUMOTO T. 2002. First evidence of an extensive northernEuropean distribution of azaspirazid poisoning (AZP) toxins inshellfish. Toxicon 40: 909–915.
JAMES K.J., MORONEY C., RODEN C., SATAKE M., YASUMOTO T.,LEHANE M. & FUREY A. 2003. Ubiquitous ‘benign’ alga emergesas the cause of shellfish contamination responsible for the humantoxic syndrome, azaspiracid poisoning. Toxicon 41: 145–154.
JOHN U., CEMBELLA A.D., HUMMERT C., ELBRACHTER M.,GROBEN R. & MEDLIN L. 2003. Discrimination of the toxigenicdinoflagellates Alexandrium tamarense and A. ostenfeldii in co-occurring natural populations from Scottish coastal waters.European Journal of Phycology 38: 25–40.
KELLER M.D., SELVIN R.C., CLAUS W. & GUILLARD R.R.L. 1987.Media for the culture of oceanic ultraphytoplankton. Journal ofPhycology 23: 633–638.
Table 3. Pairwise sequence comparison among Azadinium obesumand Azadinium spinosum.
KOFOID C.A. 1909. On Peridinium steini Jorgensen, with a note onthe nomenclature of the skeleton of the Peridinidae. Archiv furProtistenkunde 16: 25–47.
KROCK B., TILLMANN U., JOHN U. & CEMBELLA A.D. 2008. LC-MS/MS on board ship – tandem mass spectrometry in the searchfor phycotoxins and novel toxigenic plankton from the NorthSea. Analytical and Bioanalytical Chemistry 392: 797–803.
KROCK B., TILLMANN U., JOHN U. & CEMBELLA A.D. 2009.Characterization of azaspiracids in plankton size-fractions andisolation of an azaspiracid-producing dinoflagellate from theNorth Sea. Harmful Algae 8: 254–263.
LEFEVRE M. 1932. Monographie des especes d’eau douce du genrePeridinium. Archives de Botanique 2: 1–208.
LEHANE M., SAEZ M.J.F., MAGDALENA A.B., CANAS I.R., SIERRA
M.D., HAMILTON B., FUREY A. & JAMES K.J. 2004. Liquidchromatography–multiple tandem mass spectrometry for thedetermination of ten azaspiracids, including hydroxyl analoguesin shellfish. Journal of Chromatography A 1024: 63–70.
MAGDALENA A.B., LEHANE M., KRYS S., FERNANDEZ M.L.,FUREY A. & JAMES K.J. 2003. The first identification ofazaspiracids in shellfish from France and Spain. Toxicon 42:105–108.
MCMAHON T. & SILKE J. 1996. West coast of Ireland; winter toxicityof unknown aetiology in mussels. Harmful Algae News 14: 2.
MONTRESOR M., JOHN U., BERAN A. & MEDLIN L.K. 2004.Alexandrium tamutum sp. nov. (Dinophyceae): a new nontoxicspecies in the genus Alexandrium. Journal of Phycology 40:398–411.
MORRILL L.C. & LOEBLICH A.R. III 1981. A survey for body scalesin dinoflagellates and a revision of Cachonina and Heterocapsa(Pyrrhophyta). Journal of Plankton Research 3: 53–65.
POSADA D. & CRANDALL K.A. 1998. Modeltest: testing the modelof DNA substitution. Bioinformatics 14: 817–818.
POSADA D. & BUCKLEY T.R. 2004. Model selection and modelaveraging in phylogenetics: advantages of the AIC and Bayesianapproaches over likelihood ratio tests. Systematic Biology 53:793–808.
RAMSFJELL E. 1959. Two new phytoplankton species from theNorwegian Sea, the diatom Coscinosira poroseriata, and thedinoflagellate Gonyaulax parva. Nytt Magasin for Botanikk 7:175–177.
REHMANN N., HESS P. & QUILLIAM M.A. 2008. Discovery of newanalogs of the marine biotoxin azaspirazid in blue musselsMytilus edulis by ultra-performance liquid chromatrography/tandem mass spectrometry. Rapid Communications in MassSpectrometry 22: 549–558.
SATAKE M., OFUJI K., JAMES K., FUREY A. & YASUMOTO T. 1998.New toxic events caused by Irish mussels. In: Harmful algae (Ed.by B. Reguera, J. Blanco, M.L. Fernandez & T. Wyatt), pp.468–469. Xunta de Galicia and Interantional OceanographicCommission of UNESCO, Santiago de Compostela.
SCHILLER J. 1935. Dinoflagellatae (Peridineae) in monographischerBehandlung. In: Dr. L. Rabenhorst’s Kryptogamen-Flora vonDeutschland, Osterreich und der Schweiz (Ed. by L. Rabenhorst),Leipzig, Germany, E. Kummer, pp. 161–320.
TALEB H., VALE P., AMANHIR R., BENHADOUCH A., SAGOU R. &CHAFIK A. 2006. First detection of azaspirazids in mussels innorth west Africa. Journal of Shellfish Research 25: 1067–1070.
THOMPSON J.D., GIBSON T.J., PLEWNIAK F., JEANMOUGIN F. &HIGGINS D.G. 1997. The ClustalX windows interface: flexiblestrategies for multiple sequence alignment aided by qualityanalysis tools. Nucleic Acids Research 25: 4876–4882.
TILLMANN U., ELBRACHTER M., KROCK B., JOHN U. & CEMBELLA
A. 2009. Azadinium spinosum gen. et sp. nov. (Dinophyceae)identified as a primary producer of azaspiracid toxins. EuropeanJournal of Phycology 44: 63–79.
TOMAS C.R. [Ed] 1997. Identifying marine phytoplankton. AcademicPress, San Diego, 858 pp.
TWINER M.J., REHMANN N., HESS P. & DOUCETTE G.J. 2008.Azaspiracid shellfish poisoning: a review on the chemistry,ecology, and toxicology with emphasis on human health impacts.Marine Drugs 6: 39–72.
VALE C., BOTELHO M.J., RODRIGUES S.M., GOMES S.S. & DE M.SAMPAYO M.A. 2008. Two decades of marine biotoxin monitor-ing in bivalves from Portugal (1986–2006): a review of exposureassessment. Harmful Algae 7: 11–25.
WHELAN S. & GOLDMAN N. 2001. A general empirical model ofprotein evolution derived from multiple protein families using amaximum likelihood approach. Molecular Biology and Evolution18: 691–699.
WRIGHT J.L.C. & CEMBELLA A.D. 1998. Ecophysiology andbiosynthesis of polyether marine biotoxins. In: Physiologicalecology of harmful algal blooms (Ed. by D.M. Anderson, A.D.Cembella & G.M. Hallegraeff), pp. 427–451. Springer-Verlag,Berlin.
ZHANG H., BHATTACHARYA D. & LIN S. 2005. Phylogeny ofdinoflagellates on mitochondrial cytochrome b and nuclear smallrDNA. Journal of Phycology 41: 411–420.
Received 23 April 2009; accepted 14 September 2009
Associate editor: Jacob Larsen
182 Phycologia, Vol. 49 (2), 2010
Corrigendum
Correction to paper by Urban Tillmann, Malte Elbrachter, Uwe John, Bernd Krock and Allan Cembella (2010).
Azadinium obesum (Dinophyceae), a new nontoxic species in the genus that can produce azaspiracid toxins. Phycologia
49 (2): 169–182.
Due to a printer’s error, Figs 30–33 were printed with missing information. The correct version is reprinted here.
Also, in Fig. 35, the branch ‘‘Azadinium obesum 2E10 (XXXXXX)’’ should have read ‘‘Azadinium obesum 2E10
(FJ766093)’’, and in Fig. 36, the branch ‘‘Azadinium obesum 2E10 (XXXXXX)’’ should have read ‘‘Azadinium obesum
2E10 (GQ914937).’’
A fully corrected version of the article is available online at www.phycologia.org.
Phycologia (2010) Volume 49 (3), 303 Published 3 May 2010