123
1 AZIMUT HOLDING S.p.A. Consolidated interim financial report at 30 June 2020
1
AZIMUT HOLDING S.p.A.
Consolidated interim financial report at 30 June 2020
2
Contents
Company bodies 3
Azimut Group's highlights and indicators 4
Management report 7
Consolidated financial statements 34
Notes to the consolidated financial statements
43
Statement pursuant to article 154-bis, paragraphs 3 and 4 of the Consolidated Law on Finance
125
3
Company bodies Board of Directors
Pietro Giuliani Chairman
Gabriele Blei Chief Executive Officer
Massimo Guiati Chief Executive Officer
Paolo Martini Chief Executive Officer and Managing Director
Giorgio Medda Chief Executive Officer
Alessandro Zambotti Chief Executive Officer
Cinzia Stinga (*) Director
Lucia Zigante (*) Director
Anna Maria Bortolotti Director
Antonio Colavito Director
Antonio Andrea Monari Director
Raffaella Pagani Director
Board of Statutory Auditors
Vittorio Rocchetti Chairman
Costanza Bonelli Standing Auditor
Daniele Carlo Trivi Standing Auditor
Maria Catalano Alternate Auditor
Federico Strada Alternate Auditor
Independent Auditors
PricewaterhouseCoopers S.p.A.
(*) in office for one year (2020)

4
Azimut Group's highlights and indicators
Azimut Group's structure at 30 June 2020
Source: company figures updated to 30 June 2020
Note (1): controls the distribution companies M&O Consultoria, FuturaInvest and Azimut Brasil Wealth Management.
Note (2): controls AZ Sinopro Insurance Planning. Note (3): controls 100% of CGM Italia S.p.A.. Note (4): 30% held by Azimut Capital
Management SGR S.p.A. and 19% by Azimut Financial Insurance S.p.A., both wholly owned by Azimut Holding. Note (5): controls SDB Financial
Solutions. Note (6): main subsidiaries with a majority investment.

5
Azimut Group—Highlights at 30 June 2020
1989 Year of incorporation 2004 Year of flotation
55.4 Total assets 17 countries Geographical coverage
1,842 Inflows for the first half
of 2020 1,806 Financial advisors
476,020 Revenues for the first
half of 2020 143,025
Net profit for the first half of
2020
1052 Employees 15.21 Share price
6
Indicators Financial indicators 01/01/2020-
30/06/2020 01/01/2019-30/06/2019
Change
(millions of euro) Absolute %
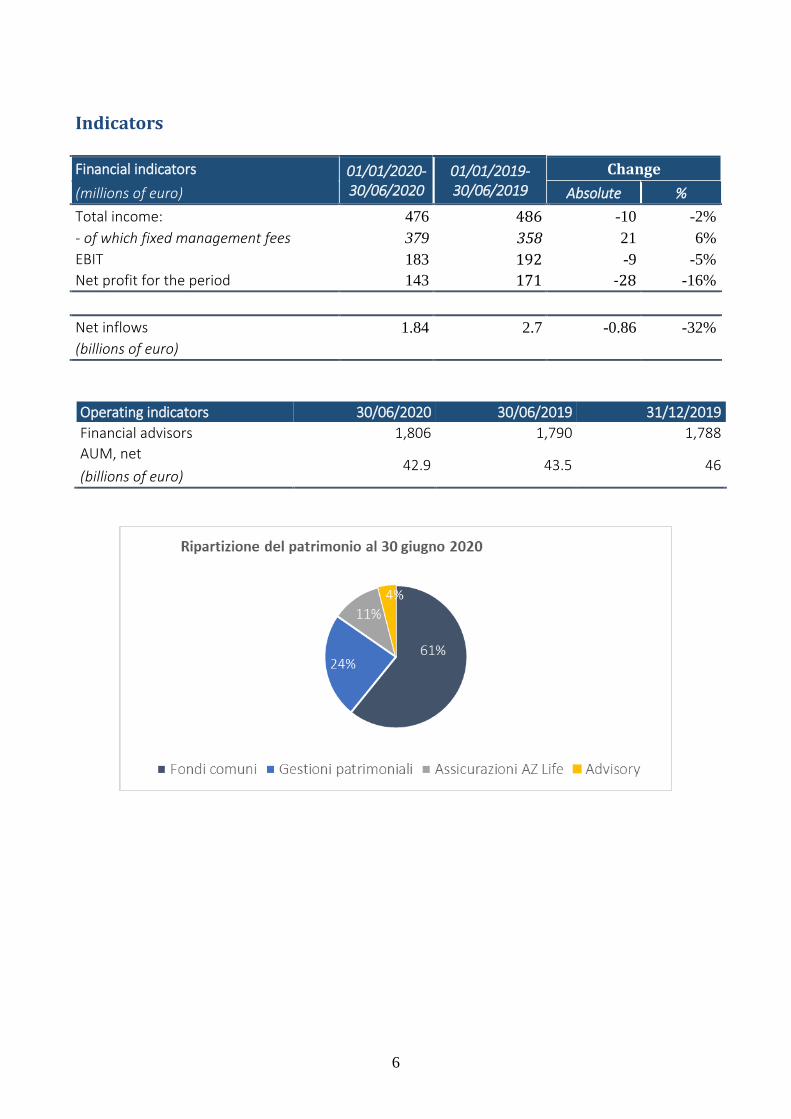
Total income: 476 486 -10 -2%
- of which fixed management fees 379 358 21 6%
EBIT 183 192 -9 -5%
Net profit for the period 143 171 -28 -16%
Net inflows 1.84 2.7 -0.86 -32%
(billions of euro)
Operating indicators 30/06/2020 30/06/2019 31/12/2019
Financial advisors 1,806 1,790 1,788
AUM, net 42.9 43.5 46
(billions of euro)
7
Management report
Introduction The consolidated interim financial report at 30 June 2020 has been prepared in compliance
with article 154-ter (Interim Reports) of Italian Legislative Decree 58/1998 (Consolidated
Law on Finance), introduced by Italian Legislative Decree 195/2007, transposing EU Directive
2004/109/EC (known as the Transparency Directive), as amended.
The interim financial report includes the condensed consolidated interim financial
statements, the interim management report and the statement required by article 154-bis,
paragraph 5.
The condensed consolidated interim financial statements have been prepared in compliance
with the International Financial Reporting Standards (IAS and IFRS) issued by the
International Accounting Standards Board (IASB) and endorsed by the European Commission.
Specifically, they have been drawn up in accordance with IAS 34 - Interim Reports, applying
the same accounting standards used to prepare the Consolidated Financial Statements at 31
December 2019, to which reference is made.
1 - GROUP RESULTS
The Azimut Group ended the first half of 2020 with a consolidated net profit of 143,025
thousand euro (171,025 thousand euro for the first half of 2019) and consolidated EBIT of
167,290 thousand euro (193,913 thousand euro for the first half of 2019).
At 30 June 2020, total assets under management reached 42.9 billion euro, down by 6.8%
compared to the 2019 year-end balance. Total assets, including assets under custody,
amounted to 55.4 billion euro. Group total inflows were positive for 1.8 billion euro at 30
June 2020 (2.7 billion euro at 30 June 2019).
Inflows for the first half of 2020 remained steady despite the increase in volatility caused by
the outbreak of the Coronavirus, which has inevitably affected the markets (domestic and
worldwide). The professional and constant support provided by our financial advisors,
together with the proximity to our team members, remains the basis of our offer, whose value
is even more appreciable in such turbulent times. For additional information about the impact
of Covid-19 on the Group's results, reference should be made to section 2.8 "Other significant
events" of this report.

8
At 30 June 2020, total advisors numbered 1,806 (1,788 at 31 December 2019).
ASSETS
Figures in millions of euro 30/06/2020 31/12/2019 30/06/2019 Change
Absolute %
Mutual funds 31,115 34,788 33,365 -3,673 -10.6%
of which: private markets 1,200 1,200 100.0%
Discretionary portfolio management and other
12,166 11,960 11,217 206 1.7%
AZ Life insurance 5,817 6,074 5,872 -257 -4.2%
Advisory 2,041 2,098 1,963 -57 -2.7%
Double counting -8,277 -
8,951 -
8,907 674 -7.5%
AUM, net
42,862
45,969
43,510 -3,107 -6.8%
Securities, third-party funds and c/a
12,521
13,128
12,342
-607 -4.6%
Total assets 55,383 59,097 55,852 -3,714 -6.3%
NET INFLOWS
Figures in millions of euro
1H2020 1H2019 Change
2019 Absolute %
Funds -137 971 -1,108 -114.1% 1,063
of which: private markets
606 606 n/a n/a
Discretionary portfolio management and other
923 524 399 76% 929
AZ Life insurance -18 -119 101 -85.1% -116
Advisory 6 194 -188 -97.1% 322
Double counting 101 57 44 76.3% 310
Total net inflows - Assets under management
874 1,627 -753 -46% 2,508
Securities, third-party funds and c/a
967 1,033 -66 -6% 2,104
Total net inflows 1,841 2,660 -819 -31% 4,612
9
RECLASSIFIED CONSOLIDATED INCOME STATEMENT
In order to provide a more effective representation of the results, the income statement has
been reclassified and thus better reflects the content of the items according to operating
criteria.
The main reclassifications involved the following:
• cost recoveries on portfolio management reported under “Fee and commission income”
have been reclassified as “Other income” in the reclassified income statement;
• net premiums, net profits (losses) on financial instruments at fair value through profit or
loss, the change in the technical reserves, redemptions and claims, commissions and
recovered expenses relating to insurance and investment products issued by AZ Life Dac,
reported under “Net premiums”, “Change in technical reserves” and “Fee and commission
income”, have been reclassified to “Insurance income”;
• commission expenses paid to the distribution network, reported under “Fee and
commission expense” are now classed as “Acquisition costs”; similarly, the Enasarco/Firr
contributions related to these commission expenses and the other trade payables
associated with the distribution network, recognised under “Administrative costs”, have
been reclassified as “Acquisition costs”; the amount allocated to the supplementary
indemnity reserve for agents (ISC) reported under the item “Accruals to the provisions
and charges” has been reclassified as “Acquisition costs”;
• administrative cost recoveries, reported under “Other operating income and costs”, were
recognised as a reduction of “Overheads/administrative costs”;
• interest expenses on loans and bonds were reported under “Interest expense” in the
reclassified income statement.
10
Euro/000
01/01/20 -
30/06/20
01/01/19 -
30/06/19
01/01/19 -
31/12/19
Acquisition fees 5,174 2,626 6,133
Fixed management fees 378,622 357,804 752,741
Variable management fees 39,886 86,767 206,517
Other income 6,839 6,224 13,285
Insurance income 45,499 32,489 71,098
Total income 476,020 485,911 1,049,774
Acquisition costs (175,043) (185,661) (379,776)
Overhead costs/administrative costs (104,623) (99,577) (200,201)
Amortisation/depreciation and provisions (13,134) (9,164) (24,387)
Total costs (292,800) (294,402) (604,364)
EBIT 183,220 191,509 445,410
Net financial income (5,969) 11,825 16,936
Net non-recurring income (costs) (1,408) (4,430) 678
Interest expense (8,554) (4,992) (11,871)
Pre-tax profit 167,290 193,913 451,153
Income tax (21,897) (16,998) (58,413)
Deferred tax assets/liabilities 3,238 1,254 (6,491)
Net profit (loss) 148,631 178,168 386,250
Profit (loss) attributable to minority interests 5,605 7,143 16,239
Group net profit 143,025 171,025 370,011
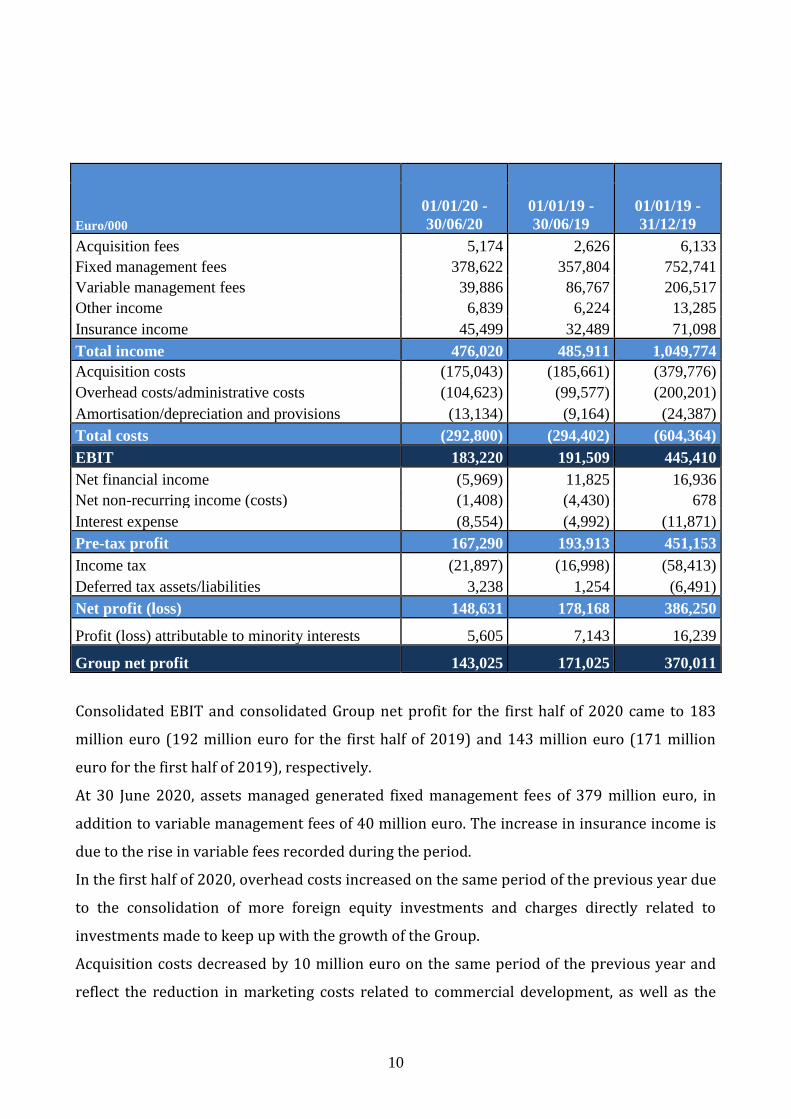
Consolidated EBIT and consolidated Group net profit for the first half of 2020 came to 183
million euro (192 million euro for the first half of 2019) and 143 million euro (171 million
euro for the first half of 2019), respectively.
At 30 June 2020, assets managed generated fixed management fees of 379 million euro, in
addition to variable management fees of 40 million euro. The increase in insurance income is
due to the rise in variable fees recorded during the period.
In the first half of 2020, overhead costs increased on the same period of the previous year due
to the consolidation of more foreign equity investments and charges directly related to
investments made to keep up with the growth of the Group.
Acquisition costs decreased by 10 million euro on the same period of the previous year and
reflect the reduction in marketing costs related to commercial development, as well as the
11
change in the amortisation period of the costs incurred to obtain contracts with customers,
moving to a time horizon which is more in line with the service period to customers.
Net financial income also includes the negative effects of the fair value measurement of the
investments in the Group’s UCI units (4.7 million euro), compared to a positive 6 million euro
in the first half of 2019. This is due to the negative performance of financial markets in the
first half of the year compared to the positive performance in the first half of the previous
year.
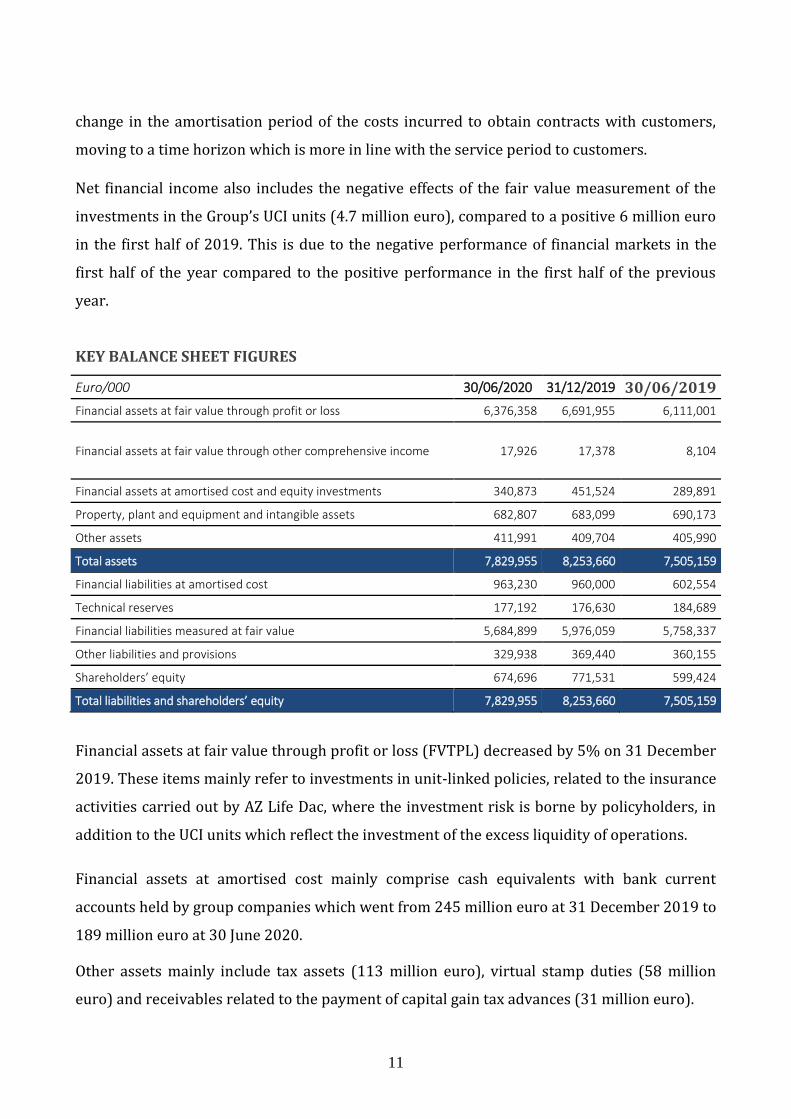
KEY BALANCE SHEET FIGURES
Euro/000 30/06/2020 31/12/2019 30/06/2019
Financial assets at fair value through profit or loss 6,376,358 6,691,955 6,111,001
Financial assets at fair value through other comprehensive income 17,926 17,378 8,104
Financial assets at amortised cost and equity investments 340,873 451,524 289,891
Property, plant and equipment and intangible assets 682,807 683,099 690,173
Other assets 411,991 409,704 405,990
Total assets 7,829,955 8,253,660 7,505,159
Financial liabilities at amortised cost 963,230 960,000 602,554
Technical reserves 177,192 176,630 184,689
Financial liabilities measured at fair value 5,684,899 5,976,059 5,758,337
Other liabilities and provisions 329,938 369,440 360,155
Shareholders’ equity 674,696 771,531 599,424
Total liabilities and shareholders’ equity 7,829,955 8,253,660 7,505,159
Financial assets at fair value through profit or loss (FVTPL) decreased by 5% on 31 December
2019. These items mainly refer to investments in unit-linked policies, related to the insurance
activities carried out by AZ Life Dac, where the investment risk is borne by policyholders, in
addition to the UCI units which reflect the investment of the excess liquidity of operations.
Financial assets at amortised cost mainly comprise cash equivalents with bank current
accounts held by group companies which went from 245 million euro at 31 December 2019 to
189 million euro at 30 June 2020.
Other assets mainly include tax assets (113 million euro), virtual stamp duties (58 million
euro) and receivables related to the payment of capital gain tax advances (31 million euro).

12
They also include amounts due from financial advisors for loans and advanced commissions
(approximately 18 million euro) and incentive costs relating to total inflow targets which are
directly attributable to the existing contracts which meet the capitalisation requirements
under the category of costs incurred to fulfil a contract introduced by IFRS 15. They are
included under Prepayments and amounted to 63 million euro at 30 June 2020.
Financial liabilities at amortised cost include the loan granted by Banco BPM on 28 February
2019 and divided into two lines, A and B, each amounting to 100 million euro. Line A is
repayable in tranches while Line B is entirely due on 31 December 2021. The interest rate is
calculated based on the Euribor plus 140 basis points for Line A and 160 basis points for Line
B. The loan is subject to covenants. On 31 December 2019, the loan was repaid in advance for
120 million euro, in addition to the payment of Line A due on the same date (20 million euro).
Furthermore, in June 2020, Line A was repaid by another 7.5 million, bringing the residual
value to 52 million at 30 June 2020. This item also includes the bonds issued by the parent
company, totalling 853 million euro
and the lease liabilities which arose as a result of the application of IFRS 16, amounting to 43
million euro at 30 June 2020.
13
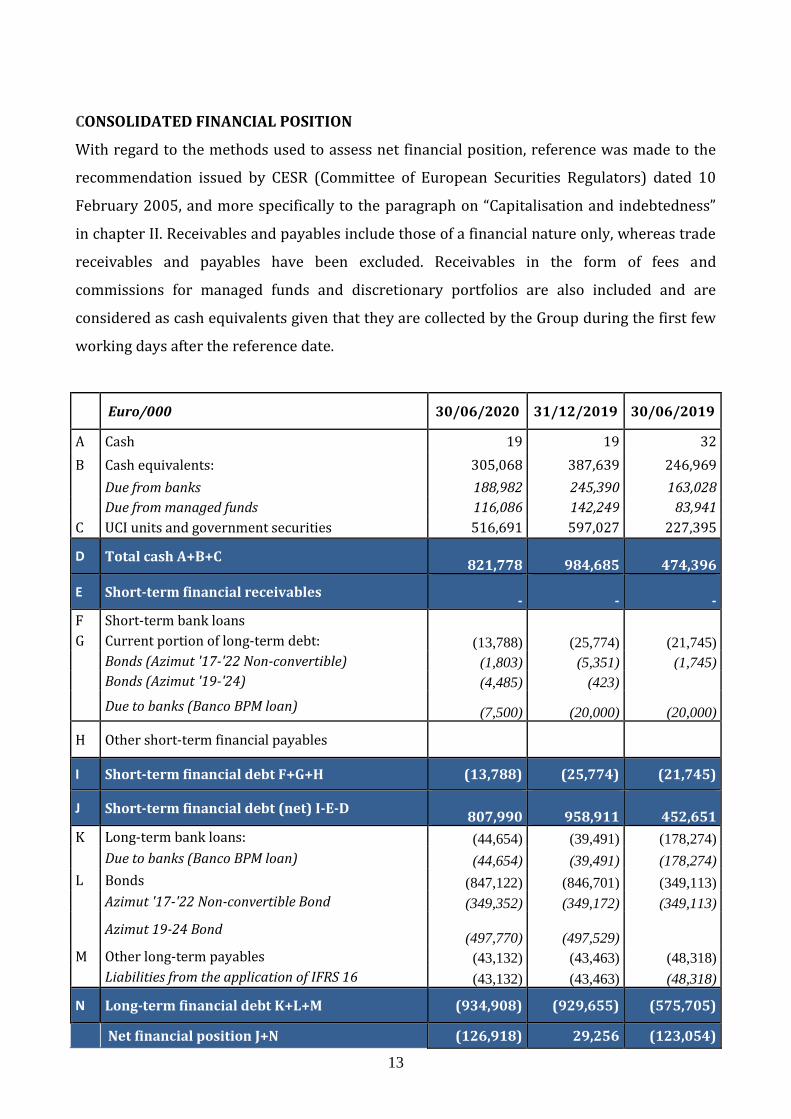
CONSOLIDATED FINANCIAL POSITION
With regard to the methods used to assess net financial position, reference was made to the
recommendation issued by CESR (Committee of European Securities Regulators) dated 10
February 2005, and more specifically to the paragraph on “Capitalisation and indebtedness”
in chapter II. Receivables and payables include those of a financial nature only, whereas trade
receivables and payables have been excluded. Receivables in the form of fees and
commissions for managed funds and discretionary portfolios are also included and are
considered as cash equivalents given that they are collected by the Group during the first few
working days after the reference date.
Euro/000 30/06/2020 31/12/2019 30/06/2019
A Cash 19 19 32
B Cash equivalents: 305,068 387,639 246,969
Due from banks 188,982 245,390 163,028
Due from managed funds 116,086 142,249 83,941
C UCI units and government securities 516,691 597,027 227,395
D Total cash A+B+C
821,778
984,685
474,396
E Short-term financial receivables
-
-
-
F Short-term bank loans
G Current portion of long-term debt: (13,788) (25,774) (21,745)
Bonds (Azimut '17-'22 Non-convertible) (1,803) (5,351) (1,745)
Bonds (Azimut '19-'24) (4,485) (423)
Due to banks (Banco BPM loan) (7,500) (20,000) (20,000)
H Other short-term financial payables
I Short-term financial debt F+G+H (13,788) (25,774) (21,745)
J Short-term financial debt (net) I-E-D
807,990
958,911
452,651
K Long-term bank loans: (44,654) (39,491) (178,274)
Due to banks (Banco BPM loan) (44,654) (39,491) (178,274)
L Bonds (847,122) (846,701) (349,113)
Azimut '17-'22 Non-convertible Bond (349,352) (349,172) (349,113)
Azimut 19-24 Bond (497,770) (497,529)
M Other long-term payables (43,132) (43,463) (48,318)
Liabilities from the application of IFRS 16 (43,132) (43,463) (48,318)
N Long-term financial debt K+L+M (934,908) (929,655) (575,705)
O Net financial position J+N (126,918) 29,256 (123,054)

14
Receivables and payables include those of a financial nature only, whereas trade receivables
and payables have been excluded. Receivables in the form of fees and commissions for
managed funds, discretionary portfolios and other investment services are also included and
are considered as cash equivalents given that they are collected by the Group during the first
few working days after the reporting date.
The net financial position is negative at 127 million euro at 30 June 2020 (positive balance of
29 million euro at 31 December 2019).
The balance, net of the liquidity generated by the operating activities of the period, was
impacted by the dividends paid in cash to Azimut Holding S.p.A. shareholders (137 million
euro) and the following main transactions carried out during the period:
• in the first half of 2020, following the Board of Directors' resolutions of 12 December
2019, Azimut Holding S.p.A. made a capital injection of 56 million euro to increase the
share capital of the subsidiary AZ International Holdings Sa in order to finance the
Group's international development;
• in the first half of 2020, tax advances, virtual stamp duties and taxes on the
mathematical reserve (the latter pertaining to the Irish AZ Life Dac) totalling 40.7
million euro were paid;
• in February and March 2020, 2,690,746 treasury shares were purchased, for a total of
45 million euro, implementing the resolution of Azimut Holding’s Board of Directors of
24 February 2020 and based on the authorisation issued pursuant to article 2357 of
the Italian Civil Code by the shareholders in their meeting of 24 April 2019.

15
Loans raised and repaid during the period
The changes in financial debt items during the first half of 2020 are shown in the following
table.
Interest rate Nominal
Euro/000 Currency Nominal Effective amount Expiry
Balance at 01/01/2020
Of which:
“Azimut 2017-2022” Bond Euro 2% 2.11% 350,000 2022
Banco BPM loan - Line A Euro Euribor + 1.4 2.00% 30,000 2021
Banco BPM loan - Line B Euro Euribor + 1.6 2.00% 30,000 2021
“Azimut 2019-2024” Bond Euro 1.625% 1.73% 500,000 2024
Redemptions:
Of which:
Banco BPM loan - Line A Euro Euribor + 1.4 2.00% -7,500 2020
SHAREHOLDERS' EQUITY
At 30 June 2020, consolidated shareholders' equity, including the profit for the period,
amounted to 657 million euro (748 million euro at 31 December 2019). This figure reflects
the effects of the dividend distribution approved by the shareholders in their ordinary
meeting called to approve the 2019 financial statements on 23 April 2020. The shareholders
resolved to pay a dividend of 1 euro per ordinary share, pre-tax, which was paid starting from
20 May 2020, 18 May 2020 ex-dividend payment date and 19 May 2020 as the record date.
The shareholders also approved the payment to Fondazione Azimut Onlus of 4.5 million euro,
equal to 1% of pre-tax consolidated profit and the payment of 37 euro for each profit-
participating financial instrument held by Top Key People at the time of approval of payment
of the dividend.
TREASURY SHARES
At 30 June 2020, Azimut Holding S.p.A.'s subsidiaries do not hold, nor did they hold during the
period, any treasury shares or shares of the Parent Company, either directly or via trust
companies or third parties.
In February and March 2020, 2,690,746 treasury shares were purchased, for a total of 45
million euro, implementing the resolution of Azimut Holding’s Board of Directors of 24
16
February 2020 and based on the authorisation issued pursuant to article 2357 of the Italian
Civil Code by the shareholders in their meeting of 24 April 2019.
Azimut Holding S.p.A.’s treasury share portfolio is composed of 5,010,197 shares, or 3.497%
of share capital.
No other transactions occurred after 30 June 2020 up to the date of this interim financial
report.
FINANCIAL MARKETS AND THE GLOBAL ECONOMY1
Background scenario The coronavirus (COVID-19) pandemic has paralysed the global economy. Measures taken by
governments across the globe to contain the spread of the virus imply a sharp decline in
economic activity in the near term. Such measures were introduced in China in late January,
while other countries enacted them later as the virus spread globally. While several countries
have recently started easing containment measures, this process is likely to be very gradual.
Economic activity, especially in emerging economies, is being adversely affected by sharply
lower commodity prices, tighter financial conditions and substantial capital outflows. These
severe global shocks hit the world economy at a time when signs of a stabilisation, following a
period of lacklustre performance last year, had been increasingly evident. In particular, a
nascent recovery in manufacturing activity and trade, led by large emerging economies, had
been under way at the turn of the year. Moreover, the favourable global financial conditions
prevailing at that time, as well as a partial de-escalation of the trade conflict between the
United States and China following the signing of the “phase one” trade agreement, had had the
potential to reinforce the recovery before the pandemic struck.
In light of these serious international disturbances, the macroeconomic projections made in
June 2020 by Eurosystem experts envisage that world real GDP (excluding the euro area) will
decline by 4.0% this year. The pace of this contraction is faster and its magnitude is much
greater than seen in the Great Recession. Following a sharp contraction in the first two
quarters of 2020, economic activity is projected to recover and grow by 6.0% in 2021 and
3.9% in 2022. Global trade will be affected more severely, as logistics disruptions and closed
borders amplify the impact of falling demand. Despite a sharp deterioration in the global
1 Source: ECB economic bulletin, Issue 4/2020

17
outlook, as embedded in the June projections, risks to this outlook are still skewed to the
downside.
International financial markets
In the United States, the pace of the contraction in economic activity is estimated to have
accelerated in the second quarter of 2020. Real GDP declined by 5.0% on an annual basis in
the first quarter, according to the second estimate. This contraction was slightly larger than
reported in the advance estimate. Higher frequency data suggest that the economic downturn
deepened further in the second quarter, as strict containment measures were in place across
the country in April. From late April US states started to gradually ease the containment
measures, which should help to support a recovery in the second half of 2020. It will be led by
a recovery in domestic demand backed by the strong economic policy support enacted to date.
However, the recovery is projected to be gradual, as consumer confidence remains at
depressed levels amid unprecedented job reduction recorded since late March. Employment
decreased by more than 22 million jobs and the unemployment rate reached 14.7% in April.
Annual headline consumer price inflation dropped sharply to 0.3% in April, from 1.5% in the
previous month.
In Japan, the economy has slipped into a technical recession. Activity declined in the fourth
quarter of last year due to a confluence of negative shocks, including a fall in domestic
demand as a result of the consumption tax hike, production disruptions caused by powerful
typhoons in October, and weak foreign demand. Subsequently, amid the COVID-19 outbreak,
real GDP contracted further, declining by 0.9% in the first quarter of 2020. Authorities’ efforts
to contain the virus weighed on domestic demand, especially private consumption of services
and semi-durable goods. Notably, exports of services fell markedly, reflecting lower spending
by inbound tourists owing to the travel restrictions imposed in reaction to the pandemic
outbreak. Japanese authorities stepped up policy support for the ailing economy. In April, the
Bank of Japan raised the limits on purchases of commercial paper and corporate bonds, eased
access to corporate funding facilities and purchased short-term and longer-term government
bonds. At its emergency meeting in May it decided to launch a new fund-provisioning measure
for banks to support lending to small and medium-sized enterprises.
In the United Kingdom the economic situation has deteriorated significantly. Real GDP fell by
2% in the first quarter of 2020, even though the economy was locked down for just the last
ten days of March, while annual consumer price inflation fell to 0.8% in April, down sharply
from 1.5% in the previous month. While the furlough scheme has helped to maintain
18
employment, the labour market situation has deteriorated markedly. Experimental ONS
(Office for National Statistics) data on benefit claimants – covering the unemployed, as well as
those receiving in-work benefits – showed that in mid-April more than two million citizens
were claiming some form of benefit. This is around one-third more than the number observed
during the Great Recession. High frequency data signal a further marked deterioration in the
second quarter, which implies a much more severe recession than occurred in the aftermath
of the global financial crisis. The government has announced a phased reopening of the
economy, which is expected to support a gradual recovery in the coming months.
Europe
Euro area activity saw an unprecedented fall in the first quarter of 2020, amid COVID-19
containment measures and the associated extreme uncertainty. Real GDP declined by a record
3.8%, in quarter-on-quarter terms, in the first quarter of 2020, in a context of stringent
lockdown policies implemented by most euro area countries from mid-March onwards. The
contraction caused by COVID-19 was heterogeneous across countries and sectors. Among the
largest euro area economies, there were stronger declines in economic activity in France, Italy
and Spain than in Germany and the Netherlands. Economic growth in euro area countries in
the first quarter of 2020 was negatively correlated with the restrictiveness of social distancing
measures and the lockdowns to contain the spread of COVID-19. Overall, the impact of the
lockdown measures translated into a marked contraction in euro area industrial production,
which declined by an unprecedented 11.3%, month on month, in March 2020, and by 3.3% in
quarter-on-quarter terms in the first quarter of 2020. Similarly, capacity utilisation dropped
sharply by 11 percentage points to 69.7% in the manufacturing sector and by around 5
percentage points to 85.6% in the services sector, according to survey data for the first
quarter of 2020.
Euro area labour markets have been severely affected by COVID-19 containment measures.
Employment declined by 0.2% in the first quarter of 2020, following an increase of 0.3% in
the fourth quarter of 2019. The muted decline in employment is mostly explained by policy
measures implemented in various countries, such as the introduction of short-time work
schemes and a complementary policy package aimed at preventing redundancies and
supporting self-employed workers. Short-time work schemes limit increases in the number of
unemployed workers while allowing for an increase in the flexibility of the labour market to
face cyclical fluctuations. At the current juncture, this involves a substantial reduction in
hours worked per person employed for a predetermined length of time. The decline in

19
employment recorded during the first quarter of 2020 is therefore less than the decline in
GDP, implying a marked 3.5% decline in labour productivity per person employed in the first
quarter of 2020.
Emerging markets
In China, the recovery is proceeding amid strong headwinds. These include weak external
demand prospects in the near term, as evidenced by the sharp fall in export orders, and a
gradual recovery in domestic demand. The latter reflects the remaining social distancing
measures in place, as well as generally more cautious consumer behaviour. The monetary and
policy stimulus enacted by the authorities will help to support economic activity. Looking
ahead, activity is expected to recover over the projection horizon. However, this recovery is
assumed to remain muted compared with the level of activity foreseen in the March
projections.
In Russia, the economy has been buffeted by recent energy market developments and by the
COVID-19 pandemic, taking a toll on external demand. At the same time, there has been a
steep rise in new domestic cases of infection, resulting in a tightening of measures to contain
the spread of the virus.
The production cuts agreed by OPEC+ countries to stabilise the global oil market, as well as
lower commodity prices, are expected to dampen investment. In Brazil, economic activity
deteriorated sharply owing to lockdowns, supply chain disruption, weaker external demand,
significant capital outflows and a negative terms of trade shock reflecting falling commodity
prices. Rising political tensions and the fact that the country is one of the worst-affected by
the pandemic, may complicate the provision of effective policy support for the economy.
ITALY'S ASSETS UNDER MANAGEMENT MARKET
According to Assogestioni's (Italy’s association of the investment management industry)
figures, the first half of the year, which was characterised by uncertainties due to the public
health emergency, was positive for 455 million thanks to preliminary inflows of the second
quarter, which exceeded 12.5 billion.
Assets under management rose to 2,239 billion thanks to the combined effect of inflows and
asset management services. In addition to open-ended funds, inflows grew in relation to
equity (+2.1 billion) and balanced (+187 million) funds.

20
ITALY'S FINANCIAL PRODUCT AND SERVICE DISTRIBUTION MARKET
Assoreti's (Italy’s association of the sales networks in the financial services industry) surveys
show total inflows of 3.6 billion euro for authorised off-premises financial advisors (-12.1%
on May). Almost 85% of monthly net investments refer to assets under management products,
for a total of 3.0 billion euro (+7.4%), while total assets under custody products are equal to
545 million (-56.2%). The results for the first six months of the year are therefore positive at
22.4 billion euro, up by 30.4% compared to the same period of the previous year (17.2
billion); the growth trend was driven by both volumes of inflows from assets under
management, amounting to 8.9 billion (+37.9%), and those from assets under custody,
amounting to 13.5 billion euro (+25.8%).
With respect to assets under management, net inflows continued to involve mainly mutual
funds, which confirmed the levels reached in the previous month (1.5 billion euro), almost
entirely concentrated on collective portfolio management under foreign law. Direct
investments in fund units continued to focus on share products (1.0 billion euro); the monthly
balance was also positive for flexible funds (238 million) and bonds (145 million). The net
resources allocated to the insurance/social security segment amounted to 970 million euro,
up 8.7%. The increase refers to multi-branch policies (251 million) and traditional life
insurance policies (265 million), while unit-linked policies (410 million) remained at the May
levels. The changes in discretionary portfolios was positive for 583 million euro (+34.4%): the
drive for growth came from both discretionary funds (GPF), with net inflows of 405 million
euro (+12.0%), and securities management (GPM), with net investments that more than
doubled to 177 million euro.
The monthly contribution of networks to open-ended UCI, through the direct and indirect
distribution of units, is positive for 2.5 billion euro, or 58.3% of the net inflows for the entire
open-ended funds system (4.4 billion euro). Since the beginning of the year, the contribution
has risen to 7.3 billion euro, offsetting the outflows of the other distribution channels as a
whole and bringing the interim financial statements of the entire system to a positive 923
million euro.
Net inflows from administered financial instruments are a positive 801 million euro: the
monthly change on bonds, certificates and shares mainly refers to purchase orders over sales,

21
while the balance was negative for government bonds. Outflows of liquidity amounted to 256
million.

22
2 - SIGNIFICANT EVENTS OF THE YEAR
2.1 - Capitalisation transactions carried out by Azimut Holding S.p.A. In the first half of 2020, following the Board of Directors' resolution of 12 December 2019,
Azimut Holding S.p.A. made a cash capital injection of 56 million euro to increase the share
capital of the subsidiary AZ International Holdings SA and finance the Group's international
development.
On 6 February 2020, Azimut Holding S.p.A.’s Board of Directors approved a capital
contribution to Azimut Libera Impresa SGR S.p.A. of up to 18 million euro, to be disbursed in
the form of a shareholder loan in order to provide the company with adequate funds and
strengthen the alternative investment funds offered by Azimut Libera Impresa, in addition to those
already launched in the first half of 2020. On 28 February 2020, Azimut Holding S.p.A. disbursed
the first instalment of the shareholder loan (3 million euro).
2.2 - Purchases of treasury shares by Azimut Holding S.p.A.
On 24 February 2020, Azimut Holding’s Board of Directors, based on the authorisation issued
pursuant to Article 2357 of the Italian Civil Code by the Shareholders' Meeting of 24 April
2019, resolved to avail itself of the above authorisation and to purchase, in a tranche, treasury
shares. Therefore, in February and March 2020, 2,690,746 treasury shares were purchased,
for a total of 45 million euro.
2.3 - Transactions carried out in the first half of 2020 by AZ International Holdings SA On 31 January 2020, the acquisition of 100% of JPH Group Holdings Pty Ltd, a financial
advisory company based in Australia, was finalised through the local sub-holding AZ Next
Generation Advisory Pty Ltd. The consideration amounted to approximately 6 million euro.
On 11 February 2020 the sale of Mofid Entekhab Asset Management to a third party was
completed. AZ International Holdings SA owned 20% of the company which was an asset
management company operating in Iran. The sale generated a loss of 1.7 million euro, equal to
the carrying amount already recognised in the consolidated financial statements at 31
December 2019.
On 12 March 2020, AZ International Holdings Sa set up Azimut Private Capital Management
Sarl based in Luxembourg and wholly owned. The company, inter alia (i) sets up alternative
23
funds (private equity and private debt) and (ii) appoints alternative investment fund
managers (AIFMs) to manage such funds.
In Brazil, the combination that increased AZ International Holdings SA's investment to 80%
was completed in May 2020. Specifically, the purchase options related to part of the residual
investment were exercised as per the original agreements, entailing a total outflow of
approximately 27 million euro. This transaction is part of the original plans and marks the
end of the second step of the process for the development of a management and distribution-
integrated business model.
2.4 - Azimut Holding S.p.A. General Shareholders’ Meeting of 23 April 2020
The shareholders’ meeting (both ordinary and extraordinary) of 23 April 2020 resolved the
following:
Approval of 2019 financial statements
The shareholders’ meeting approved the 2019 financial statements, which included a Parent
Company net profit of 209.1 million euro. The shareholders concurrently resolved to pay a
dividend of 1 euro per ordinary share, pre-tax, which was paid as of 20 May 2020, 18 May
2020 ex-dividend payment date and 19 May 2020 as the record date. The shareholders also
approved the payment to Fondazione Azimut Onlus of 4.5 million euro, equal to 1% of pre-tax
consolidated profit and the payment of 37 euro for each profit-participating financial
instrument held by Top Key People at the time of approval of payment of the dividend.
Proposal for purchase and allocation of treasury shares and consequent resolutions
The Shareholders approved the purchase of up to 14,000,000 Azimut Holding S.p.A. ordinary
shares, or 9.77% of the current share capital, considering the shares already in portfolio upon
purchase. The purchase price will be a minimum unit price equal to at least the carrying
amount of Azimut Holding S.p.A. ordinary shares and a maximum unit price of 35 euro. The
Shareholders also approved the whitewash mechanism that exempts the relative majority
shareholder from the obligation of a full public tender offer in case it exceeds the relevant
threshold (25% ownership) as a consequence of the purchase of treasury shares (subsequent
to today's date).
24
Resolution on remuneration policies. Remuneration Report and resolution pursuant to article
123-ter, paragraph 6 of Legislative decree no. 58/98.
The Shareholders approved the second section of the point of the company policy concerning
remuneration of members of the management boards, general managers and key managers,
as well as the procedures used to adopt and implement said policy. They did not approve the
first section.
2.5 - Partnership with BorsadelCredito.it to finance SMEs rapidly and digitally On 22 April 2020, the Azimut Group entered into an agreement with BorsadelCredito.it, Italy’s
pioneer in business peer-to-peer lending, to finance SME’s rapidly and reliably.
Azimut is therefore expanding its activity to support the real economy and Italian companies,
channelling resources to this sector in new ways. The initiative launched by Azimut stems
from the awareness that digital innovation has opened up new opportunities for loans to
businesses, especially for SMEs that have more difficulty in obtaining loans.
BorsadelCredito.it's technology offers an extremely rigorous and reliable credit rating
analysis - through a fully digital procedure - in 48 hours, thus ensuring speed and social
distancing measures in the loan application process.
The loans will benefit from the guarantee issued by the Guarantee Fund of Mediocredito
Centrale up to 90% of the amount granted. The transaction amounts to 100 million euro.
The agreement with BorsadelCredito.it is a further step that Azimut, leveraging its integrated
business model that includes management and distribution, is taking to bring businesses
closer to asset management. Furthermore, the exclusively online management of applications
and the allocation of funds to Italian SMEs include this project among Azimut's support
actions for individuals and businesses in the Covid-19 emergency, with initiatives ranging
from the purchase of health care equipment to the development of an investment vehicle -
Azimut Sostieni Italia - which, through crowdfunding, aims to help the recovery of the
businesses hardest hit by the lockdown.
2.6 - Azimut, together with Canson Capital Partners and Ardian, invests in INWIT, the
largest Italian tower operator. The transaction is one of the most significant "Private
Investment in Public Equity" transactions

25
On 24 June 2020, the Azimut Group announced its participation in one of the largest Private
Investment in Public Equity (“PIPE”) transactions by investing in INWIT (Infrastrutture
Wireless Italiane) S.p.A., the largest Italian tower operator and second largest independent
player in Europe. Azimut's investment in INWIT, through a co-investment vehicle controlled
by Canson Capital Partners, takes place alongside a consortium led by Ardian, a leading global
private investment company. The investment in INWIT will provide Azimut's customers with
exposure to the strategic sector of telecoms infrastructure, which, especially during the Covid-
19 pandemic, demonstrated its importance to Italy’s continued technological progress.
The transaction is concurrent to that announced by Ardian and TIM, in which a consortium of
institutional investors controlled by Ardian is investing in a holding entity (the "Holding"),
which will own a 30.2% stake in INWIT held by TIM.
In particular, the Luxembourg-based vehicle Azimut Private Equity I SCSp ("Azimut PE I") will
co-invest with Canson Capital Partners, led by co-founder Matteo Canonaco, and Marco
Patuano, an industry leader in the European telecommunications sector. Azimut PE I, through
a vehicle controlled by Canson Capital Partners, will acquire up to 3% of the capital of INWIT
from TIM, subject to the fulfilment of certain conditions precedent, at the same valuation as
the Ardian transaction.
The transaction is subject to a number of conditions precedent.
In July 2020, Azimut Holding S.p.A., acting as one of the sponsors of this project, paid 71
million euro to Azimut Private Equity I SCSp. Over the next few months, through the Group's
distribution network, Azimut's customers will be able to join the transaction entirely and/or
in part, taking over the portion subscribed by the Parent Company.
2.7 - Full demerger of CGM Italia SGR S.p.A. into Azimut Capital Management SGR S.p.A.
and Azimut Libera Impresa SGR S.p.A.
In December 2019, the operations necessary for the full demerger of CGM Italia SGR S.p.A. into
Azimut Capital Management SGR S.p.A. and Azimut Libera Impresa SGR S.p.A. began pursuant
to article 2506 of the Italian Civil Code. As part of this operation, for purely instrumental and
functional reasons, the Parent Company will acquire 100% of CGM Italia SGR S.p.A. from CGM
- Azimut Monaco Sa, given that it already holds indirectly this investment as the head of the
chain of investors. Bank of Italy authorised the operation on 30 June 2020. The demerger is
expected to take place in the fourth quarter of the year.

26
2.8 - Other significant events of the year Background and impacts of Covid-19
As already discussed in the first paragraphs of this consolidated interim financial report, the
current global emergency caused by Covid-19 (Coronavirus) represents a factor of instability
that, in general, significantly affects the macroeconomic scenarios of the countries in which the
Azimut Group operates.
Also based on the ESMA document dated 20 May 2020 "Public statement on half-yearly
financial reports in relation to Covid-19" and Consob document dated 16 July 2020 “Covid-19 -
Focus on financial reporting", specific detailed information is provided below on the impacts of the
Coronavirus and the actions taken by the Group to deal with this emergency.
Financial performance for the first half of 2020
The first six months of the year were affected by the global health emergency. However, the
Group was able to react promptly and at various levels, achieving strong results even in a
profoundly uncertain context. The weighted average net performance since 2019 has in fact
largely returned to positive territory and is now close to +4%. During the period, the Group also
met all the commitments made with shareholders, unlike almost all Italian financial institutions,
distributing a dividend of 1 euro per share (for a total cash out of 137 million euro) and
completing buybacks for 44 million euro. Based on the profit for the period, the Group can
achieve the target of a net profit for the year of 300 million euro that it had set at the
beginning of the year. In July, the Group also announced the first acquisition in the US
alternative sector, establishing a long-term commitment and joining forces with Kennedy
Lewis, a leading private credit firm founded by top-level professionals. The strength of the
Group's integrated business model includes internal management skills, deriving from the
contribution of over 100 professionals spread across the various international hubs (making
Azimut the only Italian company whose managers operate in real time in open markets on all
continents), and a network of financial advisors consisting of over 1,800 colleagues in Italy, as
well as several partners abroad. Thanks to these values, the Group has been able to seize the
available opportunities by offering its customers innovative and unique solutions, such as the
club deal to participate in one of the largest Private Investment In Public Equity transactions in
INWIT (Infrastrutture Wireless Italiane) S.p.A., and strengthened its commitment to investing
in the real economy by promoting the AZ Eltif Ophelia fund, which benefits from the tax
advantages available to alternative individual investment plans (PIR), and the first private

27
debt fund with an access threshold of 5 thousand euro. Thanks to these new solutions the
Group has enriched the range of offerings on the private markets, which saw the recent
closing of the Demos I private equity fund subscriptions, to which over 9,500 customers
participated.
Impacts on the Group's business
The Covid-19 pandemic did not impact the Group's operating result, whose inflows maintained
a positive pace during the first half of the year, totalling 1.8 billion euro, confirming the good
performance of operations, especially in the asset management segment, thanks also to the
new investment solutions described earlier. The analysis of the income statement prepared for
management purposes shows a decrease in revenues, negatively influenced by lower
performance fees due to the performance of the financial markets in the first half of the year.
However, this decrease was offset by a reduction in acquisition costs which also reflect the
measures implemented by the Group in response to the Covid-19 crisis, including the
suspension of events and the reduction in marketing expenses. Administrative costs rose due to
the increase in the number of companies acquired by the Group in the previous 12 months.
The Group immediately adopted a remote working scheme to ensure the health and safety of
its employees. However, this had no impact on administrative costs in terms of the technological
equipment to be provided to employees, as the companies were in fact already equipped to
deal with this new working method. Conversely, financial income was adversely affected by
market trends due to the Covid-19 pandemic. Non-recurring charges were affected by the local
measures aimed at responding to the Covid-19 emergency, as described in the section on the
Group's operations below. In addition to the extremely positive results achieved during the first
six months of the year, company management constantly monitored the performance of the
Group's inflows and results, both at individual CGU and at individual entity level, without
finding, even if partially impacted by the volatility of the markets, significant deviations that
could lead to consider and/or implement impairment actions on the recognised intangible
assets. For additional information, reference should be made to the relevant section of the notes
to the financial statements.
28
Key Risks
The current pandemic event, caused by the outbreak of Covid-19, has increased the exposure
to certain risks that impact various components: human resources management, company
processes, information systems and outsourcers.
With regard to human resources, the Group has put in place all the necessary measures to
guarantee the continuity of work and the health of its employees. Specifically:
- the remote working scheme has been applied to the entire week;
- business travel has stopped;
- access rules and restrictions have been established, which provide for the measurement
of body temperature at the entrance to the premises and the spacing of workstations;
- all internal and external physical meetings were suspended, as well as Group events;
- offices are still subject to extraordinary cleaning and sanitation measures with
intensified cleaning services; distribution of hand disinfectants and daily cleaning;
- a healthcare policy has been taken out in favour of employees if Covid-19 is contracted.
Pandemic risk management has also stressed the ordinary performance of processes, both
internal and managed through external suppliers (outsourcers). In order to guarantee the
business continuity of all critical processes, the following procedures have been implemented:
- allocation of laptops to certain employees and of VPN access for remote work purposes.
All actions deemed necessary to mitigate any risk of IT infrastructure malfunctioning
due to the increase in the number of people working remotely and the type of internet
connection, other than the internal network, have been taken;
- the Group's outsourcers have put in place the necessary actions to ensure the
performance of outsourced services. No critical issues were identified in this respect.
Finally, the Group has no liquidity issues despite the extreme volatility of the financial markets
which began at the end of February. Indeed, in order to mitigate this risk, it adopted a policy for
the optimisation of financial resources management. Specifically, the Group maintains an
adequate level of liquidity available thanks to constant cash flow generation and by promptly
monitoring forecast needs based on financial planning.
Group activities in support of the Covid-19 emergency
29
Since March 2020, the Azimut Group, with a strong sense of responsibility and solidarity, has
promptly taken action in support of the community. Indeed, it promptly made every effort to
purchase lung ventilators, medical equipment and protective devices to be donated to
hospitals and healthcare facilities in the Italian areas most affected by the emergency.
Through the Sustainability Committee, set up within the holding company in 2019, and the
local organisation "AZIONE Azimut per le Comunità", created by financial advisors to support
local social responsibility projects, the Group has identified and communicated with local
hospitals and institutions in order to understand their most urgent needs and sought out
suppliers of medical equipment and devices through which they can quickly purchase and
deliver the necessary materials. This is a considerable commitment made during the most
critical phase of the epidemic, when finding those tools was the absolute priority and led the
Sustainability Committee to actively select those assets on the international market, thanks to
the contribution of colleagues working in the various Azimut offices around the world. The
wealth of contacts and information quickly built up was also made available to other
companies and bodies that contacted the Group to gain access to selected suppliers and
resulted in the creation of the web portal www.azimutperlecomunita.it, managed by the
"AZIONE Azimut per le Comunità" group, which mainly targets companies supplying and
manufacturing medical devices. In addition, a specific current account has been created at the
Azimut Onlus Foundation to collect new donations from employees, collaborators and
customers for the purchase of additional medical devices and materials. For every euro
donated to the account, Azimut has donated the same amount, up to a total of 1 million euro
for the entire Group. In detail, since the beginning of the pandemic, Azimut has bought and
donated 43,650 masks, 17,205 gowns and suits, 6,000 shoe covers, 2,044 visors, 170 medical
equipment (saturometers, disposable bronchoscopes, phonendoscopes and
sphinomanometers), 46 lung ventilators (35 of which are rented), 14 resuscitation beds and
relative covers, 5 three-sheet screens, 3 monitors and monitoring centres at 32 Italian
hospitals, in 12 regions of Italy, for over 470 thousand euro. The Group's commitment to the
community has been directed not only at the health sector, but also at the care sector by
involving the Azimut Onlus Foundation, whose aim is social solidarity in favour of people in
economic need. Given the exceptional nature of the period, the Foundation directly supported
the local organisations that guarantee immediate assistance to the poor, reported by
colleagues from Group companies active in those associations, for an economic commitment
of over 600 thousand euro.
30
Charitable activities go beyond the actions undertaken during the crisis by Azimut which,
following the rapid worsening of the macro context, has also promoted tangible initiatives to
support the Italian economy. In line with the solutions and projects to support businesses that
the Group has been implementing for some time now, at the beginning of April, it unveiled the
"Azimut Sostieni Italia" project for the resumption of worthy businesses with the aim of
generating a return for investors. Specifically, it is an investment vehicle designed to channel
private capital, raised through an equity crowdfunding campaign, directly to selected
businesses (bars and restaurants) which, blocked by the emergency, need capital in the
reopening phase. At a time of growing liquidity needs on the part of businesses, Azimut has
also signed an agreement with BorsadelCredito.it, the Italian pioneer of peer-to-peer lending
to businesses, to channel resources to companies in new ways. The collaboration, which stems
from the awareness that digital innovation has opened up new opportunities for loans to
businesses, especially for SMEs that have more difficulty in obtaining loans, uses
BorsadelCredito.it's technology which offers an extremely rigorous and reliable credit rating
analysis through a fully digital procedure.
AZIMUT HOLDING S.P.A. AND GROUP: MAIN RISKS AND UNCERTAINTIES
The main risks and uncertainties to which Azimut Holding S.p.A. and the Group are exposed
are as follows:
- Strategic risk;
- Sales network risks;
- Operational risk;
- Outsourcing risk;
- Reputational risk;
- Compliance risk;
- Financial risk;
- Liquidity risk.
For further information on the main risks and uncertainties for the Group, in addition to that
described about the impact of Covid-19, reference should be made to the consolidated
financial statements at 31 December 2019.
31
RELATED-PARTY DISCLOSURES
Pursuant to Consob Regulation on Related Parties (Resolution No. 17221 of 10 March 2010, as
amended), on 22 November 2010, the Board of Directors of Azimut Holding S.p.A. approved
the procedures that ensure transparency and fairness of related-party transactions (“Related-
Party Transaction Procedure” available on Azimut’s website at www.azimut-group.com).
With reference to paragraph 8 of article 5 of the Consob regulation on periodic disclosure of
related-party transactions, the Group did not engage in any “significant” transactions during
the first half of 2020.
No other atypical or unusual transactions were performed.
Disclosures on other related-party transactions carried out as part of ordinary business
activities are provided in the relevant paragraph in the notes to the condensed consolidated
interim financial statements.
ORGANISATIONAL STRUCTURE AND CORPORATE GOVERNANCE
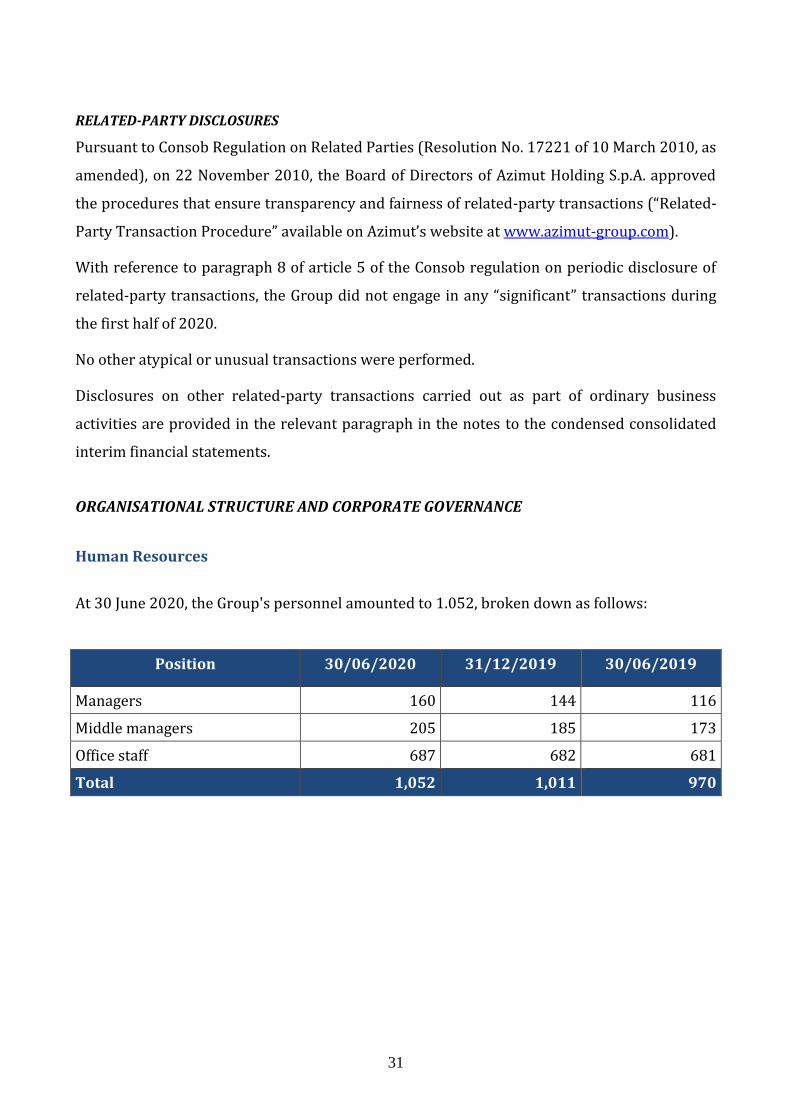
Human Resources
At 30 June 2020, the Group's personnel amounted to 1.052, broken down as follows:
Position 30/06/2020 31/12/2019 30/06/2019
Managers 160 144 116
Middle managers 205 185 173
Office staff 687 682 681
Total 1,052 1,011 970
32
BUSINESS OUTLOOK
Given the above figures and the positive results of the subsidiaries in the first six months of
the year, consolidated performance is expected to be positive this year.
This year’s financial position and results of operations will also be affected by financial
market trends, whose volatility is also particularly high following the outbreak of the
Coronavirus. However, in this first half of the year, the Group's financial performance
confirms the solidity of the business model and the Group's ability to deal with situations such
as the one that has characterised the European and world markets in recent months, as
described in the previous section on the impact of Covid-19.
Milan, 30 July 2020
Chief Executive Officer
On behalf of the Board of Directors
(Gabriele Roberto Blei)
33
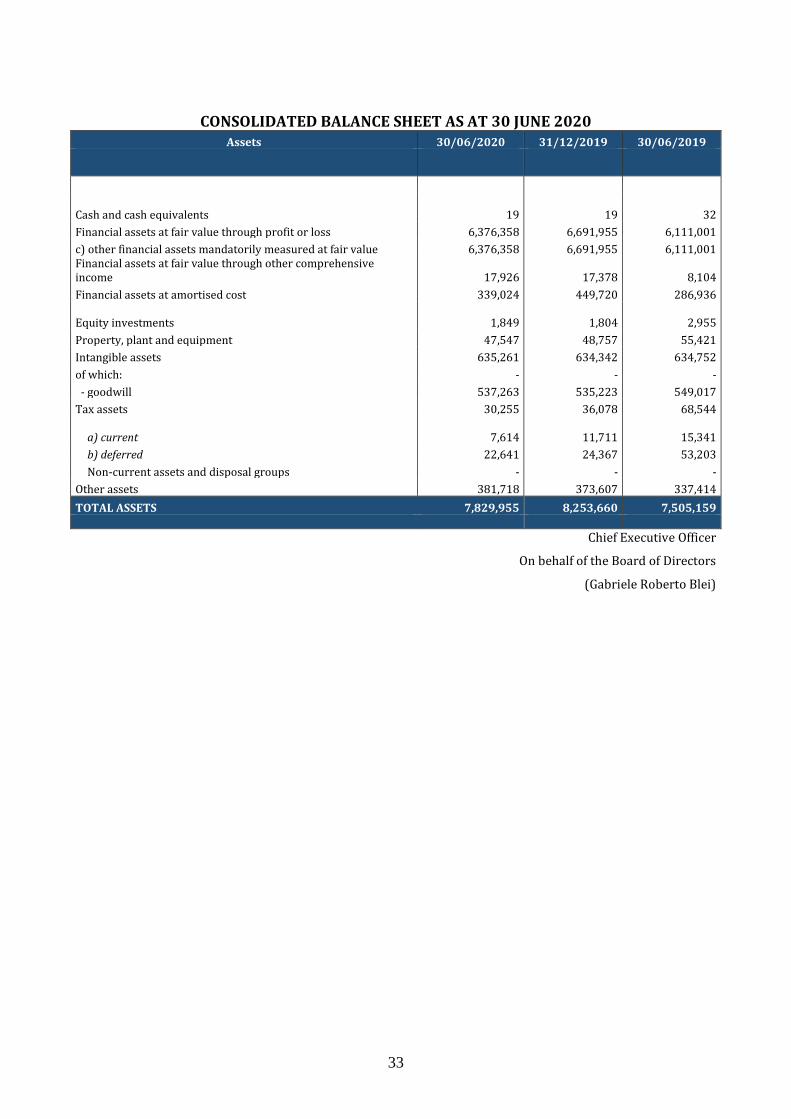
CONSOLIDATED BALANCE SHEET AS AT 30 JUNE 2020 Assets 30/06/2020 31/12/2019 30/06/2019
Cash and cash equivalents
19
19
32
Financial assets at fair value through profit or loss 6,376,358 6,691,955 6,111,001
c) other financial assets mandatorily measured at fair value 6,376,358 6,691,955 6,111,001 Financial assets at fair value through other comprehensive income 17,926 17,378
8,104
Financial assets at amortised cost 339,024 449,720 286,936
Equity investments
1,849
1,804
2,955
Property, plant and equipment 47,547 48,757 55,421
Intangible assets 635,261 634,342 634,752
of which: - - -
- goodwill 537,263 535,223 549,017
Tax assets 30,255 36,078 68,544
a) current
7,614 11,711 15,341
b) deferred 22,641 24,367 53,203
Non-current assets and disposal groups - - -
Other assets 381,718 373,607 337,414
TOTAL ASSETS 7,829,955 8,253,660 7,505,159
Chief Executive Officer
On behalf of the Board of Directors
(Gabriele Roberto Blei)
34
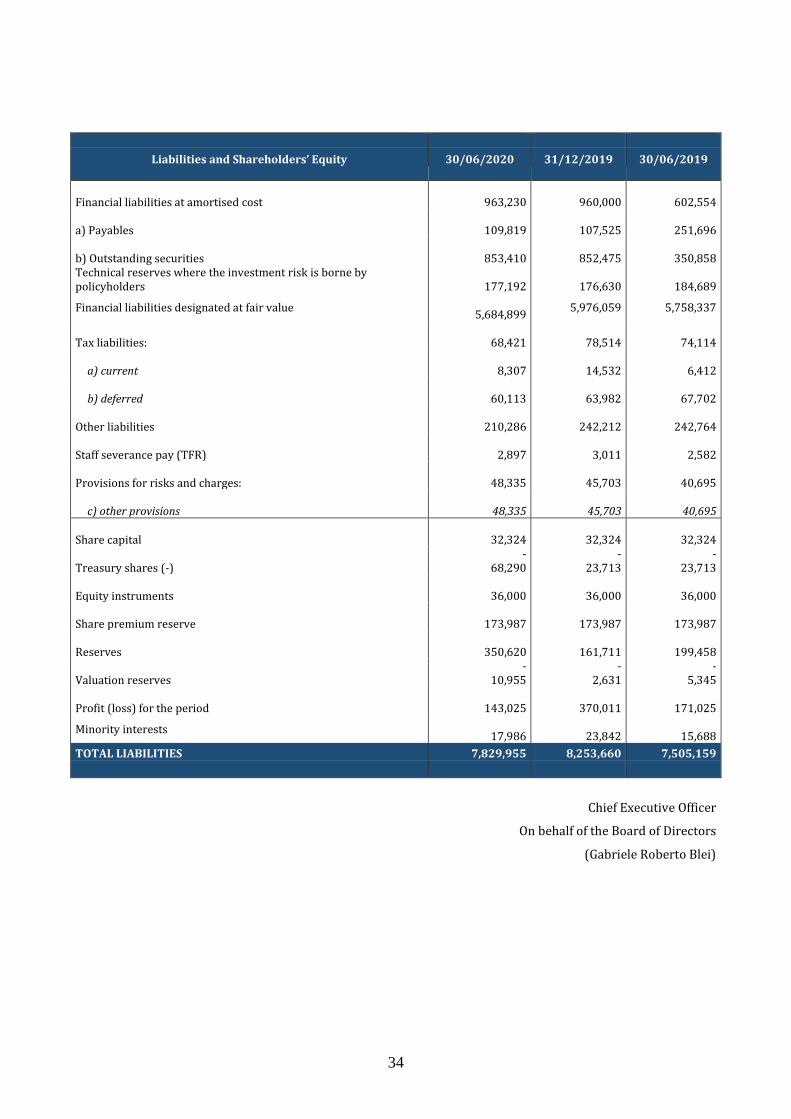
Liabilities and Shareholders’ Equity 30/06/2020 31/12/2019 30/06/2019
Financial liabilities at amortised cost
963,230
960,000
602,554
a) Payables
109,819
107,525
251,696
b) Outstanding securities
853,410
852,475
350,858 Technical reserves where the investment risk is borne by policyholders
177,192
176,630
184,689
Financial liabilities designated at fair value
5,684,899 5,976,059 5,758,337
Tax liabilities:
68,421
78,514
74,114
a) current
8,307
14,532
6,412
b) deferred
60,113
63,982
67,702
Other liabilities
210,286
242,212
242,764
Staff severance pay (TFR)
2,897
3,011
2,582
Provisions for risks and charges:
48,335
45,703
40,695
c) other provisions
48,335 45,703 40,695
Share capital
32,324
32,324
32,324
Treasury shares (-) -
68,290 -
23,713 -
23,713
Equity instruments
36,000
36,000
36,000
Share premium reserve
173,987
173,987
173,987
Reserves
350,620
161,711
199,458
Valuation reserves -
10,955 -
2,631 -
5,345
Profit (loss) for the period
143,025
370,011
171,025
Minority interests
17,986
23,842
15,688
TOTAL LIABILITIES 7,829,955 8,253,660 7,505,159
Chief Executive Officer
On behalf of the Board of Directors
(Gabriele Roberto Blei)
35
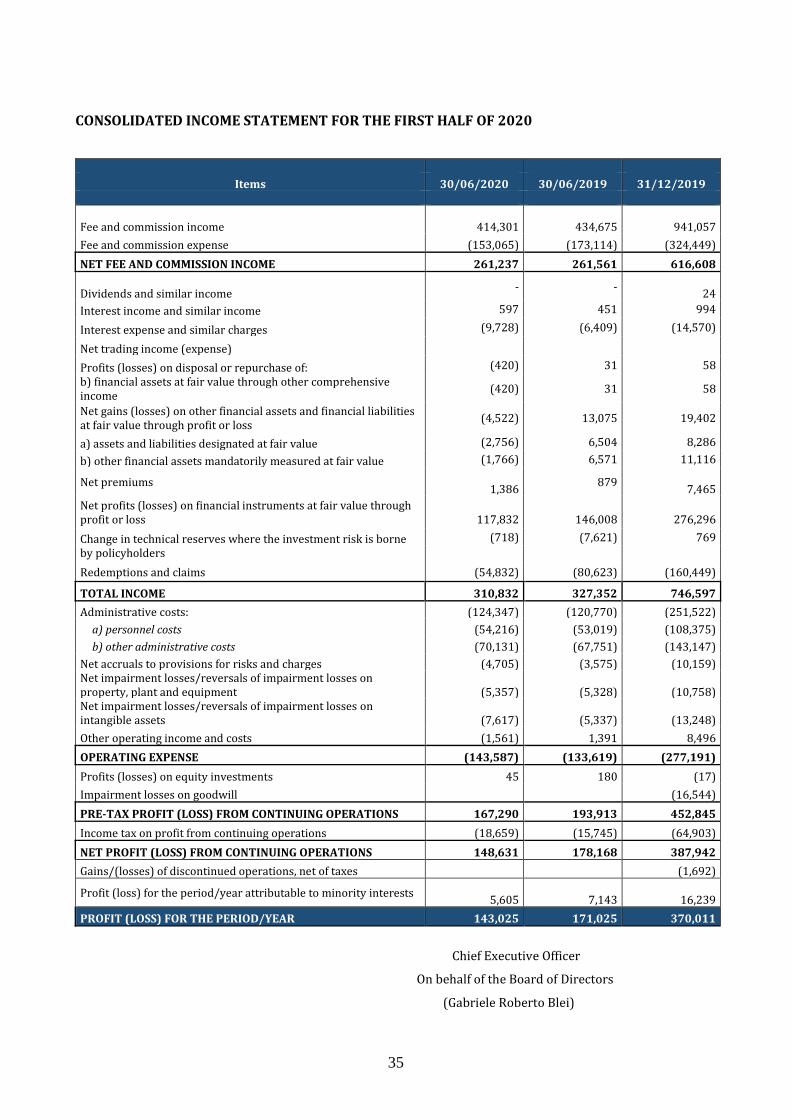
CONSOLIDATED INCOME STATEMENT FOR THE FIRST HALF OF 2020
Items 30/06/2020 30/06/2019 31/12/2019
Fee and commission income
414,301
434,675
941,057
Fee and commission expense (153,065) (173,114) (324,449)
NET FEE AND COMMISSION INCOME 261,237 261,561 616,608
Dividends and similar income - -
24
Interest income and similar income 597 451 994
Interest expense and similar charges (9,728) (6,409) (14,570)
Net trading income (expense)
Profits (losses) on disposal or repurchase of: (420) 31 58
b) financial assets at fair value through other comprehensive income
(420) 31 58
Net gains (losses) on other financial assets and financial liabilities at fair value through profit or loss
(4,522) 13,075 19,402
a) assets and liabilities designated at fair value (2,756) 6,504 8,286
b) other financial assets mandatorily measured at fair value (1,766) 6,571 11,116
Net premiums
1,386 879
7,465
Net profits (losses) on financial instruments at fair value through profit or loss
117,832
146,008
276,296
Change in technical reserves where the investment risk is borne by policyholders
(718) (7,621) 769
Redemptions and claims (54,832) (80,623) (160,449)
TOTAL INCOME 310,832 327,352 746,597
Administrative costs: (124,347) (120,770) (251,522)
a) personnel costs (54,216) (53,019) (108,375)
b) other administrative costs (70,131) (67,751) (143,147)
Net accruals to provisions for risks and charges (4,705) (3,575) (10,159) Net impairment losses/reversals of impairment losses on property, plant and equipment (5,357) (5,328) (10,758) Net impairment losses/reversals of impairment losses on intangible assets (7,617) (5,337) (13,248)
Other operating income and costs (1,561) 1,391 8,496
OPERATING EXPENSE (143,587) (133,619) (277,191)
Profits (losses) on equity investments 45 180 (17)
Impairment losses on goodwill (16,544)
PRE-TAX PROFIT (LOSS) FROM CONTINUING OPERATIONS 167,290 193,913 452,845
Income tax on profit from continuing operations (18,659) (15,745) (64,903)
NET PROFIT (LOSS) FROM CONTINUING OPERATIONS 148,631 178,168 387,942
Gains/(losses) of discontinued operations, net of taxes (1,692)
Profit (loss) for the period/year attributable to minority interests
5,605
7,143 16,239
PROFIT (LOSS) FOR THE PERIOD/YEAR 143,025 171,025 370,011
Chief Executive Officer
On behalf of the Board of Directors
(Gabriele Roberto Blei)
36
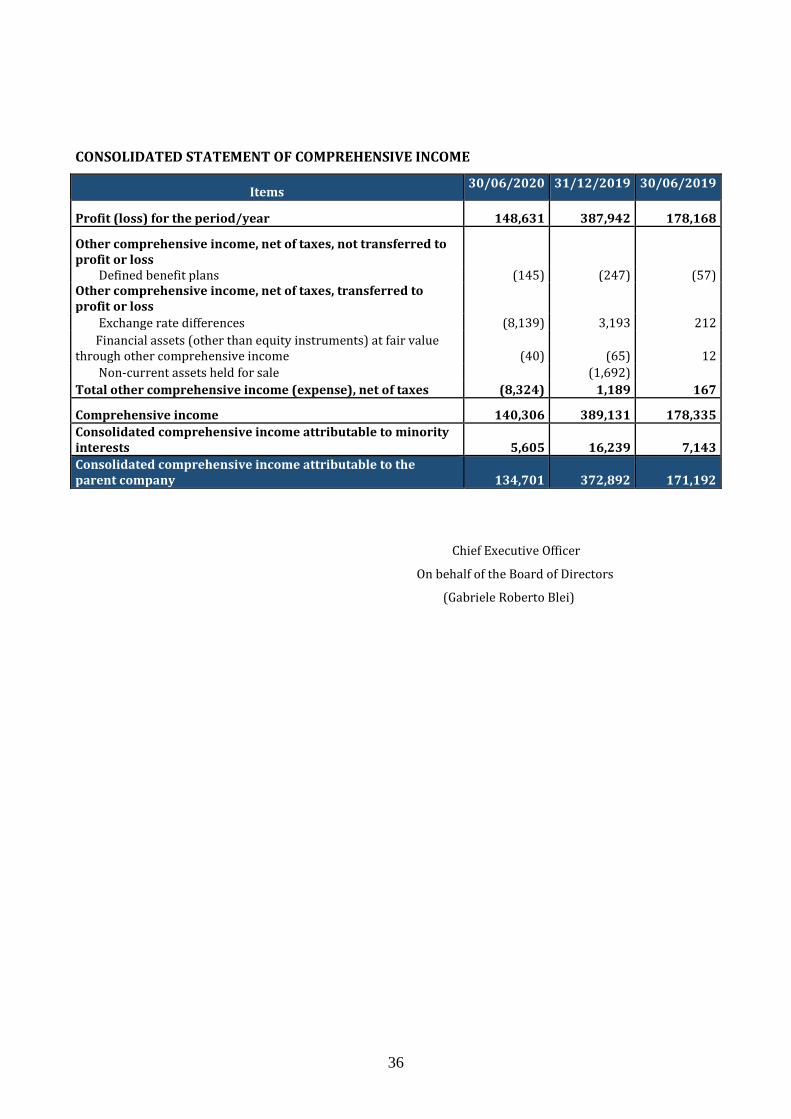
CONSOLIDATED STATEMENT OF COMPREHENSIVE INCOME
Items 30/06/2020 31/12/2019 30/06/2019
Profit (loss) for the period/year 148,631 387,942 178,168
Other comprehensive income, net of taxes, not transferred to profit or loss Defined benefit plans (145) (247) (57) Other comprehensive income, net of taxes, transferred to profit or loss
Exchange rate differences (8,139) 3,193 212
Financial assets (other than equity instruments) at fair value through other comprehensive income (40) (65) 12
Non-current assets held for sale (1,692)
Total other comprehensive income (expense), net of taxes (8,324) 1,189 167
Comprehensive income 140,306 389,131 178,335
Consolidated comprehensive income attributable to minority interests 5,605 16,239 7,143
Consolidated comprehensive income attributable to the parent company 134,701 372,892 171,192
Chief Executive Officer
On behalf of the Board of Directors
(Gabriele Roberto Blei)
37
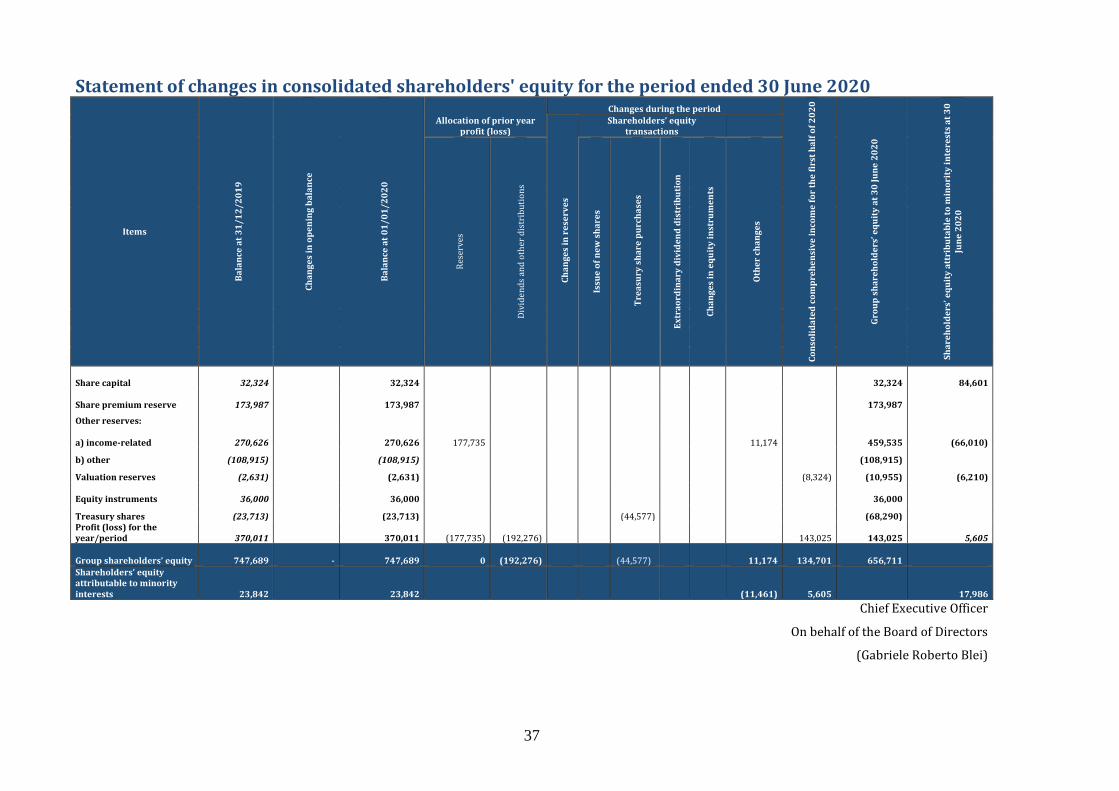
Statement of changes in consolidated shareholders' equity for the period ended 30 June 2020
Items B
ala
nce
at
31
/1
2/
20
19
Ch
an
ge
s in
op
en
ing
ba
lan
ce
Ba
lan
ce a
t 0
1/
01
/2
02
0
Allocation of prior year profit (loss)
Changes during the period
Co
nso
lid
ate
d c
om
pre
he
nsi
ve
in
com
e f
or
the
fir
st h
alf
of
20
20
Gro
up
sh
are
ho
lde
rs’ e
qu
ity
at
30
Ju
ne
20
20
Sh
are
ho
lde
rs’ e
qu
ity
att
rib
uta
ble
to
min
ori
ty i
nte
rest
s a
t 3
0
Jun
e 2
02
0
Ch
an
ge
s in
re
serv
es
Shareholders’ equity transactions
Res
erv
es
Div
iden
ds
and
oth
er d
istr
ibu
tio
ns
Issu
e o
f n
ew
sh
are
s
Tre
asu
ry s
ha
re p
urc
ha
ses
Ex
tra
ord
ina
ry d
ivid
en
d d
istr
ibu
tio
n
Ch
an
ge
s in
eq
uit
y i
nst
rum
en
ts
Oth
er
cha
ng
es
Share capital
32,324 32,324
32,324 84,601
Share premium reserve
173,987
173,987 173,987
Other reserves:
a) income-related 270,626
270,626 177,735 11,174 459,535 (66,010)
b) other (108,915) (108,915) (108,915)
Valuation reserves (2,631) (2,631) (8,324) (10,955) (6,210)
Equity instruments
36,000 36,000 36,000
Treasury shares (23,713) (23,713) (44,577) (68,290) Profit (loss) for the year/period 370,011
370,011 (177,735) (192,276)
143,025 143,025 5,605
Group shareholders’ equity
747,689 -
747,689 0 (192,276) (44,577) 11,174
134,701 656,711
Shareholders’ equity attributable to minority interests
23,842 23,842 (11,461) 5,605 17,986
Chief Executive Officer
On behalf of the Board of Directors
(Gabriele Roberto Blei)
38
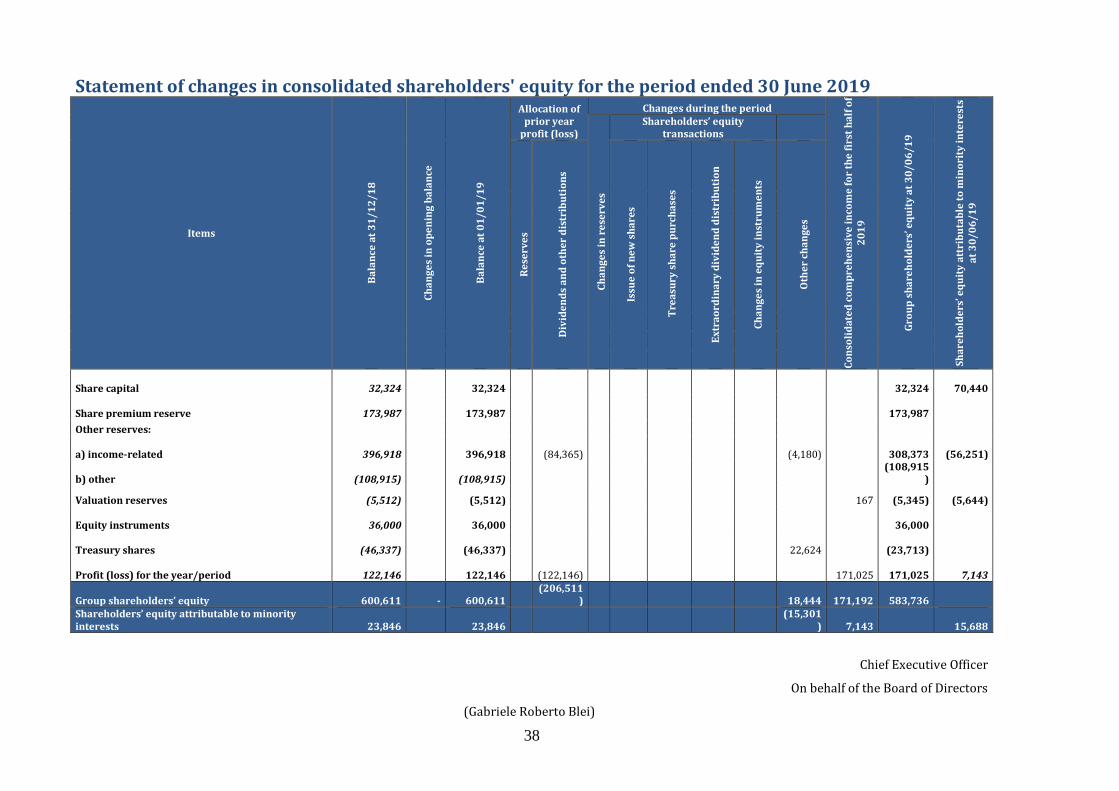
Statement of changes in consolidated shareholders' equity for the period ended 30 June 2019
Items
Ba
lan
ce a
t 3
1/
12
/18
Ch
an
ge
s in
op
en
ing
ba
lan
ce
Ba
lan
ce a
t 0
1/
01
/19
Allocation of prior year
profit (loss)
Changes during the period
Co
nso
lid
ate
d c
om
pre
he
nsi
ve
in
com
e f
or
the
fir
st h
alf
of
20
19
Gro
up
sh
are
ho
lde
rs’ e
qu
ity
at
30
/0
6/
19
Sh
are
ho
lde
rs’ e
qu
ity
att
rib
uta
ble
to
min
ori
ty i
nte
rest
s a
t 3
0/
06
/1
9
Ch
an
ge
s in
re
serv
es
Shareholders’ equity transactions
Re
serv
es
Div
ide
nd
s a
nd
oth
er
dis
trib
uti
on
s
Issu
e o
f n
ew
sh
are
s
Tre
asu
ry s
ha
re p
urc
ha
ses
Ex
tra
ord
ina
ry d
ivid
en
d d
istr
ibu
tio
n
Ch
an
ge
s in
eq
uit
y i
nst
rum
en
ts
Oth
er
cha
ng
es
Share capital 32,324
32,324
32,324
70,440
Share premium reserve
173,987
173,987 173,987
Other reserves:
a) income-related 396,918
396,918 (84,365) (4,180) 308,373 (56,251)
b) other (108,915) (108,915) (108,915
)
Valuation reserves (5,512) (5,512) 167 (5,345) (5,644)
Equity instruments 36,000
36,000 36,000
Treasury shares (46,337) (46,337)
22,624 (23,713)
Profit (loss) for the year/period 122,146
122,146 (122,146) 171,025 171,025 7,143
Group shareholders’ equity
600,611
-
600,611 (206,511
) 18,444
171,192 583,736 Shareholders’ equity attributable to minority interests
23,846
23,846
(15,301) 7,143
15,688
Chief Executive Officer
On behalf of the Board of Directors
(Gabriele Roberto Blei)
39
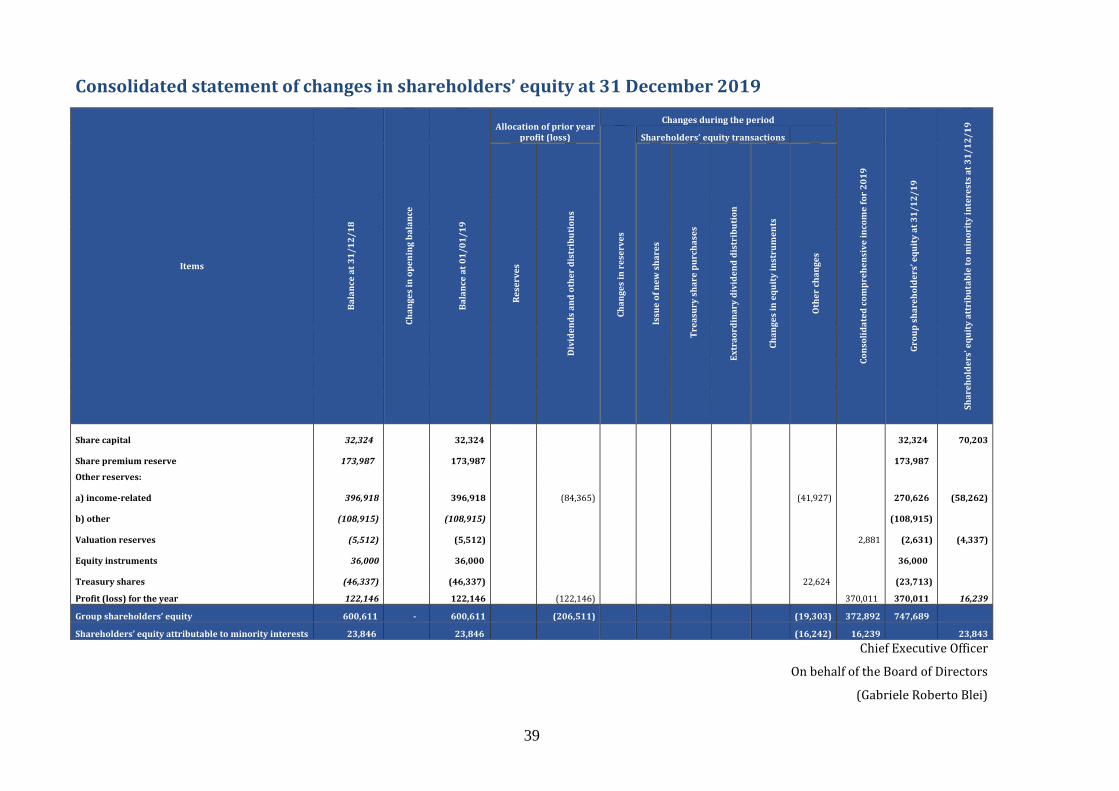
Consolidated statement of changes in shareholders’ equity at 31 December 2019
Items
Ba
lan
ce a
t 3
1/
12
/1
8
Ch
an
ge
s in
op
en
ing
ba
lan
ce
Ba
lan
ce a
t 0
1/
01
/1
9
Allocation of prior year profit (loss)
Changes during the period
Co
nso
lid
ate
d c
om
pre
he
nsi
ve
in
com
e f
or
20
19
Gro
up
sh
are
ho
lde
rs’ e
qu
ity
at
31
/1
2/
19
Sh
are
ho
lde
rs’ e
qu
ity
att
rib
uta
ble
to
min
ori
ty i
nte
rest
s a
t 3
1/
12
/1
9
Ch
an
ge
s in
re
serv
es
Shareholders’ equity transactions
Re
serv
es
Div
ide
nd
s a
nd
oth
er
dis
trib
uti
on
s
Issu
e o
f n
ew
sh
are
s
Tre
asu
ry s
ha
re p
urc
ha
ses
Ex
tra
ord
ina
ry d
ivid
en
d d
istr
ibu
tio
n
Ch
an
ge
s in
eq
uit
y i
nst
rum
en
ts
Oth
er
cha
ng
es
Share capital 32,324 32,324 32,324 70,203
Share premium reserve 173,987 173,987 173,987
Other reserves:
a) income-related 396,918 396,918 (84,365) (41,927) 270,626 (58,262)
b) other (108,915) (108,915) (108,915)
Valuation reserves (5,512) (5,512) 2,881 (2,631) (4,337)
Equity instruments 36,000 36,000 36,000
Treasury shares (46,337) (46,337) 22,624 (23,713)
Profit (loss) for the year 122,146 122,146 (122,146) 370,011 370,011 16,239
Group shareholders’ equity 600,611 - 600,611 (206,511) (19,303) 372,892 747,689
Shareholders’ equity attributable to minority interests 23,846 23,846 (16,242) 16,239 23,843
Chief Executive Officer
On behalf of the Board of Directors
(Gabriele Roberto Blei)
40
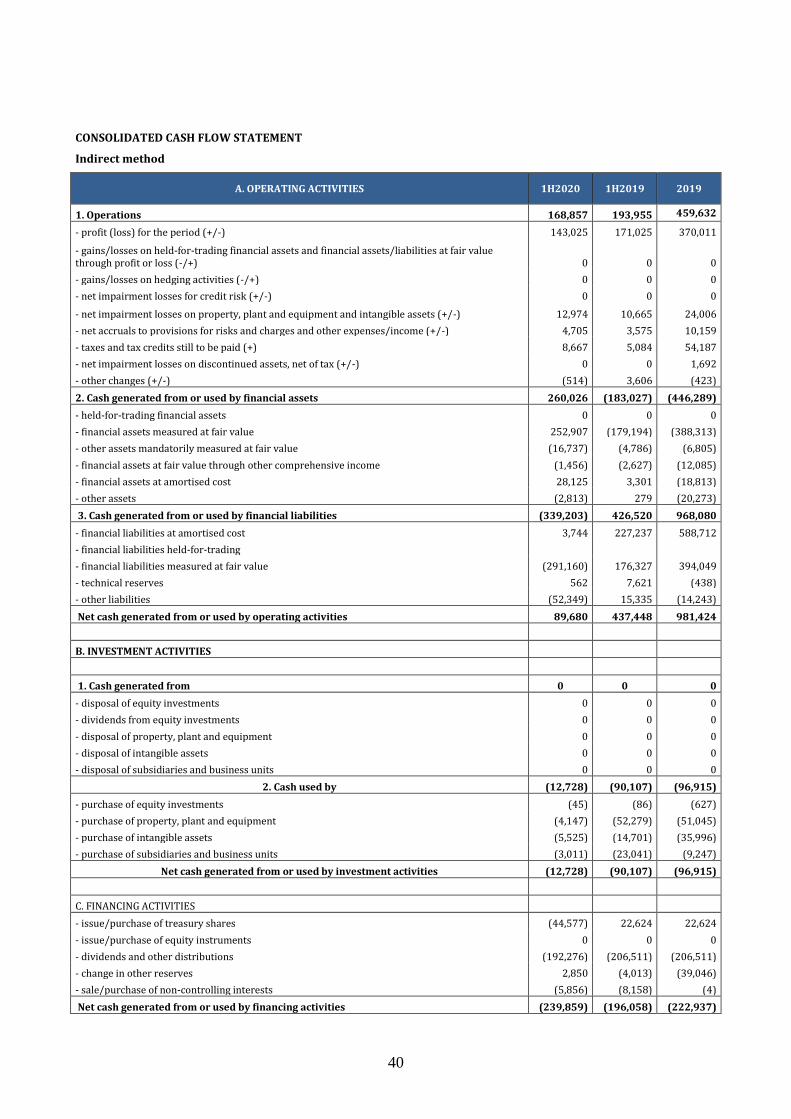
CONSOLIDATED CASH FLOW STATEMENT
Indirect method
A. OPERATING ACTIVITIES 1H2020 1H2019 2019
1. Operations 168,857 193,955 459,632
- profit (loss) for the period (+/-) 143,025 171,025 370,011
- gains/losses on held-for-trading financial assets and financial assets/liabilities at fair value through profit or loss (-/+) 0 0 0
- gains/losses on hedging activities (-/+) 0 0 0
- net impairment losses for credit risk (+/-) 0 0 0
- net impairment losses on property, plant and equipment and intangible assets (+/-) 12,974 10,665 24,006
- net accruals to provisions for risks and charges and other expenses/income (+/-) 4,705 3,575 10,159
- taxes and tax credits still to be paid (+) 8,667 5,084 54,187
- net impairment losses on discontinued assets, net of tax (+/-) 0 0 1,692
- other changes (+/-) (514) 3,606 (423)
2. Cash generated from or used by financial assets 260,026 (183,027) (446,289)
- held-for-trading financial assets 0 0 0
- financial assets measured at fair value 252,907 (179,194) (388,313)
- other assets mandatorily measured at fair value (16,737) (4,786) (6,805)
- financial assets at fair value through other comprehensive income (1,456) (2,627) (12,085)
- financial assets at amortised cost 28,125 3,301 (18,813)
- other assets (2,813) 279 (20,273)
3. Cash generated from or used by financial liabilities (339,203) 426,520 968,080
- financial liabilities at amortised cost 3,744 227,237 588,712
- financial liabilities held-for-trading
- financial liabilities measured at fair value (291,160) 176,327 394,049
- technical reserves 562 7,621 (438)
- other liabilities (52,349) 15,335 (14,243)
Net cash generated from or used by operating activities 89,680 437,448 981,424
B. INVESTMENT ACTIVITIES
1. Cash generated from 0 0 0
- disposal of equity investments 0 0 0
- dividends from equity investments 0 0 0
- disposal of property, plant and equipment 0 0 0
- disposal of intangible assets 0 0 0
- disposal of subsidiaries and business units 0 0 0
2. Cash used by (12,728) (90,107) (96,915)
- purchase of equity investments (45) (86) (627)
- purchase of property, plant and equipment (4,147) (52,279) (51,045)
- purchase of intangible assets (5,525) (14,701) (35,996)
- purchase of subsidiaries and business units (3,011) (23,041) (9,247)
Net cash generated from or used by investment activities (12,728) (90,107) (96,915)
C. FINANCING ACTIVITIES
- issue/purchase of treasury shares (44,577) 22,624 22,624
- issue/purchase of equity instruments 0 0 0
- dividends and other distributions (192,276) (206,511) (206,511)
- change in other reserves 2,850 (4,013) (39,046)
- sale/purchase of non-controlling interests (5,856) (8,158) (4)
Net cash generated from or used by financing activities (239,859) (196,058) (222,937)
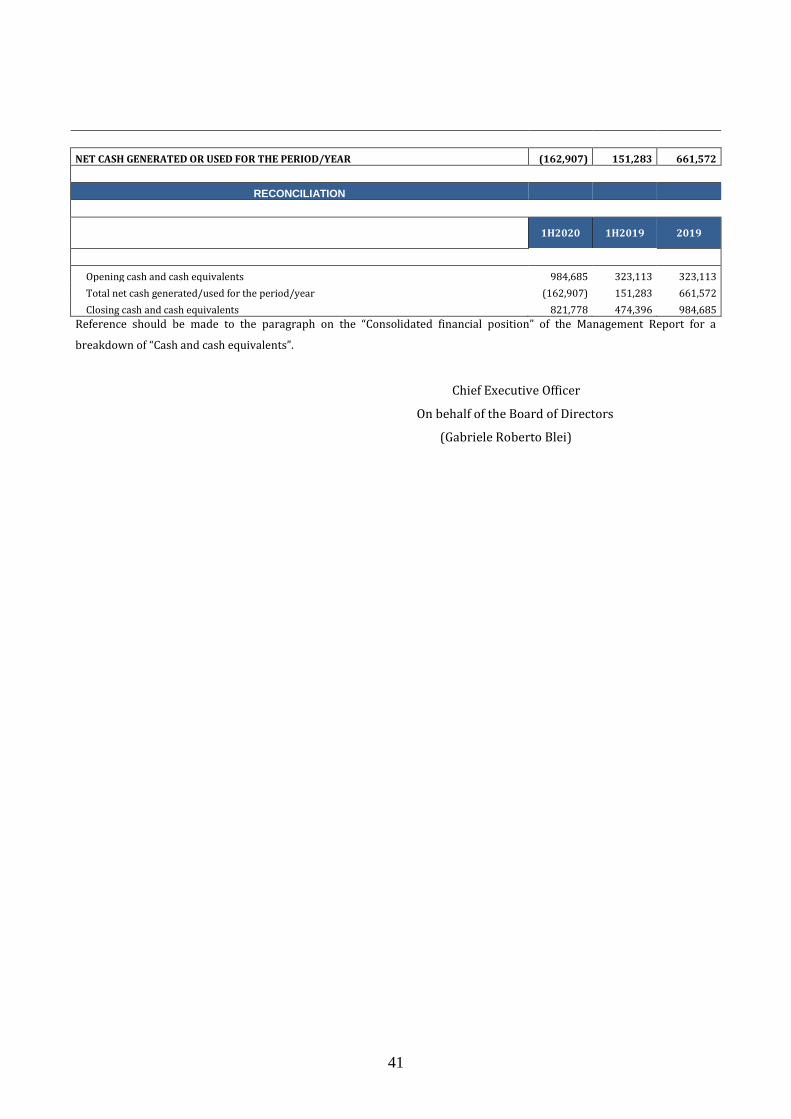
41
NET CASH GENERATED OR USED FOR THE PERIOD/YEAR (162,907) 151,283 661,572
RECONCILIATION
1H2020 1H2019 2019
Opening cash and cash equivalents 984,685 323,113 323,113
Total net cash generated/used for the period/year (162,907) 151,283 661,572
Closing cash and cash equivalents 821,778 474,396 984,685
Reference should be made to the paragraph on the “Consolidated financial position” of the Management Report for a
breakdown of “Cash and cash equivalents”.
Chief Executive Officer
On behalf of the Board of Directors
(Gabriele Roberto Blei)
42
NOTES TO THE CONSOLIDATED FINANCIAL STATEMENTS
Reporting criteria for condensed consolidated interim financial statements and
accounting standards
The condensed consolidated interim financial statements at 30 June 2020 comply with the
International Accounting Standards (IAS) / International Financial Reporting Standards
(IFRS) issued by the International Accounting Standards Board (IASB) and the related
interpretations of the IFRS Interpretations Committee, endorsed by the European
Commission and in force on 30 June 2020, implementing Italian Legislative Decree No.
38/2005 and Regulation (EC) No. 1606/2002, specifically IAS 34 - Interim Financial
Reporting.
The condensed consolidated interim financial statements have been drawn up voluntarily in
accordance with the instructions issued by the Bank of Italy about the financial statements of
asset management companies, within the Measure “IFRS financial statements of intermediaries
other than banking intermediaries" of 30 November 2018.These instructions lay down the
mandatory financial statement schedules and how they must be filled in, and the content of
the notes thereto for asset management companies that were adequately adjusted to better
represent the Group's financial position and results of operations, which includes the Irish
insurance company Az Life Dac. In particular, the balance sheet and income statement include
the items which are typical of the insurance business, taking as a reference IVASS Regulation
No. 7 dated 13 July 2007 concerning the provisions governing the consolidated financial
statements of insurance companies drawn up on the basis of IAS/IFRS.
The condensed consolidated interim financial statements have also been drawn up based on
the interpretative documents on the application of IAS/IFRS in Italy prepared by the Italian
Accounting Standard Setter (OIC), and the ESMA (European Securities and Markets Authority)
and Consob (the Italian Commission for Listed Companies and the Stock Exchange)
documents which refer to specific IAS/IFRS.
These consolidated interim financial statements have been prepared in a condensed format;
consequently, they should be read together with the annual financial statements at 31
December 2019. They have been prepared using the same accounting policies and methods
applied to draw up the consolidated financial statements at 31 December 2019.

43
It is comprised of the balance sheet, the income statement, the statement of comprehensive
income, the cash flow statement (prepared using the indirect method), the statement of
changes in shareholders’ equity and these notes.
In accordance with the provisions of article 5.2 of Legislative decree no. 38 of 28 February
2005 "Exercise of the options permitted by article 5 of (EC) regulation no. 1606/2002 on the
application of international accounting standards", the condensed consolidated interim financial
statements have been drawn up using the euro as the reporting currency. Unless otherwise
specified, the amounts shown in the financial statements and the notes thereto are in
thousands of euros.
These condensed consolidated interim financial statements have been prepared based on the
going concern assumption.
Financial, operating and other indicators2 have been considered which, as also shown in the
joint document issued on 6 February 2009 by the supervisory authorities Bank of Italy,
Consob and ISVAP (now IVASS), may highlight problems that, if not taken into proper
consideration, could compromise the Group’s stability and ability to operate as a going
concern.
Although the economic outlook for the future is still uncertain, also in light of the impact of the
spread of the COVID-19 epidemic described in the section "Significant events after the
reporting date" in the Management Report, the joint assessment of the past and current
financial position and results of operations of the Group, its operating guidelines, business
model and the risks to which business activity is exposed3, leads us to believe that there is no
doubt that the Group can continue to operate on a going concern basis for the foreseeable
future.
The condensed consolidated interim financial statements have been prepared clearly and give
a true and fair view of the Group's financial position, results of operations for the period,
changes in shareholders' equity and cash flows.
Transactions and other corporate events have been recognised and presented in accordance
with the principle of substance over form. As stated above, the condensed consolidated
interim financial statements have also been prepared based on the going concern assumption,
on an accruals basis, based on the commonly-used criteria of historic cost, save for the 2 Examples of which are shown in audit standard No. 570 on “Going Concerns”. 3 As described in the Management Report to the financial statements at 31 December 2019 to which reference should be
made.

44
valuation of certain financial assets and liabilities, in the cases where the fair value criterion
must be applied.
Assets and liabilities, costs and income have not been offset against each other, unless
required or permitted by a standard or interpretation.

45
Accounting standards, amendments and interpretations in force from 1 January 2020.
Amendments IASB publication
date
Endorsement date Date of coming
into force
Amendments to IFRS 3: Definition of a business
22 October 2018 --- 1 January 2020
Amendments to IAS 1 and IAS 8: Definition of material
31 October 2018 29 November 2019 1 January 2020
Amendments to IFRS 9, IAS 39 and IFRS 17: Interest rate benchmark reform
16 January 2020 15 January 2020 1 January 2020
The adoption of the above amendments has had no impact on the consolidated companies'
financial position and results of operations.
Accounting standards, amendments and interpretations which will come into force.
Standards IASB publication
date
Endorsement date Date of coming
into force
IFRS 14 “Regulatory deferral accounts”
30 January 2014 n.a.* n.a.*
IFRS 17 “Insurance contracts” 18 May 2017 --- 1 January 2023 * The European Commission does not intend to start the endorsement process concerning IFRS 14 (interim standard) pending the publication of the final standard governing tariff-regulated activities.
The Group will adopt the above new standards based on the expected application date and
will assess the potential impact once they have been endorsed by the European Union.
46
Accounting policies The IAS/IFRS applied to prepare the Azimut Group's condensed consolidated interim financial
statements, governing the classification, recognition, measurement and derecognition criteria
of asset and liability items and the recognition of income and expense are those in force at the
drafting date of this report, as endorsed by the European Union.
For information on the classification, recognition, measurement and derecognition criteria of
the main items, reference should be made to that set out in Part A.2. of the Notes to the Azimut
Group's consolidated financial statements at 31 December 2019.
The Group changed the accounting estimate of the costs for the acquisition and fulfilment of a
contract (IFRS 15) as shown below.
Starting from 1 January 2020, the amortisation period of the costs incurred to obtain
contracts with customers has changed, moving to a time horizon which is more in line with
the service period to customers (10 years based on the average term of contractual relations
with customers).
The change in the amortisation period is based on the availability of reliable data and
statistical analysis on the average term of customer relationships, considering the historical
data from the Azimut Group's customer base. These changes resulted in the revision of the
amortisation period of recruitment incentives linked to the acquisition of new customers and
that of the incremental costs recognised to the sales structure in relation to the organic
growth of assets under management (linked to the net inflows generated), thus ensuring a
more effective correlation between the entire amount of fees paid to financial advisors and
the fee and commission income generated by services provided to customers.
The change had an impact on the recognition of ordinary sales incentives linked to net inflows
targets paid to the network of financial advisors for which, previously, the accounting
representation was based on an estimate of the useful life equal to the observation period
(generally 36 months) and the incentives linked to the acquisition of new customers which
were amortised over a period corresponding to the "stability pact" agreed with the advisor.
This change, which is a change in accounting estimates for the amortisation period of
incentives (IFRS 15, paragraph 100), has been applied prospectively in accordance with IAS 8.
At 30 June 2020, capitalised contract costs amount to 62.8 million euro (gross of the tax
effect).

47
Overall, the above prospective application, all other conditions being equal, will result in an
initial reduction of the commission expenses for incentives recognised in the income
statement, due to the recognition only of the amortisation charge of the year, which, however,
will increase year by year as a result of the cumulative amortisation charge of subsequent
incentive plans until it stabilises over the new identified time horizon. The above change had
an impact of approximately 7 million euro at 30 June 2020.
Furthermore, the Group has changed its accounting estimate of the costs incurred to develop
the IT platform used in sales activities from 1 January 2020. The related costs were capitalised
and recognised under intangible assets, "Software", and amortised over three years until 31
December 2019. Also as a result of the economic crisis caused by Covid-19, which limited the
need for renewal of IT platforms, the Group has revised its software update schedule,
extending the period of use of software from the original three years to the current total of
five years. The above change had an impact on the income statement of approximately 1
million euro at 30 June 2020.
Significant events after the reporting date
Azimut Alternative Capital Partners strikes its first deal in the US alternative market by
acquiring an equity interest in Kennedy Lewis
On 29 July 2020, the Azimut Group, via its US subsidiary Azimut Alternative Capital Partners,
LLC (“AACP”), entered into an agreement to acquire a minority equity interest in Kennedy
Lewis Investment Management LLC and certain affiliated entities (“Kennedy Lewis”), a
leading opportunistic private credit investment management firm headquartered in New York
City.
Kennedy Lewis pursues private credit investments, especially where a specific event may
unlock the investment value. The firm primarily focuses on mid-cap companies facing
disruption, whether it be cyclical, secular, or regulatory related. Kennedy Lewis is able to
deploy capital opportunistically across a range of sectors and debt securities in both North
America and Europe. Kennedy Lewis currently employs a team of 28 professionals, including
19 investment professionals.
48
The transaction entails AACP acquiring a ca. 20% equity interest as permanent capital in
various Kennedy Lewis entities. The transaction also includes a mechanism for price
adjustment. Azimut will consequently consolidate Kennedy Lewis’ AUM on a pro-rata basis
and receive pro-rata distributions from Kennedy Lewis. Approximately 90% of proceeds from
the transaction will be used to increase Kennedy Lewis’ investments in its own funds,
confirming the team’s strong commitment to align itself with its investors and drive the long-
term growth of the business. There will be no changes in the strategy, management,
investment process or day-to-day operations of Kennedy Lewis or any Kennedy Lewis
managed product as a result of AACP’s investment.
AACP's investment amounts to approximately 14 million US dollars.
On 1 July 2020, the advisory company Certe Wealth Protection was acquired via the
Australian subsidiary AZ Next Generation Advisory Pty Ltd for a total consideration of 7.3
million Australian dollars.
This condensed consolidated interim financial report was authorised for publication by
Azimut Holding S.p.A’s Board of Directors on 30 July 2020.

49
Other aspects
Risks and uncertainties related to estimates
The drafting of the condensed consolidated interim financial statements also entails the use of
estimates and assumptions that may have a significant impact on the carrying amounts
recognised in the balance sheet and the income statement, and on the disclosure about
contingent assets and liabilities. The computation of such estimates is based on the use of
available information and the adoption of subjective assessments, also based on historical
experience, used to develop reasonable assumptions underlying the recognition of operations.
These estimates and assumptions, based on the best possible calculations by management, are
revised periodically and the effects of any changes are reflected directly in the income
statement.
Estimates with a significant impact on these condensed consolidated interim financial
statements relate to the impairment test on intangible assets (trademark, goodwill and
goodwill on consolidation), the recoverability of deferred tax assets, accruals to hedge
contingent liabilities for litigation, charges for supplementary indemnity for customers to be
paid to financial advisors, tax assessments underway and the financial liabilities recognised in
respect of the contractual commitments for the purchase of the residual equity investments in
some subsidiaries and/or contractual clauses which provide for put and call options on the
Parent Company’s shares assigned to transferors.
The Covid-19 pandemic has unleashed particularly severe health and economic effects
worldwide. In particular, the expansion of the epidemic and the consequent containment
measures implemented by the governments of the various countries have led to a significant
slowdown in global economic activity, resulting in recession in the most developed countries
and triggering high volatility in financial markets. The overall impact of the pandemic on the
Group's operating activities, its personnel, the financial position and financial performance of
the period and the measures taken to mitigate the effects of the crisis, have been discussed in
a specific section of the Management Report.
As required by the market and sector regulators, the Azimut Group has also assessed the
fairness of the carrying amount of goodwill and other intangible assets with an indefinite
useful life recognised at consolidated level. For a more detailed analysis of the assessments
made, reference should be made to the notes to "Intangible Assets".
There is no other relevant information to be disclosed for reporting purposes.
50
Consolidation scope and methods The condensed consolidated interim financial statements include the balance sheet and
income statement figures of Azimut Holding S.p.A. and the companies directly or indirectly
controlled by the latter.
Subsidiaries
The Azimut Group consolidation scope has been established in accordance with IFRS 10.
Specifically, subsidiaries are those companies in respect of which the Azimut Group is
exposed, or has rights, to variable returns from its involvement with the investees and has the
ability to affect those returns through its power over the investees. Control exists only when
the following elements simultaneously exist: (i) the power to direct the relevant activities; (ii)
exposure, or rights, to variable returns from involvement with the investee; (iii) the ability to
use its power over the investee to affect the amount of its returns.
Subsidiaries are consolidated on a line-by-line basis as of the acquisition date, i.e., the date on
which the Group acquires control in accordance with IFRS 10. They are deconsolidated when
the Group no longer controls them.
Associates
Associates are those companies subject to significant influence, i.e. companies in which the
Azimut Group, either directly or indirectly, holds at least 20% of the voting rights (including
“potential” voting rights) or in which – despite holding a smaller percentage of voting rights –
has the power to participate in the financial and operating policy decisions, such as the
participation in shareholders' agreements, due to specific legal relationships. These
companies are consolidated using the equity method whereby on initial recognition the
investment is recognised at cost, and the carrying amount is increased or decreased based on
the investee’s share of equity, using the most recently approved financial statements of the
companies. The difference between the carrying amount of the equity investment and the
investee's share of equity is included in the carrying amount of the investee.
Compared to 31 December 2019, the consolidation scope changed as follows:
51
- the Australian-based JPH Group Holdings Pty Ltd, Mint Business Brokers Pty Ltd, JPH Capital
Pty Ltd, JPH Mortgage Origination Pty Ltd and JPH Lawyers Pty Ltd joined the consolidation
scope. Following their acquisition by AZ NGA, goodwill of 3 million euro was recognised.
- the following companies were set up (not yet operative at the preparation date of this
report):
• Az Global Wealth Management Australia Pty Ltd based in Australia and 56.52% owed
by AZ NGA;
• Azimut Private Capital Management Sarl based in Luxembourg and wholly owned by
AZ International Holdings Sa;
• Azimut Capital Tech S.r.l. based in Italy and 75% owned by Azimut Enterprises S.r.l.;
• Insuretech Deal S.r.l. based in Italy and wholly owned by Azimut Enterprises S.r.l.;
- Pride SMSF PTY Ltd, Priority Lifestyle Advice Pty Ltd and Spencer Fuller Lending Solutions
Pty Ltd, all based in Australia, left the consolidation scope as they ceased operations.
The agreements governing the acquisition of the Australian companies provided for the
exchange of the shares of each acquired company with AZ NGA shares and the progressive
repurchase of these shares over the next ten years. The residual 51% was paid in cash to the
founding members. For information about the acquisitions of the past twelve months, with
reference to the difference between the fair value of the assets acquired and the liabilities
assumed and the consideration paid to acquire the investments and the amount attributed to
"Customer Relationships", reference should made to the note to Intangible Assets.
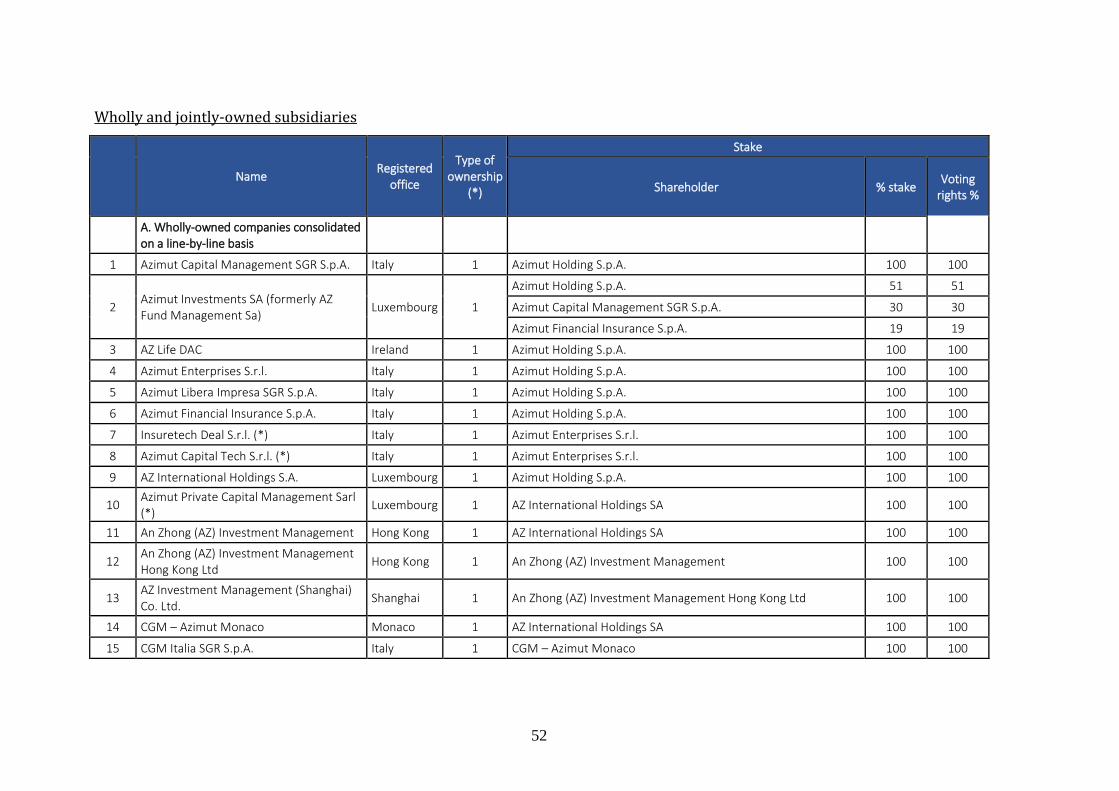
52
Wholly and jointly-owned subsidiaries
Name Registered
office
Type of ownership
(*)
Stake
Shareholder % stake Voting
rights %
A. Wholly-owned companies consolidated on a line-by-line basis
1 Azimut Capital Management SGR S.p.A. Italy 1 Azimut Holding S.p.A. 100 100
2 Azimut Investments SA (formerly AZ Fund Management Sa)
Luxembourg 1
Azimut Holding S.p.A. 51 51
Azimut Capital Management SGR S.p.A. 30 30
Azimut Financial Insurance S.p.A. 19 19
3 AZ Life DAC Ireland 1 Azimut Holding S.p.A. 100 100
4 Azimut Enterprises S.r.l. Italy 1 Azimut Holding S.p.A. 100 100
5 Azimut Libera Impresa SGR S.p.A. Italy 1 Azimut Holding S.p.A. 100 100
6 Azimut Financial Insurance S.p.A. Italy 1 Azimut Holding S.p.A. 100 100
7 Insuretech Deal S.r.l. (*) Italy 1 Azimut Enterprises S.r.l. 100 100
8 Azimut Capital Tech S.r.l. (*) Italy 1 Azimut Enterprises S.r.l. 100 100
9 AZ International Holdings S.A. Luxembourg 1 Azimut Holding S.p.A. 100 100
10 Azimut Private Capital Management Sarl (*)
Luxembourg 1 AZ International Holdings SA 100 100
11 An Zhong (AZ) Investment Management Hong Kong 1 AZ International Holdings SA 100 100
12 An Zhong (AZ) Investment Management Hong Kong Ltd
Hong Kong 1 An Zhong (AZ) Investment Management 100 100
13 AZ Investment Management (Shanghai) Co. Ltd.
Shanghai 1 An Zhong (AZ) Investment Management Hong Kong Ltd 100 100
14 CGM – Azimut Monaco Monaco 1 AZ International Holdings SA 100 100
15 CGM Italia SGR S.p.A. Italy 1 CGM – Azimut Monaco 100 100

53
Name Registered
office
Type of ownership
(*)
Stake
Shareholder % stake Voting
rights %
A. Wholly-owned companies consolidated on a line-by-line basis
16 AZ Swiss & Partners SA Switzerland 1 AZ International Holdings SA 51 51
17 SDB Financial Solutions SA Switzerland 1 AZ Swiss & Partners SA 51 51
18 Katarsis Capital Advisors SA Switzerland 1 AZ International Holdings SA 100 100
19 Eskatos Capital Management Sarl Luxembourg 1 Katarsis Capital Advisors SA 100 100
20 AZ Sinopro Financial Planning Ltd Taiwan 1 AZ International Holdings SA 51 51
21 AZ Sinopro Investment Planning Ltd Taiwan 1 AZ Sinopro Financial Planning Ltd 51 51
22 AZ Sinopro Insurance Planning Ltd Taiwan 1 AZ Sinopro Investment Planning Ltd 51 51
23 AZ Investment Management Singapore Ltd
Singapore 1 AZ International Holdings SA 100 100
24 AZ Brasil Holdings Ltda Brazil 1 AZ International Holdings SA 99.9 99.9
25 AZ Quest Participações SA Brazil 1 AZ Brasil Holdings Ltda 80.95 80.95
26 AZ Quest Investimentos Ltda Brazil 1 AZ Quest Participações SA 80.95 80.95
27 Azimut Brasil Wealth Management Holding S.A.
Brazil 1 AZ Brasil Holdings Ltda 89.43 89.43
28 M&O Consultoria, Planejamento e Análise de Valores Mobiliários Ltda
Brazil 1 Azimut Brasil Wealth Management Holding S.A. 89.43 89.43
29 Futurainvest Investimentos e Participações Ltda
Brazil 1 Azimut Brasil Wealth Management Holding S.A. 89.43 89.43
30 Azimut Brasil Wealth Management Ltda Brazil 1 Azimut Brasil Wealth Management Holding S.A. 80.95 80.95
31 Futurainvest Holding SA Brazil 1 AZ Brasil Holdings Ltda 99.9 99.9
32 Azimut Brasil DTVM Ltda Brazil 1 Futurainvest Holding SA 99.9 99.9
33 Azimut Portföy Yönetimi A.Ş. Turkey 1 AZ International Holdings SA 100 100
34 Azimut (DIFC) Limited United Arab Emirates
1 AZ International Holdings SA 100 100
35 Azimut (ME) Limited United Arab Emirates
1 AZ International Holdings SA 100 100

54
Name Registered
office
Type of ownership
(*)
Stake
Shareholder % stake Voting
rights %
A. Wholly-owned companies consolidated on a line-by-line basis
36 Azimut Egypt Asset Management Egypt 1 AZ International Holdings SA 100 100
37 AZ US Holding Inc. United States
1 AZ International Holdings SA 100 100
38 AZ Apice Capital Management LLC United States
1 AZ US Holding Inc. 83.13 83.13
39 Azimut Alternative Capital Partners LLC United States
1 AZ US Holding Inc. 96.5 96.5
40 AZ Andes SA Chile 1 AZ International Holdings SA 100 100
41 AZ Mexico Holdings S.A. de CV Mexico 1 AZ International Holdings SA 100 100
42 Mas Fondos S.A. Mexico 1 AZ Mexico Holdings S.A. de CV 100 100
43 AZ Next Generation Advisory PTY Ltd Australia 1 AZ International Holdings SA 56.52 56.52
44 Eureka Whittaker Macnaught PTY Ltd Australia 1 AZ Next Generation Advisory PTY Ltd 56.52 56.52
45 Pride Advice PTY Ltd Australia 1 AZ Next Generation Advisory PTY Ltd 56.52 56.52
46 Lifestyle Financial Planning Services (LFPS) PTY Ltd
Australia 1 AZ Next Generation Advisory PTY Ltd 56.52 56.52
47 Eureka Financial Group PTY Ltd Australia 1 AZ Next Generation Advisory PTY Ltd 56.52 56.52
48 Pride Financial PTY Ltd Australia 1 AZ Next Generation Advisory PTY Ltd 56.52 56.52
49 Wise Planners PTY Ltd Australia 1 AZ Next Generation Advisory PTY Ltd 56.52 56.52
50 Domane Financial Advisers PTY LTD Australia 1 Wise Planners PTY Ltd 56.52 56.52
51 Financial Lifestyle Partners PTY Ltd Australia 1 AZ Next Generation Advisory PTY Ltd 56.52 56.52
52 Harvest Wealth PTY Ltd Australia 1 AZ Next Generation Advisory PTY Ltd 56.52 56.52
53 RI Toowoomba PTY Ltd Australia 1 AZ Next Generation Advisory PTY Ltd 56.52 56.52
54 Empowered Financial Partners PTY Ltd Australia 1 AZ Next Generation Advisory PTY Ltd 56.52 56.52
55 Wealthwise PTY Ltd Australia 1 AZ Next Generation Advisory PTY Ltd 56.52 56.52
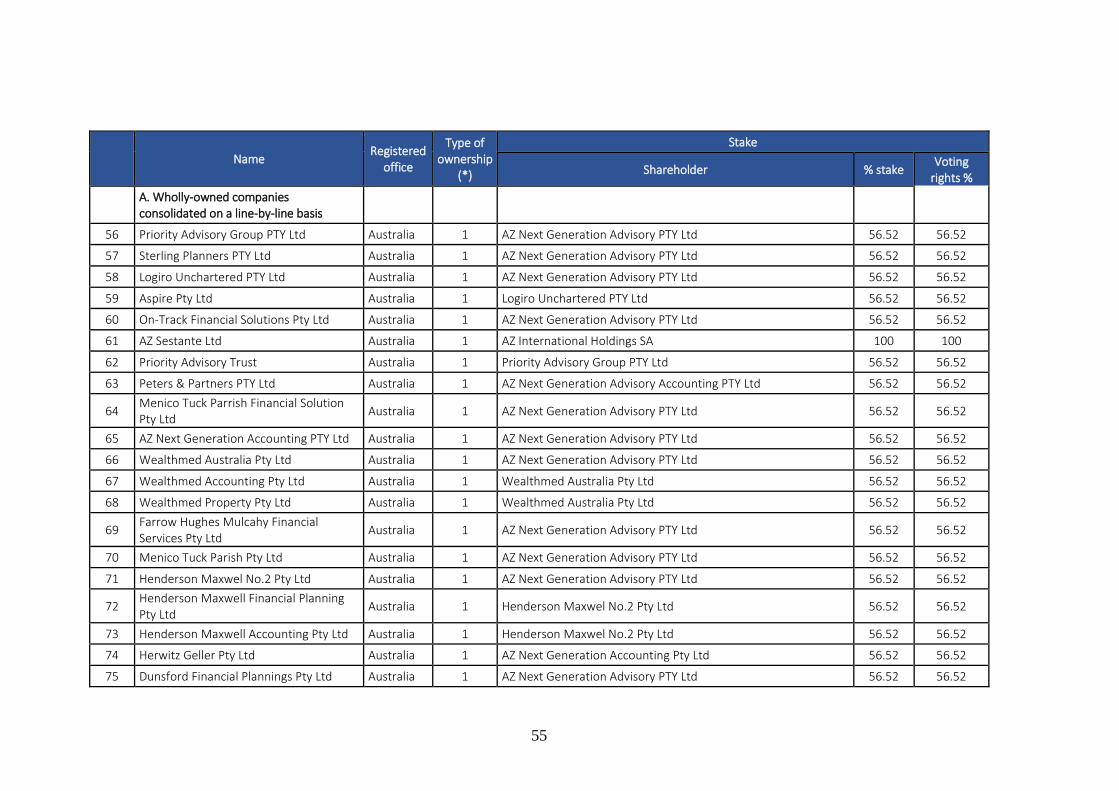
55
Name Registered
office
Type of ownership
(*)
Stake
Shareholder % stake Voting
rights %
A. Wholly-owned companies consolidated on a line-by-line basis
56 Priority Advisory Group PTY Ltd Australia 1 AZ Next Generation Advisory PTY Ltd 56.52 56.52
57 Sterling Planners PTY Ltd Australia 1 AZ Next Generation Advisory PTY Ltd 56.52 56.52
58 Logiro Unchartered PTY Ltd Australia 1 AZ Next Generation Advisory PTY Ltd 56.52 56.52
59 Aspire Pty Ltd Australia 1 Logiro Unchartered PTY Ltd 56.52 56.52
60 On-Track Financial Solutions Pty Ltd Australia 1 AZ Next Generation Advisory PTY Ltd 56.52 56.52
61 AZ Sestante Ltd Australia 1 AZ International Holdings SA 100 100
62 Priority Advisory Trust Australia 1 Priority Advisory Group PTY Ltd 56.52 56.52
63 Peters & Partners PTY Ltd Australia 1 AZ Next Generation Advisory Accounting PTY Ltd 56.52 56.52
64 Menico Tuck Parrish Financial Solution Pty Ltd
Australia 1 AZ Next Generation Advisory PTY Ltd 56.52 56.52
65 AZ Next Generation Accounting PTY Ltd Australia 1 AZ Next Generation Advisory PTY Ltd 56.52 56.52
66 Wealthmed Australia Pty Ltd Australia 1 AZ Next Generation Advisory PTY Ltd 56.52 56.52
67 Wealthmed Accounting Pty Ltd Australia 1 Wealthmed Australia Pty Ltd 56.52 56.52
68 Wealthmed Property Pty Ltd Australia 1 Wealthmed Australia Pty Ltd 56.52 56.52
69 Farrow Hughes Mulcahy Financial Services Pty Ltd
Australia 1 AZ Next Generation Advisory PTY Ltd 56.52 56.52
70 Menico Tuck Parish Pty Ltd Australia 1 AZ Next Generation Advisory PTY Ltd 56.52 56.52
71 Henderson Maxwel No.2 Pty Ltd Australia 1 AZ Next Generation Advisory PTY Ltd 56.52 56.52
72 Henderson Maxwell Financial Planning Pty Ltd
Australia 1 Henderson Maxwel No.2 Pty Ltd 56.52 56.52
73 Henderson Maxwell Accounting Pty Ltd Australia 1 Henderson Maxwel No.2 Pty Ltd 56.52 56.52
74 Herwitz Geller Pty Ltd Australia 1 AZ Next Generation Accounting Pty Ltd 56.52 56.52
75 Dunsford Financial Plannings Pty Ltd Australia 1 AZ Next Generation Advisory PTY Ltd 56.52 56.52
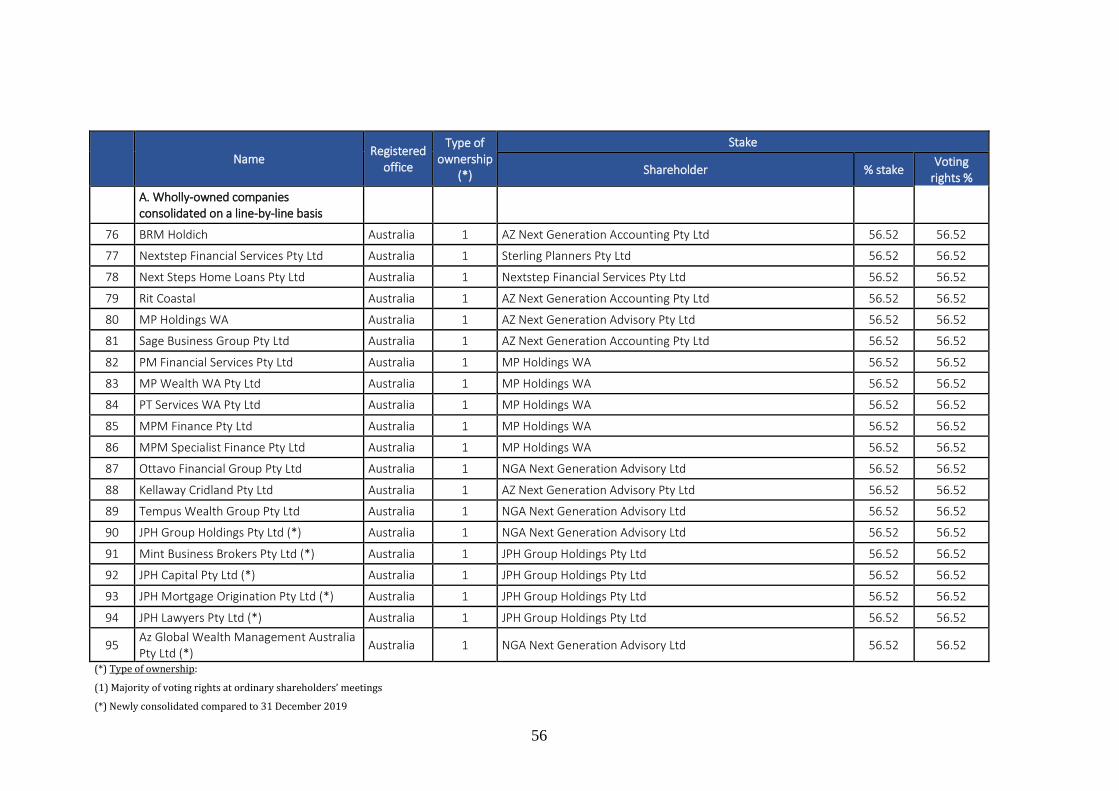
56
Name Registered
office
Type of ownership
(*)
Stake
Shareholder % stake Voting
rights %
A. Wholly-owned companies consolidated on a line-by-line basis
76 BRM Holdich Australia 1 AZ Next Generation Accounting Pty Ltd 56.52 56.52
77 Nextstep Financial Services Pty Ltd Australia 1 Sterling Planners Pty Ltd 56.52 56.52
78 Next Steps Home Loans Pty Ltd Australia 1 Nextstep Financial Services Pty Ltd 56.52 56.52
79 Rit Coastal Australia 1 AZ Next Generation Accounting Pty Ltd 56.52 56.52
80 MP Holdings WA Australia 1 AZ Next Generation Advisory Pty Ltd 56.52 56.52
81 Sage Business Group Pty Ltd Australia 1 AZ Next Generation Accounting Pty Ltd 56.52 56.52
82 PM Financial Services Pty Ltd Australia 1 MP Holdings WA 56.52 56.52
83 MP Wealth WA Pty Ltd Australia 1 MP Holdings WA 56.52 56.52
84 PT Services WA Pty Ltd Australia 1 MP Holdings WA 56.52 56.52
85 MPM Finance Pty Ltd Australia 1 MP Holdings WA 56.52 56.52
86 MPM Specialist Finance Pty Ltd Australia 1 MP Holdings WA 56.52 56.52
87 Ottavo Financial Group Pty Ltd Australia 1 NGA Next Generation Advisory Ltd 56.52 56.52
88 Kellaway Cridland Pty Ltd Australia 1 AZ Next Generation Advisory Pty Ltd 56.52 56.52
89 Tempus Wealth Group Pty Ltd Australia 1 NGA Next Generation Advisory Ltd 56.52 56.52
90 JPH Group Holdings Pty Ltd (*) Australia 1 NGA Next Generation Advisory Ltd 56.52 56.52
91 Mint Business Brokers Pty Ltd (*) Australia 1 JPH Group Holdings Pty Ltd 56.52 56.52
92 JPH Capital Pty Ltd (*) Australia 1 JPH Group Holdings Pty Ltd 56.52 56.52
93 JPH Mortgage Origination Pty Ltd (*) Australia 1 JPH Group Holdings Pty Ltd 56.52 56.52
94 JPH Lawyers Pty Ltd (*) Australia 1 JPH Group Holdings Pty Ltd 56.52 56.52
95 Az Global Wealth Management Australia Pty Ltd (*)
Australia 1 NGA Next Generation Advisory Ltd 56.52 56.52
(*) Type of ownership:
(1) Majority of voting rights at ordinary shareholders’ meetings
(*) Newly consolidated compared to 31 December 2019
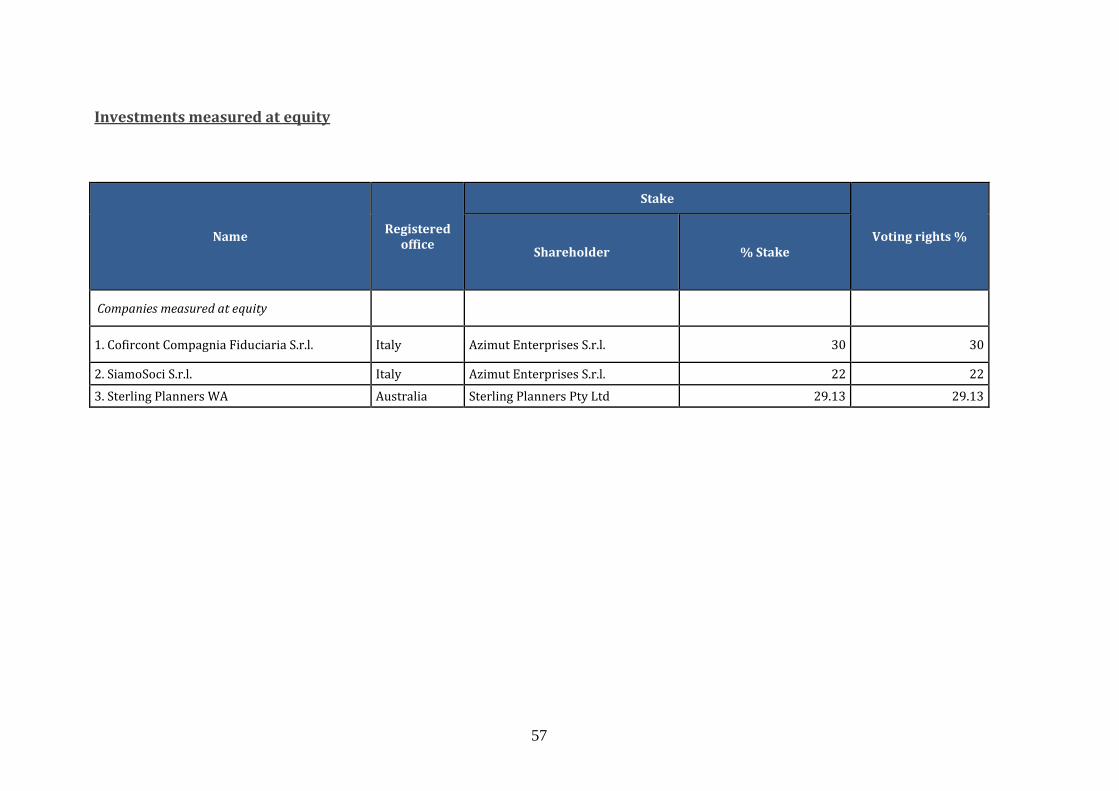
57
Investments measured at equity
Name Registered
office
Stake
Voting rights % Shareholder % Stake
Companies measured at equity
1. Cofircont Compagnia Fiduciaria S.r.l. Italy Azimut Enterprises S.r.l. 30 30
2. SiamoSoci S.r.l. Italy Azimut Enterprises S.r.l. 22 22
3. Sterling Planners WA Australia Sterling Planners Pty Ltd 29.13 29.13
58
Significant assessments and assumptions used to determine the consolidation scope Unit linked
The line-by-line consolidation scope excludes the Unit-Linked Funds (insurance internal
funds) ("Unit linked") in which the Azimut Group does not hold any equity investment
and to which the IFRS 10 definition of control does not apply. With respect to the mutual
funds underlying the Unit-Linked Funds, the Azimut Group considers that these
conditions do not apply. Indeed, it believes that:
- it does not hold the outstanding majority units;
- it does not have full power over the investment entity (funds), since it is limited by
funds' regulations governing asset allocation and management policies;
- it is not significantly exposed to the variable returns from the investment entity, since
the profits or losses from the measurement of Unit-Linked assets are entirely paid to
policyholders by adjusting the mathematical reserve.
The exposure to the changes in the value of the Group's funds is limited to the change in
terms of fee impact. Specifically, the Group is exposed to the risk of changes in entry fees
and charges on premiums, linked to the performance of inflows, the management fees
related to assets under management and the incentive fees linked to the performance of
the managed funds.
Wholly-owned Australian subsidiaries with significant non-controlling interests
Since 2015, the Azimut Group, through AZ NGA, the holding company incorporated in
November 2014, has begun a series of acquisitions in Australia. The relevant agreements
provide for the following: (i) the exchange of shares with AZ NGA shares and the
progressive repurchase of said shares in the next ten years, equal to 49% of each
company through a put/call option mechanism and (ii) a cash payment to founding
members over two years for the residual 51%.
Significant restrictions
There are no significant legal, contractual or regulatory restrictions within the Azimut
Group which may limit the Parent Company's ability to transfer cash and cash
59
equivalents or other assets to other Group companies, or guarantees which may limit the
distribution of dividends, capital or loans and advances granted or repaid to other Group
companies.
Other information
Basis of consolidation
Investments in subsidiaries are consolidated on a line-by-line basis, while interests in
jointly-controlled entities and associates are measured using the equity method.
Line-by-line method – Under this consolidation method, the companies' balance sheet
and income statements figures are consolidated line-by-line. The carrying amount of
equity investments is offset against the relevant equity of the subsidiary pertaining to the
group after allocating the relevant portions of equity and profit or loss to non-controlling
interests. Upon first consolidation, the positive differences are recognised under
Intangible assets, e.g., goodwill, after allocation to the subsidiary's asset or liability items,
where necessary. Conversely, negative differences are taken to profit or loss.
For the purposes of consolidation, the balance sheets and the income statements as at
and for the six months ended 30 June 2020 (interim financial statements) of consolidated
companies were used. They were prepared in accordance with the IFRS and Group
criteria to which they make reference. The interim financial statements used are those
prepared by the Boards of Directors of each company, duly reclassified and adjusted to
comply with the above standards and criteria. The data about individual interim financial
statements are obtained through the information included in the reporting packages
prepared in accordance with the Group's accounting policies.
The Parent Company interim financial statements and those of the subsidiaries have
been consolidated on a line-by-line basis, including all subsidiaries and assuming all
assets, liabilities, costs and income of each subsidiary, while eliminating the carrying
amount of the equity investments against the relevant share/quotaholders' equity, as set
out by the IFRS.
The assets, liabilities, costs and income generated by transactions among consolidated
companies have been eliminated in full, as have the profits and losses generated by
transactions among consolidated companies which do not involve third parties.

60
The positive differences between the equity investments consolidated on a line-by-line
basis and the related net fair value of the acquired assets and assumed liabilities, were
considered as goodwill on consolidation and tested for impairment to check the
adequacy of the amount recognised.
For consolidated companies that prepare their interim financial statements in a
functional currency different from that of the Parent Company, the amounts expressed in
currencies other than the euro were translated as follows: for the balance sheet, using the
closing rate (30 June 2019), and for the income statement, using the average exchange
rate for the period. The differences arising from the translation of opening shareholders’
equity using period-end exchange rates, along with those triggered by the use of period-
end and average exchange rates are classified under the specific item “Exchange rate
differences” in the valuation reserve.
Equity method—The investees over which the Group exerts significant influence or has
joint control, as defined by IAS 28, are measured using the equity method.
Under this method, the equity investment is initially recognised at cost and the carrying
amount is increased or decreased to reflect the parent's share of profit or loss of the
investee earned/incurred after the acquisition date. The share of the profit (loss) for the
year attributable to the parent is recognised in the latter's income statement. The
dividends received from an investee decrease the carrying amount of the equity
investment. Furthermore, the carrying amount may be adjusted also following the change
in the percentage of investment in the investee, due to changes in the latter's equity not
recognised in the income statement.
These changes include also those related to the differences arising from the translation of
foreign currency amounts into the financial statements' functional currency. The portion
related to these changes is recognised directly in equity. When the investee incurs losses
and these losses exceed the carrying amount of the investment, the latter's carrying
amount is zeroed and any further losses are recognised only when the parent has legal or
constructive obligations or has made payments on behalf of the investee. If the investee
subsequently earns a profit, the parent recognises the share of profit attributable to it
only when it has reached the same amount of the previously unrecognised loss.
The consolidation of associates and/or jointly controlled entities considers the financial
statements prepared by the Boards of Directors of each company.

61
Business combinations carried out in the first half of 2020
At the reporting date, the activities related to the implementation of IFRS 3 and the fair
value calculation of the assets and liabilities of the companies acquired in the first half of
2020 are still underway. In this respect, IFRS 3 allows the provisional allocation of
acquisition costs, provided that completion takes place within twelve months of the
acquisition date.
62
Disclosure about financial asset transfers between portfolios
Transfers between portfolios
The Group did not transfer any financial assets between portfolios during the period.
Fair value disclosure
Qualitative information
The fair value of other financial assets mandatorily measured at fair value is based on the
prices reported on the respective markets on the last day of trading in the reference
period. At the end of each year, impairment tests are carried out to establish which
financial assets are to be impaired. This test is performed for each individual financial
instrument, considering the impairment effects in accordance with IFRS 9. Financial
assets are derecognised when the contractual rights to the cash flows generated by the
assets expire or when the asset is sold and all the risks and rewards of ownership have
been transferred.
Quantitative information In accordance with the provisions of IFRS 7 and IFRS 13, the Group companies classify
fair value measurement of financial assets and financial liabilities based on a hierarchy
that conveys the nature of inputs used. The levels are as follows:
• Level 1: (unadjusted) quoted prices in active markets for assets and liabilities
identical to those subject to measurement;
• Level 2: inputs other than unadjusted quoted prices (as per level 1) that are
directly (as in the case of prices) or indirectly (deriving from prices) observable
market data;
• Level 3: inputs based on unobservable market data.
Specifically, the fair value of a financial instrument measured at level 1 corresponds to
the unadjusted price, at which the instrument – or an identical instrument – is sold on an
active market on the measurement date. For classification at level 1, prices are measured
together with all other characteristics of the financial asset or financial liability: if the
63
quoted price is adjusted in order to take account of specific conditions that require
adjustment, the financial instrument is classified under a level other than level 1.
Analyses for classification at other levels within the fair value hierarchy are performed
analytically for each individual financial asset or liability held/issued; these analyses and
measurement criteria are applied consistently over time.
With respect to the financial instruments held as part of liquidity management policies
and financial liabilities issued, according to the Group's main policies:
• government bonds and open-ended mutual funds, whose fair value is designated
as level 1 if represented by the Net Asset Value (NAV) provided by the fund
manager at the measurement date, are classified as level 1; conversely, with
respect to listed funds and Exchange Traded Funds (ETF), level 1 fair value is
equal to the closing price of the relevant stock market, and the liquidity to be
invested relating to unit-linked policies issued;
• level 2 reflects the investments related to the unit-linked policies issued (where
the investment risk is borne by policyholders), the associated financial liabilities
and the bonds issued;
• level 3 reflects the equity securities reported as “Financial assets at fair value
through other comprehensive income” measured at cost and financial liabilities
related to the commitments to purchase the residual equity investments in some
subsidiaries in accordance with ruling contractual agreements. With respect to
liabilities, the measurement reflects the estimated amount to be paid to the seller,
based on the estimate of the future parameters set out in the relevant contracts,
including AUM and profit for the year and which are subject to specific sensitivity
analyses. The change in the amount on first recognition is taken to the income
statement.

64
Fair value hierarchy
Assets and liabilities measured at fair value on a recurring basis: breakdown by fair value level
30/06/2020 31/12/2019 30/06/2019
Financial assets/liabilities measured at fair value
Level 1 Level 2 Level 3 Level 1 Level 2 Level 3 Level 1 Level 2 Level 3
1. Financial assets at fair value through profit or loss
a) held-for-trading financial assets
b) financial assets designated at fair value
c) financial assets mandatorily measured at fair value 558,514 5,817,844 621,204 6,070,751 249,369 5,861,632
2. Financial assets at fair value through other comprehensive income
1,568 16,358 2,476 14,902 2,660 5,444
3. Hedging derivatives
4. Property, plant and equipment
5. Intangible assets
Total 560,082 5,817,844 16,358 623,680 6,070,751 14,902 252,029 5,861,632 5,444
1. Held-for-trading financial liabilities
2. Financial liabilities designated at fair value 5,641,651 43,248 5,901,538 74,521 5,688,316 70,021
3. Hedging derivatives
Total 0 5,641,651 43,248 0 5,901,538 74.5214 5,688,316 70,021

65
Annual changes in financial assets measured at Level 3 fair value on a recurring basis
FINANCIAL ASSETS
Tota
l
of which:
a) held-for-
trading financi
al assets
of which: b)
financial assets
designated at fair
value
of which: c) other financial
assets mandatori
ly measured
at fair value
Financial assets at fair value
through other comprehensive
income
Hedging derivativ
es
Property, plant and equipme
nt
Intangible assets
1. Opening balance 14,902
2. Increases
1,465
2.1. Purchases
1,465
2.2. Profits allocated to:
2.2.1 Profit or loss
of which: gains
2.2.2 Shareholders’ equity
2.3. Transfers from other levels
2.4. Other increases
3. Decreases -9
3.1. Sales
3.2. Redemptions
3.3. Losses charged to:
3.3.1 Profit or loss
of which: losses
3.3.2 Shareholders’ equity
-9
3.4. Transfers from other levels
3.5. Other decreases
4. Closing balance 16,358
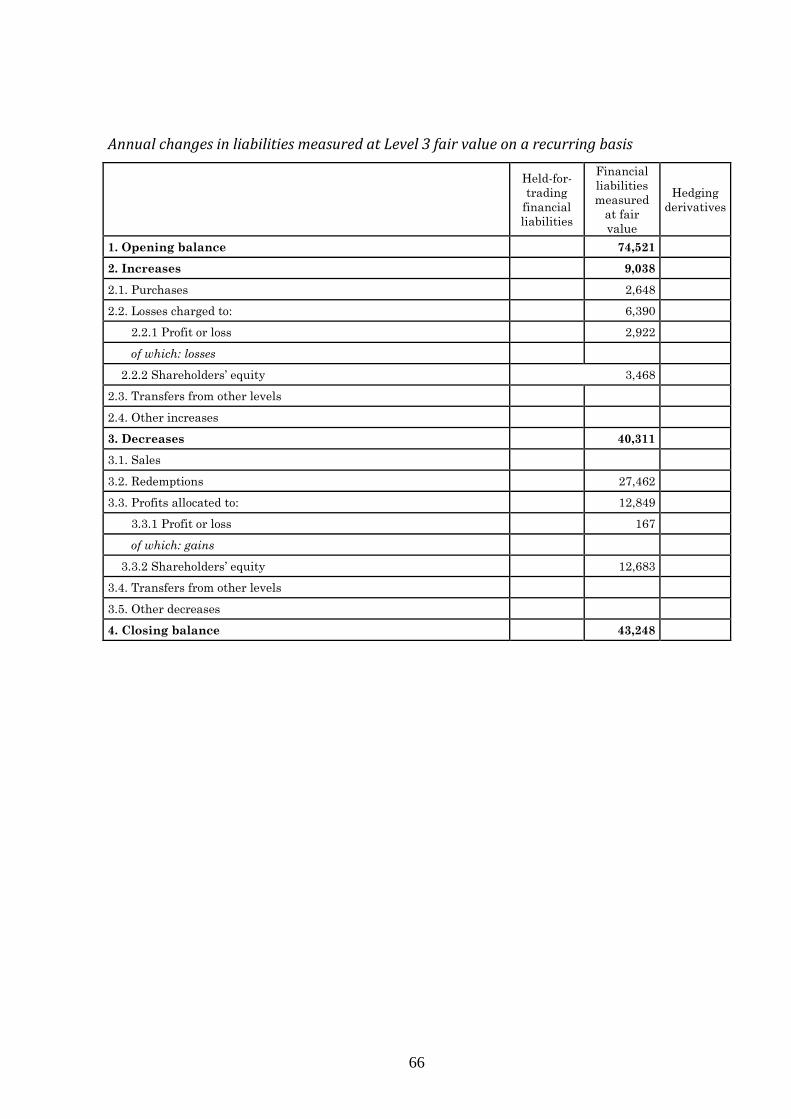
66
Annual changes in liabilities measured at Level 3 fair value on a recurring basis
Held-for-
trading
financial
liabilities
Financial
liabilities
measured
at fair
value
Hedging
derivatives
1. Opening balance 74,521
2. Increases 9,038
2.1. Purchases 2,648
2.2. Losses charged to: 6,390
2.2.1 Profit or loss 2,922
of which: losses
2.2.2 Shareholders’ equity 3,468
2.3. Transfers from other levels
2.4. Other increases
3. Decreases 40,311
3.1. Sales
3.2. Redemptions 27,462
3.3. Profits allocated to: 12,849
3.3.1 Profit or loss 167
of which: gains
3.3.2 Shareholders’ equity 12,683
3.4. Transfers from other levels
3.5. Other decreases
4. Closing balance 43,248
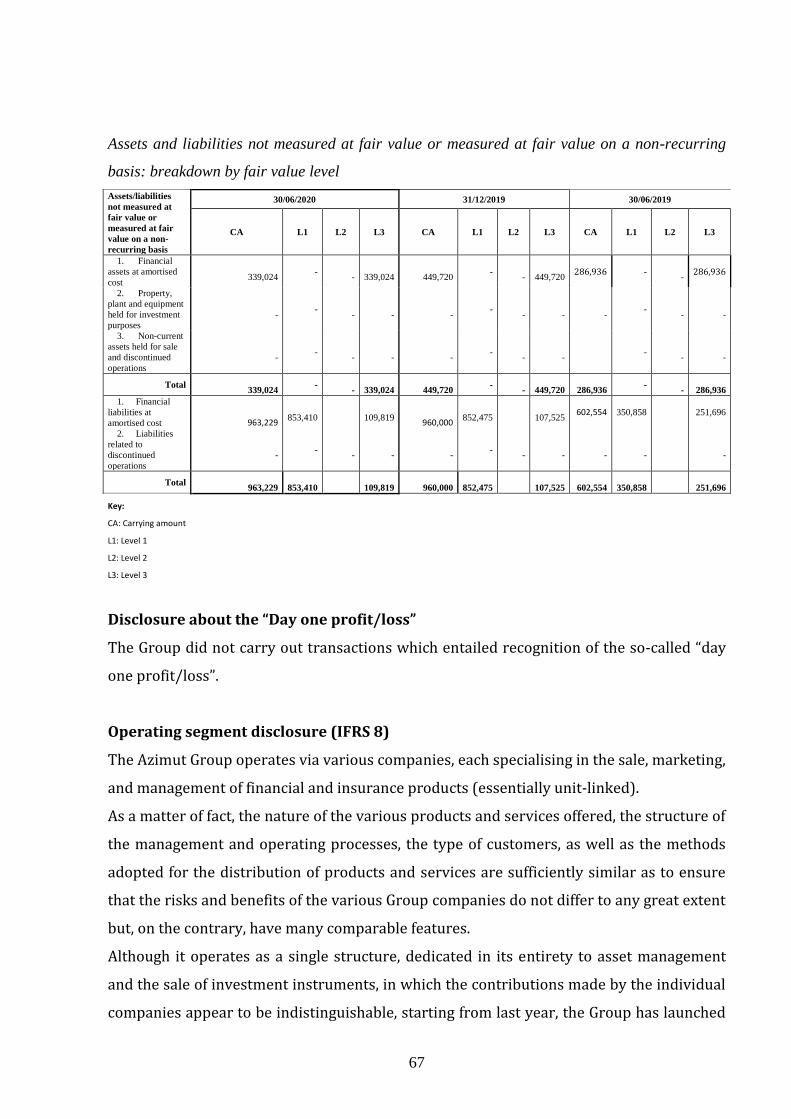
67
Assets and liabilities not measured at fair value or measured at fair value on a non-recurring
basis: breakdown by fair value level
Assets/liabilities
not measured at
fair value or
measured at fair
value on a non-
recurring basis
30/06/2020 31/12/2019 30/06/2019
CA L1 L2 L3 CA L1 L2 L3 CA L1 L2 L3
1. Financial
assets at amortised
cost
339,024 -
-
339,024
449,720 -
-
449,720 286,936 -
- 286,936
2. Property,
plant and equipment
held for investment
purposes
- -
-
-
- -
-
-
- -
-
-
3. Non-current
assets held for sale
and discontinued
operations
- -
-
-
- -
-
- -
-
-
Total
339,024 -
-
339,024
449,720 -
-
449,720
286,936 -
-
286,936
1. Financial
liabilities at
amortised cost 963,229
853,410
109,819 960,000
852,475
107,525 602,554 350,858 251,696
2. Liabilities
related to
discontinued
operations
- -
-
-
- -
-
-
-
-
-
Total
963,229
853,410
109,819
960,000
852,475
107,525
602,554
350,858
251,696
Key:
CA: Carrying amount
L1: Level 1
L2: Level 2
L3: Level 3
Disclosure about the “Day one profit/loss”
The Group did not carry out transactions which entailed recognition of the so-called “day
one profit/loss”.
Operating segment disclosure (IFRS 8)
The Azimut Group operates via various companies, each specialising in the sale, marketing,
and management of financial and insurance products (essentially unit-linked).
As a matter of fact, the nature of the various products and services offered, the structure of
the management and operating processes, the type of customers, as well as the methods
adopted for the distribution of products and services are sufficiently similar as to ensure
that the risks and benefits of the various Group companies do not differ to any great extent
but, on the contrary, have many comparable features.
Although it operates as a single structure, dedicated in its entirety to asset management
and the sale of investment instruments, in which the contributions made by the individual
companies appear to be indistinguishable, starting from last year, the Group has launched

68
a review of operating segments in accordance with IFRS 8 and chose the allocation by
geographical areas as the method to measure the Group’s performance and make
significant economic decisions.
Indeed, the Group identified four geographical areas:
- the first area (Italy) reflects the activity carried out by the companies directly
controlled by Azimut Holding S.p.A., each specialising in the distribution, promotion
and management of financial and insurance products (basically unit-linked
products) and operating as a single structure, dedicated in its entirety to asset
management and the sale of investment instruments, in which the contributions
made by the individual companies appear to be indistinguishable and operating
results are revised periodically by management for the purpose of decisions
regarding allocation of resources and measurement of results and company
performance. This area also includes the foreign product companies AZ Fund
Management SA and AZ Life Dac;
- the three other areas (Europe, Middle East & Africa, America and Asia & Pacific) refer to
the activity carried out by the foreign companies belonging to the Luxembourg
company AZ International Holdings SA, wholly owned by Azimut Holding S.p.A..
Foreign companies are also specialised in the management, promotion and
distribution of financial and asset management products, each in the relevant
geographical area and in accordance with the same above-mentioned business
model. Therefore, management has set out a consolidated reporting system for AZ
International Holdings SA which, in turn, must send the Parent Company Azimut
Holding a consolidated reporting package for all foreign companies broken down
according to the above geographical areas.
This section shows the consolidated figures broken down by geographical area, according
to the reporting system selected by management and in line with the information
disclosed to the market.
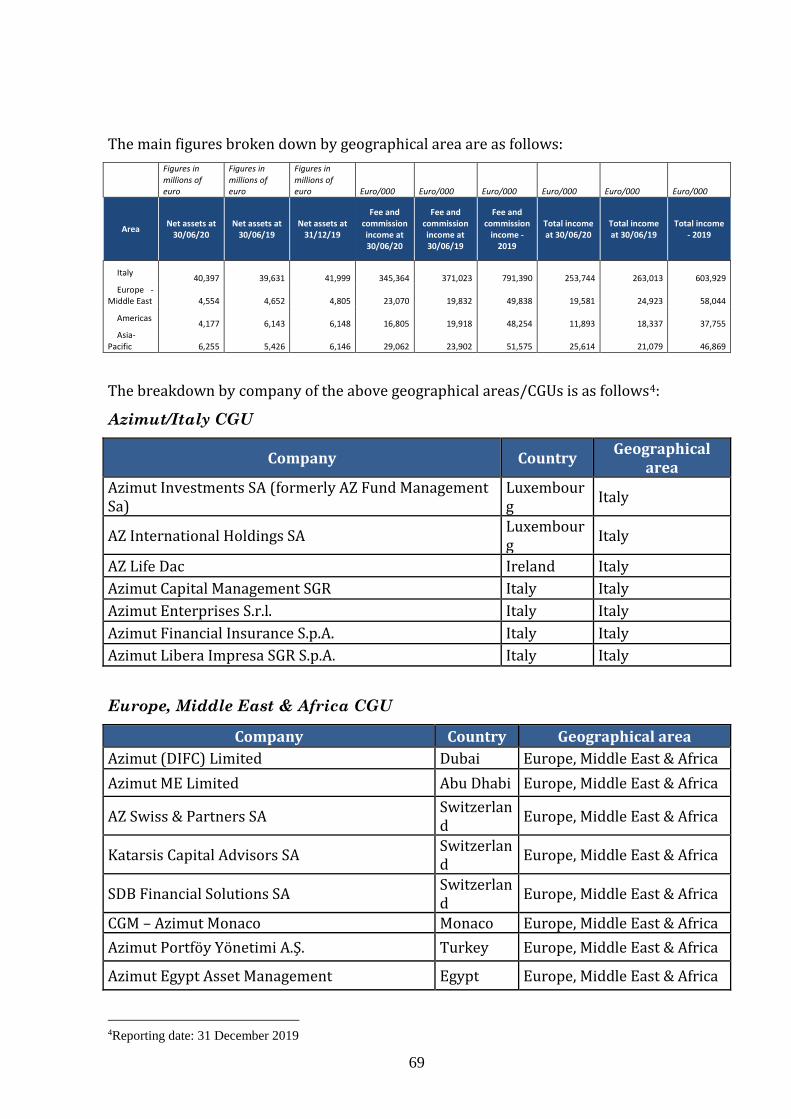
69
The main figures broken down by geographical area are as follows:
Figures in millions of euro
Figures in millions of euro
Figures in millions of euro Euro/000 Euro/000 Euro/000 Euro/000 Euro/000 Euro/000
Area Net assets at
30/06/20 Net assets at
30/06/19 Net assets at
31/12/19
Fee and commission income at 30/06/20
Fee and commission income at 30/06/19
Fee and commission
income - 2019
Total income at 30/06/20
Total income at 30/06/19
Total income - 2019
Italy
40,397
39,631
41,999
345,364
371,023
791,390
253,744
263,013
603,929 Europe -
Middle East
4,554
4,652
4,805
23,070
19,832
49,838
19,581
24,923
58,044
Americas
4,177
6,143
6,148
16,805
19,918
48,254
11,893
18,337
37,755 Asia-
Pacific
6,255
5,426
6,146
29,062
23,902
51,575
25,614
21,079
46,869
The breakdown by company of the above geographical areas/CGUs is as follows4:
Azimut/Italy CGU
Company Country Geographical
area Azimut Investments SA (formerly AZ Fund Management Sa)
Luxembourg
Italy
AZ International Holdings SA Luxembourg
Italy
AZ Life Dac Ireland Italy
Azimut Capital Management SGR Italy Italy
Azimut Enterprises S.r.l. Italy Italy
Azimut Financial Insurance S.p.A. Italy Italy
Azimut Libera Impresa SGR S.p.A. Italy Italy
Europe, Middle East & Africa CGU
Company Country Geographical area
Azimut (DIFC) Limited Dubai Europe, Middle East & Africa
Azimut ME Limited Abu Dhabi Europe, Middle East & Africa
AZ Swiss & Partners SA Switzerland
Europe, Middle East & Africa
Katarsis Capital Advisors SA Switzerland
Europe, Middle East & Africa
SDB Financial Solutions SA Switzerland
Europe, Middle East & Africa
CGM – Azimut Monaco Monaco Europe, Middle East & Africa
Azimut Portföy Yönetimi A.Ş. Turkey Europe, Middle East & Africa
Azimut Egypt Asset Management Egypt Europe, Middle East & Africa
4Reporting date: 31 December 2019

70
Asia & Pacific CGU
Company Country Geographical
area
AZ Next Generation Advisory PTY Ltd Australia Asia & Pacific
Eureka Whittaker Macnaught PTY Ltd Australia Asia & Pacific
Pride Advice PTY Ltd Australia Asia & Pacific
Lifestyle Financial Planning Services (LFPS) PTY Ltd Australia Asia & Pacific
Eureka Financial Group PTY Ltd Australia Asia & Pacific
Pride Financial PTY Ltd Australia Asia & Pacific
Wise Planners PTY Ltd Australia Asia & Pacific
Domane Financial Advisers PTY LTD Australia Asia & Pacific
Financial Lifestyle Partners PTY Ltd Australia Asia & Pacific
Harvest Wealth PTY Ltd Australia Asia & Pacific
RI Toowoomba PTY Ltd Australia Asia & Pacific
Empowered Financial Partners PTY Ltd Australia Asia & Pacific
Wealthwise PTY Ltd Australia Asia & Pacific
Priority Advisory Group PTY Ltd Australia Asia & Pacific
Sterling Planners PTY Ltd Australia Asia & Pacific
Logiro Unchartered PTY Ltd Australia Asia & Pacific
Aspire Pty Ltd Australia Asia & Pacific
On-Track Financial Solutions Pty Ltd Australia Asia & Pacific
AZ Sestante Ltd Australia Asia & Pacific
Priority Advisory Trust Australia Asia & Pacific
Peters & Partners PTY Ltd Australia Asia & Pacific
Menico Tuck Parrish Financial Solution Pty Ltd Australia Asia & Pacific
AZ Next Generation Accounting PTY Ltd Australia Asia & Pacific
Wealthmed Australia Pty Ltd Australia Asia & Pacific
Wealthmed Accounting Pty Ltd Australia Asia & Pacific
Wealthmed Property Pty Ltd Australia Asia & Pacific
Farrow Hughes Mulcahy Financial Services Pty Ltd Australia Asia & Pacific
Menico Tuck Parish Pty Ltd Australia Asia & Pacific
Henderson Maxwel No.2 Pty Ltd Australia Asia & Pacific
Henderson Maxwell Financial Planning Pty Ltd Australia Asia & Pacific
Henderson Maxwell Accounting Pty Ltd Australia Asia & Pacific
Herwitz Geller Pty Ltd Australia Asia & Pacific
Dunsford Financial Plannings Pty Ltd Australia Asia & Pacific
BRM Holdich Australia Asia & Pacific
Nextstep Financial Services Pty Ltd Australia Asia & Pacific
Next Steps Home Loans Pty Ltd Australia Asia & Pacific
Company Country Geographical
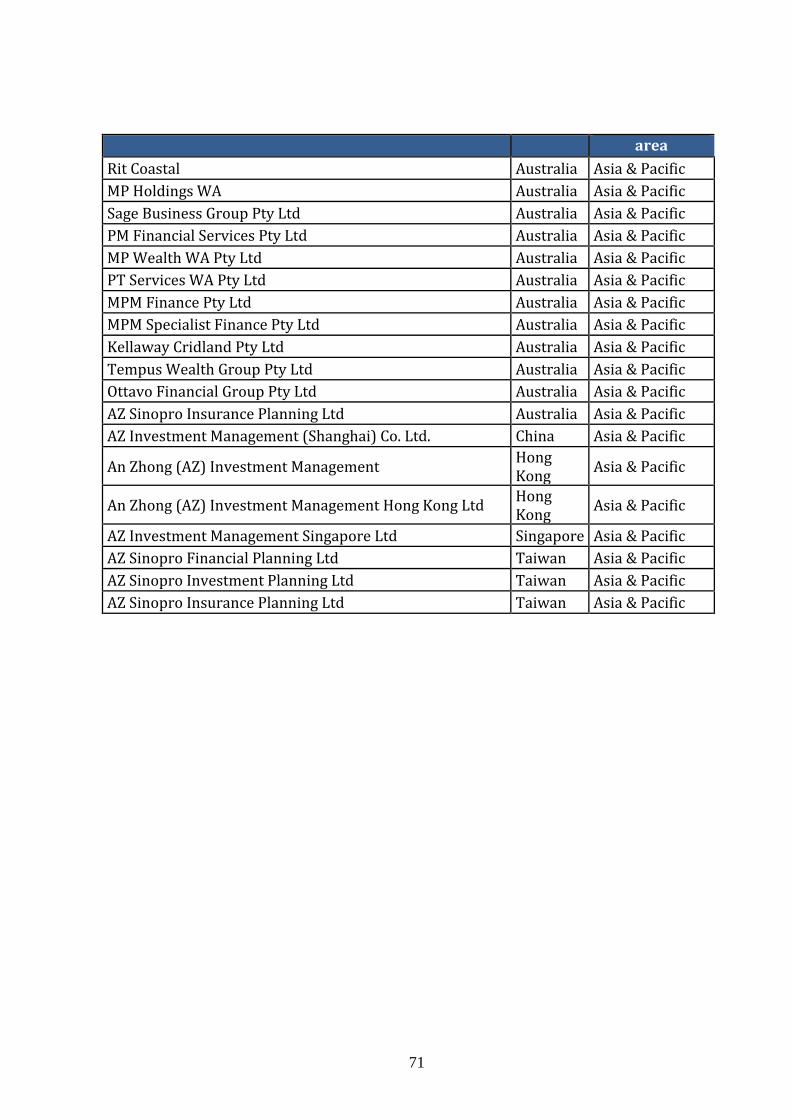
71
area
Rit Coastal Australia Asia & Pacific
MP Holdings WA Australia Asia & Pacific
Sage Business Group Pty Ltd Australia Asia & Pacific
PM Financial Services Pty Ltd Australia Asia & Pacific
MP Wealth WA Pty Ltd Australia Asia & Pacific
PT Services WA Pty Ltd Australia Asia & Pacific
MPM Finance Pty Ltd Australia Asia & Pacific
MPM Specialist Finance Pty Ltd Australia Asia & Pacific
Kellaway Cridland Pty Ltd Australia Asia & Pacific
Tempus Wealth Group Pty Ltd Australia Asia & Pacific
Ottavo Financial Group Pty Ltd Australia Asia & Pacific
AZ Sinopro Insurance Planning Ltd Australia Asia & Pacific
AZ Investment Management (Shanghai) Co. Ltd. China Asia & Pacific
An Zhong (AZ) Investment Management Hong Kong
Asia & Pacific
An Zhong (AZ) Investment Management Hong Kong Ltd Hong Kong
Asia & Pacific
AZ Investment Management Singapore Ltd Singapore Asia & Pacific
AZ Sinopro Financial Planning Ltd Taiwan Asia & Pacific
AZ Sinopro Investment Planning Ltd Taiwan Asia & Pacific
AZ Sinopro Insurance Planning Ltd Taiwan Asia & Pacific

72
America CGU
Company Country Geographical area
AZ Brasil Holdings Ltda Brazil Americas
AZ Quest Participações SA Brazil Americas
AZ Quest Investimentos Ltda Brazil Americas
Azimut Brasil Wealth Management Holding SA Brazil Americas
Azimut Brasil Wealth Management Ltda Brazil Americas
Futurainvest Holding SA Brazil Americas
Azimut Brasil DTVM Ltda Brazil Americas
AZ Andes S.p.A. Chile Americas
AZ Mexico Holdings S.A. De CV Mexico Americas
Mas Fondos S.A. Mexico Americas
AZ US Holding Inc. The USA Americas
AZ Apice Capital Management LLC The USA Americas
Alternative Capital Management LLC The USA Americas
With respect to the information about the financial position required by IFRS 8, the
Group’s management does not show or analyse a different breakdown of assets and
liabilities other than that approved in the separate and consolidated financial statements.
In accordance with paragraph 34 of IFRS 8, it is noted that the Group has no customers
which account for more than 10% of consolidated revenue.

73
Earnings per share
Basic earnings per share are calculated by dividing the net profit for the year by the
average number of outstanding ordinary shares.
There were no earnings-dilutive transactions to be disclosed at 30 June 2020.
30/06/2020 30/06/2019 2019
Basic earnings per share (*) 1.029
1.228
2.641
Average number of outstanding shares (*) 138,936,549
139,286,681
140,110,863
Diluted earnings per share (*) 1.029
1.228
2.641
Average number of diluted outstanding shares (*)
138,936,549
139,286,681
140,110,863
* Outstanding shares are calculated net of treasury shares held by Azimut Holding S.p.A. at the reporting date.
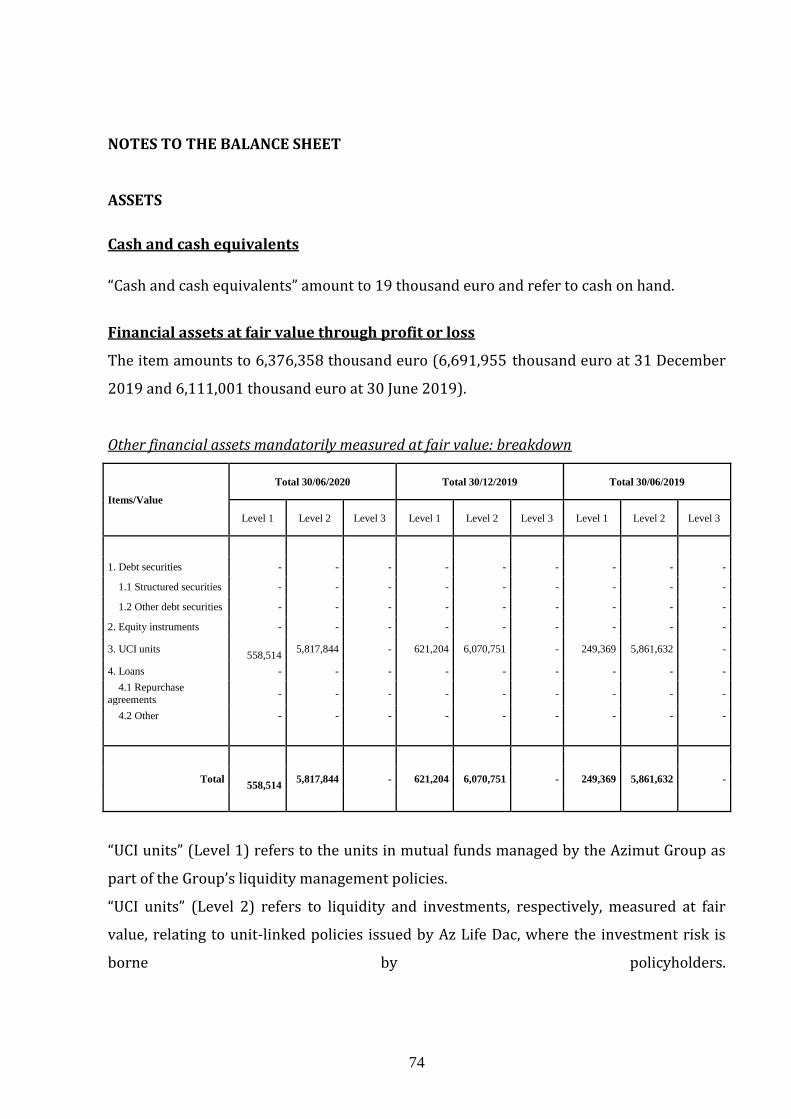
74
NOTES TO THE BALANCE SHEET
ASSETS
Cash and cash equivalents
“Cash and cash equivalents” amount to 19 thousand euro and refer to cash on hand.
Financial assets at fair value through profit or loss
The item amounts to 6,376,358 thousand euro (6,691,955 thousand euro at 31 December
2019 and 6,111,001 thousand euro at 30 June 2019).
Other financial assets mandatorily measured at fair value: breakdown
Items/Value
Total 30/06/2020 Total 30/12/2019 Total 30/06/2019
Level 1 Level 2 Level 3 Level 1 Level 2 Level 3 Level 1 Level 2 Level 3
1. Debt securities - - - - - - - - -
1.1 Structured securities - - - - - - - - -
1.2 Other debt securities - - - - - - - - -
2. Equity instruments - - - - - - - - -
3. UCI units
558,514 5,817,844 - 621,204 6,070,751 - 249,369 5,861,632 -
4. Loans - - - - - - - - -
4.1 Repurchase
agreements - - - - - - - - -
4.2 Other - - - - - - - - -
Total
558,514 5,817,844 - 621,204 6,070,751 - 249,369 5,861,632 -
“UCI units” (Level 1) refers to the units in mutual funds managed by the Azimut Group as
part of the Group’s liquidity management policies.
“UCI units” (Level 2) refers to liquidity and investments, respectively, measured at fair
value, relating to unit-linked policies issued by Az Life Dac, where the investment risk is
borne by policyholders.
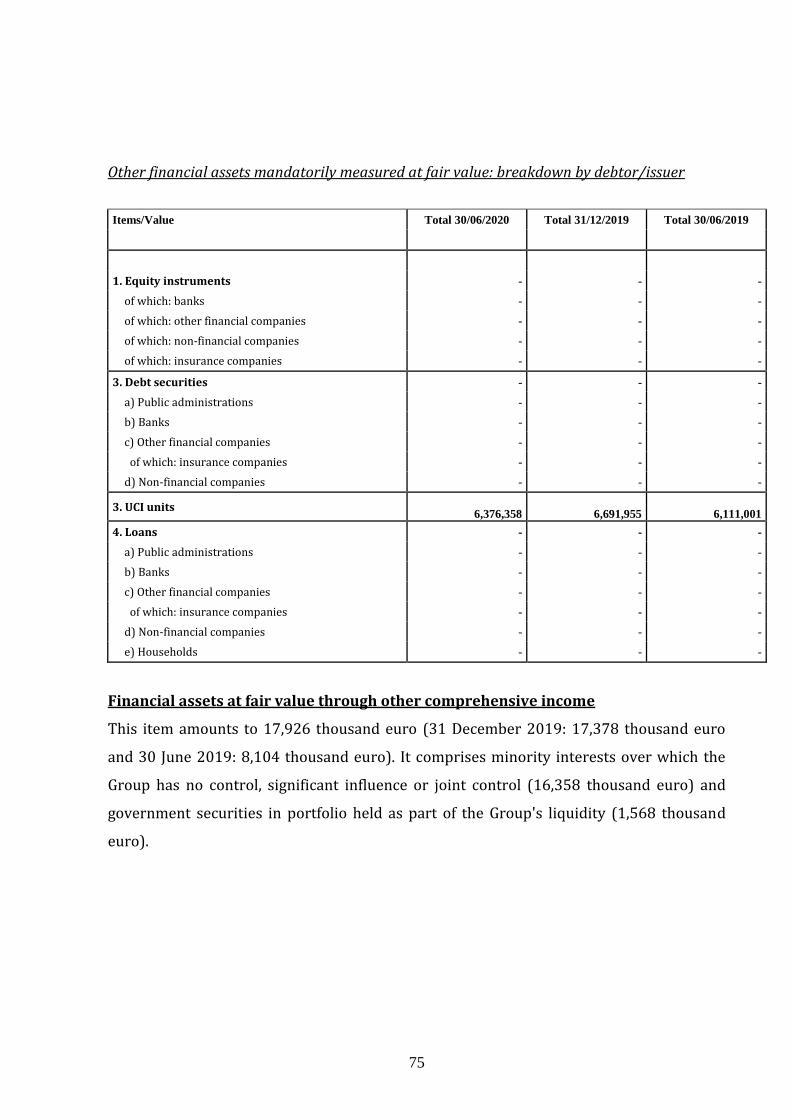
75
Other financial assets mandatorily measured at fair value: breakdown by debtor/issuer
Items/Value Total 30/06/2020 Total 31/12/2019 Total 30/06/2019
1. Equity instruments - - -
of which: banks - - -
of which: other financial companies - - -
of which: non-financial companies - - -
of which: insurance companies - - -
3. Debt securities - - -
a) Public administrations - - -
b) Banks - - -
c) Other financial companies - - -
of which: insurance companies - - -
d) Non-financial companies - - -
3. UCI units
6,376,358
6,691,955
6,111,001
4. Loans - - -
a) Public administrations - - -
b) Banks - - -
c) Other financial companies - - -
of which: insurance companies - - -
d) Non-financial companies - - -
e) Households - - -
Financial assets at fair value through other comprehensive income
This item amounts to 17,926 thousand euro (31 December 2019: 17,378 thousand euro
and 30 June 2019: 8,104 thousand euro). It comprises minority interests over which the
Group has no control, significant influence or joint control (16,358 thousand euro) and
government securities in portfolio held as part of the Group's liquidity (1,568 thousand
euro).
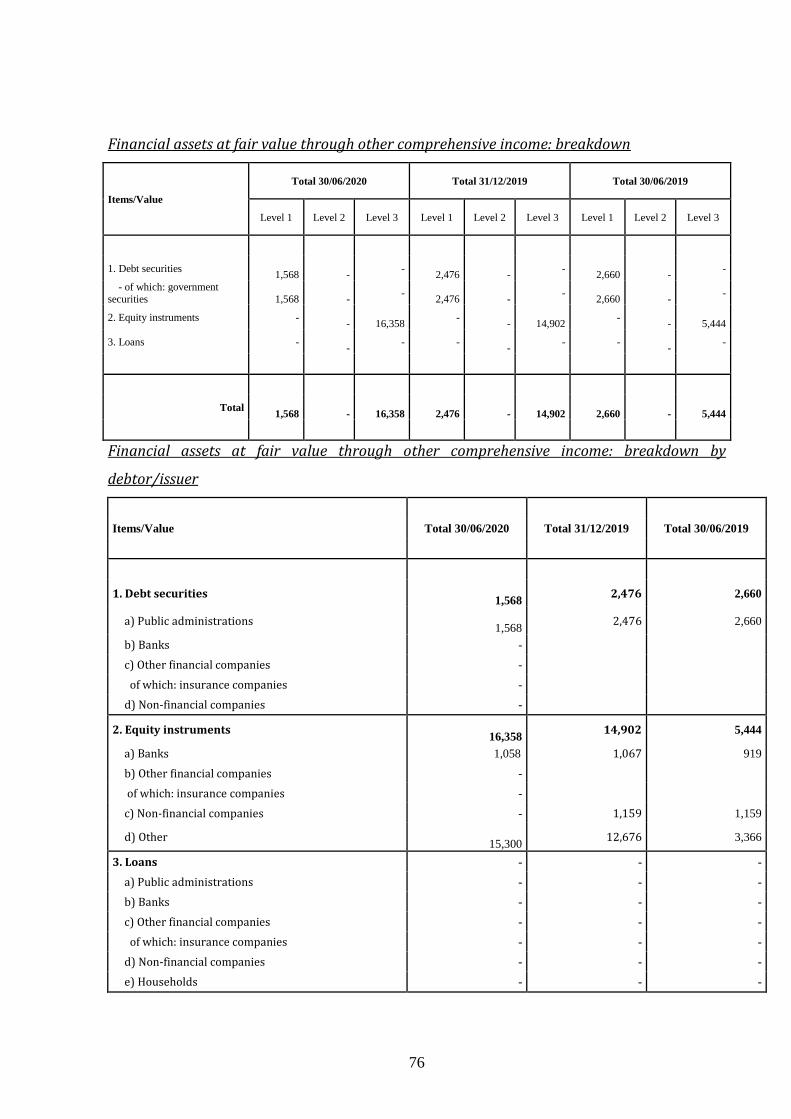
76
Financial assets at fair value through other comprehensive income: breakdown
Items/Value
Total 30/06/2020 Total 31/12/2019 Total 30/06/2019
Level 1 Level 2 Level 3 Level 1 Level 2 Level 3 Level 1 Level 2 Level 3
1. Debt securities
1,568
- -
2,476
- -
2,660
- -
- of which: government securities
1,568
-
-
2,476
- -
2,660
-
-
2. Equity instruments -
-
16,358 -
-
14,902 -
-
5,444
3. Loans -
- - -
- - -
- -
Total
1,568
-
16,358
2,476
-
14,902
2,660
-
5,444
Financial assets at fair value through other comprehensive income: breakdown by
debtor/issuer
Items/Value Total 30/06/2020 Total 31/12/2019 Total 30/06/2019
1. Debt securities
1,568 2,476 2,660
a) Public administrations
1,568 2,476 2,660
b) Banks -
c) Other financial companies -
of which: insurance companies -
d) Non-financial companies -
2. Equity instruments
16,358 14,902 5,444
a) Banks 1,058 1,067 919
b) Other financial companies -
of which: insurance companies -
c) Non-financial companies - 1,159 1,159
d) Other
15,300 12,676 3,366
3. Loans - - -
a) Public administrations - - -
b) Banks - - -
c) Other financial companies - - -
of which: insurance companies - - -
d) Non-financial companies - - -
e) Households - - -

77
Financial assets at fair value through other comprehensive income: gross balance and total
impairment losses
Gross balance Total impairment losses
Total
partial
write-offs
(*) First stage
Second stage Third stage First stage Second stage Third stage
of which:
instruments
with low
credit risk
Debt securities 1,534
Loans
Total 30/06/2020 1,534
Total 31/12/2019 2,476
Total 30/06/2019 2,660
of which:
acquired or
originated
impaired
financial assets
X X X
(*) for disclosure purposes
Financial assets at amortised cost
The item amounts to 339,024 thousand euro (31 December 2019: 449,720 thousand euro
and 30 June 2019: 286,936 thousand). It mainly comprises receivables for portfolio
management services (116,086 thousand euro), receivables for other services (39,226
thousand euro) and deposits and current accounts (188,982 thousand euro). As
receivables related to portfolio management services and other services are due in the
very short term, and as receivables from banks are on-demand deposits, the amortised
cost coincides with their nominal amount.
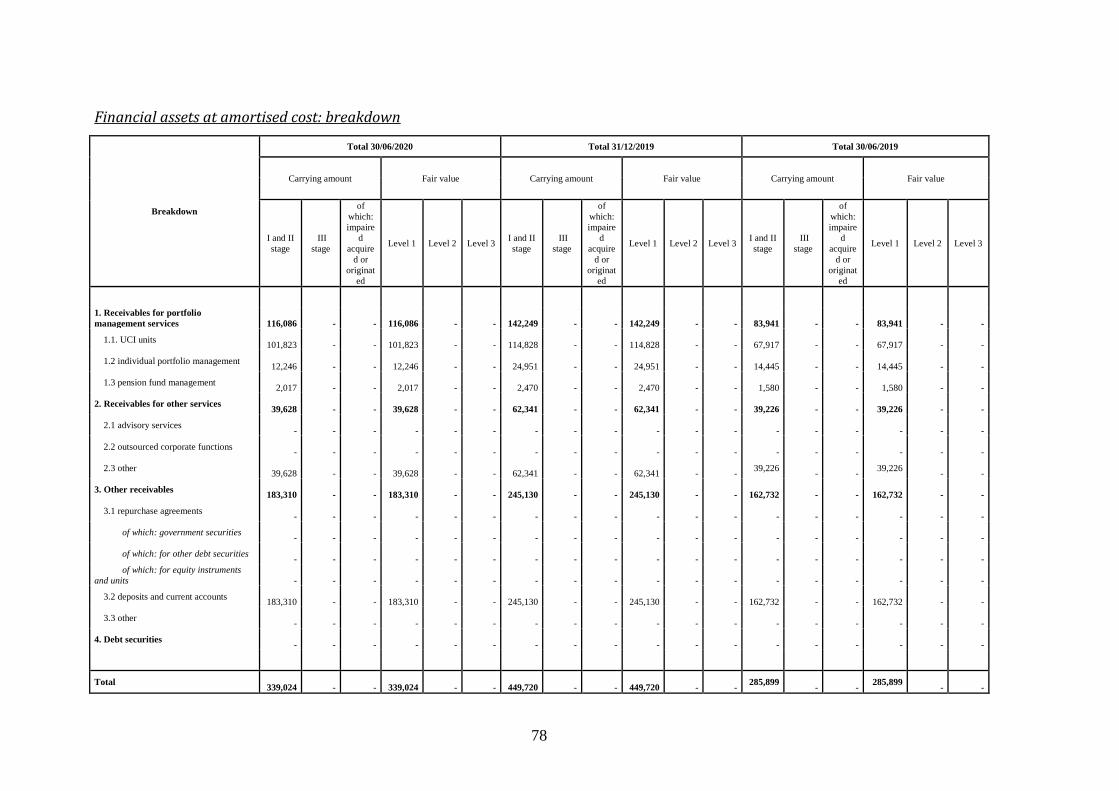
78
Financial assets at amortised cost: breakdown
Breakdown
Total 30/06/2020 Total 31/12/2019 Total 30/06/2019
Carrying amount Fair value Carrying amount Fair value Carrying amount Fair value
I and II
stage
III
stage
of
which:
impaire
d
acquire
d or
originat
ed
Level 1 Level 2 Level 3 I and II
stage
III
stage
of
which:
impaire
d
acquire
d or
originat
ed
Level 1 Level 2 Level 3 I and II
stage
III
stage
of
which:
impaire
d
acquire
d or
originat
ed
Level 1 Level 2 Level 3
1. Receivables for portfolio
management services
116,086
-
-
116,086
-
-
142,249
-
-
142,249
-
-
83,941
-
-
83,941
-
-
1.1. UCI units
101,823
-
-
101,823
-
-
114,828
-
-
114,828
-
-
67,917
-
-
67,917
-
-
1.2 individual portfolio management
12,246
-
-
12,246
-
-
24,951
-
-
24,951
-
-
14,445
-
-
14,445
-
-
1.3 pension fund management
2,017
-
-
2,017
-
-
2,470
-
-
2,470
-
-
1,580
-
-
1,580
-
-
2. Receivables for other services
39,628
-
-
39,628
-
-
62,341
-
-
62,341
-
-
39,226
-
-
39,226
-
-
2.1 advisory services
-
-
-
-
-
-
-
-
-
-
-
-
-
-
-
-
-
-
2.2 outsourced corporate functions
-
-
-
-
-
-
-
-
-
-
-
-
-
-
-
-
-
-
2.3 other
39,628
-
-
39,628
-
-
62,341
-
-
62,341
-
- 39,226
-
- 39,226
-
-
3. Other receivables
183,310
-
-
183,310
-
-
245,130
-
-
245,130
-
-
162,732
-
-
162,732
-
-
3.1 repurchase agreements
-
-
-
-
-
-
-
-
-
-
-
-
-
-
-
-
-
-
of which: government securities
-
-
-
-
-
-
-
-
-
-
-
-
-
-
-
-
-
-
of which: for other debt securities
-
-
-
-
-
-
-
-
-
-
-
-
-
-
-
-
-
-
of which: for equity instruments
and units
-
-
-
-
-
-
-
-
-
-
-
-
-
-
-
-
-
-
3.2 deposits and current accounts
183,310
-
-
183,310
-
-
245,130
-
-
245,130
-
-
162,732
-
-
162,732
-
-
3.3 other
-
-
-
-
-
-
-
-
-
-
-
-
-
-
-
-
-
-
4. Debt securities
-
-
-
-
-
-
-
-
-
-
-
-
-
-
-
-
-
-
Total
339,024
-
-
339,024
-
-
449,720
-
-
449,720
-
- 285,899
-
- 285,899
-
-
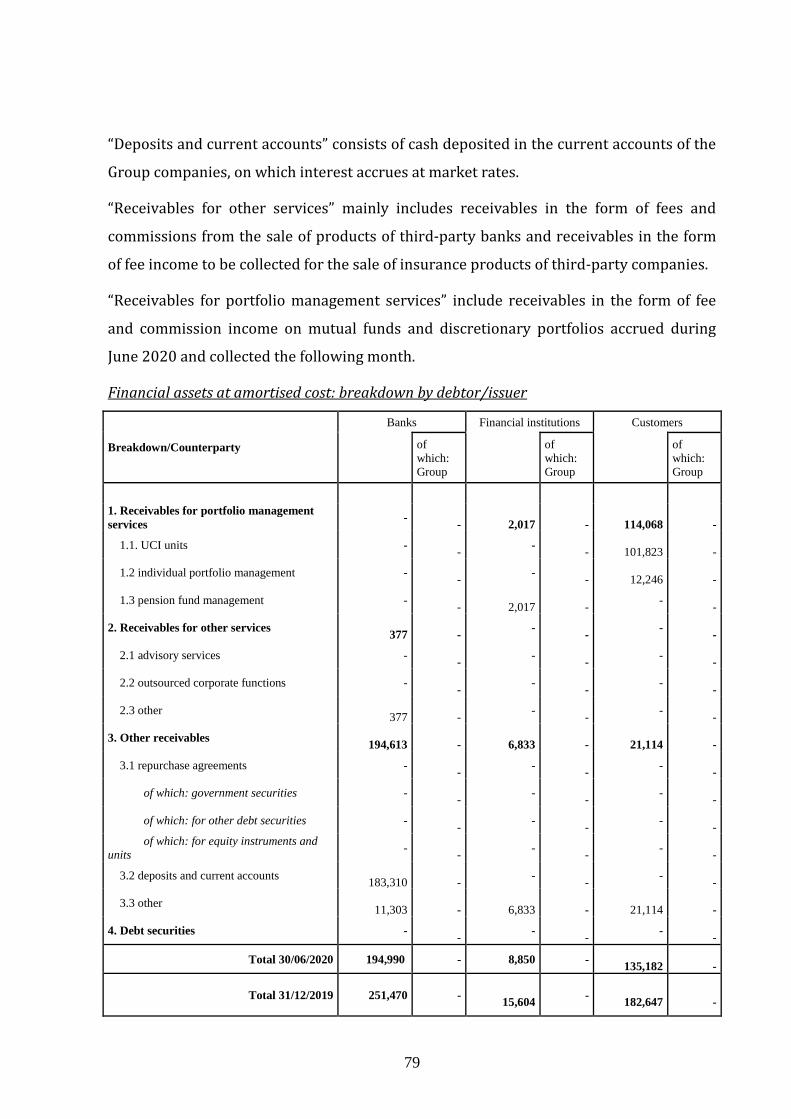
79
“Deposits and current accounts” consists of cash deposited in the current accounts of the
Group companies, on which interest accrues at market rates.
“Receivables for other services” mainly includes receivables in the form of fees and
commissions from the sale of products of third-party banks and receivables in the form
of fee income to be collected for the sale of insurance products of third-party companies.
“Receivables for portfolio management services” include receivables in the form of fee
and commission income on mutual funds and discretionary portfolios accrued during
June 2020 and collected the following month.
Financial assets at amortised cost: breakdown by debtor/issuer
Breakdown/Counterparty
Banks Financial institutions Customers
of
which:
Group
of
which:
Group
of
which:
Group
1. Receivables for portfolio management
services -
-
2,017
-
114,068
-
1.1. UCI units -
- -
-
101,823
-
1.2 individual portfolio management -
- -
-
12,246
-
1.3 pension fund management -
-
2,017
- -
-
2. Receivables for other services
377
- -
- -
-
2.1 advisory services -
- -
- -
-
2.2 outsourced corporate functions -
- -
- -
-
2.3 other
377
- -
- -
-
3. Other receivables
194,613
-
6,833
-
21,114
-
3.1 repurchase agreements -
- -
- -
-
of which: government securities -
- -
- -
-
of which: for other debt securities -
- -
- -
-
of which: for equity instruments and
units -
- -
- -
-
3.2 deposits and current accounts
183,310
- -
- -
-
3.3 other
11,303
-
6,833
-
21,114
-
4. Debt securities -
- -
- -
-
Total 30/06/2020 194,990 - 8,850 -
135,182
-
Total 31/12/2019
251,470
-
15,604 -
182,647
-
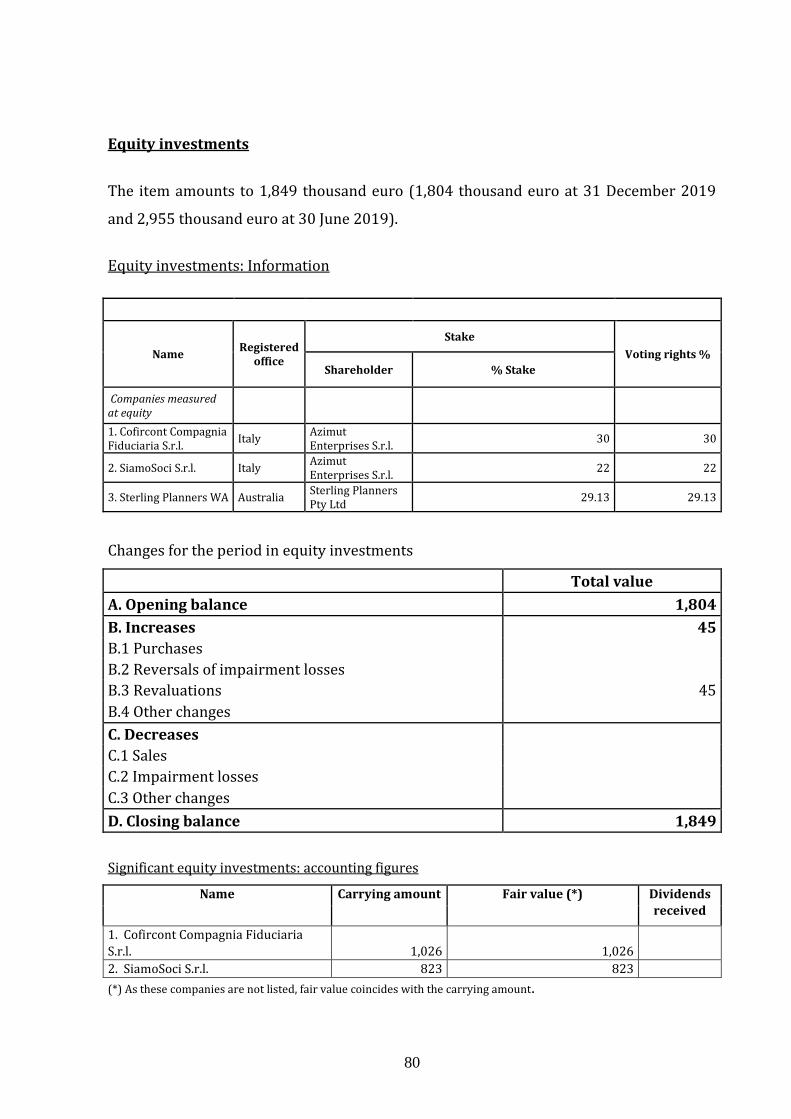
80
Equity investments
The item amounts to 1,849 thousand euro (1,804 thousand euro at 31 December 2019
and 2,955 thousand euro at 30 June 2019).
Equity investments: Information
Name Registered
office
Stake
Voting rights %
Shareholder % Stake
Companies measured at equity
1. Cofircont Compagnia Fiduciaria S.r.l.
Italy Azimut Enterprises S.r.l.
30 30
2. SiamoSoci S.r.l. Italy Azimut Enterprises S.r.l.
22 22
3. Sterling Planners WA Australia Sterling Planners Pty Ltd
29.13 29.13
Changes for the period in equity investments
Total value
A. Opening balance 1,804
B. Increases 45
B.1 Purchases
B.2 Reversals of impairment losses
B.3 Revaluations 45
B.4 Other changes
C. Decreases
C.1 Sales
C.2 Impairment losses
C.3 Other changes
D. Closing balance 1,849
Significant equity investments: accounting figures
Name Carrying amount Fair value (*) Dividends
received
1. Cofircont Compagnia Fiduciaria
S.r.l. 1,026 1,026
2. SiamoSoci S.r.l. 823 823
(*) As these companies are not listed, fair value coincides with the carrying amount.

81
Property, plant and equipment
The item amounts to 47,547 thousand euro (48,757 thousand euro at 31 December 2019
and 55,421 thousand euro at 30 June 2019).
“Property, plant and equipment - business purposes: breakdown of assets at cost” Items/Value Total 30/06/2020 Total 31/12/2019 Total 30/06/2019
1. Company-owned 7,873 8,392 9,163
a) land - - -
b) buildings 126 73 135
c) furniture & fixtures 1,255 1,309 1,508
d) electronic systems 201 215 229
e) other 6,291 6,795 7,291
2. Right of use: assets acquired under leases 39,674 40,307 46,257
a) land - -
b) buildings 37,903 38,424 43,522
c) furniture & fixtures - -
d) electronic systems - -
e) other 1,771 1,883 2,735
Total 47,547 48,757 55,421
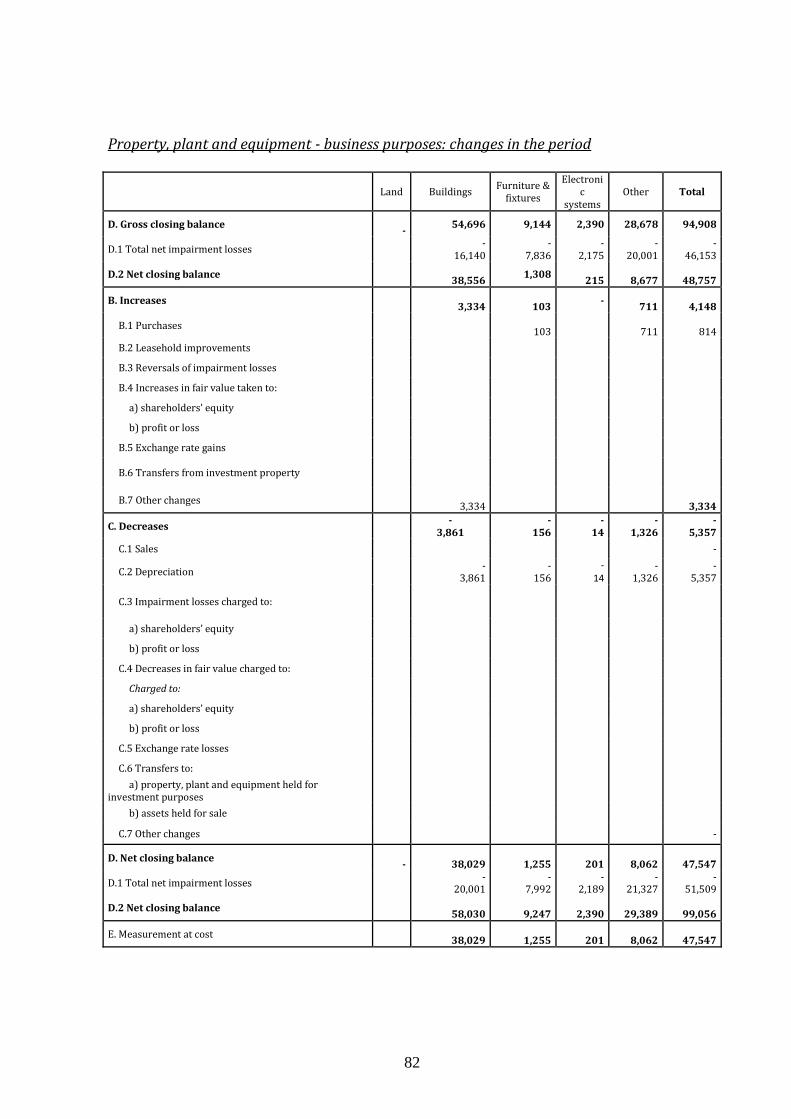
82
Property, plant and equipment - business purposes: changes in the period
Land Buildings Furniture &
fixtures
Electronic
systems Other Total
D. Gross closing balance
- 54,696 9,144 2,390 28,678 94,908
D.1 Total net impairment losses -
16,140 -
7,836 -
2,175 -
20,001 -
46,153
D.2 Net closing balance
38,556 1,308
215
8,677
48,757
B. Increases
3,334
103 -
711
4,148
B.1 Purchases
103
711
814
B.2 Leasehold improvements
B.3 Reversals of impairment losses
B.4 Increases in fair value taken to:
a) shareholders’ equity
b) profit or loss
B.5 Exchange rate gains
B.6 Transfers from investment property
B.7 Other changes
3,334
3,334
C. Decreases -
3,861 -
156 -
14 -
1,326 -
5,357
C.1 Sales
-
C.2 Depreciation -
3,861 -
156 -
14 -
1,326 -
5,357
C.3 Impairment losses charged to:
a) shareholders’ equity
b) profit or loss
C.4 Decreases in fair value charged to:
Charged to:
a) shareholders’ equity
b) profit or loss
C.5 Exchange rate losses
C.6 Transfers to:
a) property, plant and equipment held for investment purposes
b) assets held for sale
C.7 Other changes
-
D. Net closing balance
-
38,029
1,255
201
8,062
47,547
D.1 Total net impairment losses -
20,001 -
7,992 -
2,189 -
21,327 -
51,509
D.2 Net closing balance
58,030
9,247
2,390
29,389
99,056
E. Measurement at cost
38,029
1,255
201
8,062
47,547

83
Intangible assets
The item amounts to 635,261 thousand euro (634,342 thousand euro at 31 December
2019 and 634,752 thousand euro at 30 June 2019).
Breakdown of “Intangible assets”
Total 30/06/2020 Total 31/12/2019 Total 30/06/2019
Assets at cost Assets at
fair value Assets at cost
Assets at
fair value Assets at cost
Assets
at fair
value
1. Goodwill 537,263 - 535,223 - 549,017
2. Other intangible assets 97,997 - 99,119 - 85,735
2.1 generated internally - - - -
2.2 other 97,997 - 99,119 - 85,735
Total 635,261 - 634,342 - 634,752
• “Goodwill” refers to:
o the acquisition by Azimut Holding S.p.A. (formerly Tumiza S.p.A.) of the
merged company Azimut Holding S.p.A., completed on 12 February 2002.
This company wholly owned (directly or indirectly) all the companies of
the Azimut Group. This item was calculated as the difference between the
initial cost of the equity investment, at acquisition date, and the
shareholders’ equity of the subsidiaries at 31 December 2001. Following
the merger of Azimut Holding S.p.A. into Tumiza S.p.A., with accounting
effects on 1 July 2002, a portion of goodwill arising on consolidation, equal
to 176.3 million euro amortised by 26.4 million euro prior to the adoption
of IFRS (calculated based on a valuation by the independent company
PricewaterhouseCoopers Corporate Finance S.r.l.) was included in
“Goodwill" in the separate financial statements of Azimut Holding S.p.A.;
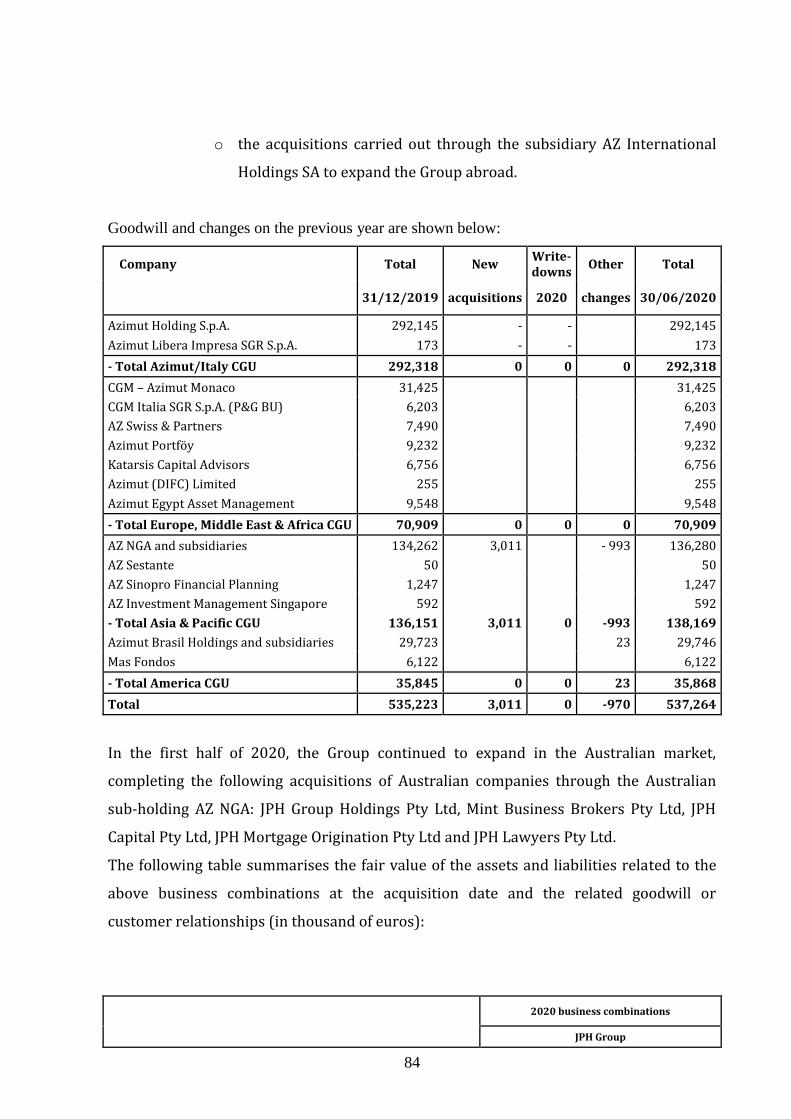
84
o the acquisitions carried out through the subsidiary AZ International
Holdings SA to expand the Group abroad.
Goodwill and changes on the previous year are shown below:
Company Total New Write-downs
Other Total
31/12/2019 acquisitions 2020 changes 30/06/2020
Azimut Holding S.p.A. 292,145 - - 292,145
Azimut Libera Impresa SGR S.p.A. 173 - - 173
- Total Azimut/Italy CGU 292,318 0 0 0 292,318
CGM – Azimut Monaco 31,425 31,425
CGM Italia SGR S.p.A. (P&G BU) 6,203 6,203
AZ Swiss & Partners 7,490 7,490
Azimut Portföy 9,232 9,232
Katarsis Capital Advisors 6,756 6,756
Azimut (DIFC) Limited 255 255
Azimut Egypt Asset Management 9,548 9,548
- Total Europe, Middle East & Africa CGU 70,909 0 0 0 70,909
AZ NGA and subsidiaries 134,262 3,011 - 993 136,280
AZ Sestante 50 50
AZ Sinopro Financial Planning 1,247 1,247
AZ Investment Management Singapore 592 592
- Total Asia & Pacific CGU 136,151 3,011 0 -993 138,169
Azimut Brasil Holdings and subsidiaries 29,723 23 29,746
Mas Fondos 6,122 6,122
- Total America CGU 35,845 0 0 23 35,868
Total 535,223 3,011 0 -970 537,264
In the first half of 2020, the Group continued to expand in the Australian market,
completing the following acquisitions of Australian companies through the Australian
sub-holding AZ NGA: JPH Group Holdings Pty Ltd, Mint Business Brokers Pty Ltd, JPH
Capital Pty Ltd, JPH Mortgage Origination Pty Ltd and JPH Lawyers Pty Ltd.
The following table summarises the fair value of the assets and liabilities related to the
above business combinations at the acquisition date and the related goodwill or
customer relationships (in thousand of euros):
2020 business combinations
JPH Group
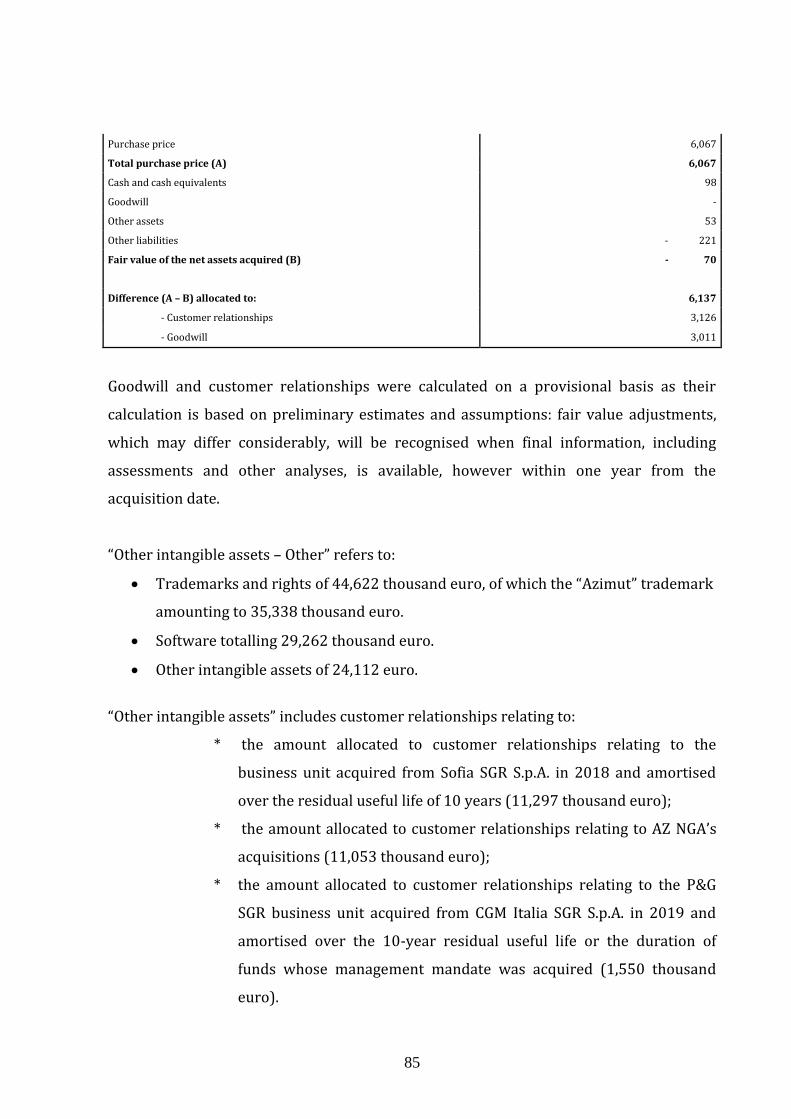
85
Purchase price 6,067
Total purchase price (A) 6,067
Cash and cash equivalents 98
Goodwill -
Other assets 53
Other liabilities - 221
Fair value of the net assets acquired (B) - 70
Difference (A – B) allocated to: 6,137
- Customer relationships 3,126
- Goodwill 3,011
Goodwill and customer relationships were calculated on a provisional basis as their
calculation is based on preliminary estimates and assumptions: fair value adjustments,
which may differ considerably, will be recognised when final information, including
assessments and other analyses, is available, however within one year from the
acquisition date.
“Other intangible assets – Other” refers to:
• Trademarks and rights of 44,622 thousand euro, of which the “Azimut” trademark
amounting to 35,338 thousand euro.
• Software totalling 29,262 thousand euro.
• Other intangible assets of 24,112 euro.
“Other intangible assets” includes customer relationships relating to:
* the amount allocated to customer relationships relating to the
business unit acquired from Sofia SGR S.p.A. in 2018 and amortised
over the residual useful life of 10 years (11,297 thousand euro);
* the amount allocated to customer relationships relating to AZ NGA’s
acquisitions (11,053 thousand euro);
* the amount allocated to customer relationships relating to the P&G
SGR business unit acquired from CGM Italia SGR S.p.A. in 2019 and
amortised over the 10-year residual useful life or the duration of
funds whose management mandate was acquired (1,550 thousand
euro).
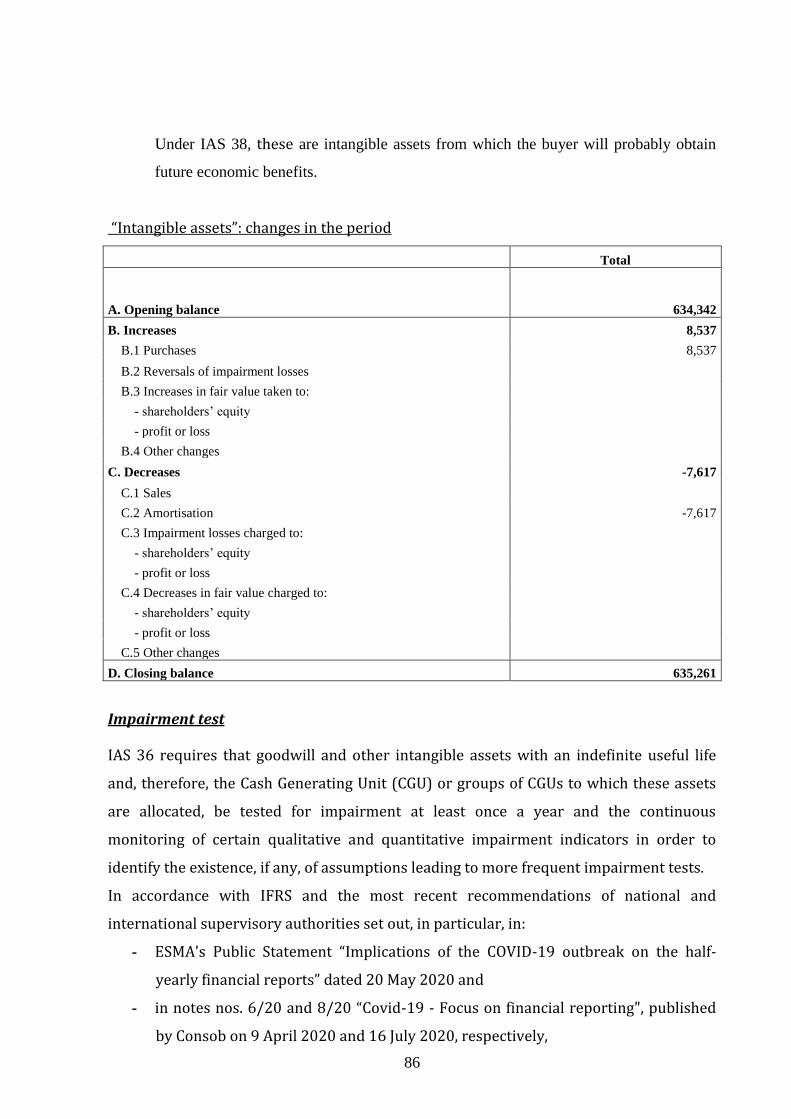
86
Under IAS 38, these are intangible assets from which the buyer will probably obtain
future economic benefits.
“Intangible assets”: changes in the period
Total
A. Opening balance 634,342
B. Increases 8,537
B.1 Purchases 8,537
B.2 Reversals of impairment losses
B.3 Increases in fair value taken to:
- shareholders’ equity
- profit or loss
B.4 Other changes
C. Decreases -7,617
C.1 Sales
C.2 Amortisation -7,617
C.3 Impairment losses charged to:
- shareholders’ equity
- profit or loss
C.4 Decreases in fair value charged to:
- shareholders’ equity
- profit or loss
C.5 Other changes
D. Closing balance 635,261
Impairment test
IAS 36 requires that goodwill and other intangible assets with an indefinite useful life
and, therefore, the Cash Generating Unit (CGU) or groups of CGUs to which these assets
are allocated, be tested for impairment at least once a year and the continuous
monitoring of certain qualitative and quantitative impairment indicators in order to
identify the existence, if any, of assumptions leading to more frequent impairment tests.
In accordance with IFRS and the most recent recommendations of national and
international supervisory authorities set out, in particular, in:
- ESMA's Public Statement “Implications of the COVID-19 outbreak on the half-
yearly financial reports” dated 20 May 2020 and
- in notes nos. 6/20 and 8/20 “Covid-19 - Focus on financial reporting", published
by Consob on 9 April 2020 and 16 July 2020, respectively,
87
the Azimut Group conducted a qualitative/quantitative analysis to determine whether
the circumstances and macroeconomic scenarios following the outbreak of the pandemic
and the related impact on the Group's results could be considered trigger events
requiring a new impairment test at 30 June 2020.
Based on this analysis and considering that the results of the Azimut Group, as better
described in the Management Report, have not been negatively and significantly
influenced by the macroeconomic context of the first half of 2020, neither on a
consolidated basis or at individual CGU levels, there are no elements indicating the need
for impairment interim procedures.
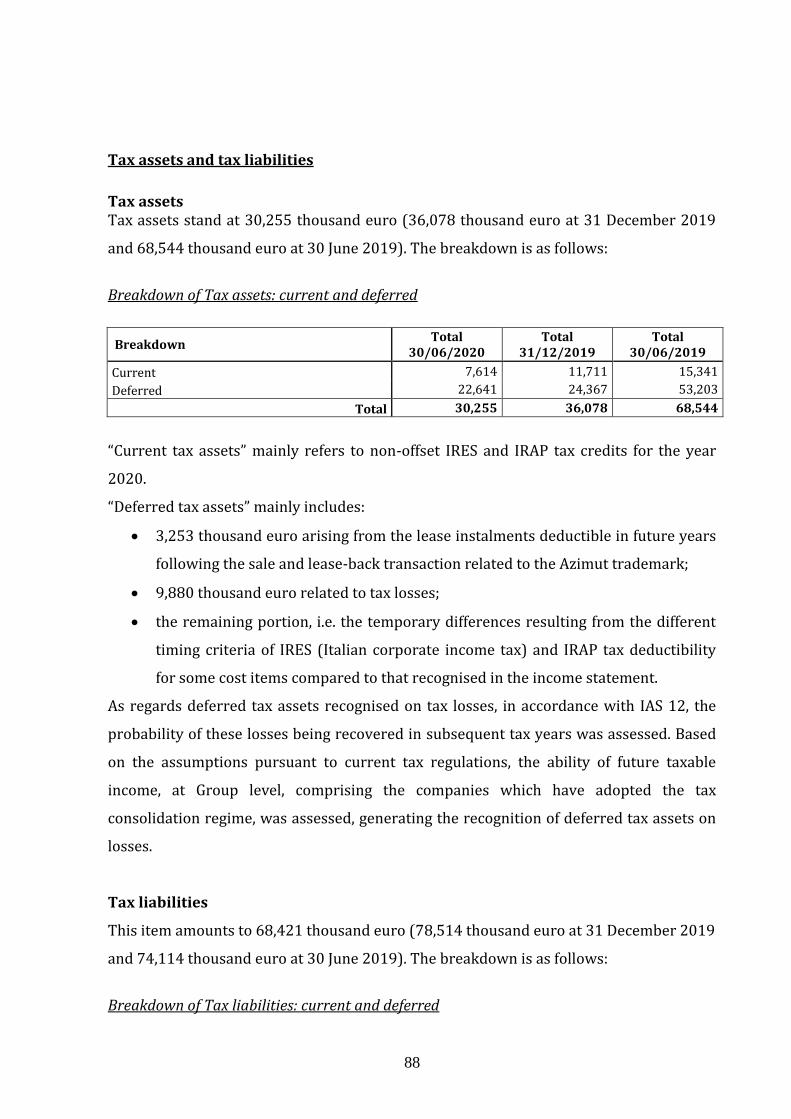
88
Tax assets and tax liabilities
Tax assets Tax assets stand at 30,255 thousand euro (36,078 thousand euro at 31 December 2019
and 68,544 thousand euro at 30 June 2019). The breakdown is as follows:
Breakdown of Tax assets: current and deferred
Breakdown Total
30/06/2020 Total
31/12/2019 Total
30/06/2019
Current 7,614 11,711 15,341
Deferred 22,641 24,367 53,203
Total 30,255 36,078 68,544
“Current tax assets” mainly refers to non-offset IRES and IRAP tax credits for the year
2020.
“Deferred tax assets” mainly includes:
• 3,253 thousand euro arising from the lease instalments deductible in future years
following the sale and lease-back transaction related to the Azimut trademark;
• 9,880 thousand euro related to tax losses;
• the remaining portion, i.e. the temporary differences resulting from the different
timing criteria of IRES (Italian corporate income tax) and IRAP tax deductibility
for some cost items compared to that recognised in the income statement.
As regards deferred tax assets recognised on tax losses, in accordance with IAS 12, the
probability of these losses being recovered in subsequent tax years was assessed. Based
on the assumptions pursuant to current tax regulations, the ability of future taxable
income, at Group level, comprising the companies which have adopted the tax
consolidation regime, was assessed, generating the recognition of deferred tax assets on
losses.
Tax liabilities
This item amounts to 68,421 thousand euro (78,514 thousand euro at 31 December 2019
and 74,114 thousand euro at 30 June 2019). The breakdown is as follows:
Breakdown of Tax liabilities: current and deferred
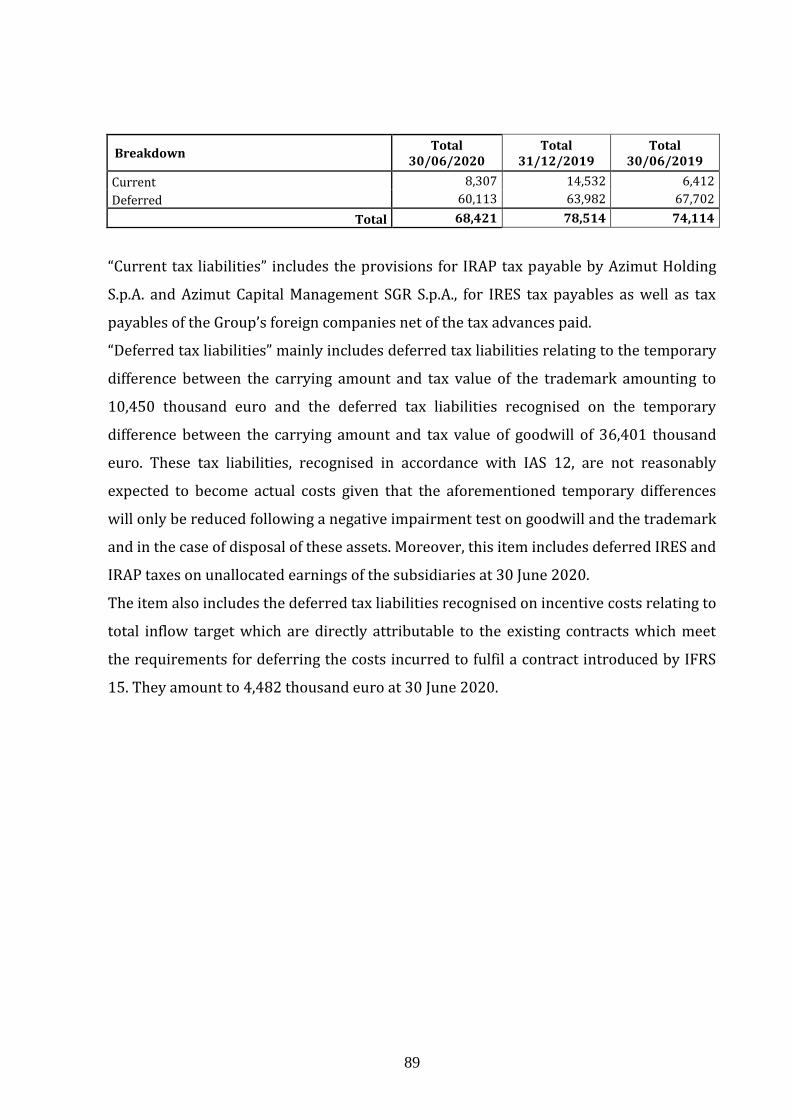
89
Breakdown Total
30/06/2020 Total
31/12/2019 Total
30/06/2019
Current 8,307 14,532 6,412
Deferred 60,113 63,982 67,702
Total 68,421 78,514 74,114
“Current tax liabilities” includes the provisions for IRAP tax payable by Azimut Holding
S.p.A. and Azimut Capital Management SGR S.p.A., for IRES tax payables as well as tax
payables of the Group’s foreign companies net of the tax advances paid.
“Deferred tax liabilities” mainly includes deferred tax liabilities relating to the temporary
difference between the carrying amount and tax value of the trademark amounting to
10,450 thousand euro and the deferred tax liabilities recognised on the temporary
difference between the carrying amount and tax value of goodwill of 36,401 thousand
euro. These tax liabilities, recognised in accordance with IAS 12, are not reasonably
expected to become actual costs given that the aforementioned temporary differences
will only be reduced following a negative impairment test on goodwill and the trademark
and in the case of disposal of these assets. Moreover, this item includes deferred IRES and
IRAP taxes on unallocated earnings of the subsidiaries at 30 June 2020.
The item also includes the deferred tax liabilities recognised on incentive costs relating to
total inflow target which are directly attributable to the existing contracts which meet
the requirements for deferring the costs incurred to fulfil a contract introduced by IFRS
15. They amount to 4,482 thousand euro at 30 June 2020.
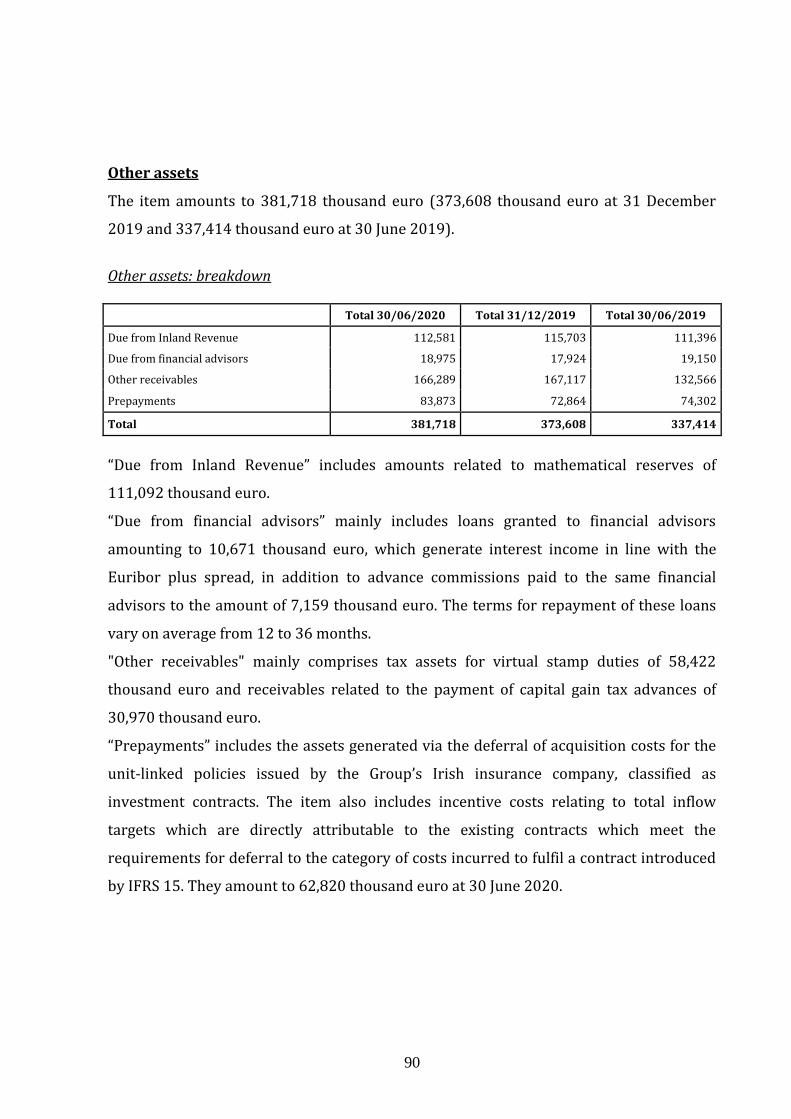
90
Other assets
The item amounts to 381,718 thousand euro (373,608 thousand euro at 31 December
2019 and 337,414 thousand euro at 30 June 2019).
Other assets: breakdown Total 30/06/2020 Total 31/12/2019 Total 30/06/2019
Due from Inland Revenue 112,581 115,703 111,396
Due from financial advisors 18,975 17,924 19,150
Other receivables 166,289 167,117 132,566
Prepayments 83,873 72,864 74,302
Total 381,718 373,608 337,414
“Due from Inland Revenue” includes amounts related to mathematical reserves of
111,092 thousand euro.
“Due from financial advisors” mainly includes loans granted to financial advisors
amounting to 10,671 thousand euro, which generate interest income in line with the
Euribor plus spread, in addition to advance commissions paid to the same financial
advisors to the amount of 7,159 thousand euro. The terms for repayment of these loans
vary on average from 12 to 36 months.
"Other receivables" mainly comprises tax assets for virtual stamp duties of 58,422
thousand euro and receivables related to the payment of capital gain tax advances of
30,970 thousand euro.
“Prepayments” includes the assets generated via the deferral of acquisition costs for the
unit-linked policies issued by the Group’s Irish insurance company, classified as
investment contracts. The item also includes incentive costs relating to total inflow
targets which are directly attributable to the existing contracts which meet the
requirements for deferral to the category of costs incurred to fulfil a contract introduced
by IFRS 15. They amount to 62,820 thousand euro at 30 June 2020.
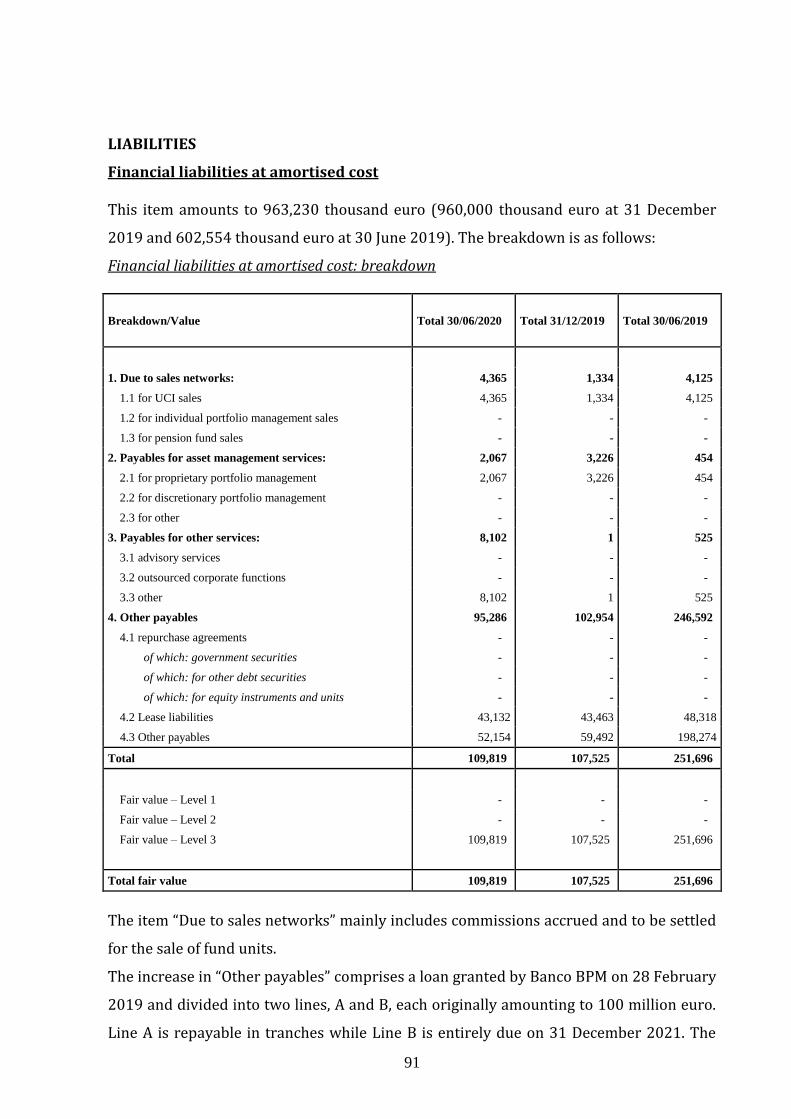
91
LIABILITIES
Financial liabilities at amortised cost This item amounts to 963,230 thousand euro (960,000 thousand euro at 31 December
2019 and 602,554 thousand euro at 30 June 2019). The breakdown is as follows:
Financial liabilities at amortised cost: breakdown
Breakdown/Value Total 30/06/2020 Total 31/12/2019 Total 30/06/2019
1. Due to sales networks: 4,365 1,334 4,125
1.1 for UCI sales 4,365 1,334 4,125
1.2 for individual portfolio management sales - - -
1.3 for pension fund sales - - -
2. Payables for asset management services: 2,067 3,226 454
2.1 for proprietary portfolio management 2,067 3,226 454
2.2 for discretionary portfolio management - - -
2.3 for other - - -
3. Payables for other services: 8,102 1 525
3.1 advisory services - - -
3.2 outsourced corporate functions - - -
3.3 other 8,102 1 525
4. Other payables 95,286 102,954 246,592
4.1 repurchase agreements - - -
of which: government securities - - -
of which: for other debt securities - - -
of which: for equity instruments and units - - -
4.2 Lease liabilities 43,132 43,463 48,318
4.3 Other payables 52,154 59,492 198,274
Total 109,819 107,525 251,696
Fair value – Level 1 - - -
Fair value – Level 2 - - -
Fair value – Level 3 109,819 107,525 251,696
Total fair value 109,819 107,525 251,696
The item “Due to sales networks” mainly includes commissions accrued and to be settled
for the sale of fund units.
The increase in “Other payables” comprises a loan granted by Banco BPM on 28 February
2019 and divided into two lines, A and B, each originally amounting to 100 million euro.
Line A is repayable in tranches while Line B is entirely due on 31 December 2021. The

92
interest rate is calculated based on the Euribor plus 140 basis points for Line A and 160
basis points for Line B. The loan is subject to covenants. On 31 December 2019, the loan
was repaid in advance for 120 million euro, in addition to the payment of Line A due on
the same date (20 million euro). Furthermore, in June 2020, Line A was repaid by
another 7.5 million euro.
Financial liabilities at amortised cost: breakdown by counterparty
Breakdown/Counterparty
Banks Financial companies Customers
of which:
Group
of which:
Group
of which:
Group
1. Due to sales networks 2,192 - 524 - - -
1.1 for UCI sales 2,192 - 524 - - -
1.2 for individual portfolio management
sales - - - - - -
1.3 for pension fund sales - - - - - -
2. Payables for asset management services: - - - - 3,716 -
2.1 for proprietary portfolio management - - - - 3,716 -
2.2 for discretionary portfolio management - - - - - -
2.3 for other - - - - - -
3. Payables for other services: - - 8,102 - - -
3.1 advisory services received - - - - - -
3.2 outsourced corporate functions - - - - - -
3.3 other - - 8,102 - - -
4. Other payables 95,286 - - - - -
4.1 repurchase agreements - - - - - -
of which: government securities - - - - - -
of which: for other debt securities - - - - - -
of which: for equity instruments and units
- - - - - -
4.2 other 95,286 - - - - -
Total 30/06/2020 97,478 - 8,626 - 3,716 -
Total 31/12/2019 104,025 - 264 - 3,236 -
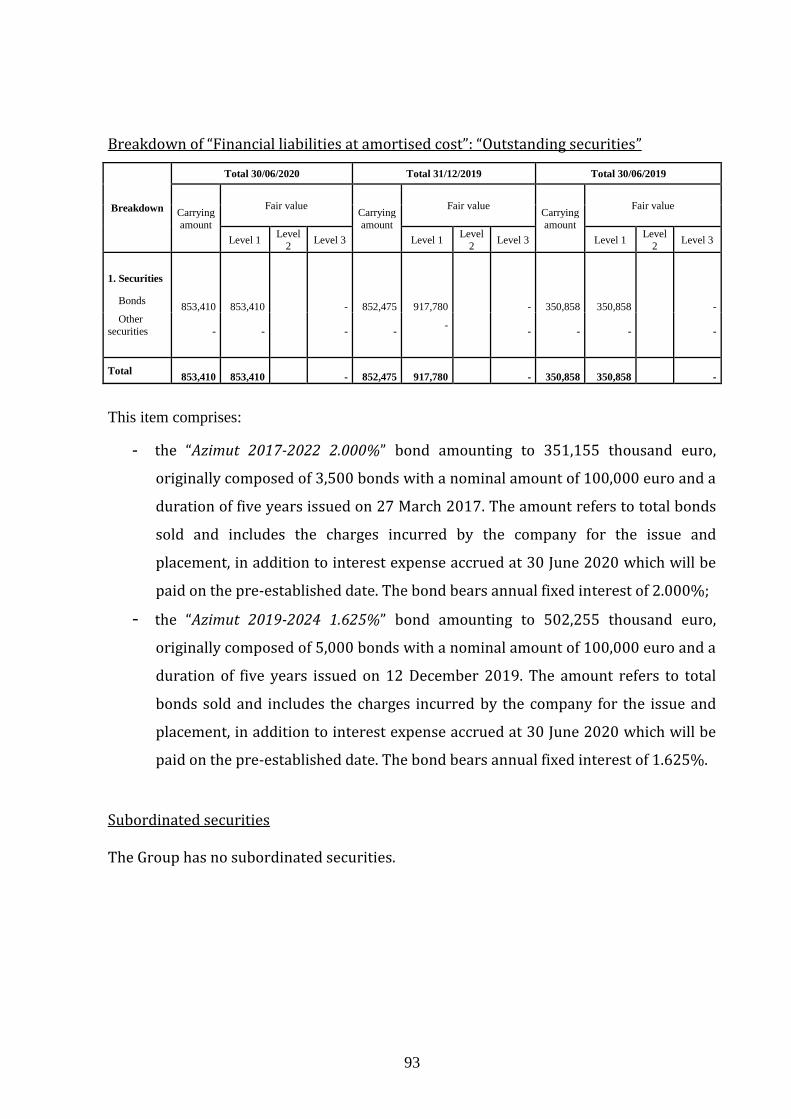
93
Breakdown of “Financial liabilities at amortised cost”: “Outstanding securities”
Breakdown
Total 30/06/2020 Total 31/12/2019 Total 30/06/2019
Carrying
amount
Fair value Carrying
amount
Fair value Carrying
amount
Fair value
Level 1 Level
2 Level 3 Level 1
Level
2 Level 3 Level 1
Level
2 Level 3
1. Securities
Bonds
853,410
853,410
-
852,475
917,780
-
350,858
350,858
-
Other
securities
-
-
-
- -
-
-
-
-
Total
853,410
853,410
-
852,475
917,780
-
350,858
350,858
-
This item comprises:
- the “Azimut 2017-2022 2.000%” bond amounting to 351,155 thousand euro,
originally composed of 3,500 bonds with a nominal amount of 100,000 euro and a
duration of five years issued on 27 March 2017. The amount refers to total bonds
sold and includes the charges incurred by the company for the issue and
placement, in addition to interest expense accrued at 30 June 2020 which will be
paid on the pre-established date. The bond bears annual fixed interest of 2.000%;
- the “Azimut 2019-2024 1.625%” bond amounting to 502,255 thousand euro,
originally composed of 5,000 bonds with a nominal amount of 100,000 euro and a
duration of five years issued on 12 December 2019. The amount refers to total
bonds sold and includes the charges incurred by the company for the issue and
placement, in addition to interest expense accrued at 30 June 2020 which will be
paid on the pre-established date. The bond bears annual fixed interest of 1.625%.
Subordinated securities The Group has no subordinated securities.
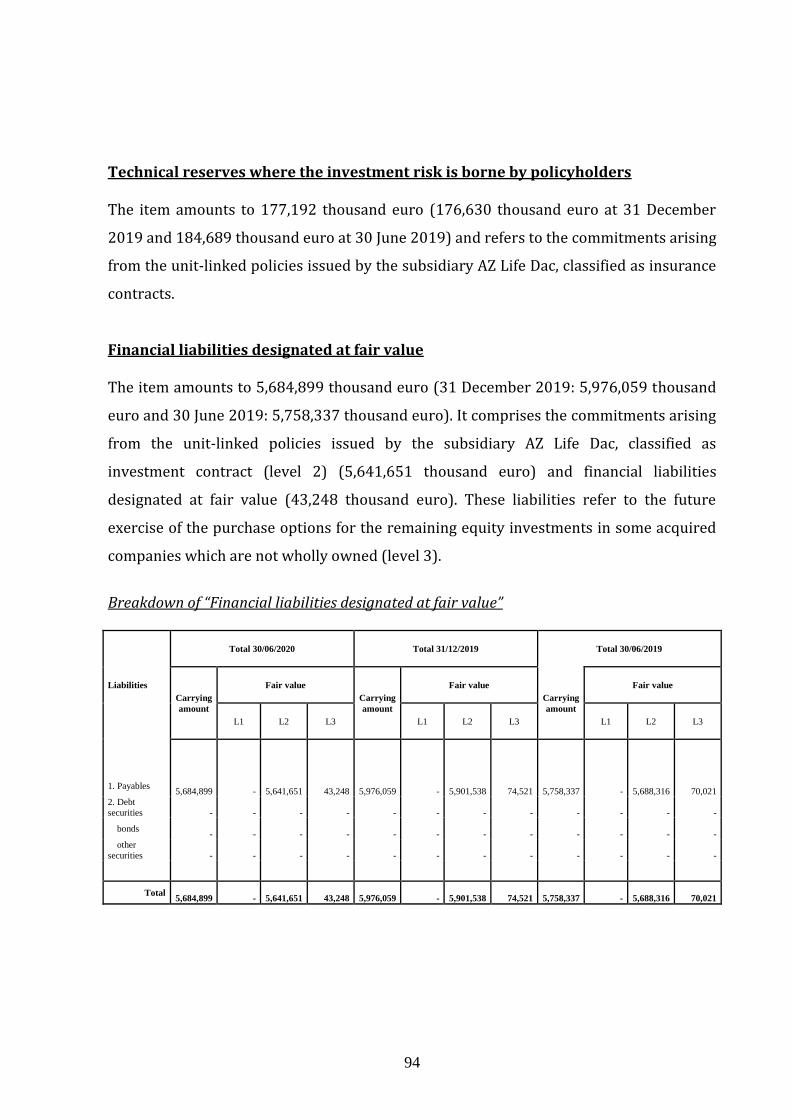
94
Technical reserves where the investment risk is borne by policyholders The item amounts to 177,192 thousand euro (176,630 thousand euro at 31 December
2019 and 184,689 thousand euro at 30 June 2019) and refers to the commitments arising
from the unit-linked policies issued by the subsidiary AZ Life Dac, classified as insurance
contracts.
Financial liabilities designated at fair value The item amounts to 5,684,899 thousand euro (31 December 2019: 5,976,059 thousand
euro and 30 June 2019: 5,758,337 thousand euro). It comprises the commitments arising
from the unit-linked policies issued by the subsidiary AZ Life Dac, classified as
investment contract (level 2) (5,641,651 thousand euro) and financial liabilities
designated at fair value (43,248 thousand euro). These liabilities refer to the future
exercise of the purchase options for the remaining equity investments in some acquired
companies which are not wholly owned (level 3).
Breakdown of “Financial liabilities designated at fair value”
Liabilities
Total 30/06/2020 Total 31/12/2019 Total 30/06/2019
Carrying
amount
Fair value
Carrying
amount
Fair value
Carrying
amount
Fair value
L1 L2 L3 L1 L2 L3 L1 L2 L3
1. Payables
5,684,899
-
5,641,651
43,248
5,976,059
-
5,901,538
74,521
5,758,337
-
5,688,316
70,021
2. Debt
securities
-
-
-
-
-
-
-
-
-
-
-
-
bonds
-
-
-
-
-
-
-
-
-
-
-
-
other
securities
-
-
-
-
-
-
-
-
-
-
-
-
Total
5,684,899
-
5,641,651
43,248
5,976,059
-
5,901,538
74,521
5,758,337
-
5,688,316
70,021
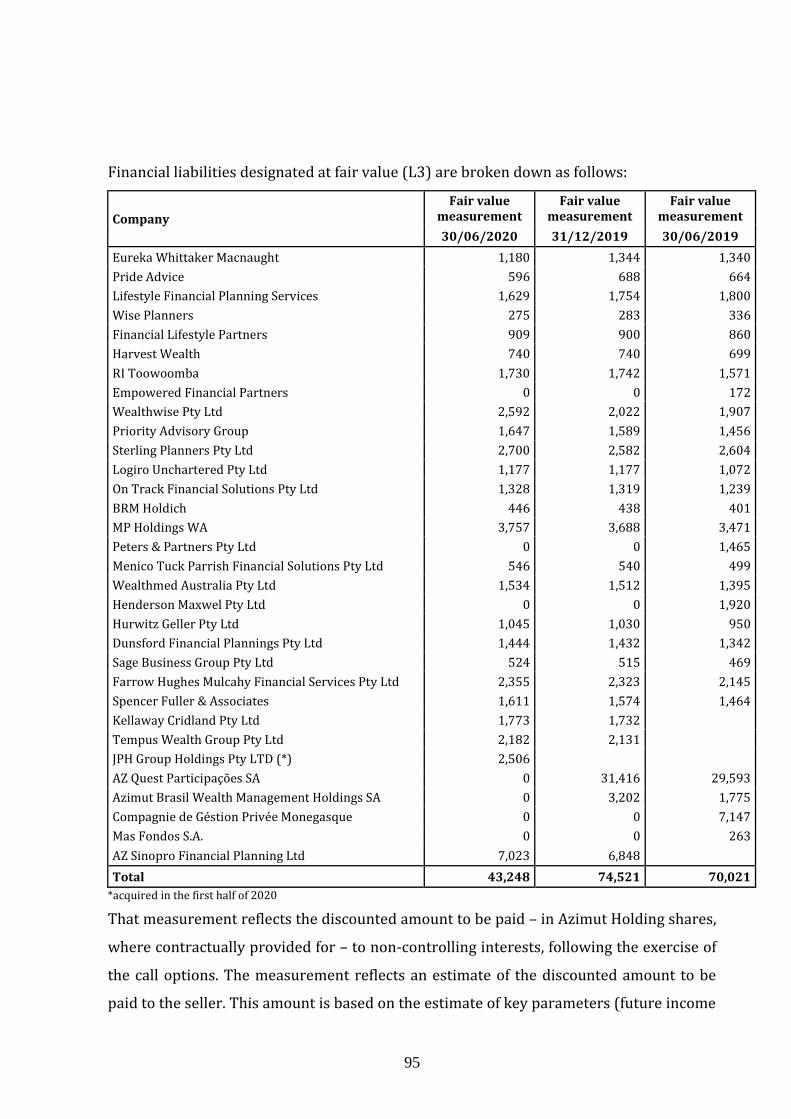
95
Financial liabilities designated at fair value (L3) are broken down as follows:
Company
Fair value measurement
Fair value measurement
Fair value measurement
30/06/2020 31/12/2019 30/06/2019
Eureka Whittaker Macnaught 1,180 1,344 1,340
Pride Advice 596 688 664
Lifestyle Financial Planning Services 1,629 1,754 1,800
Wise Planners 275 283 336
Financial Lifestyle Partners 909 900 860
Harvest Wealth 740 740 699
RI Toowoomba 1,730 1,742 1,571
Empowered Financial Partners 0 0 172
Wealthwise Pty Ltd 2,592 2,022 1,907
Priority Advisory Group 1,647 1,589 1,456
Sterling Planners Pty Ltd 2,700 2,582 2,604
Logiro Unchartered Pty Ltd 1,177 1,177 1,072
On Track Financial Solutions Pty Ltd 1,328 1,319 1,239
BRM Holdich 446 438 401
MP Holdings WA 3,757 3,688 3,471
Peters & Partners Pty Ltd 0 0 1,465
Menico Tuck Parrish Financial Solutions Pty Ltd 546 540 499
Wealthmed Australia Pty Ltd 1,534 1,512 1,395
Henderson Maxwel Pty Ltd 0 0 1,920
Hurwitz Geller Pty Ltd 1,045 1,030 950
Dunsford Financial Plannings Pty Ltd 1,444 1,432 1,342
Sage Business Group Pty Ltd 524 515 469
Farrow Hughes Mulcahy Financial Services Pty Ltd 2,355 2,323 2,145
Spencer Fuller & Associates 1,611 1,574 1,464
Kellaway Cridland Pty Ltd 1,773 1,732
Tempus Wealth Group Pty Ltd 2,182 2,131
JPH Group Holdings Pty LTD (*) 2,506
AZ Quest Participações SA 0 31,416 29,593
Azimut Brasil Wealth Management Holdings SA 0 3,202 1,775
Compagnie de Géstion Privée Monegasque 0 0 7,147
Mas Fondos S.A. 0 0 263
AZ Sinopro Financial Planning Ltd 7,023 6,848
Total 43,248 74,521 70,021
*acquired in the first half of 2020
That measurement reflects the discounted amount to be paid – in Azimut Holding shares,
where contractually provided for – to non-controlling interests, following the exercise of
the call options. The measurement reflects an estimate of the discounted amount to be
paid to the seller. This amount is based on the estimate of key parameters (future income
96
statement, balance sheet and financial position parameters set out in the relevant
contracts), that are subject to specific sensitivity analyses.
Financial liabilities measured at fair value and the related measurement at 30 June 2020
led to the recognition of losses of 2.756 thousand euro under “Net result of financial
assets and financial liabilities measured at fair value”.
In May 2020, AZ Quest Participações SA and Azimut Brasil Wealth Management Holdings
SA purchase options related to part of the residual investment were exercised as per the
original agreements, entailing a total outflow of approximately 27 million euro.
Tax liabilities
The item “Tax liabilities” is described in detail in the section on “Tax assets” of these
notes to which reference should be made.
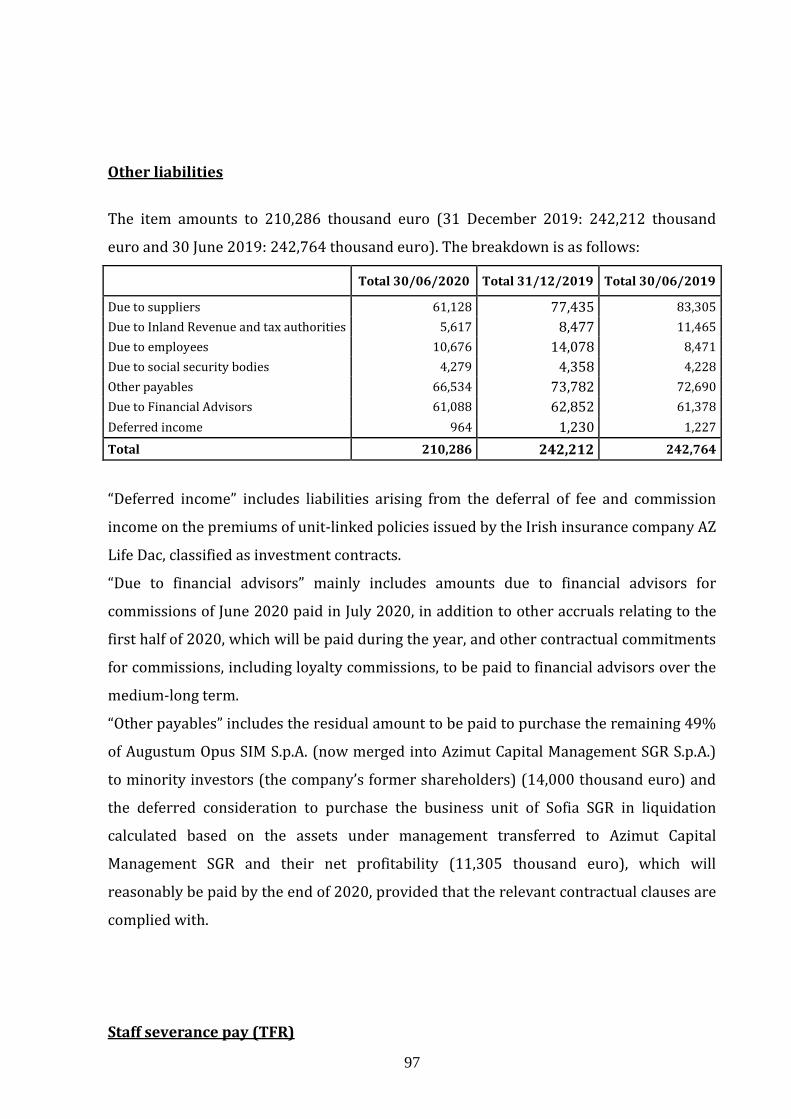
97
Other liabilities
The item amounts to 210,286 thousand euro (31 December 2019: 242,212 thousand
euro and 30 June 2019: 242,764 thousand euro). The breakdown is as follows:
Total 30/06/2020 Total 31/12/2019 Total 30/06/2019
Due to suppliers 61,128 77,435 83,305
Due to Inland Revenue and tax authorities 5,617 8,477 11,465
Due to employees 10,676 14,078 8,471
Due to social security bodies 4,279 4,358 4,228
Other payables 66,534 73,782 72,690
Due to Financial Advisors 61,088 62,852 61,378
Deferred income 964 1,230 1,227
Total 210,286 242,212 242,764
“Deferred income” includes liabilities arising from the deferral of fee and commission
income on the premiums of unit-linked policies issued by the Irish insurance company AZ
Life Dac, classified as investment contracts.
“Due to financial advisors” mainly includes amounts due to financial advisors for
commissions of June 2020 paid in July 2020, in addition to other accruals relating to the
first half of 2020, which will be paid during the year, and other contractual commitments
for commissions, including loyalty commissions, to be paid to financial advisors over the
medium-long term.
“Other payables” includes the residual amount to be paid to purchase the remaining 49%
of Augustum Opus SIM S.p.A. (now merged into Azimut Capital Management SGR S.p.A.)
to minority investors (the company’s former shareholders) (14,000 thousand euro) and
the deferred consideration to purchase the business unit of Sofia SGR in liquidation
calculated based on the assets under management transferred to Azimut Capital
Management SGR and their net profitability (11,305 thousand euro), which will
reasonably be paid by the end of 2020, provided that the relevant contractual clauses are
complied with.
Staff severance pay (TFR)
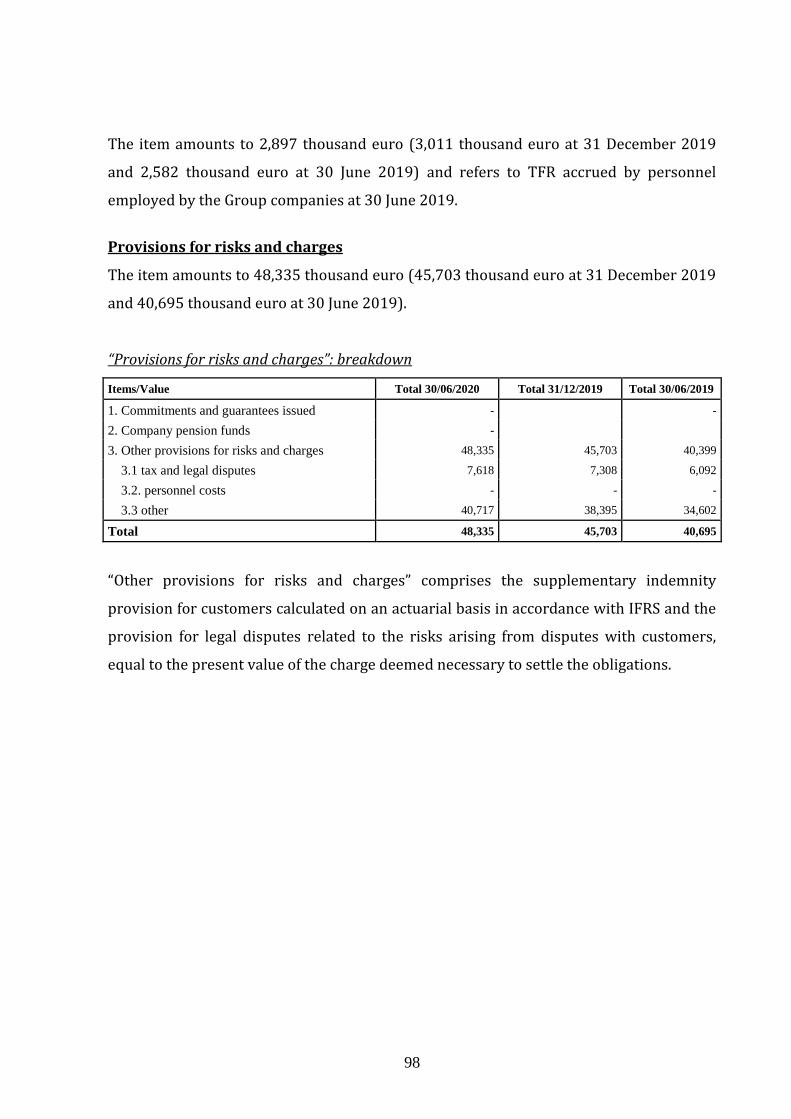
98
The item amounts to 2,897 thousand euro (3,011 thousand euro at 31 December 2019
and 2,582 thousand euro at 30 June 2019) and refers to TFR accrued by personnel
employed by the Group companies at 30 June 2019.
Provisions for risks and charges
The item amounts to 48,335 thousand euro (45,703 thousand euro at 31 December 2019
and 40,695 thousand euro at 30 June 2019).
“Provisions for risks and charges”: breakdown
Items/Value Total 30/06/2020 Total 31/12/2019 Total 30/06/2019
1. Commitments and guarantees issued - -
2. Company pension funds -
3. Other provisions for risks and charges 48,335 45,703 40,399
3.1 tax and legal disputes 7,618 7,308 6,092
3.2. personnel costs - - -
3.3 other 40,717 38,395 34,602
Total 48,335 45,703 40,695
“Other provisions for risks and charges” comprises the supplementary indemnity
provision for customers calculated on an actuarial basis in accordance with IFRS and the
provision for legal disputes related to the risks arising from disputes with customers,
equal to the present value of the charge deemed necessary to settle the obligations.

99
Shareholders’ Equity
Breakdown of “Share Capital”
Types of shares Amount
1. Share capital 32,324
1.1 Ordinary shares 32,324
1.2 Other shares - At 30 June 2020, the fully paid-up and subscribed share capital was composed of
143,254,497 ordinary shares, with a total value of 32,324 thousand euro.
Breakdown of “Treasury shares”
Types of shares Amount
1. Treasury shares 68,290
1.1 Ordinary shares 68,290
1.2 Other shares -
At 30 June 2020, Azimut Holding S.p.A. held 5,010,197 treasury shares at an average
carrying amount of 13.63 euro per share.
Breakdown of “Equity instruments”
At 30 June 2020, this item amounted to 36,000 thousand euro and related to the issue
amount, as per the shareholders' resolution of 29 April 2010, of 1,500,000 financial
instruments (equal to their fair value calculated by an independent leading company
upon issue).
Breakdown of “Share premium reserve”
The share premium reserve amounts to 173,987 thousand euro at 30 June 2020.
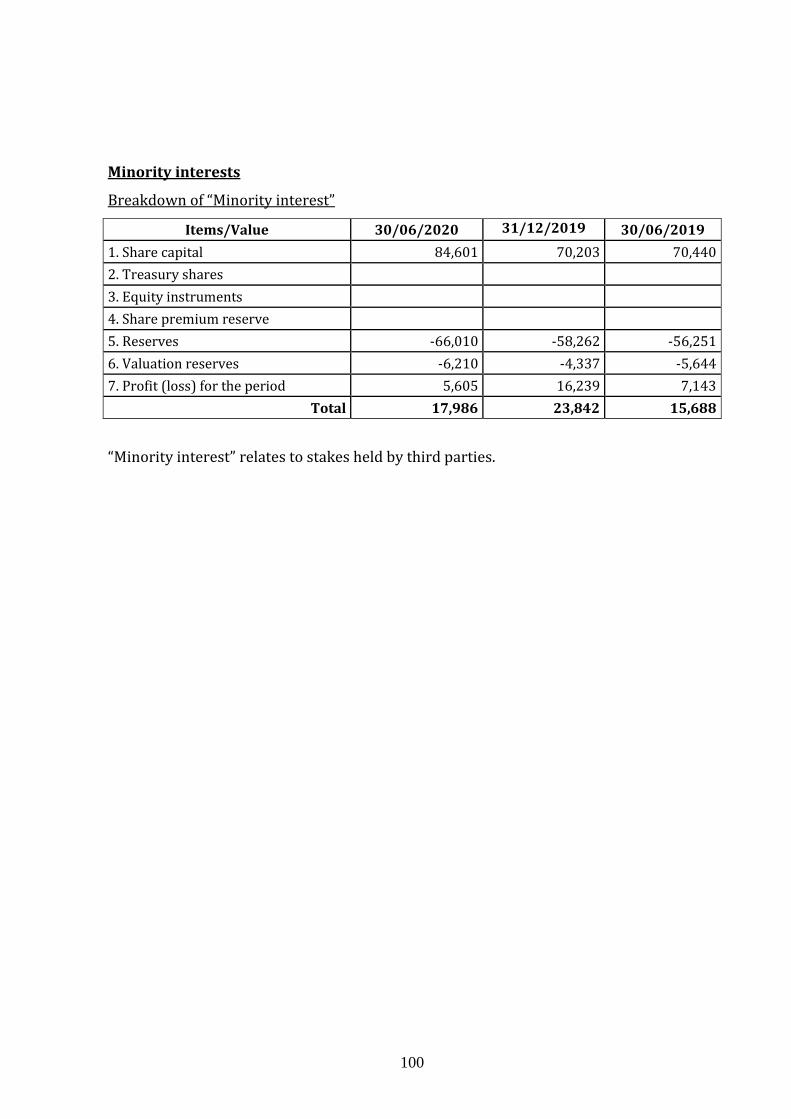
100
Minority interests
Breakdown of “Minority interest”
Items/Value 30/06/2020 31/12/2019 30/06/2019
1. Share capital 84,601 70,203 70,440
2. Treasury shares
3. Equity instruments
4. Share premium reserve
5. Reserves -66,010 -58,262 -56,251
6. Valuation reserves -6,210 -4,337 -5,644
7. Profit (loss) for the period 5,605 16,239 7,143
Total 17,986 23,842 15,688
“Minority interest” relates to stakes held by third parties.

101
NOTES TO THE INCOME STATEMENT
Fee and commission income and expense Breakdown of “Fee and commission income and expense” The breakdown is as follows:
SERVICES
Total 30/06/2020
Fee and comm.
income
Fee and comm.
expense
Net fees and
comm.
A. ASSET MANAGEMENT
1. Proprietary portfolio management
1.1 Mutual funds
- Management fees 276,774 - 276,774
- Incentive fees 39,660 - 39,660
- Entry / redemption fees 2,794 - 2,794
- Switch fees 6 - 6
- Other fees 886 - 886
Total mutual fund fees 320,121 - 320,121
1.2 Individual portfolio management
- Management fees 16,403 - 16,403
- Incentive fees 175 - 175
- Entry / redemption fees - - -
- Other fees 444 - 444
Total individual portfolio management fees 17,022 - 17,022
1.3 Open-ended pension funds
- Management fees 7,492 - 7,492
- Incentive fees - - -
- Entry / redemption fees - - -
- Other fees 814 - 814
Total open-ended pension fund fees 8,306 - 8,306
2. Discretionary portfolio management
- Management fees 1,705 - 1,705
- Incentive fees - - -
- Other fees - - -
Total discretionary portfolio management fees 1,705 - 1,705
TOTAL ASSET MANAGEMENT FEES (A) 347,154 - 347,154
B. OTHER SERVICES 67,147 - 67,147
- Advisory services 7,401 - 7,401
- Sales commissions 48,306 - 48,306
- Order intake 204 - 204
- Insurance products 7,847 - 7,847
- Other services 3,389 - 3,389
Fee expenses for sales, distribution and order
intake - - 153,065 - 153,065
TOTAL FEES AND COMMISSIONS (A+B) 414,301 - 153,065 261,236
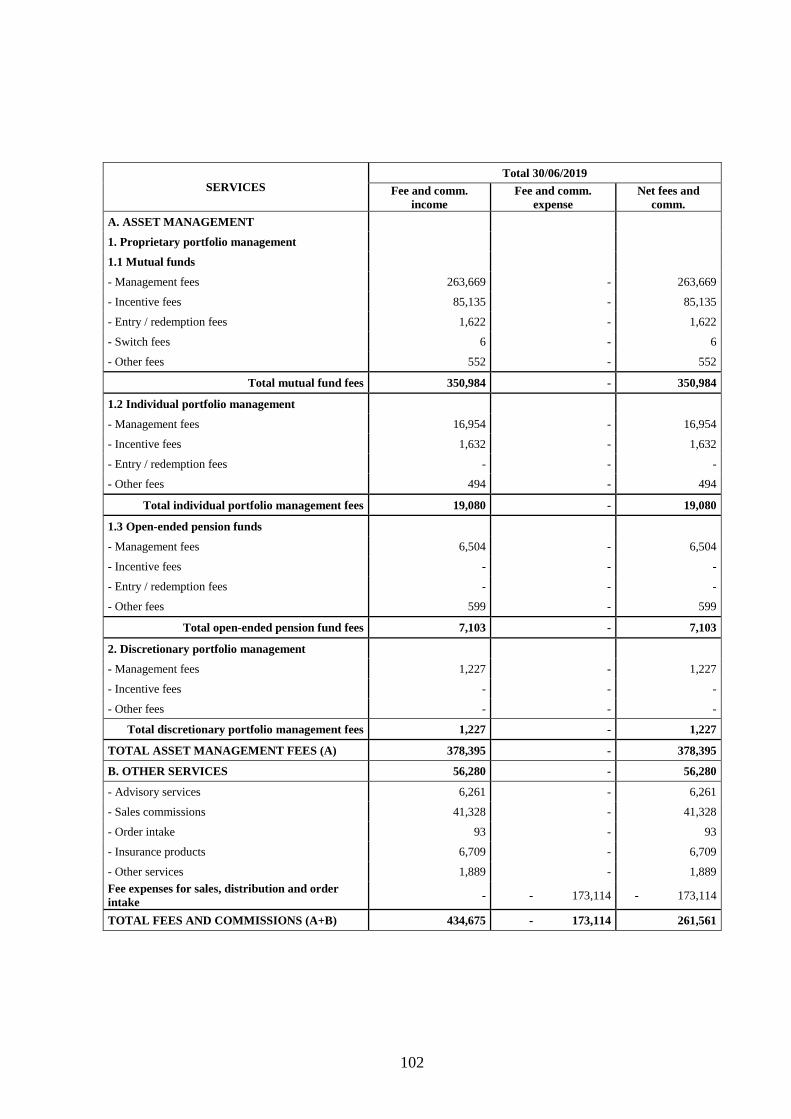
102
SERVICES
Total 30/06/2019
Fee and comm.
income
Fee and comm.
expense
Net fees and
comm.
A. ASSET MANAGEMENT
1. Proprietary portfolio management
1.1 Mutual funds
- Management fees 263,669 - 263,669
- Incentive fees 85,135 - 85,135
- Entry / redemption fees 1,622 - 1,622
- Switch fees 6 - 6
- Other fees 552 - 552
Total mutual fund fees 350,984 - 350,984
1.2 Individual portfolio management
- Management fees 16,954 - 16,954
- Incentive fees 1,632 - 1,632
- Entry / redemption fees - - -
- Other fees 494 - 494
Total individual portfolio management fees 19,080 - 19,080
1.3 Open-ended pension funds
- Management fees 6,504 - 6,504
- Incentive fees - - -
- Entry / redemption fees - - -
- Other fees 599 - 599
Total open-ended pension fund fees 7,103 - 7,103
2. Discretionary portfolio management
- Management fees 1,227 - 1,227
- Incentive fees - - -
- Other fees - - -
Total discretionary portfolio management fees 1,227 - 1,227
TOTAL ASSET MANAGEMENT FEES (A) 378,395 - 378,395
B. OTHER SERVICES 56,280 - 56,280
- Advisory services 6,261 - 6,261
- Sales commissions 41,328 - 41,328
- Order intake 93 - 93
- Insurance products 6,709 - 6,709
- Other services 1,889 - 1,889
Fee expenses for sales, distribution and order
intake - - 173,114 - 173,114
TOTAL FEES AND COMMISSIONS (A+B) 434,675 - 173,114 261,561

103
Fee and commission expense: breakdown by type and counterparty
SERVICES Banks Financial institutions Other Total
of which
Group
of which
Group
of which
Group
of which
Group
A. ASSET MANAGEMENT
1. Proprietary portfolio
management
-
-
-
-
-
-
-
-
1.1 Sales fees
-
-
-
-
-
-
-
-
- UCI
-
-
-
-
-
-
-
-
- Individual portfolio management
-
-
-
-
-
-
-
-
- Pension funds
-
-
-
-
-
-
-
-
1.2 Maintenance fees
-
-
-
-
-
-
-
-
- UCI
-
-
-
-
-
-
-
-
- Individual portfolio management
-
-
-
-
-
-
-
-
- Pension funds
-
-
-
-
-
-
-
-
1.3 Incentive fees
-
-
-
-
-
-
-
-
- UCI
-
-
-
-
-
-
-
-
- Individual portfolio management
-
-
-
-
-
-
-
-
- Pension funds
-
-
-
-
-
-
-
-
1.4 Other fees and commissions
-
-
-
-
-
-
-
-
- UCI
-
-
-
-
-
-
-
-
- Individual portfolio management
-
-
-
-
-
-
-
-
- Pension funds
-
-
-
-
-
-
-
-
2. Discretionary portfolio
management
-
-
-
-
-
-
-
-
- UCI
-
-
-
-
-
-
-
-
- Individual portfolio management
-
-
-
-
-
-
-
-
- Pension funds
-
-
-
-
-
-
-
-
TOTAL ASSET MANAGEMENT
FEES (A)
-
-
-
-
-
-
-
-
B. OTHER SERVICES
-
-
-
-
-
-
-
-
- Advisory services
-
-
-
-
-
-
-
-
- Other services
-
-
-
-
-
-
-
-
TOTAL FEES FOR OTHER
SERVICES (B)
-
5,243
-
-
559
-
-
147,262
-
-
153,065
-
Fee expenses for sales, distribution
and order intake
-
5,243
-
-
559
-
-
147,262
-
-
153,065
-
TOTAL FEES AND
COMMISSIONS (A+B)
-
5,243
-
-
559
-
-
147,262
-
-
153,065
-
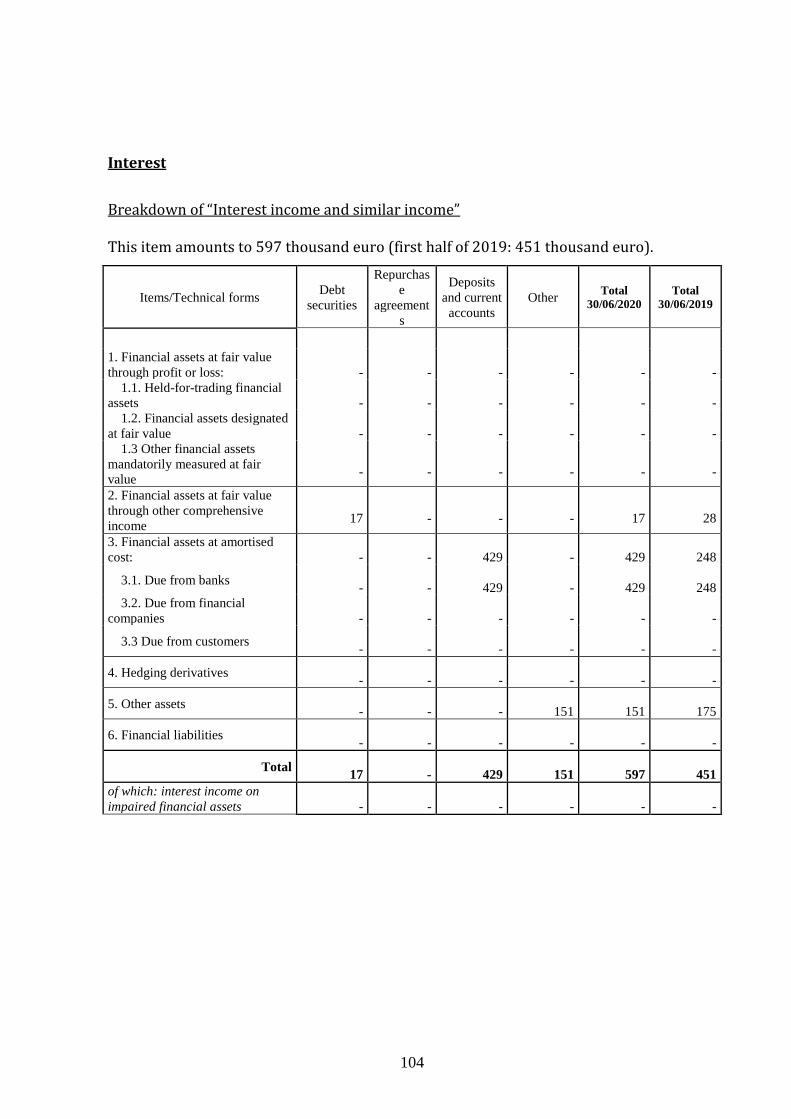
104
Interest
Breakdown of “Interest income and similar income” This item amounts to 597 thousand euro (first half of 2019: 451 thousand euro).
Items/Technical forms Debt
securities
Repurchas
e
agreement
s
Deposits
and current
accounts
Other Total
30/06/2020
Total
30/06/2019
1. Financial assets at fair value
through profit or loss:
-
-
-
-
-
-
1.1. Held-for-trading financial
assets
-
-
-
-
-
-
1.2. Financial assets designated
at fair value
-
-
-
-
-
-
1.3 Other financial assets
mandatorily measured at fair
value
-
-
-
-
-
-
2. Financial assets at fair value
through other comprehensive
income
17
-
-
-
17
28
3. Financial assets at amortised
cost:
-
-
429
-
429
248
3.1. Due from banks
-
-
429
-
429
248
3.2. Due from financial
companies
-
-
-
-
-
-
3.3 Due from customers
-
-
-
-
-
-
4. Hedging derivatives
-
-
-
-
-
-
5. Other assets
-
-
-
151
151
175
6. Financial liabilities
-
-
-
-
-
-
Total
17
-
429
151
597
451
of which: interest income on
impaired financial assets
-
-
-
-
-
-

105
Breakdown of “Interest expense and similar charges” This item amounts to 9,728 thousand euro (first half of 2019: 6,409 thousand euro).
Items/Technical forms Loan
s
Repurchas
e
agreement
s
Deposit
s and
current
account
s
Othe
r Total
30/06/2020
Total
30/06/2019
1. Financial liabilities at amortised cost 8,553 507 616 9,676 6,148
1.1. Payables 618 507 616 1,741 2,455
1.2. Outstanding securities 7,935 7,935 3,693
2. Held-for-trading financial liabilities
3. Financial liabilities measured at fair
value
4. Other liabilities 51 51 261
5. Hedging derivatives
6. Financial assets
Total 8,553 507 667 9,727 6,409

106
Profits (losses) on disposal or repurchase This item is a loss of 420 thousand euro (first half of 2019: a profit of 31 thousand euro).
Breakdown of “Profits (losses) on disposal or repurchase” Total 30/06/2020 Total 30/06/2019
Items/Income items Profit Loss Net
result Profit Loss
Net result
1. Financial assets
1.1 Financial assets at amortised cost:
- due from banks
- due from financial companies
- due from customers
1.2 Financial assets at fair value through other comprehensive income
- debt instruments -420 -420 31 31
- loans
1.3 Other financial assets
Total (1) -420 -420 31 31
2. Financial liabilities at amortised cost
2.1 Payables
2.2 Outstanding securities
Total (2) - -
Total (1+2) -420 -420 31 31
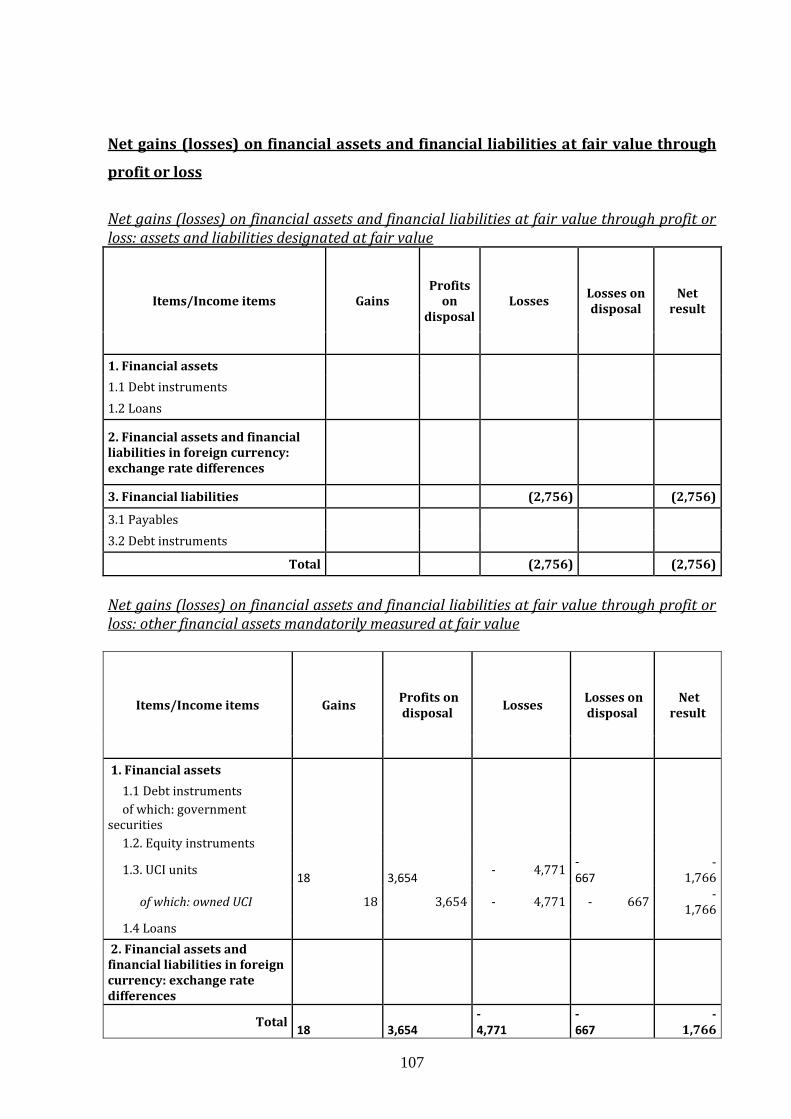
107
Net gains (losses) on financial assets and financial liabilities at fair value through
profit or loss
Net gains (losses) on financial assets and financial liabilities at fair value through profit or loss: assets and liabilities designated at fair value
Items/Income items Gains Profits
on disposal
Losses Losses on disposal
Net result
1. Financial assets
1.1 Debt instruments
1.2 Loans
2. Financial assets and financial liabilities in foreign currency: exchange rate differences
3. Financial liabilities (2,756) (2,756)
3.1 Payables
3.2 Debt instruments
Total (2,756) (2,756)
Net gains (losses) on financial assets and financial liabilities at fair value through profit or loss: other financial assets mandatorily measured at fair value
Items/Income items Gains Profits on
disposal Losses
Losses on disposal
Net result
1. Financial assets
1.1 Debt instruments
of which: government securities
1.2. Equity instruments
1.3. UCI units 18
3,654
- 4,771 - 667
- 1,766
of which: owned UCI 18 3,654 - 4,771 - 667 -
1,766
1.4 Loans
2. Financial assets and financial liabilities in foreign currency: exchange rate differences
Total 18
3,654
- 4,771
- 667
- 1,766
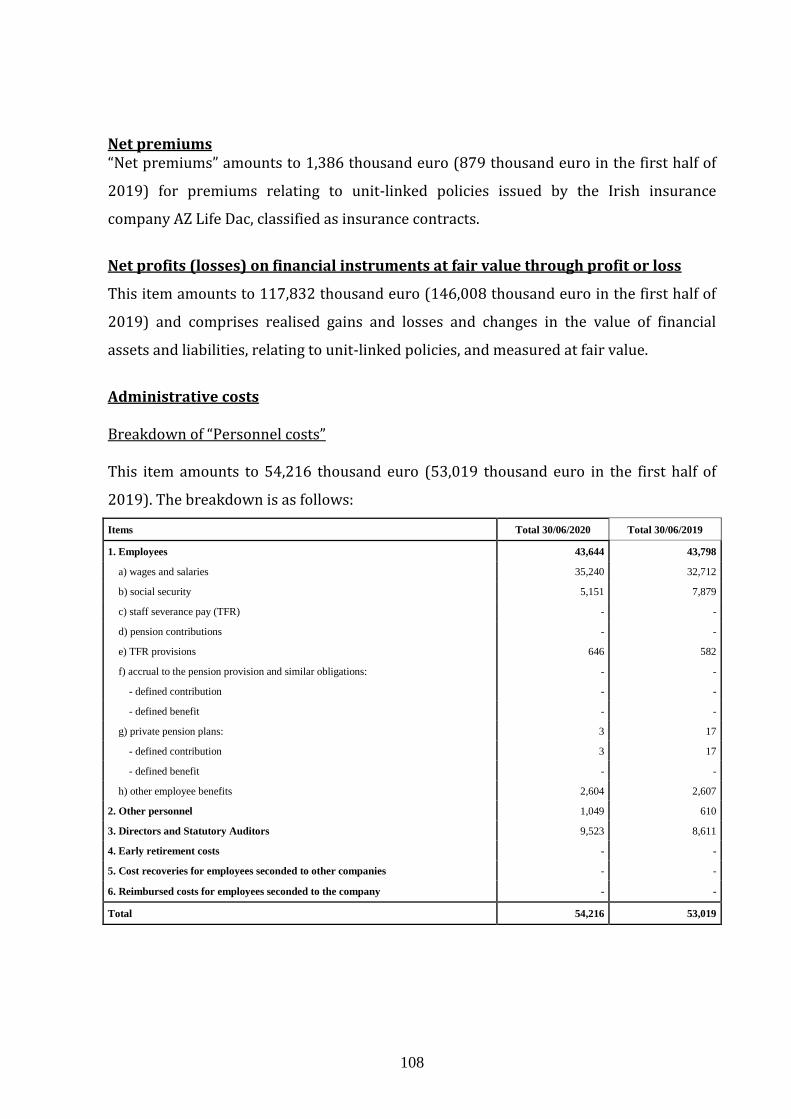
108
Net premiums “Net premiums” amounts to 1,386 thousand euro (879 thousand euro in the first half of
2019) for premiums relating to unit-linked policies issued by the Irish insurance
company AZ Life Dac, classified as insurance contracts.
Net profits (losses) on financial instruments at fair value through profit or loss
This item amounts to 117,832 thousand euro (146,008 thousand euro in the first half of
2019) and comprises realised gains and losses and changes in the value of financial
assets and liabilities, relating to unit-linked policies, and measured at fair value.
Administrative costs Breakdown of “Personnel costs” This item amounts to 54,216 thousand euro (53,019 thousand euro in the first half of
2019). The breakdown is as follows:
Items Total 30/06/2020 Total 30/06/2019
1. Employees 43,644 43,798
a) wages and salaries 35,240 32,712
b) social security 5,151 7,879
c) staff severance pay (TFR) - -
d) pension contributions - -
e) TFR provisions 646 582
f) accrual to the pension provision and similar obligations: - -
- defined contribution - -
- defined benefit - -
g) private pension plans: 3 17
- defined contribution 3 17
- defined benefit - -
h) other employee benefits 2,604 2,607
2. Other personnel 1,049 610
3. Directors and Statutory Auditors 9,523 8,611
4. Early retirement costs - -
5. Cost recoveries for employees seconded to other companies - -
6. Reimbursed costs for employees seconded to the company - -
Total 54,216 53,019

109
Average number of employees by category
30/06/2020 30/06/2019 2019
Managers 158 125 132
Middle managers 198 186 193
Other employees 698 681 717
Total 1,054 992 1,042
Breakdown of “Other administrative costs”
This item amounts to 70,131 thousand euro (67,751 thousand euro in the first half of
2019). The breakdown is as follows:
Items Total 30/06/2020 Total 30/06/2019
Professional services rendered 8,427 8,813
Advertising, promotion and marketing expenses 5,953 7,447
Telephone and fax 1,338 1,397
Lease and rent 808 1,162
Insurance premiums 938 634
Tax liabilities 978 1,193
Enasarco/Firr contributions 4,698 4,224
Lease and hire 7,596 6,934
Outsourced functions 22,668 22,284
Services other than IT services 6,447 4,535
Maintenance costs 688 629
Other administrative costs 9,593 8,500
Total 70,131 67,751
Net accruals to provisions for risks and charges
Breakdown of “Net accruals to provisions for risks and charges”
This item amounts to 4,705 thousand euro (3,575 thousand euro in the first half of 2019)
and includes the accrual to the supplementary indemnity provision for customers (4,457
thousand euro) and the net accrual to the provision for sundry risks and changes (248
thousand euro), related to risks for disputes with customers, as described in the note to
“Provisions for risks and charges” of Liabilities.
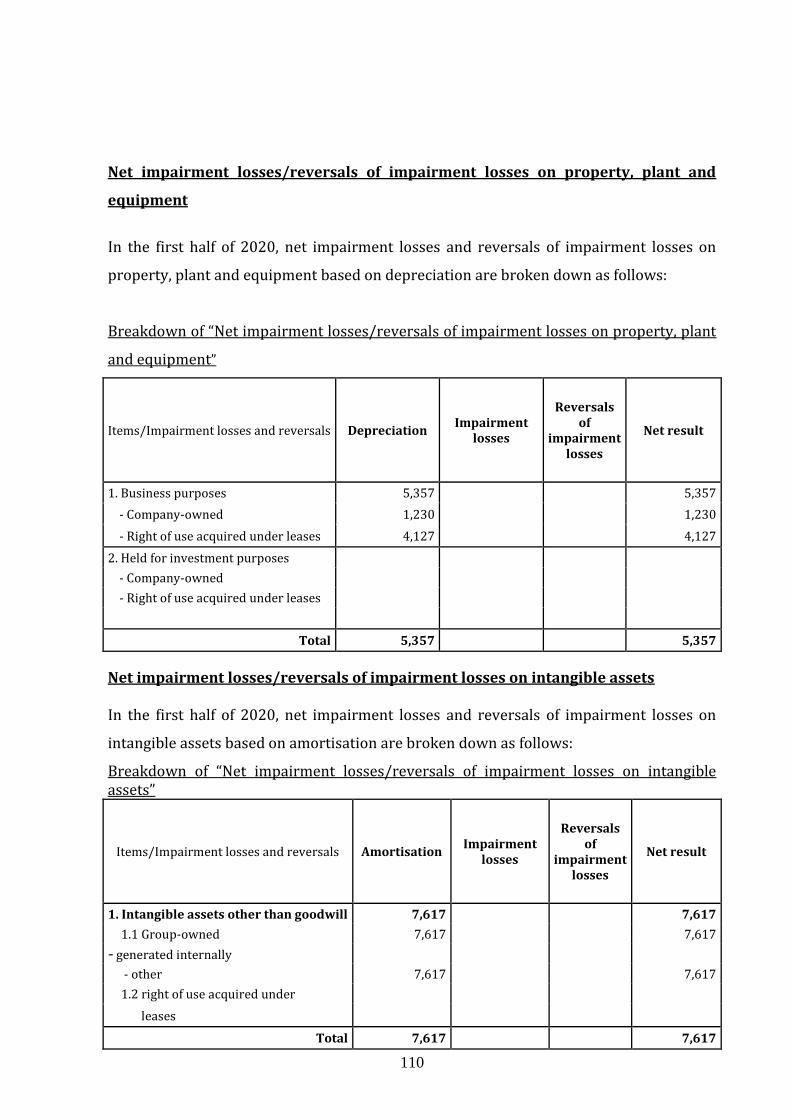
110
Net impairment losses/reversals of impairment losses on property, plant and
equipment
In the first half of 2020, net impairment losses and reversals of impairment losses on
property, plant and equipment based on depreciation are broken down as follows:
Breakdown of “Net impairment losses/reversals of impairment losses on property, plant
and equipment”
Items/Impairment losses and reversals Depreciation Impairment
losses
Reversals of
impairment losses
Net result
1. Business purposes 5,357
5,357
- Company-owned 1,230 1,230
- Right of use acquired under leases 4,127 4,127
2. Held for investment purposes
- Company-owned
- Right of use acquired under leases
Total 5,357 5,357
Net impairment losses/reversals of impairment losses on intangible assets In the first half of 2020, net impairment losses and reversals of impairment losses on
intangible assets based on amortisation are broken down as follows:
Breakdown of “Net impairment losses/reversals of impairment losses on intangible assets”
Items/Impairment losses and reversals Amortisation Impairment
losses
Reversals of
impairment losses
Net result
1. Intangible assets other than goodwill 7,617 7,617
1.1 Group-owned 7,617 7,617
- generated internally
- other 7,617 7,617
1.2 right of use acquired under
leases
Total 7,617 7,617

111
Income tax on profit from continuing operations Breakdown of “Income tax on profit from continuing operations”
Breakdown Total 30/06/2020 Total 30/06/2019
1. Current taxes 21,897 16,998
2. Changes in current taxes of previous years
3. Decrease in current taxes for the year
3.bis Decrease in current taxes for the year
due to tax credits pursuant to Italian Law No. 214/2011
4. Change in deferred tax assets 524 (774)
5. Change in deferred tax liabilities (3,762) (480)
Total 18,659 15,745
Current income taxes for the period mainly refer to IRAP and IRES paid by the Group’s
Italian companies, taxes payable by the foreign companies as well as the income from tax
consolidation amounting to the taxes receivable and due on taxable income transferred
to the parent company by the Group’s Italian subsidiaries that have adopted the tax
consolidation regime pursuant to Article 117 of Italian Presidential Decree 917/86.
Taxes for the Group’s foreign companies are calculated in accordance with the tax
regulations in force in the individual countries of residence.
“Change in deferred tax assets” includes the release of deferred tax assets on the amount
of the lease instalment deductible during the period and the recognition of deferred tax
assets on temporary differences resulting from the different timing criteria of IRES tax
deductibility.
The same item also includes the deferred tax liabilities on dividends to be paid by the
subsidiaries within the consolidation scope.
Profit (loss) for the period attributable to minority interests
This item is positive by 5,605 thousand euro (7,143 thousand in the first half of 2019). It
reflects the net balance of profits and losses attributable to minority interests in
consolidated companies.
112
Risks
FINANCIAL RISKS
As regards financial risks, the Group’s proprietary trading is exposed to market risks.
Moreover, the financial instruments in question are easily liquidated and are monitored
closely, most being mutual fund units managed by the Group companies. As for credit
risk, there are no specific problems given the nature of the corporate activity.
At 30 June 2020, the Group held only funds managed by Group companies in its
proprietary portfolio as part of liquidity management policies.
The financial risks associated with the use of liquidity refer to flexible mutual funds,
whose goal is the appreciation of capital by investing in the Eurozone in the equity, bond
and liquidity markets to the extent of UCIs managed by AZ Fund Management SA.
As regards financial risks linked to the investment held in Eskatos Multistrategy ILS
Fund, this UCI is an asset that is completely uncorrelated with the normal risks that
instruments usually present on the market are subject to.
As regards controls over financial management, the risk management function controls
the risk profile of the managed portfolio and provides the Investment Department with a
market risk assessment risk. Specifically, the assessment is performed by analysing the
portfolios of the individual funds and monitoring, on an on-going basis, the significant
risk factors identified, such as the average financial duration, exposure to various asset
classes and financial instruments, currency exposure and the credit rating of the issuers.
In general, the assessment of the portfolios’ risk profile is performed ex-post both in
absolute terms (volatility understood as the standard annual deviation) and in relative
terms compared to the benchmark (tracking error volatility). With regard to the ex-ante
assessment of the market risk, the risk management function uses external providers to
calculate the Value at Risk (VaR) of the managed portfolio. Where necessary, the VaR
represents the basis for the establishment of the limits within which the manager may
accept the risk. In addition, the risk management function monitors the development of
the risk models adopted and the return of the funds in relation to peers and the
benchmark, where disclosed.

113
OPERATIONAL RISKS This form of risk includes those that are typical of the various business operating
procedures.
In the broader framework of its own activities, the Risk Management function “maps out”
and monitors the risks, through specific analyses based on an internally-developed
model approved by the internal control and risk management committee. The operating
model applied associates an index which summarises the risk level, to each type of risk
identified, based on the combination of empirical findings, theoretical assessments and
interviews with operators. The results of the analyses are subsequently presented,
analysed and discussed with the internal control and risk management committee.
Where necessary, the latter takes the necessary measures in respect of the irregularities
identified.
Since the Company's incorporation, the losses arising from the above-mentioned
operational risks have never been significant.
With respect to operational risks arising from outsourced functions, when the relevant
contract was signed, the Company agreed the terms and conditions governing the
provision of the outsourced services and prepared specific service level agreements
whereby the outsourcer undertakes to provide its supplies at an appropriate qualitative
service level, allowing the Company to take action against the supplier in the event of any
economic losses arising from problems in the provision of services.
Another measure to ensure that services are performed correctly was the creation of an
Operating Committee, whose members come from both Azimut Capital Management SGR
S.p.A. and the supplier company, to establish the procedures, define the timescales, and
monitor the correct execution of all services provided. This Committee meets at least
once a month. Minutes are drawn after the meeting which are subsequently discussed
with the participants.
For further information on the main risks and uncertainties for the Group, reference
should be made to the consolidated financial statements at 31 December 2019.
For information about the risks arising from the impacts of Covid-19, reference should be
made to the Management Report.
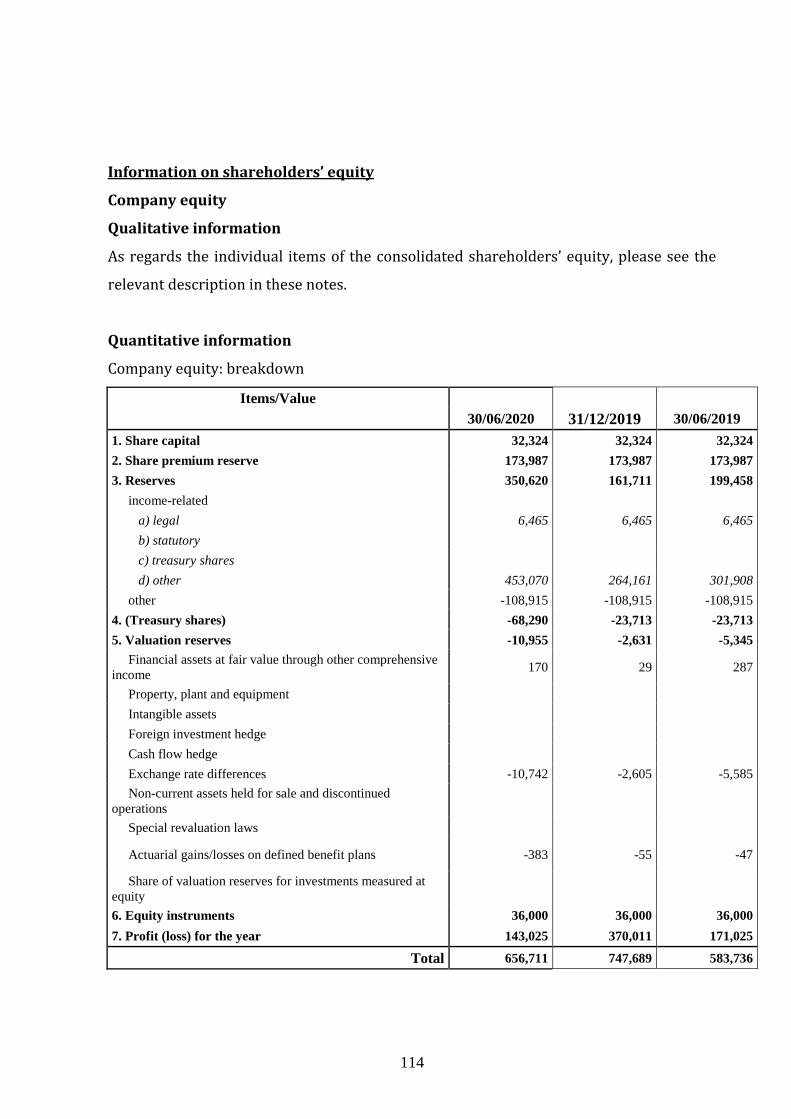
114
Information on shareholders’ equity
Company equity
Qualitative information
As regards the individual items of the consolidated shareholders’ equity, please see the
relevant description in these notes.
Quantitative information
Company equity: breakdown
Items/Value
30/06/2020 31/12/2019 30/06/2019
1. Share capital 32,324 32,324 32,324
2. Share premium reserve 173,987 173,987 173,987
3. Reserves 350,620 161,711 199,458
income-related
a) legal 6,465 6,465 6,465
b) statutory
c) treasury shares
d) other 453,070 264,161 301,908
other -108,915 -108,915 -108,915
4. (Treasury shares) -68,290 -23,713 -23,713
5. Valuation reserves -10,955 -2,631 -5,345
Financial assets at fair value through other comprehensive
income 170 29 287
Property, plant and equipment
Intangible assets
Foreign investment hedge
Cash flow hedge
Exchange rate differences -10,742 -2,605 -5,585
Non-current assets held for sale and discontinued
operations
Special revaluation laws
Actuarial gains/losses on defined benefit plans -383 -55 -47
Share of valuation reserves for investments measured at
equity
6. Equity instruments 36,000 36,000 36,000
7. Profit (loss) for the year 143,025 370,011 171,025
Total 656,711 747,689 583,736
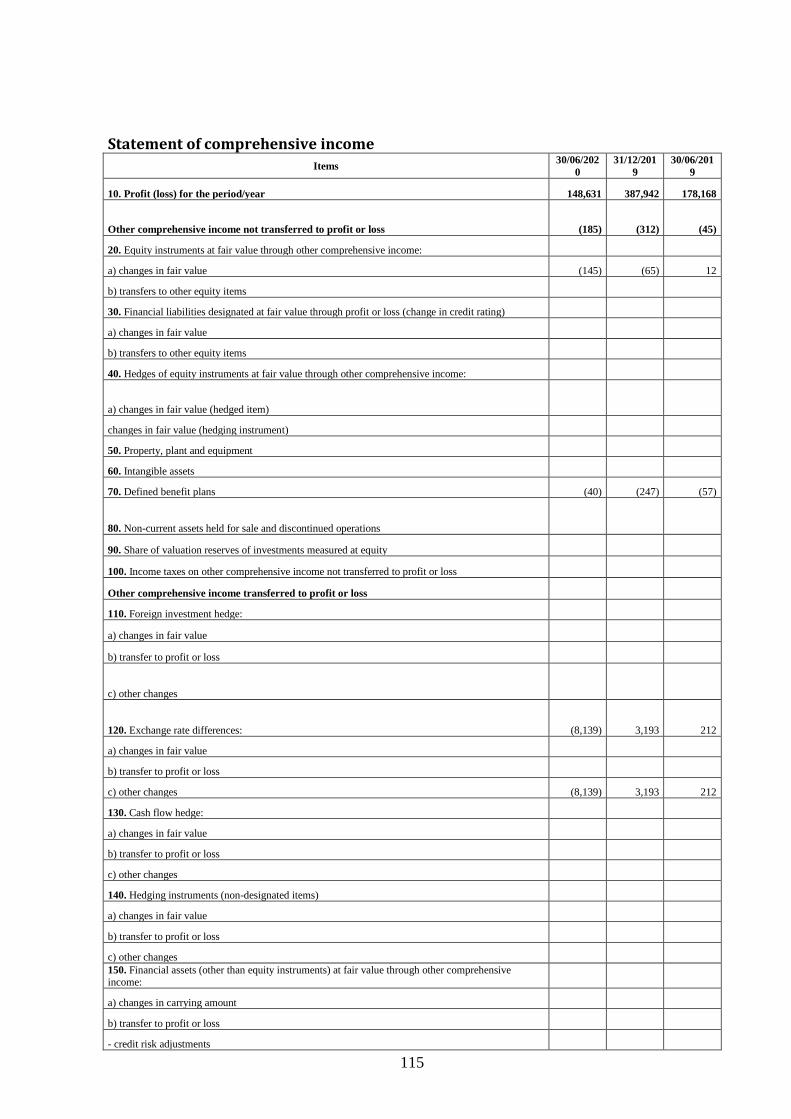
115
Statement of comprehensive income
Items 30/06/202
0
31/12/201
9
30/06/201
9
10. Profit (loss) for the period/year 148,631 387,942 178,168
Other comprehensive income not transferred to profit or loss (185) (312) (45)
20. Equity instruments at fair value through other comprehensive income:
a) changes in fair value (145) (65) 12
b) transfers to other equity items
30. Financial liabilities designated at fair value through profit or loss (change in credit rating)
a) changes in fair value
b) transfers to other equity items
40. Hedges of equity instruments at fair value through other comprehensive income:
a) changes in fair value (hedged item)
changes in fair value (hedging instrument)
50. Property, plant and equipment
60. Intangible assets
70. Defined benefit plans (40) (247) (57)
80. Non-current assets held for sale and discontinued operations
90. Share of valuation reserves of investments measured at equity
100. Income taxes on other comprehensive income not transferred to profit or loss
Other comprehensive income transferred to profit or loss
110. Foreign investment hedge:
a) changes in fair value
b) transfer to profit or loss
c) other changes
120. Exchange rate differences: (8,139) 3,193 212
a) changes in fair value
b) transfer to profit or loss
c) other changes (8,139) 3,193 212
130. Cash flow hedge:
a) changes in fair value
b) transfer to profit or loss
c) other changes
140. Hedging instruments (non-designated items)
a) changes in fair value
b) transfer to profit or loss
c) other changes
150. Financial assets (other than equity instruments) at fair value through other comprehensive income:
a) changes in carrying amount
b) transfer to profit or loss
- credit risk adjustments
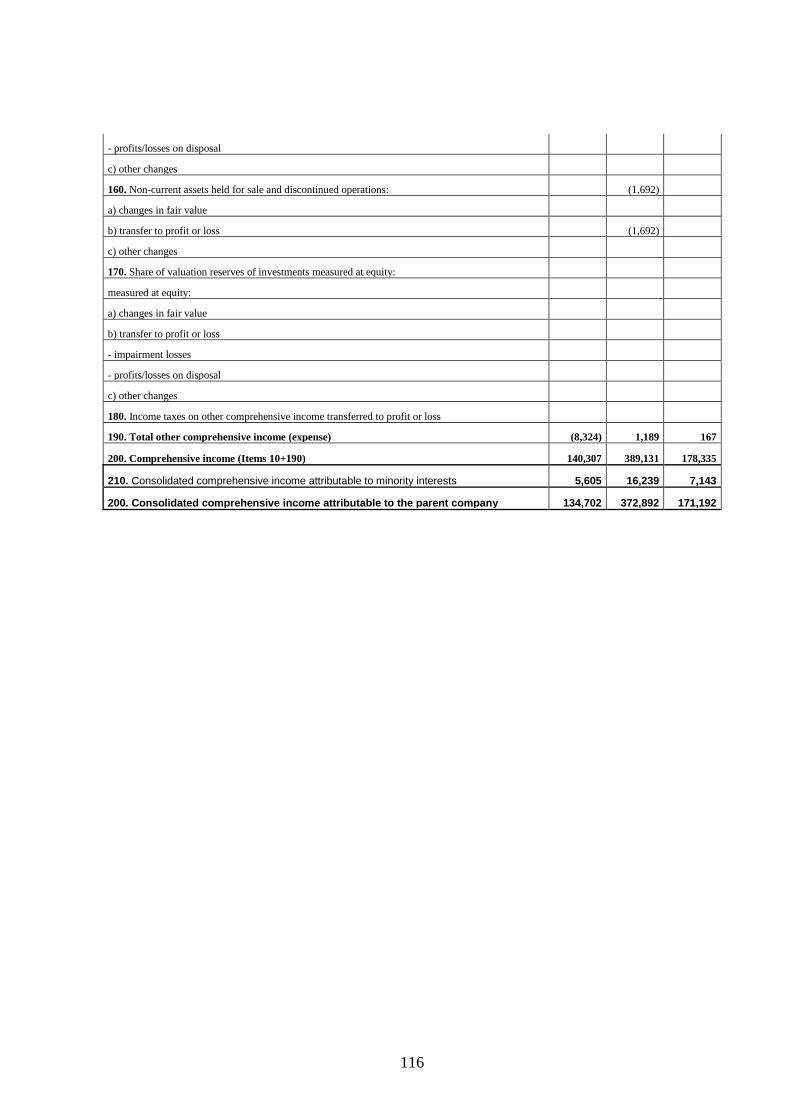
116
- profits/losses on disposal
c) other changes
160. Non-current assets held for sale and discontinued operations: (1,692)
a) changes in fair value
b) transfer to profit or loss (1,692)
c) other changes
170. Share of valuation reserves of investments measured at equity:
measured at equity:
a) changes in fair value
b) transfer to profit or loss
- impairment losses
- profits/losses on disposal
c) other changes
180. Income taxes on other comprehensive income transferred to profit or loss
190. Total other comprehensive income (expense) (8,324) 1,189 167
200. Comprehensive income (Items 10+190) 140,307 389,131 178,335
210. Consolidated comprehensive income attributable to minority interests 5,605 16,239 7,143
200. Consolidated comprehensive income attributable to the parent company 134,702 372,892 171,192
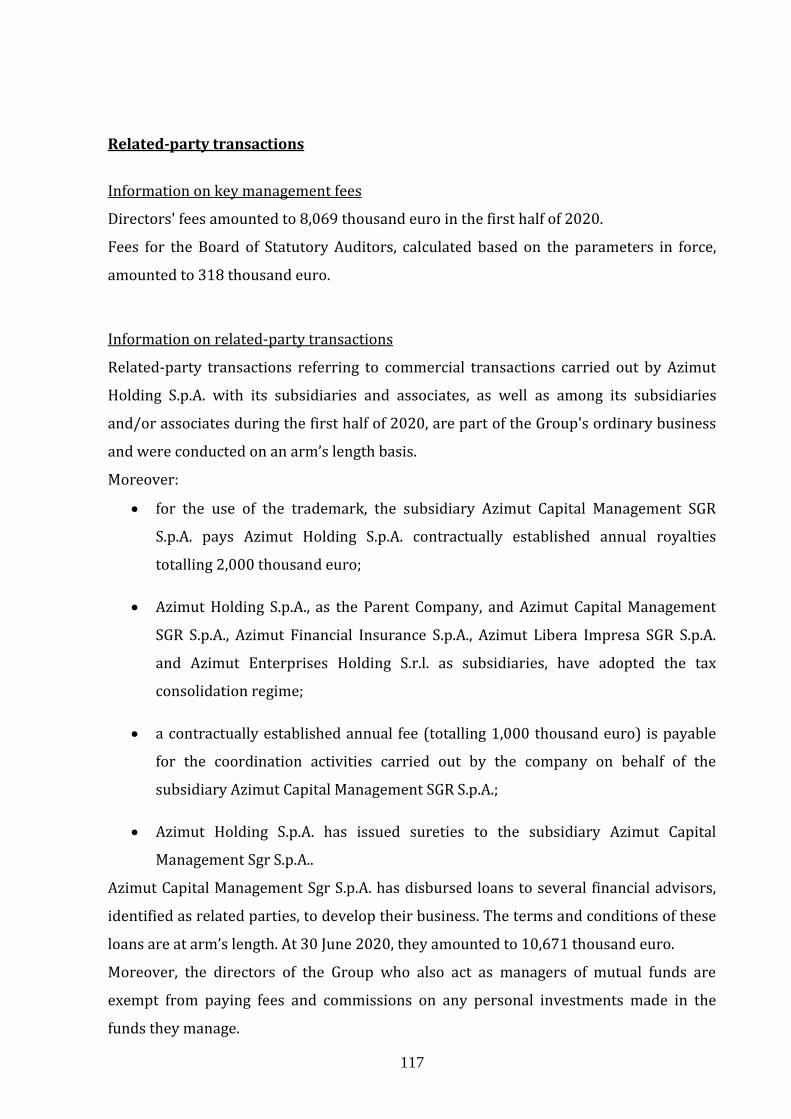
117
Related-party transactions
Information on key management fees
Directors' fees amounted to 8,069 thousand euro in the first half of 2020.
Fees for the Board of Statutory Auditors, calculated based on the parameters in force,
amounted to 318 thousand euro.
Information on related-party transactions
Related-party transactions referring to commercial transactions carried out by Azimut
Holding S.p.A. with its subsidiaries and associates, as well as among its subsidiaries
and/or associates during the first half of 2020, are part of the Group's ordinary business
and were conducted on an arm’s length basis.
Moreover:
• for the use of the trademark, the subsidiary Azimut Capital Management SGR
S.p.A. pays Azimut Holding S.p.A. contractually established annual royalties
totalling 2,000 thousand euro;
• Azimut Holding S.p.A., as the Parent Company, and Azimut Capital Management
SGR S.p.A., Azimut Financial Insurance S.p.A., Azimut Libera Impresa SGR S.p.A.
and Azimut Enterprises Holding S.r.l. as subsidiaries, have adopted the tax
consolidation regime;
• a contractually established annual fee (totalling 1,000 thousand euro) is payable
for the coordination activities carried out by the company on behalf of the
subsidiary Azimut Capital Management SGR S.p.A.;
• Azimut Holding S.p.A. has issued sureties to the subsidiary Azimut Capital
Management Sgr S.p.A..
Azimut Capital Management Sgr S.p.A. has disbursed loans to several financial advisors,
identified as related parties, to develop their business. The terms and conditions of these
loans are at arm’s length. At 30 June 2020, they amounted to 10,671 thousand euro.
Moreover, the directors of the Group who also act as managers of mutual funds are
exempt from paying fees and commissions on any personal investments made in the
funds they manage.
118
An annual fee calculated based on contractually established percentages is payable for
the Risk Management, Internal Audit, Compliance and Anti-money Laundering control
activities carried out by Azimut Capital Management SGR S.p.A in favour of Azimut
Holding S.p.A., Azimut Libera Impresa SGR S.p.A. and CGM Italia Sgr S.p.A.. The balance at
30 June 2020 is 253 thousand euro.
An annual fee calculated based on contractually established percentages is payable for
the IT/operation activities carried out by Azimut Capital Management SGR S.p.A. in
favour of AZ Fund Management Sa. The balance at 30 June 2020 is 4,545 thousand euro.
With respect to profit-participating financial instruments, in accordance with
Shareholders' resolutions, 4 key directors subscribed 180,000 instruments (paying the
corresponding amount), including the Chairman Pietro Giuliani (100,000), the Chief
Executive Officers Gabriele Blei (30,000), Paolo Martini (30,000) and Alessandro
Zambotti (20,000). As per the Shareholders' agreement related to Azimut Holding S.p.A.,
1.070 related parties subscribed a total of 1,158,401 profit-participating financial
instruments. At 30 June 2020, the Parent Company held 161,599 profit-participating
instruments.
.
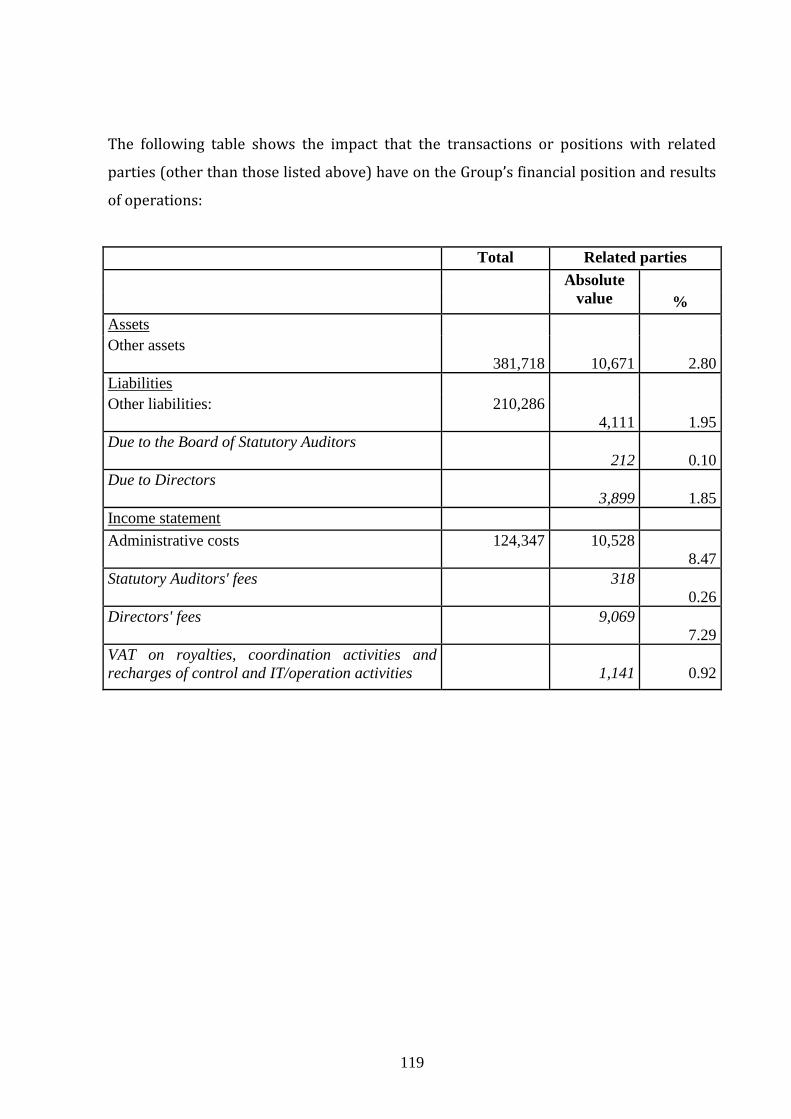
119
The following table shows the impact that the transactions or positions with related
parties (other than those listed above) have on the Group’s financial position and results
of operations:
Total Related parties
Absolute
value
%
Assets
Other assets
381,718
10,671
2.80
Liabilities
Other liabilities: 210,286
4,111
1.95
Due to the Board of Statutory Auditors
212
0.10
Due to Directors
3,899
1.85
Income statement
Administrative costs 124,347 10,528
8.47
Statutory Auditors' fees 318
0.26
Directors' fees 9,069
7.29
VAT on royalties, coordination activities and
recharges of control and IT/operation activities
1,141
0.92
120
Other information
Average number of financial advisors
In the first half of 2020, the average number of financial advisors amounted to 1797.
Dividends paid
The unit dividend for 2020 amounted to 1 euro per ordinary share and was paid in May
2020.
Significant non-recurring events and transactions
In the first half of 2020, the Azimut Group did not carry out non-recurring transactions
which have not already been disclosed in these notes.
There were no atypical and/or unusual transactions.
On behalf of the Board of Directors
Chief Executive Officer
(Gabriele Roberto Blei)

121
Certification of the condensed consolidated interim financial statements pursuant to article 154-bis of Italian Legislative Decree No. 58/98
1. The undersigned, Gabriele Roberto Blei, Chief Executive Officer, and Alessandro Zambotti, manager in charge of financial reporting of Azimut Holding S.p.A., hereby represent, having also taken into account the provisions of Article 154-bis, paragraphs 3 and 4 of Italian Legislative Decree No. 58 of 24 February 1998:
• the adequacy in view of the nature of the business and
• the effective application of the administrative and accounting procedures used for the preparation of the condensed consolidated interim financial statements for the first half of 2020. 2. The evaluation of the adequacy of the administrative and accounting procedures for the preparation of the condensed consolidated interim financial statements at 30 June 2020 is based on a system drafted by Azimut Holding, in accordance with the Internal Control – Integrated Framework model issued by the Committee of Sponsoring Organizations of the Treadway Commission, an internationally accepted reference framework. 3. The undersigned also represents that:
3.1. the condensed consolidated interim financial statements at 30 June 2020:
a) were prepared in accordance with the International Financial Reporting Standards endorsed by the European Commission pursuant to Regulation (EC) 1606/2002 of the European Parliament and Council, of 19 July 2002;
b) are consistent with the accounting books and records;
c) and provide a true and fair view of the financial position and results of operations of
the issuer and the companies included in its scope of consolidation.
3.2. The interim management report contains a reliable analysis of the references to important events during the first six months and their impact on the condensed consolidated interim financial statements, as well as a description of the key risks and uncertainties for the remaining six months of the year. The interim management report also includes a reliable analysis of significant related-party transactions.
Milan, 30 July 2020 Chief Executive Officer The Manager in charge of financial
reporting (Gabriele Roberto Blei) (Alessandro Zambotti)

REVIEW REPORT ON CONSOLIDATED INTERIM FINANCIAL REPORT AS OF 30 JUNE 2020 AZIMUT HOLDING SPA

REVIEW REPORT ON CONSOLIDATED INTERIM FINANCIAL REPORT AS OF 30 JUNE 2020 To the shareholders of Azimut Holding SpA Foreword We have reviewed the accompanying consolidated interim financial report of Azimut Holding SpA and its subsidiaries (the Azimut Holding Group) as at 30 June 2020, comprising the balance sheet, the income statement, the statement of comprehensive income, the statement of changes in shareholders’ equity, the cashflow statement and the related notes. The directors of Azimut Holding SpA are responsible for the preparation of the consolidated interim financial report in accordance with International Accounting Standard 34 applicable to interim financial reporting (IAS 34) as adopted by the European Union. Our responsibility is to express a conclusion on this consolidated interim financial report based on our review. Scope of review We conducted our work in accordance with the criteria for a review recommended by Consob in Resolution No. 10867 of 31 July 1997. A review of consolidated interim financial report consists of making enquiries, primarily of persons responsible for financial and accounting matters, and applying analytical and other review procedures. A review is substantially less in scope than a full-scope audit conducted in accordance with International Standards on Auditing (ISA Italia) and, consequently, does not enable us to obtain assurance that we would become aware of all significant matters that might be identified in an audit. Accordingly, we do not express an audit opinion on the consolidated interim financial report. Conclusion Based on our review, nothing has come to our attention that causes us to believe that the consolidated interim financial report of Azimut Holding Group as of 30 June 2020 is not prepared, in all material respects, in accordance with International Accounting Standard 34 applicable to interim financial reporting (IAS 34) as adopted by the European Union. Milan, 7 August 2020 PricewaterhouseCoopers SpA Signed by Lia Lucilla Turri (Partner) This report has been translated into English from the Italian original solely for the convenience of international readers


