MINUTES OF THE FIFTH ANNUAL MEETING OF THE ATLANTIC ZONAL MONITORING PROGRAM Crowne Plaza Hotel, Montreal 16-18 December 2002 Participants : Pepin, Pierre (Newfoundland/Chair) Harrison, Glen (Maritimes) Maillet, Gary (Newfoundland/Rapporteur) Mitchell, Michel (Maritimes/Rapporteur) Therriault, Jean-Claude (Quebec) Brian Petrie (Maritimes) Alain Gagné (Quebec) Drinkwater, Ken (Maritimes/Rapporteur) Harvey, Michel (Quebec/Rapporteur) Gregory, Doug (Maritimes) Gilbert, Denis (Quebec/Rapporteur) Chassé, Joël (Gulf/Maritimes) Ouellet, Patrick (Quebec) Spry, Jeff (Maritimes) Devine, Laure (Quebec) Narayanan, Savi (MEDS) Bernard Pelchat (Quebec) Couture, Estelle (MEDS) Cara-Lynn Schock (MEDS) Agenda 1. Introduction (P. Pepin) Welcome address Choice of rapporteurs Review of minutes of the last meeting Review and acceptance of the proposed agenda 2. AZMP General Status Report (2001-2002) Statistics of activities, success and failures, costs, problems and opportunities. Quebec (M. Harvey) Maritimes (M. Mitchell) Newfoundland (G. Maillet)
Transcript
MINUTES OF THE FIFTH ANNUAL MEETING OF THE ATLANTIC ZONAL MONITORING PROGRAM
Crowne Plaza Hotel, Montreal16-18 December 2002
Participants :
Pepin, Pierre (Newfoundland/Chair) Harrison, Glen (Maritimes)Maillet, Gary (Newfoundland/Rapporteur) Mitchell, Michel (Maritimes/Rapporteur)Therriault, Jean-Claude (Quebec) Brian Petrie (Maritimes)Alain Gagné (Quebec) Drinkwater, Ken (Maritimes/Rapporteur)Harvey, Michel (Quebec/Rapporteur) Gregory, Doug (Maritimes)Gilbert, Denis (Quebec/Rapporteur) Chassé, Joël (Gulf/Maritimes)Ouellet, Patrick (Quebec) Spry, Jeff (Maritimes)Devine, Laure (Quebec) Narayanan, Savi (MEDS)Bernard Pelchat (Quebec) Couture, Estelle (MEDS)
Cara-Lynn Schock (MEDS)
Agenda
1. Introduction (P. Pepin) Welcome address Choice of rapporteurs Review of minutes of the last meeting Review and acceptance of the proposed agenda
2. AZMP General Status Report (2001-2002)Statistics of activities, success and failures, costs, problems and opportunities. Quebec (M. Harvey) Maritimes (M. Mitchell) Newfoundland (G. Maillet) MEDS (S. Narayanan)
3. Data Management Report of the Subcommittee on Data Management – Implementation of
BIOCHEM and related data bases (S. Narayanan and regional representatives) Status of SST and SeaWiFS databases (D. Gregory)
4. AZMP Website Status of Website and flow of information (E. Couture ) Suggestions of additions or improvements (all members)
5. Data analysis and diffusion Issues raised at 2002 FOC meeting and at Fall Workshop on FOC-AZMP
integration (P. Ouellet / P. Pepin) – discussion of recommendations
AZMP Bulletin (J.-C. Therriault)
6. Logistics Statistics of sampling during the MFD cruises (J. Spry / M. Mitchell) Acquisition and replacement of equipment Oceanographic measurements on Maritimes MFD cruises (J. McRuer) Sample archive (G. Maillet / M. Mitchell)
7. Remote sensing Status of Quebec remote AZMP sensing project (P. Larouche) Status of SeaWiFS data products and availability (G. Harrison) Finding a replacement for 18 km JPL MCSST data set (B. Petrie)
8. Other issues SST and array scale results (B. Petrie/ J. Chasse) GOOS activities in the North Atlantic (G. Harrison) Nutrient Atlas for the Gulf of St. Lawrence (B. Petrie)
9. Preparing for a review of AZMP activities (P. Pepin)
Development of program to assess information content, assessing areas of weakness and information gaps (regional representatives).
10. Scientific Presentations Preliminary science results for 2002
Maritimes (J. Spry) Newfoundland (E. Colbourne & G. Maillet) Quebec (M. Gilbert, M. Starr & M. Harvey)
Physical oceanographic conditions in the Gulf of St. Lawrence in 2002 (Denis Gilbert and Caroline Lafleur).
State of phytoplankton in the Estuary and Gulf of St. Lawrence in 2002 (Michel Starr, Liliane St-Amand, Lyse Bérard-Theriault)
11. Other Business items Other business Next meeting
Executive summary
[1] General status reports from the regions indicate that sample analysis is well underway and that interpretation should be ready on time for the meeting of the Fisheries Oceanography Committee. However, there were important concerns about the availability of vessels to occupy the fixed stations on a regular basis and the logistic effort required to do so remains significant. Furthermore, the spring oceanographic survey of the Scotian Shelf had to be cancelled because of delays in completing the HUDSON refit. Although assistance was provided to survey the Halifax line, the lack of coordination in vessel availability is a critical problem plaguing the managers of the AZMP.
[2] The Subcommittee on Data Management identified effective approaches for the implementation of the BioChem database and related databases across all regions. A BioChem team was established immediately and will meet in February to identify the procedures for the national implementation and to identify the preliminary needs of end-users. AZMP cannot fund BioChem but perceives itself as an important client. National and regional database management issues must be harmonized for a variety of DFO programs, not only those relevant to AZMP.
[3] Development of the AZMP website is progressing well. The web site is mainly used to post the data collected, which is important but not sufficient. In order to meet the objective of showing more results, without increasing the workload of the scientists, MEDS suggested that the AZMP scientists provide figures and general descriptions to MEDS to be posted on the web as they prepare their yearly reports. In general, the flow of data from AZMP to MEDS is good and any problems are easily resolved.
[4] The feedback on last year's bulletin has been very positive, especially from higher management. It is felt to be a very useful product, good public relations for our managers and a good description of what AZMP does. J.-C. Therriault indicated he is willing to continue taking the lead on the Bulletin.
[5] The workshop on strategies to strengthen links between AZMP and the Stock Assessment Process was highly successful. Independently, three break-out groups reached the same general conclusions: (1) the current sampling program and variables collected by AZMP are considered essential and the level of sampling being carried out needs to be sustained, and (2) current indices are useful and custom data products need to be developed by collaboration between oceanographers (e.g., AZMP, FOC) and assessment people. In response to the recommendations by workshop participants, the AZMP identified a number of tasks to be undertaken during the current year: (1) Four gaps were clearly identified (macrozooplankton, gelatinous, benthos, fish larvae and juveniles) as well as poor sampling in some geographical areas (Strait of Belle Isle, Southern Newfoundland, nearshore). Members of the AZMP have been asked to investigate the resources and sampling required to meet these gaps. However, without additional resources (personnel and funds), it would be impossible to assume any
additional sampling; (2) A set of recommendations will be prepared for the directors for the development of a pilot project that would allow fisheries scientist to query a database to produce variations in the basic indices currently being provided on a routine basis by AZMP; (3) The recommendation to provide a primer on the physical oceanography of the zone was not considered truly an AZMP issue. Although there is a need for this sort of information, the development of a primer might be better dealt with through the state of the ecosystem report. The information does exist but it would require considerable time to compile in a coherent fashion. This might be a task for the Ocean Science Branch; (4) It was agreed that the lead in incorporating new environmental information into assessments should be through FOC. However, regional members of AZMP were tasked to identify data (samples and other information) that have not been processed as well as address specific issues that may be important to AZMP and assessment biologists. A set of recommendations will prepared for the directors about benefits and requirements needed to make those data available.
[6] There has been growing reluctance in some instances to carry out sampling for AZMP on some multispecies surveys. The question of how to sustain the current level of effort is an ongoing struggle. In an attempt to evaluate the effect of reducing the current sampling level on the advice provided by AZMP, a preliminary analysis of the temperature data for the Gulf of St. Lawrence was undertaken by researchers in the Maritimes region. The preliminary analysis revealed that large errors may occur in the estimated distribution of temperatures but these patterns may be the result of the analysis technique used so far. Further study will be needed, as well as the inclusion of other variables, before any firm conclusions can be reached.
[7] The logistics subcommittee identified the archiving of samples collected as part of AZMP as an issue reaching a critical point. There are currently limited facilities and personnel resources to properly archive, catalogue and maintain the collections. Long-term storage of samples was recognized as an issue that is not unique to AZMP. While acknowledging that the location for storing the samples needs to be dealt with at the regional level, the general issue of storage should be dealt with zonally or nationally.
[8] An important activity for AZMP during the coming year involves the undertaking of a 5 year review of the program. Two constraints were considered in developing the review: (1) This is an internal review, the external review having taken place as part of the FOC-AZMP workshop; and (2) The review should not involve an excessive increase in workloads. AZMP members identified a series of questions that would be addressed and assigned leads who would be responsible for the coordination of the response. Discussions with some of the Science Directors were used to identify issues which were critical to an effective assessment of the program. Six broad areas of assessment were identified: (1) Quality of the program relative to the original goals and international standards; (2) Efficiency of program management, personnel and resources; (3) Adequacy of current program in representing all regions/variables and evaluation of duplication of effort; (4) Effective use of platforms; (5) Flow of information to users; (6) Need for renewal of existing resources. The review is to be completed by the end of September.
Minutes of the Meeting (16-18 December)
Introduction
Welcome address
After a round table introduction, the Chairman (P. Pepin) welcomed the participants and pointed to the continued importance of this meeting in order to maintain a consistent and coordinated approach to the Atlantic Zone Monitoring Program (AZMP). The Chairman indicated that there was considerable work to be carried out during the course of the meeting, with particular emphasis being afforded to planning the five year review of AZMP activities as well as discussion of the results of the recent FOC-AZMP meeting in November.
Approval of the agenda
E. Couture proposed to merge the 10:20 AM item (AZMP General status report MEDS) with the 13:30 item (AZMP website).
Appointment of rapporteurs
The Chair had contacted participants prior to the meeting to act as rapporteurs for each half-day session. The following individuals kindly agreed to take on the task:
Monday AM Denis GilbertMonday PM Michel MitchelTuesday AM Ken DrinkwaterTuesday PM Gary MailletWednesday AM Michel Harvey
AZMP General status reports
Québec region (M. Harvey)
Highlights:
18 outings accomplished so far in 2002 at the Gaspé Current and the Anticosti Gyre fixed stations (1 long sampling gap of 2 months in February-March)
Two monitoring surveys along the six AZMP standard sections of the Gulf of St. Lawrence. One in spring (28 May-3 June) and other in fall (26 October – 5 November).
Chlorophyll, nutrients, zooplankton, and phytoplankton analysis are on time.
Discussion:
There were queries about the use of LTTMP information in the annual report. D. Gilbert indicated that the LTTMP is always incorporated in our report of AZMP activities. The data are also available on the OSL web site
There were also some concerns about whether the fall 2002 survey conducted by Quebec region had managed to sample the Cabot Strait transect because the earlier cruise from the Maritimes region had not been able to carry out full sampling because of severe weather conditions. Scientist from the Quebec region had been able to carry out the sampling of the transect.
Maritimes region (M. Mitchell)
Highlights (See Appendix I for further details):
Sampling was conducted at three fixed stations with a nominal interval of 2 weeks at all sites. Coverage at the Shediac Valley site is limited because of ice conditions.
A significant logistical effort is still required to sample the Shediac Valley Station largely due to its remote location. CCGS Opilio was plagued by frequent breakdowns during the field season: of the 13 planned Opilio trips, 13 had to be referred to the SAR boat.
Although we normally receive excellent cooperation from CCG personnel, we continue to miss on occasion opportunities to sample HL2 because of the low priority placed on Science activities by CCG.
Two dedicated AZMP cruises to sample the sections on the Scotian Shelf and Cabot Strait were scheduled for CCGS Hudson in 2002: one in April and one in October. The spring mission was cancelled because of major delays in completing the Hudson refit. Thanks to the efforts of CCG Operations personnel, CCGS Sir William Alexander was made available for us to survey the Halifax line.
Hydrographic and nutrient data (surface and bottom samples) were collected on the winter groundfish surveys on Georges Bank ( Feb.) and the Eastern Scotian Shelf (March), the July Scotian Shelf/Bay of Fundy groundfish survey, and the September southern Gulf of St.Lawrence groundfish survey. AZMP personnel participated in these 4 surveys. At a subset of these cruises' stations, zooplankton samples were also collected. In addition to this sampling, nutrient data were also collected on the February shrimp survey on the Eastern Scotian Shelf.
BIONESS was towed in Roseway and Emerald Basins and in the Gully to collect samples for estimates of zooplankton and krill during the Hudson October cruise. This survey contributes to the longest time series of Krill data we have for the Scotian Shelf. The data, initiated through the GLOBEC program in 1984, are of interest to address issues of species at risk (Right Whale). During the October mission, the BIONESS cable failed. Although it was possible to execute a temporarily repair to complete the survey, this 30-year cable needs to be replaced.
The BioChem database is running on the intranet. The development has been funded by multiple sources, including Maritimes region’s AZMP. The current release is version 7. All legacy data from Marine Chemistry as well as the zooplankton data from the standard AZMP sections and fixed sites have been loaded.
Discussion:
There were some questions about whether the ADCP/Acoustics monitoring program should be routinely reported on. While it is an AZMP-relevant activity, it is not funded by AZMP. There are many such data sets and it is not clear what we should do about them in terms of reporting.
There was discussion about the potential use of the MVP in other regions. It was pointed out that in the previous year there had been a plan to use the equipment in several regions, but it was cancelled due to lack of overtime money. Although the MVP does not measure nutrients, it provides a nice broad-scale picture that is complementary to the fixed stations data.
Newfoundland region (G. Maillet)
Highlights :
A total of 108, 109, and 92 oceanographic stations were sampled respectively during the spring, (April 20-May 5), summer (July12-28), and fall (November 7-22) 2002 surveys. Electronic measurements of temperature, salinity, chlorophyll and oxygen as a function of pressure were obtained over the full water column along the Southeast Grand Bank, Flemish Cap, Bonavista and the Funk Island standard AZMP sections. In addition, measurements were made further north along the standard White Bay, Seal Island, Makkovik Bank and Beachy Island sections during the summer survey.
A total of 49 temperature, salinity and conductivity profiles, 23 complete biological, chemical, and physical occupations, and 6 XBT profiles were collected at Station 27 from January-December, 2002.
A total of 265 net-mounted CTD profiles were conducted during the April 2002 multi-species bottom trawl survey in NAFO Division 3P. A total of 419 net-mounted CTD profiles were conducted during the April-June 2002 multi-species bottom trawl survey in NAFO Divisions 3LNO.
A total of 9 inshore thermographs were deployed and recovered during 2002 under the AZMP program with the assistance of various inshore fishers.
More frequent sampling of the coastal fixed station (Station 27) was achieved through the use of Ships of Opportunity (multi-species spring and fall surveys) in 2001-02 relative to 1999-2000 with the exception of the winter (Jan.-Mar.) period, due to frequency and intensity of storm activity and the lack of an appropriate vessel to conduct occupations. Cooperation of Multi-species Research Survey personnel has resulted in increased frequency of collection of all standard measures during spring and fall activities.
Timelines for processing of biological and chemical samples improving together with data transfers to MEDS.
Quality assurance program initiated in 2002 with full implementation anticipated during 2003.
B. Petrie asked about the length of the time series of ADCP data available in the region and whether the information was available in a database. Although all the information has been archived, it is not currently in a database format. There will likely be some PERD funding that will allow some progress in this area.
There were questions about whether station 27 is the only AZMP station where primary productivity measurements are done. J.-C. Therriault indicated that primary production is also measured at the Rimouski station, which is not part of AZMP but part of a research project. G. Harrison indicated that staff in his section at BIO could process chlorophyll and fluorescence profiles and compute primary productivity estimates from them for stations where primary productivity measurements are not performed.
It was unclear whether there is an LTTMP station on the St. John's site of the Avalon peninsula. The issue will be investigated. It should be noted that several of the thermograph sites labelled as AZMP were actually funded by the sentinel fisheries program.
General status report of Data Management (S. Narayanan / D. Gregory)
During the course of the year and in response to concerns among database managers, the Chair tasked the Subcomittee on Data Management (SDM) to undertake a review of the current state of databases of importance to the AZMP. After consultation, the following terms of reference were presented to SDM.
Terms of Reference (as provided Monday, April 29, 2002)
As part of the activities of the Atlantic Zonal Monitoring Program (AZMP), a proposal was put forth requesting that the Atlantic Zone undertake an assessment of the current practices dealing with data archiving and distribution, particularly as they relate to the BioChem database. To this end, the Scientific Steering Committee of AZMP held a conference call on 12 April 2002 to discuss the approach that is to be taken to address this concern. As a result, the Scientific Steering Committee requested that the Subcommittee on Data Management (SDM) address the following Terms of Reference:
1. The Subcommittee on Data Management is to identify effective approaches to the zonal implementation of the BioChem database and related databases (e.g. link with CTD databases) that will ensure maximum ease and transparency for users in terms of data entry, verification, editing and retrieval. The SDM is to consider issues dealing with proximity, accessibility and ease of technical support of the archival site(s) to the scientists responsible for the collection and quality control of the data as well as the most effective and seamless accessibility to both internal and external database clients. The SDM should recommend the various regional data responsibilities taking into account the different regional constraints/factors/clients.
2. The SDM is asked to analyze the financial and personnel requirements for the start up required to provide a zonally coordinated implementation and organization of biological and chemical data from within the Department into BioChem. The SDM is to consider the development of a front-end application as well as the migration of data collected as part of AZMP activities and other closely related data sets (e.g. Station Rimouski). The SDM is also asked to identify other potential data sets that may be beneficial to the activities of AZMP.
3. There are currently standard protocols for the collection and quality assurance of chemical and biological data collected as part of the Atlantic Zonal Monitoring Program (AZMP). The SDM is asked to define a common set of protocols for the quality control and assurance of chemical and biological data entered into a Zonal data archive. The SDM is to then request feedback from biologists and chemists concerning the scientific validity of the protocol(s).
4. The SDM is asked to investigate approaches to the distribution of data that would ensure that end users of the data will be clearly informed of the origin and responsibility centres which form the source of the data.
The SDM is to provide a written report to the Chair of the Scientific Steering Committee of AZMP for distribution and consideration by the Scientific Steering Committee.
Progress-to-date
Considerable discussions took place to address a way forward, not only for BioChem but for other applications that may potentially be made ‘national’. An option paper was prepared for discussion at the national Science Data Management workshop that was held in September 2002. This paper generated considerable interest and triggered strong responses from all regions. The main conclusions were:
Dealing with the data duplication issue is not feasible in the scenario of multiple archive databases. Task of identifying duplicates requires the data all to be in one place
Duplicate resolution issue will require good cooperation between data managers, regardless of the data architecture.
Resolving what to do about these duplicates will then depend on consensus from the data owners.
Two options that are very similar in most key elements are:
National BioChem – option 6 / BIO
Maintenance App licat ion Layer
DM # 6Edit tables
DM # 5Edit tables
BioChem Query
Maintenance App licat ion Layer
BioChemProduction Database
DM # 2Edit tables
DM # 1Edit tables
Maintenance App licat ion Layer
DM # 4Edit tables
DM # 3Edit tables
Maintenance App licat ion Layer
DM # 7Edit tables
Regional Oracle Server
Regional Oracle Server
Central Oracle Server
Regional Oracle Server
BioChemQuery Database
National BioChem – option 7 / IML
Regional Oracle Server
DM # 3 Edit Tables
Maintenance Application Layer
DM # 4 Edit Tables
Regional Oracle Server
DM # 5 Edit Tables
Maintenance Application Layer
DM # 6 Edit Tables
Central Oracle Server
DM # 1 Edit Tables
Maintenance Application Layer
DM # 2 Edit Tables
BIOCHEM Product ion Database
BIOCHEM Query Database
Custom Regional Query
DataBase
BIOCHEM Query(official entry point)
St. Lawrence Observatory (OSL)http:// www.osl.gc.ca
Partner site
Utilities, Matlab program, etc.
The Data Management Subgroup will meet in January to finalize the architecture.
It is to be understood that as we move into integrated data bases, it will be necessary to recognize that there will be increasing demand for expertise and funds to support them. Furthermore, there will be the necessity to identify a team with members from all regions to address promptly and in a consensual manner any issues that may come up. It is suggested that:
A BioChem team be established immediately. The regional managers need to identify the individuals for the team and give them the mandate and support. It is very important not to put them in a situation where they will be forced to choose between their commitment to BioChem and to the team members, and the needs of their immediate supervisor.
negotiations with IM/TS be started to establish a service level agreement to define the IM/TS role compared to the regional roles. It is essential that we define what level of application software support we get from IM/TS and what we get from regional developments.
Actions be taken as soon as possible to "ensure all data checks and loads use a consistent set of business rules", to set standards and sort out duplicates.
Further define the options at technical and workplan levels.
MEDS has identified the funds to kick-start the process this fiscal year. The Data Management Subgroup will look at options for funding, such the Investment management Board (IMB) and Geoconnections funds.
Details surrounding the options being considered for the implementation of BIOCHEM can be found in Appendices II and III.
Discussion:
Q: How will we choose among the various available options?A: The general feeling is that the first 4 options from MarketAccess were discarded. Options 5 & 6 from BIO and option 7 from IML are variations along the same theme and can probably be implemented.
Q: Why is the duplicates checking problem different for BIOCHEM and the T/S data sets of the CLIMATE database? A: There is a potential duplicates checking problem with T/S data as well but the problem is more complex with chemical and biological data because the standards set by one individual are the same as for another. This can lead to several observations of the same variables at one location but with different values. Users of the database need to be made aware of the problem.
Q: How do we deal with duplicates at the international level?A: This is a burning issue at the international level as well.
This point was followed by a long discussion on how to deal with duplicates. Decisions need to be made about whether several versions of the dataset are kept in the system, or else a single best-shot version of the dataset should be kept in the official database. This is an issue that will be part of the work to be done in the implementation workshops.
The Chair commented that AZMP cannot fund BIOCHEM, but perceives itself as an important client of BIOCHEM. Biological and chemical data management is an important priority all across the country. The Director of MEDS commented that there should be a meeting at BIO in January to look into this further. National and regional database management issues must be harmonized for a variety of DFO programs, not only those relevant to AZMP.
It was pointed out that the production of a zonal database that holds a consistent data set with comparable QC/QA checks is a key outcome to be delivered by AZMP. AZMP must take a lead in promoting the development of such a database (e.g. BIOCHEM) and providing input on how to deal with duplicates and data flow issues.
Q: There was an indication that BIOCHEM will provide hooks to CTD casts collected at the same time/locations as the biochemical data. Will BIOCHEM also provide a hook to ADCP/acoustics data?A: No, not at the moment.
ZMP Data Management Report - Maritimes Region
A. BioChem
The BIOCHEM project is currently under review with the objective of making the system more accessible to other regions within the department. A MEDS initiated study by MarketAccess suggested 4 options. Maritimes responded with two additional options. Québec and Pacific have also submitted options. The two options from Maritimes and one from Québec are all very similar. The next stage in the process will be to adopt a strategy based on the options, transfer ownership to MEDS, and proceed with development.
In the meantime, Maritimes region is continuing with a previously scheduled development program on version 7. Any planned enhancements dealing with improved accessibility or security for data managers outside the region have been deferred pending future decisions on BioChem.
The Maritimes system has 35 users running 342 queries since last year’s release of version 6.
A.1 BioChem Maritimes Software Development
Maritimes Science has allocated 100 days development time to BIOCHEM as part of our 2001/2002 service agreement. Modifications are planned to the query application to improve the usefulness of the resulting files and simplify the selection of parameters, species and search areas. A major part of the effort will be towards defining user requirements for duplicate checking and data validation. We hope to prepare a set of specifications and recommendations for whoever the new steering group turns out to be. M. Kennedy will investigate the requirements for implementing the BCPROFILES and BCCONTINUOUS tables in support of ZMP programs.
A.2 BioChem Data Loading
ZMP Discrete and Plankton
Biological Ocean Science (M. Kennedy) has assumed responsibility for loading all ZMP related data (including MFD cruises) into BIOCHEM. Previously we had split this effort between MEDS and BOS based on discrete and plankton data types. All data available to date (except secchi and phytoplankton counts) have been loaded into BIOCHEM. The phytoplankton data will be appended as soon as species names have been mapped to the taxonomic code table.
MESD Discrete data
MESD has completed loading all of the outstanding updates from MEDS. Due to last year’s concern over data ownership, MEDS is no longer sending MESD discrete data updates from Canadian waters as they do with the hydrographic data. MESD will likely carry out another update based on the WOD2001 database, but at this point we have no mechanism to obtain and load international data within Canadian waters. BOS Plankton
The majority of the current biological data acquisition falls under the ZMP program. Recent work has started on loading bacteria count data from Bill Li.
The database presently contains 56,000 biological tows and 468,000 discrete profiles.
B. SST Database
Last year we reported NOAA had stopped providing the MCSST 18 km. weekly composite product as of January 2001. NOAA recently started to provide a similar product based on the same source data but using an algorithm called Pathfinder. We had previously (Feb/2000) carried out a preliminary evaluation of Pathfinder data but NOAA stopped providing the product. Pathfinder data are available for 1985 – 1990, 1993 and 1995 – present. There appears to be a problem with 1991, 1992 and 1994.
With the NOAA decision to again support Pathfinder and not continue with MCSST, we have started to acquire the NOAA data and load it into the SST database. The data are
treated as a new data source and users can limit their queries to either MCSST or Pathfinder. So far NOAA seems to be providing Pathfinder data in a more timely fashion than they did with MCSST. Data are currently available to September 2002.
The Pathfinder product is also a weekly composite, but on a 9-km. grid. The algorithm also has a much higher recovery rate, particularly in northern latitudes. Based on a very preliminary look and 1989 and 1990, file sizes are 8 times the old MCSST product. The increased resolution only accounts for a 4-fold increase. This suggests a doubling of the data recovery rate over the entire area.
The complete Pathfinder database should be available in early January, 2003. All V4.1 data are presently available. (1985-1999).
Pathfinder Details
Source data is based on 9 km, 8 day ascending "all SST" version 4.1 and 4.1 interim (which includes quality flag and number of observations in average). NOAA provides recent data as V4.1 interim and at some point replaces these with V4.1 final.
Data will be extracted for the "AFAP" area and filtered to include data quality flags 4-7 only.
The present data available are V4.1 for 1985-1990, 1993, 1995 -1999 and V4.1 interim for 2000-2002
We will not load the version 4.0 data for 1991-92 and 1994. We are trying to present an authenticated product and we should not mix data.
The database will be modified to keep the quality flag, but we won't be able to query on quality until next year (or find the funds to get Informatics to do it this year)
We will keep the V4.1 and V4.1 interim as separate datatypes. Users can still query both simultaneously, but it will make identification and updating of the V4.1 as it becomes available much easier
C. Other Databases
Climate Database
Updates are done on a monthly basis. About 13,000 new profiles were added this year compared to over 50,000 last year. Last year’s large number was the result of a major data rescue effort within the Department. The application performed 900+ queries by 70+
users during 2002.
SeaWiFS Database
An Ocean Color Database (OCDB) was created by Informatics this past year as a SST clone. It is intended to house SeaWiFS data based on the 1.5 km biweekly composite. It
has been tested with a sample dataset, but loading will not begin until BOS completes its recalculation. Work should start this fiscal year, but we don’t have a timetable as yet.
Coastal Temperature Database
CTS became operational in September 2001. Since then there have been 200 queries from 31 users. We currently have a backlog of 2000/2001 data from Newfoundland and recently received 150 deployments from 1995-2001 from Gulf Lobster section. We have not added any data from IML since 1999. A near-surface inshore temperature climatology based on the database and sub-divided into NAFO areas was posted in October/2001. (http://www.mar.dfo-mpo.gc.ca/science/ocean/coastal_temperature/coastal_temperature.html)
Discussion:
Q There was discussion about replacing the 18 km database with a 9 km database. Do they cover the same time periods, i.e. back to 1981?A We will not be replacing the 18 km product, but adding a new 9 km product.
Q Does the MCSST or Pathfinder data have more stringent criteria for rejecting data influenced by clouds?A Pathfinder is less stringent. In many cases, you get nothing with MCSST, but you get some data from Pathfinder.
MEDS activities and AZMP Web Site (E. Couture)
Web Site
The developments on the web site include:
A page with a list of AZMP publications with links to the Canadian Stock Assessment Secretariat where many of these publications are available. The list was copied from the AZMP bulletin of 2001.
New tools to get easier access to the prepackaged hydrographic data. MEDS is currently developing a web application to select and download AZMP data
(fixed stations and sections only) dynamically. If the user requests continuous data, the data will be delivered through email notification that data may be picked up from an ftp server. If the user requests discrete data, the user may select whether the delivery will be the same as above or be downloaded directly from the web browser.
The tides and water level pages have been improved for more clarity and new information has been posted such as monthly means and air pressure data for some stations.
New tide products have been developed such as annual means, de-tided series and tidal residual analyses.
All climate indices were updated following Roger Pettipas's submission of last year's data.
Items not delivered are:
Phytoplankton data Zooplankton abundance graphs Descriptions of climate indices Additional indices
The web site is an important part of the programme since it provides visibility to the outside world and it is our opportunity to promote our good work. At this moment, the web site still does not meet the objectives of giving an overview of the programme and showing the main results. The web site is mainly used to post the data collected, which is very important but not sufficient. In order to meet the objective of showing more results, without increasing the workload of the scientists, MEDS suggested that the AZMP scientists provide figures and general descriptions to MEDS to be posted on the web as they prepare their yearly reports. The figures may be simply extracted from the reports.
Data Flow Highlights
From IML:
Igoss data**: flowing very well, very few delays CTD data: MEDS has approximately half of the CTD data collected in 2002 Discrete data: Flowing very well, MEDS has all the 2001 and most of the 2002 data
From NAFC:
Igoss data**: 40 occupations of Station 27 were reported for 2002 and MEDS has data for 29 occupations. 19 out of 29 were sent in the expected time frame.
CTD data: MEDS has no CTD data collected in 2002. There is only one submission per year of all CTD data, which occurs in the spring for the data from the previous year.
Discrete data: Flowing well, MEDS has all the 2001 and all the data for the first half of 2002.
From BIO:
Igoss data**: the data flow seems to have slowed down from previous years especially from Station 2. MEDS has not received data from station 2 since July 2002. 15 occupations for Shediac were reported and MEDS has data for 2 occupations.
CTD data: Same comment as above except for Prince 5 where MEDS usually the full calibrated CTD data within a couple days of collection directly from St-Andrews.
Discrete data: MEDS has all the 2001 and none for 2002. The slow down is most likely attributed to a change in nutrient data flow protocols. Instead of being submitted to MEDS directly by Jeff, it goes through BIOCHEM to avoid duplication.
** Igoss data is low resolution profile extracted from CTD profiles at inflection points or selected depths. The data must be sent to MEDS within 30 days of collection in order to be distributed on the Global Telecommunication System (GTS) and meet the real-time requirements of the international community.
Discussion :
It was noted that the MEDS box for the Gaspé Current station includes sampling done by a local museum at a site that is not the Gaspé Current station: this is why there appears to be a larger number of visits to the station than reported by IML. It was agreed that MEDS should report only on the actual station data to ensure consistency.
G. Harrison indicated other related links could be added to the web page.
ACTION: G. Harrison will send to Estelle a list of links.
At the November FOC/AZMP meeting it was suggested a "primer" be added to the web page. It was suggested that much of this material will be included in the bulletin and perhaps the bulletin should be on the main AZMP web page. The issue will be discussed during the summary presentation of the November FOC/AZMP workshop.
The climate indices are up to date and should be updated on the web page.
4 action items from last year's meeting have not been completed and should be given some priority and time frame:
Action item Lead Time frame1. List of new indices D. Gilbert2. Description of indices E. Colbourne
K. DrinkwaterEnd of February
3. Plot of zooplankton abundance J. SpryM. HarveyP. Pepin
Early after FOC meeting
4 Phytoplankton data J. SpryM. StarrG. Maillet
Early after FOC meetin
A significant amount of zooplankton data has been analyzed to date such that interesting trends are beginning to become apparent. These data should be displayed on the web site with a brief explanation.
Concern was expressed as to the absence of the Gulf region from the AZMP web site. D. Gregory indicated that there are physical data sets from the Gulf that could be included. The groundfish survey data are channelled through BIO and therefore the Gulf region does not get recognition for this effort.
D. Gregory suggested that a better job could be done in enabling users to find the data they seek. In general, every project has a distinct web page through which data sets are described and made available. It is very confusing and challenging for clients accessing the DFO sites to obtain specific data. D. Gregory suggested that the AZMP site should perhaps be a "porthole" for all Atlantic zone data. This should be more than a series of links; more in line with a query tool that would lead clients to the locations of the desired data set. S. Narayanan pointed out that a broad query tool is not a simple task and would be beyond the scope of AZMP. It may be possible to produce a 2-3 level porthole that would allow clients to quickly focus on the data that are available and then access the specific query tools. The porthole would not provide the data, but would rather channel the user to the relevant database and data query tools. A map to focus the users on the region of interest might be a good starting point.
ACTION: Data managers to send E. Couture a list of databases they have available and cc to C. Schock.
Data Analysis and Diffusion (J.C. Therriault)
J.-C. Therriault presented the draft of the latest bulletin and requested that any suggestion/correction be sent to him immediately. Authors were asked to review their articles.
J.-C. Therriault requested suggestions for titles of article for next year's bulletin. Articles on Labrador Sea Climate as well as the SEAMAP projects would be appropriate.
The feedback on last year's bulletin has been very positive, especially from higher management. It is felt to be a very useful product, good public relations for our managers and a good description of what AZMP does. J.-C. Therriault indicated he is willing to continue taking the lead on the Bulletin. At this stage we should continue to produce a yearly edition.
The major difficulties are the figures. Contributors are requested to use appropriate graphics software to generate figures in proper formats. EPS files are ideal.
Fall Workshop on strategies for strengthening the link between the Atlantic Zone Monitoring Program (AZMP) and stock assessment (P. Ouellet)
The workshop was co-sponsored by the Fisheries Oceanography Committee (FOC) and the Atlantic Zone Monitoring Program (AZMP) of the Department of Fisheries and Oceans and was attended by fisheries assessment biologists and oceanographers. Its
principal objectives were to discuss how stock assessment might benefit from ecosystem information and in particular to identify data products from the AZMP that could improve our capability to foresee and to understand the causes of variation in the distribution, abundance, and productivity of fish and shellfish resources. The agenda consisted of an initial day of overview presentations on the topics of AZMP, the stock assessment process, environment-fish relationships in the Atlantic Zone, and experiences from the two external participants, Dr. K. Brander from the ICES GLOBEC Office and Dr. B. Mackenzie from the Danish Institute for Fisheries Research. During the second day, the participants divided into three break-out groups to address specific questions concerning stock and regional needs for environmental information within the stock assessment process and how to improve exchange and communication between scientists involved in the AZMP, the FOC, and stock assessments. The final day was in plenary session to discuss the findings of the break-out groups and to develop recommendations.
Overview presentations
P. Pepin (Chair of AZMP) opened the first day with an overview of the goal, the activities and the data products of the AZMP. This was followed by a presentation on the stock assessment process and how (or where) environmental information could be used in the exercise. Briefly, the stock assessment process was divided into three separate parts: (a) evaluation of stock size, (b) prediction of yield, and (c) understanding the mechanisms. Environmental information could potentially be useful for all parts. While the effects of the environment on catchability could potentially help part (a), it was suggested that environmental information would probably be most useful in addressing the last two parts, especially in association with longer-term predictions for fish stocks as is being done within ICES. Environmental information was seen as being most important if it could be used to imply changes in productivity regimes (i.e., regime shifts). Environmental information is presently used in a qualitative manner for a number of stocks, but there is little quantitative use of environmental data in stock assessments. This is for several reasons. First, although there have been several statistical relationships between the environment and population parameters, these usually were obtained through exploratory correlation analysis and often do not hold when further data are obtained. Second, the assessment models have not been designed to easily incorporate environmental information. The workshop participants felt that it is important to continue research directed towards uncovering relationships between the environment and population characteristics and to attempt to understand the mechanisms involved. An important point is to examine, where possible, the relative importance of the environment compared to other potential controlling factors. This can be done progressively, but progress might be quicker if we adopt a systematic approach and a sustained collaborative effort that incorporated long-term monitoring (i.e., AZMP) and short-term process studies to test hypotheses.
The use of numerical models was recognized as a potentially valuable tool in helping define key variables or processes and to provide environmental indices for stock assessments. Numerical methods include hydrodynamic/physical models, biophysical models, and data assimilation. Biophysical models can provide information on the major
components of the food web, i.e., phytoplankton, zooplankton, invertebrates, and fishes. Plankton-Zooplankton-Nutrients-Detritus (PZND) models are useful to simulate the lower trophic interactions of the food web. Early Life Stage (ELS) models and Individual Based Models (IBM) are used to better understand the effect of the environment on the growth, drift, mortality, survival and retention of eggs and larvae of fishes and invertebrates. Monitoring programs such as the AZMP provide necessary information for model initialization and validation.
There is also a need for programs that involve iterative communication among oceanographers and biologists, and among data collectors and modellers, throughout the Atlantic Zone that will help to test old hypotheses, generate new hypotheses, and identify data requirements.
Break-out group reports
Following the first day presentations, the participants were divided on the basis of their specific current activities in three groups: two were to consider issues related to finfish and one group on invertebrate stocks/populations. Each group was asked to discuss the following questions:
A) What environmental information or indices to you think are most important (effects on natural mortality, distribution, growth, production, recruitment, catchability, etc.) to assess the state (present and future) of finfish and invertebrate populations? These can be either a stock-specific index based upon personal knowledge or of a general nature.
B) What analysis or techniques should be carried out to elucidate the relationships between finfish or invertebrate stocks and the environment? Should there be a concerted effort to do this and if so, how and by whom (leave it to individual researchers, FOC, Regional Working Groups, etc.)?
C) Is there relevant environmental information important for fish and invertebrate stocks that is not currently being measured or made available from AZMP or other sources? If so, what recommendations would you make to correct the situation?
D) If the environmental information is or becomes available, how can it best be incorporated into the stock assessment process? Who should lead this work?
E) What recommendations would you make to increase exchanges and collaborations among people dealing with environmental issues and those involved with stock assessments?
Independently, all three break-out groups reached the same general conclusions: (1) the generic indices currently produced by AZMP are considered useful and need to be continued, and (2) custom data products need to be developed by collaboration between
oceanographers (e.g., AZMP, FOC) and assessment people. Here is a summary of the groups’ answer to the each question:
A) It was deemed that the reviews of environment and fish interactions in the Atlantic Zone presented on day 1 described adequately what information or indices are the most important. However, additional products could also be useful, such as:
Indices of primary and secondary production;
Benthos production;
Data on macrozooplankton and ichthyoplankton;
Advection/retention indices;
Salinity;
Oxygen and nutrients concentrations.
It was also recognized that some geographic areas are not well sampled by the current monitoring program:
Near-shore zone;
Strait of Belle Isle;
Southern Newfoundland.
B) There was a consensus that the type of analysis strongly depend on the question or process investigated. Nonetheless, a common answer was that biophysical modeling should be more used. The improvement of drift models, however, will require more information on vertical and horizontal distribution of plankton. A large signal-to-noise ratio is needed to detect environmental influences and retrospective analyses (time series–event analysis) were encouraged. A primer on oceanography and the description of the indices as well as information on their representativeness, quality, etc. are also needed. It was also recognized that the development of relationships is an interactive process between oceanographers (producers) and users (fisheries). It was also agreed upon that this should be a concerted effort through FOC (theme session, WGs, etc.).
C) This question was partially answered in A) but here the emphasis was more on information from sources other that the AZMP. The participants identified the need for the monitoring of benthos and pelagic (nekton) surveys. In addition, it was argued that the analyses of past collections on zooplankton (e.g., Southern Gulf) and benthos from trawl surveys (NF, Maritimes) would be useful addition to
current data series. The characterization of the physical habitat was also judged important in the case of invertebrate species.
D) It was clearly stated that FOC should remain the forum for these collaborations. The participation of oceanographers in the stock assessment working groups and assessment framework WG was seen as a first step. However, it is also the responsibility of assessment biologists to ask questions and look for information and collaboration.
E) Creation of intra- and inter-regional working groups, under the auspices of FOC, to work on case studies or species- and region-specific questions was suggested.
Discussion
The discussion focussed on the recommendations extracted from the answers to the workshop questions.
A) Should we add to AZMP activities and what would be the requirements? Four gaps were clearly identified (macrozooplankton, gelatinous, benthos, fish larvae) as well as poor sampling in some geographical areas (Strait of Belle Isle, Southern Newfoundland, nearshore). It must be emphasized that without additional resources, it would be difficult to assume any of this additional sampling. We should first look at how well we now describe the ecosystem on a large scale. We need a working group to look at the elements that we are not sampling now and to provide options: our managers need to know the implications of handling these requests. For geographical areas with poor sampling, it is important to identify the reasons why the added information is needed from those areas: this can be dealt with through the review.
ACTION: P. Pepin, M.Harvey, D. SameotoTo report to P. Pepin by mid-January with respect to ideas for sampling larger organisms: what activities have been done what needs to be done
B) There is a desire to be able to query a database in order to evaluate indices. A lot can be done with the existing data sets, but we need to generate and make available on the web some specific data products that address the needs of fisheries people in order to get them to start using the AZMP data and products. We need to communicate effectively how clients can use the database and where the data can be found. We must be pro-active and explicitly ask clients what products they require.
It was suggested that we might be more successful in reaching the assessment people if all the indices were included in the MFD database. We could have a pilot project to produce, for example, hake indices, OE bottom temperature, sea ice, etc. It was
indicated that P. Fanning had already offered at the FOC/AZMP workshop to run a pilot project along this general theme and that we should encourage this effort. Specific indices will be generated and evaluated from this pilot.
Fisheries-related indices should be included on the AZMP web site.
ACTION: K. Drinkwater, D. Gregory, B. Petrie Prepare recommendations to the directors that this pilot project should be initiated
and that resources need be allocated to this task. Draft text to request an "index wish list" from RAP co-ordinators.
On the issue of a primer: Some comments could be made in the next bulletin to address elements of this.
ACTION: B. Petrie and J. Chassé To prepare an article on the scales of variability and representativeness for the next
bulletin.
It was suggested the primer is not truly an AZMP issue. There is a need for this sort of information but it might be better dealt with through the state of the ecosystem report. The information does exist, but it would require considerable time to compile in a coherent fashion. This might be a task for the Ocean Science Division, but would require significant effort.
C) The AZMP review exercise will deal with these issues.
D) It was agreed that the lead in incorporating new environmental information into assessments should be through FOC. AZMP might identify zooplankton or other data that have not been processed and address specifically data that may be important to AZMP. We should make specific proposals and identify the resources that would be required to get these data transformed into proper time series.
ACTION: Within each region: Provide assessment of whether there are samples in bottles or data that should be
included in database (collections of plankton data). Also must determine and show the value of the data that could be retrieved.
Statistics of Sampling during MFD cruises: GSL (M. Mitchell)
The AZMP in the Maritimes has been collecting biological, physical and chemical data during the annual MFD September cruise in the southern Gulf of St. Lawrence (SGSL). These data, obtained at stations within a stratified random design, are used for the assessment of key variables in the SGSL. Two teams of trained personnel in 2 six-hour work shifts carry out the survey each day (team 1: 0000-0600 and 1200-1800; team 2: 0600-1200 and 1800-2400). The AZMP sampling follows the standard groundfish trawls
at each station, and is carried out by an AZMP technician on one team and by the senior scientist on the other team. Because of workload for the senior scientist, it is proposed that the AZMP sampling not be done during his shifts. Would the resulting spatial sampling still be sufficient for AZMP to properly assess the variables of interest?
Our approach in answering this question has been to examine data collected during previous cruises and attempt to quantify the differences between the data set collected by sampling all the stations and a partial data set that would have resulted from the sampling effort of the individual teams only. We consider data from the 2000 and 2001 SGSL surveys. The 4 sets of figures below show contours of temperature and chlorophyll-a fluorescence at the surface and near bottom calculated on a grid through linear interpolation. The top panel in each figure represents the data collected at all the stations and the middle and bottom panels show the partial data set obtained through the sampling effort of the individual teams separately. These plots show that the overall patterns obtained from the 3 datasets is similar but there are notable differences in local areas for both variables. The differences appear to be more significant at the bottom than at the surface.
We need to evaluate how significant these differences are and to determine if the errors on our assessments from using the partial data sets are acceptable. As a first step in quantifying the differences we chose to examine the temperature data only. Other variables have been plotted but we have not analyzed these and will therefore not discuss these data.
At each grid point, we calculated the difference between the surface temperature generated from the partial data set and the estimates generated from the entire data set. This anomaly is plotted below for both data sets (team 1 and team 2) and both years (2000 and 2001). The figure shows there are distinct areas with large anomalies having peaks as high as +2ºC and as low as –2ºC. These appear to be the direct result of missing data points, which affects the results of the interpolation. For the whole region, we calculate a RMS error of ~ 0.5ºC. A quick estimate of the representative standard deviation for the interannual variability for September for 95% of the data is ~2.8ºC (climatology from technical reports). This suggests the reduced sampling scheme might result in a 20% error for surface temperature.
Bottom temperature is a parameter of high interest to our fisheries clients. We calculated bottom temperature anomalies as described above for the surface temperature. The results in the figure below shows there are many local areas where the anomalies are large. The RMS error calculated for the whole region is ~1.5ºC. The representative standard deviation for the interannual variability of bottom temperature for 95% of the data in the whole SGSL in September is only ~0.7 ºC, much less than the RMS error. The error on bottom temperature assessment is larger than the annual temperature signal, which is unacceptable.
With a better understanding of the source of these errors, we may be able to improve our assessments by using different analysis techniques. We suggest that a major source of error might be the result of the poor bottom representation produced by using the partial data sets.
Bottom temperature is the temperature measured at the maximum profile depth of each station. In an uneven bottom and where vertical temperature gradients are significant, the accuracy of our representation of the bottom depths will have significant effects on our interpolation of temperature. With a partial dataset in an uneven bottom, we may be producing interpolated values at depths that are not the true depths, from temperature values measured at different depths and in areas where there may be large vertical temperature gradients.
We observe significant differences in the interpolated representation of the bottom from the entire dataset versus the partial datasets. These differences are more pronounced in areas of significant bottom slopes. The histogram below shows how the distribution of depths is represented differently for each of the data sets. In particular, there are notable differences in the 30-60 m depth range where the temperature gradient is large.
Given that the 3 datasets produce different representations of the bottom, in particular in the depth ranges where temperature gradients are large, the basic 2-D interpolation method used thus far is inadequate. Methods that would provide better bottom depth representation will improve our assessments. As a practical example, we explored how these partial datasets might affect some of the indices we produce. One product routinely generated at the request of clients is the total area of the bottom where temperature is within select ranges. We calculated these areas using the complete and partial data sets. The results are shown in the table below. As expected, large errors are evident. These errors are sufficiently large to warrant using improved analysis techniques.
Bottom Areas in square kmTemp
(deg C)All stns 00-06, 12-18
group 106-12, 18-24
group 2<0 5150 5100 3750
0 to 2 31050 24250 303502 to 4 20600 26300 199504 to 6 15450 15900 13100
>6 18650 10800 19350Total 90900 82350 86500
in percentTemp
(deg C)All stns 00-06, 12-18
group 106-12, 18-24
group 2<0 5.67 6.19 4.34
0 to 2 34.16 29.45 35.092 to 4 22.66 31.94 23.064 to 6 17 19.31 15.14
>6 20.52 13.11 22.37
The next step is to evaluate more sophisticated analysis techniques. We plan to test methods with increasing level of complexity. To generate better estimates of bottom areas we could for example:
1. Use vertical profiles of temperature to determine the depth limits of the temp range of interest and estimate the percentage of GSL bottom area in that depth range from the Optimal Estimator bottom grid;
2. Use the complete vertical CTD profiles and the optimal estimator bottom grid to do a full interpolation along depth, distance and time;
3. Incorporate all the profile data into a model of circulation in SGSL to produce better bottom temperature estimate.
Conclusion
This analysis showed that for surface temperature, our broad-scale assessments produced from a partial data set could be acceptable. If the need were for information at specific local areas, extra caution would be required in using a partial data set.
We cannot be conclusive for the bottom temperature. Our preliminary analysis reveals large errors but these are likely the result of the analysis technique we used so far. The simple 1-D interpolation is not adequate to generate the bottom temperature field with a partial data set. We must use more sophisticated analysis methods to generate the temperature fields prior to evaluating the errors.
Discussion:
The question arose whether the reluctance to undertake the AZMP sampling during the southern Gulf survey was a decision by a particular chief scientist or is it an institutional decision by the Gulf Region. This needs to be clarified and should be discussed with M. Chadwick. There was some discussion about whether the lack of AZMP sampling would mean that the CTD would not be used on all stations. While it was generally felt that CTDs would be taken on all stations, it was not an absolute certainty. Again this would need to be clarified with Gulf Region.
It was suggested that perhaps Quebec Region could place a person on the southern Gulf survey, which could help to strengthen collaboration between the two regions. Quebec Region felt that they are already stretched to the limit and putting someone on the southern Gulf survey would require that Quebec Region drop something else. It was also pointed out that space aboard the vessel (Needler) might be a problem even if an extra person could be found. The question of how to sustain the present effort is an ongoing struggle.
The reluctance of fisheries groups to continue to collect oceanographic data or even in some cases to have it collected on their surveys is ongoing and not unique to the Gulf Region. It is not that they are against it but it costs them money in time and overtime, even if they do not do the work. All of the regions have similar problems. In Quebec
Region, they send 2 AZMP people to sea for a month. In addition to the southern Gulf survey, Maritimes sends an AZMP person to sea for 1 month on the Scotian Shelf survey. Newfoundland Region uses trawl-mounted CTDs in order to cut down on the time required for oceanographic sampling.
It was pointed out that of all the oceanographic variables measured, the one chosen for the analysis (temperature) is likely to require the fewest stations to adequately assess what is happening. One might expect chlorophyll-a, nutrients and oxygen to need more stations than temperature in order to adequately resolve their fields because they tend to show more station-to-station variability than temperature.
Further analysis to assess the effects of halving the sampling will be carried out. It was suggested that optimal estimation (OE) be used and indeed, these fields are available since they were estimated for the southern Gulf surveys as part of the environmental overviews.
Oceanographic Measurements on Maritimes MFD Cruises (J. McRuer)
Historical View
Marine Fish Divisions at BIO and GFC have collected oceanographic measurements on their groundfish surveys for many years. Some of these surveys have been continuous since 1970, while other series are of shorter duration. They include:
Scotian Shelf Summer Survey 1970 to the present Southern Gulf Fall Survey 1971 to the present Scotian Shelf Spring Survey 1979 - 1984 Scotian Shelf Fall Survey 1978 - 1984 Georges Bank Survey 1986 - present Eastern Scotian Shelf Spring Survey 1986 - present (not 1998 )
Oceanographic collections were also made by a number of other programs in the regions.
The sampling on these programs was variable in time and between programs. As new equipment became available it was incorporated. The types of measurements made included Knudsen bottles at standard ICNAF depths (for T, S, N, Chl, PC), bathythermograph, XBT, or CTD/Rossette (T, S), continuous flows sampling from a sea chest (T, S, F) and Bongo nets, with and without a CTD attached.
The groundfish surveys were a little more conservative. Until 1988, only temperature and salinity were collected and only at a subset of the stations occupied. During this period, the number of oceanographic samples collected on each cruise grew from a very few during the early years to between a third and a half by 1988. T and S sampling was
accomplished using surface buckets and Knudsen reversing bottles at standard ICNAF depths. Additional temperature data were collected using a bathythermograph until 1981 and an XBT until 1988. In 1989, Seabird CTDs were introduced and after discussions within MFD, it was agreed to use the Seabird on all stations, provided no additional time was taken for the additional sampling. A reversing bottle was added at 10 m or the bottom to obtain water samples for T/S calibrations.
Through the 1990s, O2, fluorescence and PAR sensors were added to the CTD; bottle samples were added at 5 m, mid-depth and bottom (for T, S, N, Chlo, O2); Minilog TD recorders were added on the foot rope of the trawl; and with the initiation of AZMP, vertical plankton tows were added at a subset of stations and full hydros at the AZMP fixed stations. These additions did add time, even with increased speed of processing and deployment systems. To accommodate this, 3 days were added to the cruises in the late 1990s.
The Present
In 2002, the oceanographic sampling took another step adding a winch with electromechanical cable and a modified four-bottle rosette with altimeter for CTD deployment and water sampling. The measurements taken now include profiles of temperature, salinity, oxygen, light & fluorescence, water samples for O2, salinity, chlorophyll and nutrients, surface temperature and ambient light, and vertical net samples from selected subset of stations and a full hydro at the AZMP fixed stations.
The surveys collecting oceanographic data are
Scotian Shelf Summer Survey July Southern Gulf Fall Survey September Georges Bank Survey February Eastern Scotian Shelf Spring Survey March Herring Survey October/November
Examples of other programs requesting oceanographic sampling. These requests vary from year to year.
Cabot Strait Cod January Shrimp Survey January Benthic Ecology Cruise October
Challenges
MFD/BIO must use A-base funds ($’s & PY’s) for this work, supporting both Scotia-Fundy & the Gulf region. With the ongoing and increasing costs, the Division is unable to maintain the funding levels, given other priorities and funding restructures. With the advent of AZMP, MFD received no additional funding relief but has managed to continue
support for oceanographic sampling. The challenges are to find the resources to enable the continuation of oceanographic sampling on the annual surveys.
Ship time is a limited resource and oceanographic sampling takes time from the primary task of the five research surveys collecting oceanographic data. To accommodate this, 2 to 4 additional days were added to each of the surveys in the late 1990s. The increased time at sea added additional costs to the surveys, but it did enable the biological and oceanographic sampling to co-exist. The surveys, however, have no room left for such expansion, as they are back to back with other programs that are also pressed and competing for time. Problems that arise, which delay or take time away from the survey (Search & Rescue, equipment failure), always have a serious impact. In recent times the crew change schedule for the Needler has caused problems, as it never matches well with the survey schedule and takes time. The FTE cost of oceanographic sampling grew with the program to the point where MFD was using 1½ staff for oceanographic sampling at sea. This amounted to a whole FTE plus at-sea overtime costs each year. The addition of one AZMP personnel on cruises enabled full watches for biological sampling and has reduced MFD costs to 0.5 FTE plus overtime in support of oceanography.
In terms of equipment maintenance and replacement on the surveys, MFD has carried almost all the costs to date (~ 150K/yr, $’s & PY’s ). The equipment is getting older and maintenance and replacement costs are growing. Replacement funds will have to come from elsewhere, but where?
MFD agrees that oceanographic sampling is important and should continue, but at some point other methods of funding this work must be found or the sampling will have to be scaled back.
Discussion:
Another source of data is from the sentinel surveys, for example that on the Scotian Shelf carried out under the direction of the Fisherman’s and Scientist’s Research Society (FSRS), which also collects data. Environmental information is becoming increasingly important under ecosystem management and is heavily valued by industry, thus it was felt by some that such sampling could not be eliminated or cut back although how to fund it is an increasing problem.
In Newfoundland, they use trawl-mounted CTDs and no processing is done on board. Technicians make sure the instrument is working and then process the data at home. Typically 2 CTDs are taken on the ship. No bottle data are collected for calibration and the fluorometer is not used. There is great resistance to adding time to the fall and spring groundfish surveys since they are already 42-45 d long. In the Gulf, only the CTD is used to collect environmental data. This year it was equipped with an O2 sensor. In 1995, bottle data were collected, but that was the only year and the data were not reported. The Fisheries Group in the Gulf do not want to continue oceanographic sampling because of heavy workloads.
L Devine, 28/05/03,
If this is the mission I’m thinking of, there is a technical report that includes the bottle data: “État du Golfe du Saint-Laurent: Conditions océanographiques en 1995” D. Gilbert et al. Rapp tech can hydrog sci ocean. 191.
It was felt that it was important to stress to management in the Gulf and Maritimes regions that the oceanographic sampling needs to continue in order to characterize environment as part of ecosystem management. In addition it can help to understand spatial distributions of fish. AZMP and/or FOC need to show that they are useful and what benefits are derived from them towards answering the fisheries problems. Doug Swain has some indices for the Gulf, which he could supply.
In terms of funding, there are problems of mandated versus non-mandated work. For example, MFD is not mandated to collect environmental data so when there are pressures on funding, it has to turn its attention to those items for which they have a mandate. Departmental reviews are presently going on that might address this issue. As to hardware issues regarding replacement, the question was raised whether these could be obtained from year-end funds. Jeff indicated that he faithfully provides a list to MFD but so far nothing has been done. It was suggested that AZMP or other groups within BIO might have to lobby on behalf of MFD. Funds for maintenance are equally problematic.
We need to evaluate more efficient ways of data collection that can reduce the sampling time on cruises. It was agreed that the Chair should bring up the issue of replacement and maintenance of equipment and stress the need for continued environmental sampling during fisheries cruises to satisfy ecosystem concerns. Using the fisheries surveys continues to be the most efficient way to collect the data as opposed to using separate cruises.
Logistics – AZMP Sample Archive of Phytoplankton and Zooplankton Samples Gary Maillet, Alain Gagné, and Michel Mitchell, (Logistics Sub-group)
Discussions with personnel from the Newfoundland, Laurentian and Maritimes regions suggest the “strong desire” to attempt to “archive all phytoplankton and zooplankton samples” from the AZMP region. All members agree that it is undesirable to “throw out” samples that may require additional analyses at a later time or may be utilized for other research purposes. The Maritime (BIO) and Laurentian (MLI) groups have maintained all phyto- and zooplankton samples collected to date, as has the Newfoundland (NWAFC) region. The Newfoundland region has experienced difficulties with space availability and a mold problem in the current storage facility (Bunker). The current difficulties in NF have not yet been resolved.
Limited storage space will eventually become a problem for all groups. What is a reasonable time for maintaining AZMP phytoplankton and zooplankton samples? Can we agree on a common method for preservation or should we continue using current methods in each region?
Options for sample storage of phytoplankton and zooplankton samples that were discussed:
Phytoplankton:
- permanent slide (method K. Pauley)- settling chamber and formaldehyde addition (method M. Starr, C. McKenzie,
after initial preservation with Lugol’s)- settling chamber and FAA (formalin acetic acid) (method J. Martin, K.
Pauley)- digital image storage on CD (method C. McKenzie).
All methods have disadvantages:
- degradation of thin-walled cells (i.e. flagellates, ciliates, coccolithophorides in preservatives and during air-drying)
- digital images difficult to use for species identification with multiple cells in a common field.
Zooplankton:
Discard excess volume of liquid for long-term storage of ½ of sample in original container and preservative. Remove subsample and store in smaller container in isopropyl alcohol.
Difficulties :
Samples will have a tendency to evaporate over the years and will require visual inspection and additions of preservative to avoid loss of samples. Proper archive of samples will require a substantial effort and time.
The Logistics Committee presented the following recommendations:
1) Concentrate phytoplankton samples using settling columns and transfer samples to 20 ml glass scintillation vials with addition of formalin to final concentration of 1%.
2) Transfer zooplankton samples to smaller containers (e.g. 250 ml glass bottles with plastic tops) to increase available storage capability.
3) Maintain all phytoplankton and zooplankton samples for a minimum time period of 10 years for all AZMP fixed station and transect stations.
4) Decisions regarding long-term storage of non-AZMP samples under the discretion of regional representatives.
5) Logistics sub-group will begin discussions about implementation of the above recommendations using a standard protocol and will design an electronic inventory of the samples, which will be provided to MEDS.
This undertaking will require a dedicated effort in all regions, but the logistics group feels that is important that we archive our samples that were collected at a substantial cost and effort.
Discussion:
The AZMP group strongly supported the recommendations of the Logistics Sub-group. The need to maintain the samples was emphasized by the fact that the Maritimes region has already had to reanalyze samples on one occasion. Also, it was generally acknowledged that the AZMP analysis of the samples is minimal and maintaining the samples will allow them to be used for other purposes such as species at risk and biodiversity issues. The samples stored by Newfoundland region have already been used for purposes other than AZMP. As a result, the feeling was expressed that it would be criminal to discard samples. There was also general agreement that one should not put a definite “shelf-life” on the samples but attempt to achieve “long-term” storage. It was noted that SAHFOS identifies and keeps all their samples.
Long-term storage of samples was recognized as an issue that is not unique to AZMP. At the international level, organizations such as GOOS have been struggling with it. Other programs within DFO have also been wrestling with this and a solution needs to be sought within DFO that goes beyond AZMP. While recognizing that the location for storing the samples needs to be dealt with at the regional level (Newfoundland is addressing their problems with the Bunker), the general issue of storage should be dealt with zonally. This needs to include management of the samples and an electronic catalogue. It was suggested that the Huntsman Laboratory be contact to discuss storage methods and management of the samples. It was further suggested that resources should be sought to tackle this problem.
The storage methods presently in use only preserve some phytoplankton for a couple of years while others will last for the order of decades. Zooplankton generally last for long periods of time. There were some concerns that evaporation could be a problem. It was suggested that a methodology be established from sampling to storage and made available so that scientists and technicians know what to do from the time sampling begins. Again the Huntsman might be able to help with this. Transferring the plankton samples will take time, but we should begin this process with the AZMP samples. Older samples should also be transferred but how and by whom this would be carried out will have to be worked out.
The group felt that when the Chair makes his presentation to the Atlantic directors he stress that samples need to be kept and that the storage of samples is not just a problem for AZMP but is a more general problem in all regions.
The Logistics Sub-Group also felt that there needed to be intercomparison for identification of phyto- and zooplankton to ensure all the regions are compatible. This is also recommended for chlorophyll-a and nutrients, the latter of which has already been
done by NOAA/NRC. The larger AZMP group felt that this was needed and suggested that the Logistics Sub-Group under take such comparisons and report on any results next year.
Status of Quebec remote sensing project, Laurentian Region (J.C. Therriault)
Objectives:
To provide the AZMP with maps reflecting as accurately as possible sea surface temperatures for the regions covered by the program.
To provide estimates of the data products reliability using in situ validation. To act as regional backup to the BIO station for SeaWiFS.
In 2002, the Laurentian region operated 2 satellite receiving stations (MLI and Resolute Bay). We completed the first phase of a major system upgrade in Resolute to improve reliability. Phase 2 will start in spring 2003. (new computer and backup system). There was also the completion of the development phase of automatic processing system which is now completely operational at MLI. The group has now started reprocessing of archived data (from 1994). A new FTE assigned to operational functions (shared with numerical modeling).
Some of the system features include:
Almost entirely automatic (> 95%) (still need to acquire and enter ephemerids; about 2 hrs per week).
Process data from all the available NOAA satellites to generate mean SST. Acquires and transfers SeaWiFS images to NASA. Produces SST time series (3x3 pixels mean and standard deviation) at AZMP stations
(Anticosti, Gaspé, Shédiac, Prince 5, 27, Station 2), weather buoys, and offshore locations of coastal thermograph network (or any other virtual stations).
System easily configured through parameter files
– New zones can be defined on the fly for specific purposes
– New virtual stations can be added
– Products can be enabled/disabled
– Average periods can be modified
– Customized versions of the main processing system can be safely run in parallel to satisfy specific research needs
– Products can be sent automatically to users (FTP site, e-mail, etc.). The system feeds a relational database compatible with Oracle that can be queried using SQL.
Products online using a large network of attached storage system (NAS) (always available on line).
Some of the products that will be available include:
Regional daily sea surface temperature maps for each individual pass (all possibilities for composite passes).
Routine production of regional mean sea surface temperature maps. Weekly, bi-monthly. At present 8 regions covered :
Gulf, Scotia Fundy, Atlantic (BIO), Baffin, Hudson, Arctic, Beaufort, Northwater. Also available are the number of points making the mean, and the standard deviation
at every pixel. JPEG and HDF files formats (NetCDF also possible).
The plans for 2003 are:
To complete reprocessing of all available data starting in 1994 (should take 6 months - depends on computer speed).
Perform a major overhaul of the web site to allow better access to products and adapt to the new TB norms and standards.
Develop continued access to real-time buoy network data to validate SST satellite data (ground validation).
There will be limited development in order to improve operations. It may be possible to implement 18 km JPL type MCSST (with minimal help from
BIO to validate results).
Some of the problems the group faces:
Costs to run the system are above actual AZMP funding level. Main expense is Terascan software licence (5.5K). Other expenses (tapes, hardware replacement, overtime, etc. would require another
5K). Direct accessibility through OSL portal remains to be completed (should be done
within next 2 months, but direct access can be arranged now for particular users).
Discussion:
B. Petrie suggested that intercomparisons may be useful to evaluate SST data processed at smaller scales 3x3 degree pixels by OSL with the 18 km scales spacing of JPL dataset. D. Gilbert pointed out that OSL data products incorporate all satellites compared to BIO data products. J. Chassé inquired about the availability of data in HDF format. J.-C. Therriault indicated the data is not yet available in a relational database but raw data could be provided to AZMP members if requested. D. Gregory pointed out that further processing would be required with HDF-formatted data. G. Harrison inquired about interactive capabilities of the OSL site regarding SST data. D. Gilbert mentioned that the
relational database may be available sometime next year, as well as further custom data products as requested. D. Gregory indicated that intercomparison exercises are underway to investigate different data products from different satellites. G. Harrison also indicated that SeaWiFS ocean color algorithms continue to evolve as improvements are made. Several individuals mentioned that methodology summaries need to be included on AZMP web site. J.-C. Therriault reported that all zones will be available within the next few months on OSL site. J.-C. Therriault also mentioned the 5 year database of optical measures and the relative importance of quantifying yellow substances / DOM, particularly in the southern Gulf, which need to be applied to correct the satellite-derived information. G. Harrison also mentioned atmospheric corrections are underway, as well as yellow substances for correction of chlorophyll a determinations from satellite data. G. Harrison also indicated that caution must be exercised in interpretation of the primary production maps because of the use of climatological light field when comparing with in-situ data.
Status of SeaWiFS data products and availability (G. Harrison)
Summary: G. Harrison reported on the status of image processing and data product development at BIO for high-resolution SeaWiFS ocean colour and AVHRR SST.
Almost all SST data have been reprocessed to improve cloud masking and eliminate cloud-edge effects; completion is imminent. NOAA-16 and NOAA-17 data streams for SST processing are now being received routinely. NOAA has announced “big changes” are coming soon in polar-orbiting satellites. These changes are expected to have an impact on all ground receiving stations. L. Payzant will be attending the NOAA conference in December to get more details.
The latest major reprocessing of SeaWiFS data using the new NASA software has just begun. BIO will be using their own cloud masking and satellite zenith angle parameters instead of NASA’s defaults. This will eliminate sections at the edges of satellite passes and thin cloud areas that gave erroneous chlorophyll values in the previous processing. Completion of this latest reprocessing will take a few months. Algorithm development continues. Incorporation of “yellow” substance parameters has markedly improved chlorophyll retrieval based on comparison of SeaWiFS with in situ measurements, i.e. most of the systematic bias in the satellite data (over-estimates at low levels, under-estimates at high levels) has been eliminated. Fixed station, “box” and section statistics of both SST and ocean colour will be available to AZMP personnel from a BIO FTP site (to be designated) when data processing for the calendar year is completed.
G. Harrison also provided a few highlights of the SeaWiFS chlorophyll data for the first half of 2002 (January – July) and discussed these results in the context of the 5-year time-series of observations now available. Reprocessing of the older CZCS data (1979-1981) has also been done and data are available upon request.
Finally, G. Harrison reported on the uncertain future for SeaWiFS. The latest NASA message on the matter indicated, “…the current contract between NASA and ORBIMAGE, which provides access to the SeaWiFS data stream, expires on December 19, 2002. NASA is currently in negotiations with ORBIMAGE on a new contract that could provide continued access to SeaWiFS data for an as yet unspecified period of time. Unfortunately, we have no more information than that at this time.” Alternative ocean-colour data products will be available in the future if SeaWiFS is terminated but come at a price. Cost-recovery for ocean colour data products from the MERIS project, for example, is anticipated: each “low-resolution” scene will be priced at 5 Euros. Each of our NW Atlantic SeaWiFS composites (24/year) is generated from ~ 50 scenes. Therefore, we could anticipate that the total annual cost for MERIS products, if we have to go that route, will be ~ $9K CAN per annum!
Discussion:
D. Gregory expressed concern about comparison of CZCS with SeaWiFS data, since the respective satellite data were not calibrated and parameterized using the same method? Glen alluded to the fact that the chlorophyll a signal is quite noisy and may require further smoothing and filtering to remove high frequency variability, but indicated some general correspondence of the satellite and CPR color index data. G. Harrison posed a basic question “what makes blooms last longer and greater in magnitude,” which the AZMP program should begin to address with all the available data in the different regions. B. Petrie commented on the tendency of the spring bloom to be delayed at Prince 5 based on discrete observations and wondered why this pattern was not clear in the SeaWiFS data. Some concern was raised from members about the anticipated changes in chlorophyll a data once the new algorithm is implemented at BIO. G. Harrison and B. Petrie indicated that they did not expect any large changes in the pattern of the time series, but likely would only see slight magnitude shifts. S. Narayanan suggested that MEDS – AZMP web site to provide descriptions about OSL and BIO Remote Sensing Sites as front ends and the information should be passed to C. Schock / E. Couture for update.
GOOS Activities in the North Atlantic (G. Harrison)
Summary: G. Harrison reported on the activities in 2002 of the ICES/IOC Steering Group on the Global Ocean Observing System (SGGOOS) and implications for AZMP. SGGOOS was established to advise and assist ICES in taking a leading role in the development and implementation of GOOS in the North Atlantic with special emphasis on operational fisheries oceanography. SGGOOS is considering regional/national monitoring programs as potential pilot programs for GOOS in the North Atlantic. Presentations on the AZMP program were made at three meetings in 2002:
ICES/IOC SGGOOS meeting in Halifax, April 2002. Northwest Atlantic GOOS Pilot Planning Meeting in Boston, September 2002. ICES-ASC Theme Session “Fishery and Environmental Management - Is there a Role
for Operational Oceanography?” in Copenhagen, October 2002.
Elements of AZMP, as described at these meetings, are relevant to both the Coastal Ocean Observation Panel (COOP) and the Ocean Observation Panel for Climate (OOPC) of the Global Ocean Observing System (GOOS). At the April SGGOOS meeting, it was proposed that Canada and the US consider the feasibility of developing a GOOS pilot project for the NW Atlantic, similar to the efforts currently underway to develop a North Sea GOOS pilot. In response to this SGGOOS request, ten scientists from Canada and the US met in Boston in September to lay the groundwork for a NW Atlantic GOOS pilot. A project outline was generated, writing teams were identified and a draft proposal, to be completed by the end of December 2002, was agreed upon.
The new initiative, called “GOMA-GOOS”, for Gulf of Maine Area-Global Ocean Observing System, will be a Canada-US GOOS Regional Alliance (GRA), will be located in the Gulf of Maine (NAFO divisions 4X & 5) and will have as it’s primary objectives:
to illustrate the application of ecosystem-based fisheries management (EBFM) in the Gulf of Maine
to develop an information support system for EBFM and in doing so, evaluate degree to which current systems meet EBFM requirements
to foster regional alliance on EBFM
The focus will be on fisheries during the pilot phase but broader ecosystem-level considerations are the goal of the observation program in the longer term. GOMA-GOOS will build on existing regional monitoring programs and a State of the Ecosystem Report will be one of the major products. The pilot project duration is planned for 2003-2008. AZMP has a potentially important role to play in this initiative.
Discussion:
It was suggested by S. Narayanan that a GRA proposal be prepared to go through ICES after evaluation and feasibility study is completed. Glen indicated that funds for the North Sea pilot project have not yet been identified. Denis Gilbert commented about the reasons why GOOS would only consider projects among different countries and not regional contributions within a given country (the Baltic States and Maritimes were provided as examples). It was pointed out that there is no official Canadian GOOS committee, but that Denis D’Amours was the national coordinator.
Investigation of spatial and temporal scales in Eastern Canada (J. Chassé, B. Petrie and M. Ouellet)
The status of the investigation of spatial and temporal scales in Eastern Canada was presented. The main objectives of the project are to: a) evaluate the spatio-temporal scales of oceanographic variables in Eastern Canadian waters; b) determine the spatial representativeness of the fixed stations for physical, biological and chemical variables in
Canadian Eastern waters; c) evaluate the need for additional sampling station(s); and d) evaluate the minimum monitoring needs necessary to nowcast and forecast the state of the ocean using statistical and numerical models. The current presentation focused on three oceanographic variables: 1) Sea Surface Temperature (SST), 2) Current meters, 3) TS-database.
Sea Surface Temperature
The SST variability scales have been investigated using the Jet Propulsion Laboratory weekly composite images from satellite observations. The spatial resolution of the database is around 18 km. A harmonic analysis has been performed on the time series to extract the annual, semi-annual and tri-annual cycles. The largest annual cycles are found over the continental shelf and within the Gulf of St. Lawrence, particularly over the Magdalen Shallows. Low values are evident off western Nova Scotia, in the Bay of Fundy and over Georges Bank. High amplitude values are obtained off the SW Grand Banks. The results of the analysis have also revealed large scale features associated with the mean circulation, tidal mixing processes and wind-forced upwelling; the inshore and offshore branches of the Labrador Current over the NE Newfoundland Shelf, the Grand Banks and the continental slope; the penetration of relatively cold Labrador water into the northern Gulf of St. Lawrence; the cold water in the Estuary and Fundy Bay caused by upwelling and enhanced mixing; the influence of slope water on the Scotian Shelf and the tidally well-mixed areas off SW Nova Scotia. On average the summation of the mean and first three harmonics of temperature can account for 82% (96% in the southern Gulf) of the variance of the data sampled at the weekly frequency.
A time series of the anomaly fields, defined has the observed temperature minus the temperature reconstructed from the harmonic analysis, has been constructed. Correlation analysis of the anomaly fields has established the spatial scales of variability centered on the AZMP fixed station sites. These scales vary substantially over the region. The correlation falls off sharply at short distance from the Gaspé site. The Shediac fixed station in the Magdalen Shallows appears to account for the temperature anomalies over the western half of the Southern Gulf. The correlation field referenced to the Scotian Shelf Station 2 off Halifax represents a larger area. The largest area is captured by the observations from Station 27 off St. John’s, Newfoundland. Data from this site capture a considerable amount of the SST variance over the Grand Banks.
The horizontal correlation scales, defined as the distance over which the correlation coefficient falls under 0.7, vary from 30 km is the St. Lawrence Estuary to 250 km over the Grand Banks. Correlations with the time series of temperature anomaly at fictive sampling locations show that another station would be necessary in the eastern part of the southern Gulf to capture the 50% of variability of the SST anomaly. Another station would also be necessary in the northeastern part of the Gulf to reach the same goal. The correlation scales show little variation when the data is filtered with cut-off periods of up to 90 days, but larger correlation scales should be expected at lower frequencies.
An auto-correlation analysis has shown that the temporal scales of variability are short, generally less than 20 days. This indicates that a two-week sampling interval is minimal to resolve the SST anomaly variability. A Canadian Technical Report of Hydrography and Ocean Sciences entitled “Temporal and spatial scales of sea-surface temperature variability in Canadian Atlantic waters” has been produced and is currently under review by peers. The final version should be available at the end of January
Current meters
An analysis of the spatio-temporal scales of variability for subsurface temperature, salinity and currents from current meter measurements in eastern Canada has been conducted. The analyzed groups of current meters include the Southeast Shoal of the Grand Bank, Northern Grand Banks, Flemish Pass, Avalon Channel, Cabot Strait, Belle Isle Strait, St. Lawrence Estuary, Gaspé Current, Central Gulf and the Jacques Cartier Passage. These arrays of instruments allow 3 dimensions to be fixed and scales derived for the 4th. A report entitled “Temporal and spatial scales of temperature, salinity and current velocity on the Newfoundland Grand Banks and in the Gulf of St. Lawrence” will be available during winter 2003.
Temperature – Salinity
The annual, semi-annual and tri-annual cycles of temperature and salinity were investigated using all the historical vertical profiles available. The data have been gridded, on a grid covering the eastern Canadian shelf waters at 0.1 degree resolution providing three-dimensional fields for the first and the fifteenth day of each month. A harmonic analysis has been performed on the gridded data and the mean signal as been extracted as well as the amplitude and phase of the main constituents. The analysis reveals similar features as the SST analysis for surface temperature. At depth, interesting characteristics are observed like the fact that there is almost no annual cycle in the middle of the Anticosti Gyre. Scales based on gradient of the amplitude and phase will be determined and made available at the next AZMP meeting.
Discussion:
D. Gilbert pointed out that the phase in the Laurentian Channel did not appear to be significant (high variability). B. Petrie indicated that it would be important to closely evaluate the amplitude of the signal, which typically decreased rapidly with depth in excess of 100m in this region. J. Chassé and B. Petrie also indicated the potential for significant harmonic patterns that could be related to upstream conditions (e.g. freshwater pulse from Hudson Bay to downstream areas). P. Pepin inquired about the dynamics of harmonics and mean conditions for biological and nutrient variables that were not addressed specifically during the presentation. Joel indicated that biological and chemical variables would be addressed in the nutrient atlas presentation by B. Petrie. J. Chassé mentioned that this project would require additional time and funds for completion. E. Couture suggested that the spatial representativeness of the AZMP fixed stations and sections could be provided and posted on MEDS web site in graphically format with a
brief description by J. Chassé and B. Petrie. This could be done shortly after the reviews to the technical report are completed sometime around February 2003. It was also suggested that a summary of the array scale results should be in the next AZMP Bulletin. D. Gilbert thought it would be very useful for the spatial representativeness information be provided for all of the different sites so that users / clients would be fully aware of the spatial context of the AZMP data products.
Nitrate, Silicate and Phosphate Atlas for the Gulf of St. Lawrence (D. Brinkman, B. Petrie)
Over 37 000 observations (each) of nitrate, silicate, and phosphate were analyzed to create a nutrient atlas for the Gulf of St. Lawrence. The statistics are strongly affected by the temporal and spatial distribution of the data: 80% of the observations occur in summer and fall, 51% are in the upper 30m, and 21% are in the Estuary (occupying ~5% of the Gulf). We divided the Gulf of St. Lawrence, from the St. Lawrence Estuary to Cabot Strait to the Strait of Belle Isle into 12 sub-areas based primarily on the distribution and availability of nutrient observations. For each area, we calculated the monthly means, standard deviations and extreme values of nitrate, silicate and phosphate, for 4 depth intervals. As well, an annual cycle consisting of a mean and an annual harmonic (amplitude and phase) was fit to the layer data. Results are presented as contour and time series plots and provided in tabular form. We used optimal estimation to calculate the nitrate, silicate and phosphate distributions at 0, 30, 50, 100, 150m and bottom depths for the 15th of February, May, August and November corresponding to the winter, spring, summer and fall seasons.
The report is currently under review and will appear in the series Canadian Technical Report of Hydrography and Ocean Sciences early in 2003.
Discussion:
G. Harrison inquired about what factors may be regulating the depth of the nutricline in the GSL, which does not appear to be driven by biological processes. B. Petrie indicated that advective processes and circulation would be important in this region and likely differ in more oceanic locations. D. Gilbert expressed interest in the production of the atlas, which provides information about scales of variability and where limitations are present in the existing data. L. Devine commented about the lack of data in the southern Gulf where data should reside from ships of opportunity collections in this region. B. Petrie indicated they used the database source from P. Strain (Biochem) from the Gulf and Laurentian regions. B. Petrie will look into the availability of the missing data and incorporate it into the existing analysis. K. Drinkwater proposed additional nutrient sensors for additional coverage during the winter period in the southern Gulf. It was commented that this is a general problem in all regions and represents one of the challenges of the AZMP.
Program Review
In the original proposal (Therriault et al. 1998), members of the Atlantic Zone Monitoring Program had identified the need to perform regular reviews of the activities, progress and shortfalls of the initiative. The Chair presented the members with a proposal for a framework under which the review would be undertaken.
The Chair proposed that two constraints should be considered in developing the framework for the review. First, the undertaking should be considered as an internal review of the activities of AZMP. The Chair considered that the external review had already been addressed as part of the FOC-AZMP workshop held in November 2002 when Dr. K. Brander (ICES) and Dr. B. MacKenzie (DIFRES) were invited to as external experts to consult about the relationship of AZMP with FOC and the effectiveness and limitations of the program. Second, the review should not involve an excessive increase in workloads. Whenever possible, the review should make use of existing analyses, data products and evaluations as possible. The review should identify critical elements that require specific attention and analytical approaches.
The approach taken in planning the review was to identify a series of questions that would be addressed, assign leads who would be responsible for the coordination of the response, and the identification of the timeframe under which the process would be carried out. In developing the plan, the Chair and members of AZMP used discussions with some of the Science Directors to identify issues that were critical to an effective assessment of the program. The following identifies the issues that will be addressed as part of the review, the nature of the work to be undertaken, and the members of AZMP responsible for coordinating the review under each item:
[1] Has the AZMP accomplished the objectives outlined in the original proposal (Therriault et al. 1998)?
To address this question requires a brief summary of how or whether each goal outlined in the Therriault et al. report has been accomplished.Lead: P. Pepin; Others: Steering Committee
[2] Does the AZMP meet international principles for long-term monitoring (e.g. GOOS principles of design and implementation)?
In order to be an effective element of a national and international program, AZMP should meet the basic standards set forth by GOOS. Because AZMP has been proposed as a potential Canadian contribution to GOOS, the activities of the program should be assess relative to the GOOS principles of design and involvement.Lead: G. Harrison
[3] Is the current management structure the most effective method to achieve the goals of the program?
The current structure of the program involves a Steering Committee with one representative from each region, and three subcommittee (Data Management, Logistics and Data Analysis). After discussion, the group felt that the current structure was an effective tool for the coordination of the program. However, AZMP is considered to be part of a larger national program. It was felt that AZMP should report to the NSDC rather than the ASDC since the national body has more control of the funding and ship use. In addition, reporting to the national body would generally maintain awareness of the issues facing the environmental monitoring program. Lead: P. Pepin to develop proposal.
[4] Are we meeting our objectives in an effective manner?
To address this issue requires regional assessment of use of personnel and other resources. Each region should therefore conduct a critical assessment of the current activities relative to workload issues and available resources.Lead: P. Pepin with the Steering Committee
[5] Are there other resources (e.g. remote sensing) that could serve to make program more effective?
This section should look not only at remote sensing but also at new technologies such as MPV and ship-mounted thermosalinographs. The review should consider whether such instruments can replace or shorten the field programs in order to improve our efficiency in delivering the program. Leads: G. Harrison and M. Mitchell; Others: J.-C. Thérriault
[6] Are all regions/variables receiving adequate, excessive or insufficient coverage?The work of Brian Petrie and Joel Chassé in examining the representativeness of the SST data is addressing part of this question but more needs to be done. This would also include addressing the questions of areas some groups have felt are undersampled, such as the Strait of Belle Isle and southern Newfoundland. This group should also address whether AZMP is providing adequate coverage for users (e.g. macrozooplankton and other recommendations from the AZMP-FOC wokshop). Lead: B. Petrie; Others: P. Pepin
[7] Is there a duplication of effort (e.g. CPR vs zooplankton sampling)? This is primarily an issue for Newfoundland and Maritimes regions since there is no CPR sampling in the Gulf of St. Lawrence. This has to be made clear to the directors. The question for the other areas is whether the CPR data are representative of what is happening throughout the Newfoundland and Scotian Shelf areas and what is the added value AZMP sampling from the transects and fixed stations. Lead: P. Pepin; Others: B. Petrie
[8] Are we making effective use of all monitoring data being collected from various groups?
There was considerable discussion surrounding this issue. The Chair and M. Mitchell felt that discussions with the Regional Science Director (Maritimes) suggested that there was a desire that AZMP serve as the umbrella organization under which all monitoring would be linked. However, the Chair felt that AZMP should not take on such responsibilities but that it was important that AZMP be linked with the activities of other programs and ensure that we know about them and what they offer. Under this initiative, the review should focus on current and future activities that would ensure maximum communication with various client groups. Lead: K. Drinkwater
[9] Is the monitoring program undertaking work that should be considered as a research activity? (e.g. development of stock-specific data products)
There has been some concern that AZMP activities have been draining resources from research activities. AZMP has been responding for stock or assessment specific indices of environmental conditions but has not been expending resources on attempting to identify environmental influences on individual stocks. The review should highlight the activities of the program to client requests but also provide an explicit explanation of the nature of the work involved and how it does not overlap with research activities. Lead: P. Pepin
[10] Is the program sustainable given current reliance on the combination of AZMP and A-base resources?
The answer to this question is somewhat region dependent. A regional assessment has to be carried out along with item [4]. Lead: Pierre Pepin; Other: Steering Committee
[11] Is the data management meeting the requirements for program?
It is important to determine whether the data management efforts within and outside the program are sufficient to meet the requirements of the program. This would influence the data flow through to the users. Furthermore, the issue of storage of samples of phytoplankton and zooplankton and electronic management of these samples needs to be addressed under this section. Lead: Savi Narayanan
[12] Are data products clearly identified and readily available?
Indices produced by AZMP need to be listed including those on the web. In addition to indices, the review needs to highlight the reports to the FOC. One of the difficulties with the AZMP, as perceived by users and managers, is that specific indices (and their description) were not identified at the beginning of the program. It should emphasized that AZMP produces customized data products in response to request from users and does not itself undertake such developments, although it may recommend actions to users. Furthermore, the review should
L Devine, 28/05/03,
sentence didn’t make sense as it was. I’m not sure if my change confers the intended meaning.
emphasize the longer time and larger space scales being addressed by the program and indices, which are the main focus of AZMP. Lead: G. Harrison
[13] Is the program making effective use of platform availability? Are there issues surrounding Science and monitoring priorities for ship scheduling and ship-of-opportunity activities that would make the program more effective?
The availability of ships is one of the critical issues for AZMP. One of the problems that all regions have experienced is low priority of science by Coast Guard, which has resulted in delays and less ship time than has been requested. In addition, it could help directors understand the seriousness of the problem by informing them of the number of days of ship time that the AZMP has utilized. Lead: J.-C. Therriault; Others: Regional AZMP representatives, regional ship representatives, Mike Gardiner
[14] Are there communications gaps with users and how can the program increase zonal awareness?
It was clear from the AZMP-FOC Workshop that many scientists, especially the assessment scientists, still do not know about the program. A program to increase awareness needs to be developed. Lead: P. Pepin
[15] Is the program providing effective contributions to diverse client groups (e.g. fisheries and the FOC, carbon cycle and climate issues, state of the marine environment) and are there others that not served?
It is clear that AZMP is making important contributions and goes beyond national borders. How the AZMP is contributing to the various groups should be developed. Lead: M. Mitchell
It was also suggested by G. Harrison that the review needs to articulate how AZMP fits into integrated resource management. The Chair suggested that this could be done in the Introduction of the review.
The Chair also suggested that K. Brander’s presentation on the increasing value of time series using the CPR data with length of the program should be part of the review. It was suggested that perhaps a more local example be used using the Scotian Shelf groundfish surveys (K. Frank) or use one of the long term monitoring sites such as Station 27 or Prince 5.
Lead: K. Drinkwater, B. Petrie
There was also concern that the question of maintenance and replacement of hardware was not being considered as part of the review. It was suggested by the Chair to make this an explicit section.
Lead: G. Maillet; Others: Logistic subcommittee
Preliminary science results for 2002: Maritimes (Jeff Spry)
The 2002 Maritimes region program was seriously handicapped by the failure of our spring Scotian shelf survey through lack of an available platform from which to carry out the work. Other vessels of opportunity allowed us to sample at least the Halifax Line at later times and so provide some clues to the shelf status in the first half of 2002. Slow progress with chemical and some biological sample analysis means focusing on physical data at this time.
The most interesting feature of the Scotian shelf data was the presence of distinct warm slope water in the offshore through June. Anomoly plots of early May data show this water to be up to 6 degrees and 1.5 ppt higher than normal. By late June the offshore was still 4 degrees and 1 ppt above normal. By the time of the October survey ,conditions were almost normal and some Labrador water was penetrating farther west along the upper slope.
Of interest also were the striking differences between our fixed station annual regimes both from 2001 individually and from each other in 2002. Halifax 2 demonstrated algal blooms much earlier than in 2001 and before any sign of water column stratification had been observed. Prince 5 did not display an algal bloom until much later than in 2001 and never became stratified, which is a consistent feature of the dynamic system represented there. The algal bloom at the Shediac Station was repeatedly present and intense through the sampling period.
Of interest from the groundfish surveys were the distribution of oxygen 60% saturation limits in July on the Scotian shelf common to the WSW (warm slope water). The 60% saturation boundary was observed at the Shediac Valley and the baie des Chaleurs in September from the SGSL groundfish trip. Similarly, in September the gulf was observed to support a more intense fall algal bloom with broader coverage than usual. Agreement with satellite data was generally good on the Scotian shelf and less satisfactory for colour in the gulf.
Discussion:
K. Drinkwater inquired about the high and sustained chlorophyll a production at the Shediac fixed station and suggested that upwelling might contribute to nutrients. B. Petrie indicated that biological production is strongly tied to physical gradients and advective flow at this site and suggested a comparison between this site and the estuary in GSL region would be interesting. J.-C. Therriault supported the suggestion of upwelling in the lower GSL strongly linked to wind mixing and advective processes. G. Harrison suggested that some effort to be directed to attempting to parameterize the zooplankton stage-specific abundance and biomass data from the fixed sites and transect sections. P.
Pepin indicated ongoing efforts along with G. Evans to evaluate a stage-based model of production investigating pulsed production cycles and survival processes and reiteriated the importance of model fitting. G. Harrison suggested some type of comparison of the CPR (I-IV vs V-VI stages) with AZMP information. D. Gilbert suggested that single time series plots be used for each stage along with different scaling instead of overlapping percentage plots of different zooplankton stages. This would allow better evaluation of the time trends for different stages.
Preliminary science results for 2002: Newfoundland (Gary Maillet)
G. Maillet provided an update of the biweekly time series for optical, physical, chemical, and biological measures collected at the fixed coastal station (Station 27) and reviewed trends during the 2000-02 period.
Time series of optical measures discussed included the vertical attenuation coefficient, euphotic depth, and total daily photosynthetic active radiation (PAR). Trends in the vertical attenuation coefficient indicated a higher extinction of light in the water column based on elevated phytoplankton biomass during the spring bloom in 2002 in comparison to earlier years. Variation in euphotic depth (principally depth of the 1% PAR), derived from vertical attenuation coefficients, showed rapid shallowing (10-20m) during the spring bloom and varied from 40-100m during the summer-winter period. Total daily PAR showed high variability at daily and seasonal intervals. Monthly time series of PAR from 1964-98 showed a maximum annual variability of ca. 25%. The annual climatology for PAR radiation suggested that recent measurements (2001-02) collected at NWAFC station were among the highest recorded during the available time series for the months of April through to October.
Time series of physical measures discussed at the fixed station included integrated temperature, stratification index, and mixed layer depth. Variation in the integrated temperature (upper 50m) showed a consistent heating and cooling cycle with minima reached during late February-March, while maxima were normally observed during September-October. The magnitude of the heating in the upper water column was greatest in 2001, weakest in 2002, and intermediate in 2000. Deeper mixed layer depths extending to near bottom (ca. 175m) at the fixed station were evident in 2001-02 during late winter-early spring, but was particularly weak in 2000 during the same period. Changes in the stratification index showed consistent trends during the 2000-02 time series with minima during winter (January-March), a gradual increase during spring (April-June), maxima during summer (August-September), and rapid decline during the fall (October-December). Although the magnitude of stratification was greatest in 2002, this period showed a more compressed annual cycle compared to earlier years.
Time series of chemical measures included shallow (upper 50m) and deep (50-150m) major nutrient pools consisting of silicate and combined nitrate and nitrite. Both nutrient pools showed a strong positive coupling throughout much of the time series. Time trends showed the expected rapid depletion during the spring bloom in both major pools in the upper water column, gradually increasing during the summer and fall, and periodic intrusions during short-term (e.g. 1-2 weeks) events inferred from advective and upwelling at the fixed station. Deep pools of major nutrients also showed a strong degree of positive coupling throughout the 2000-02 time series. Deep pools for both major nutrients displayed a substantial (near 2-fold) reduction in 2001-02 compared to the 2000 time series. Causes leading to reduction in the deep nutrient pools are currently being explored.
Time series of biological measures discussed included integrated chl a concentration and associated parameterization of chl a profiles, primary productivity parameters, and SeaWiFS Ocean color derived chl a concentrations. Changes in the integrated chl a concentration series reiterated the importance of the spring bloom in the seasonal dynamics of phytoplankton at the fixed station. Background concentrations of chl a typically varied from 0.1-1.0 mg m-3. The distribution of chl a biomass within the water column showed consistent trends during the 2000-02 time series with maxima observed during fall and winter and minima typically during spring and summer. The distribution of chl a biomass within the water column showed lower variability in the later part of 2001-02 compared to the earlier period. The chl a depth maximum series displayed maxima in winter, rapid shallowing during spring and other bloom periods, and then gradual decline through the summer and fall. Overall, average monthly chl a biomass going back to 1993 over the northeast Newfoundland and Labrador shelf showed a weak decreasing trend from the early 90s to recent observations.
The relation between photosynthesis and light for marine phytoplankton at the fixed station was described with two measured parameters: the initial slope () and the assimilation number (Pm
). The initial slope parameter varied from ca. 0.01-0.06 [mg C (mg m-3 chl a)-1 h-1 (umol photons s-1 m-2)-1] during 2000-02 with no obvious temporal trends. The assimilation number parameter series varied from ca. 1-10 [mg C (mg m-3 chl a)-1 h-1] and showed somewhat higher variability in the later part of 2000 and a general increasing trend during the 2001-02 period. Implications of temporal variation in photosynthetic parameters in the dynamics of phytoplankton productivity at the fixed station are currently being investigated.
Bi-weekly composite time series of sea surface chl a data obtained from the Biological Oceanography group at BIO, were described for nine sub-regions covering the south and northeast Newfoundland and Labrador Shelf. The nine composite time series showed interannual variability, seasonality and coherence in the timing of spring and fall blooms along the Newfoundland and Labrador Shelf. Further analyses are currently underway to assist the interpretation of ship-based observations of chl a biomass in this region from the annual surveys.
Discussion:
There was considerable discussion about the availability and quality of PAR data in various regions. J.-C. Therriault was unaware of the status of the PAR sensor in Rimouski. There was a suggestion that an alternative would be to use the data on cloud cover to deal with the lack of information on solar radiation. B. Petrie indicated that there was considerable inter-annual variability in the data available from Halifax Airport. He also pointed out that the spatial scale of the inter-annual variation is unknown. G. Maillet pointed out that there does not appear to be much variation in maximum stratification from year-to-year. G. Harrison indicated that there appeared to be a shoulder in the surface temperature record that was followed by a sharp increase and
appears to be associated with a summer increase in nutrient concentrations. G. Harrison also suggested that the signal in surface salinity could influence estimates of primary production because the freshwater pulse is associated with considerable variation in water colour.
There was considerable discussion about the availability of PAR data from Environment Canada. Because of the potential for inter-annual variation in incident radiation, it was suggested that all DFO stations should be collecting such information if there is no corresponding source from the Meteorological Services.
Climatic conditions in the Gulf of St. Lawrence in 2002. (D. Gilbert, C. Lafleur)
In 2002, winter air temperatures were 0.5°C to 2°C warmer than normal nearly everywhere in the Gulf of St. Lawrence (GSL) except in the Northeast Gulf, where they were close to normal. In the spring, air temperatures were 0.5°C below normal in the northern Gulf and normal elsewhere. Summer air temperatures were normal everywhere in the Gulf. Finally, in the fall of 2002, air temperatures were once again very close to normal everywhere except in the Northeast GSL, where they were 0.5°C below normal. Ice cover area was generally less than the 1962-1987 median during the 2002 winter. As for precipitation, it was lower than normal in 2002, thus leading to a similarly weaker than normal St. Lawrence River freshwater discharge. Preliminary analysis of CTD profiles collected so far in 2002 suggests that water temperature warmed by close to 0.4°C in the 100 m to 200 m layer, which is now 0.3°C warmer than the 1971-2000 normal. In the 200 m to 300 m layer, temperature remained stable, rising by a mere 0.1°C in 2002 to reach 5.6°C, some 0.3°C above the 1971-2000 normal.
In the cold intermediate layer (CIL), early calculations show that the 2002 thickness of waters with temperature colder than 0°C and 1°C has decreased by as much as 15 m relative to the 2001 CIL thickness. However, the Gulf-wide index of mid-summer minimum temperature within the CIL remained rather stable relative to 2001, as it underwent a very slight change from –0.05°C in 2001 to –0.02°C in 2002. Over the 56-year period (1947-2002) over which the CIL core temperature index has been calculated, 30 years were colder than 2002 whereas 25 years were warmer, so that the 2002 CIL minimum temperature is very close to the long-term median. Interestingly, we also note that the 2002 CIL minimum temperature ( –0.02°C) is almost identical to the arithmetic mean of this index over the last 56 years ( –0.01°C) .
Discussion:
The first part of the discussion was to inform Denis that oxygen data collected in the year 1930 in the gulf are available in a technical report. Also, it was suggested that in addition to the CIL core temperature it would be interesting to have the volume of the CIL and the depth of the minimum temperature.
L Devine, 28/05/03,
I thought it was DENIS who informed the group about the O2 data from the 1930s…?
State of phytoplankton in the Estuary and Gulf of St. Lawrence during 2002 (M. Starr, L. St-Amand, L. Bérard-Therriault, L. Devine)
Information concerning the seasonal and interannual variations in the concentrations of chlorophyll a, nitrates, and silicates as well as the abundance of the major species of phytoplankton measured from three fixed stations (Rimouski, Anticosti Gyre and Gaspé Current) and six sections crossing the Estuary and Gulf of St. Lawrence was reviewed. The authors concentrated on conditions prevailing in 2002 but also compared those observations with previous information from the 1992-2001 period.
In 2002, the initiation of the spring phytoplankton bloom at Station Rimouski in the Lower St. Lawrence Estuary occurred in late June, which is near the historical mean date. This contrasts with observations made from 1998 to 2001, when the spring phytoplankton bloom began 6-8 weeks earlier than normal (mid to early May). The return toward the normal phytoplankton cycle in the estuary is believed to be due to the near-normal spring freshwater runoff observed in the St. Lawrence basin in 2002 compared to the 1998-2001 period. The average phytoplankton biomass during spring-summer 2002 at Station Rimouski was also somewhat higher compared to 1992-1994, 1998 and 2000-2001, but much lower compared to 1995, 1997, and, more especially, to 1999.
In the Anticosti Gyre and the Gaspé Current, the depletion of nutrients in the surface layer (0-50m) during spring occurred later in 2002 compared to the 1996-2001 period, suggesting that phytoplankton growth was also initiated later in 2002 compared to recent years in the northwestern part of the Gulf of St. Lawrence. The reduction of nutrients in the surface layer during spring-summer was also somewhat more pronounced in 2002 compared to the 2000-2001 period but much less compared to 1999. Thus on the basis of the evolution of nutrients, phytoplankton production in the northwestern Gulf of St. Lawrence could have been higher in 2002 compared to the previous two years but much lower than for 1999. This is consistent with data from Station Rimouski.
For a second consecutive year, the analysis of community composition in 2002 revealed the massive presence of the diatom Neodenticula seminae in most areas of the Gulf of St. Lawrence, with concentrations up to 1 x 10⁶ cells per liter. This phenomenon is unusual since this species is usually found in North Pacific waters. In the Atlantic Ocean, this species has only been recorded in middle to high latitude Quaternary sediments that were formed between 0.84 and 1.2 million years ago. It is proposed that this Pacific species was introduced naturally into the Gulf (across the Arctic, down the Labrador Current and through Strait of Belle Isle) in 2001, rather than via ballast waters. In support of this, the presence of N. seminae was also detected in the Labrador Shelf waters during spring-summer 2001. The return of N. seminae to the Atlantic coast is consistent with recent observations indicating a greater influx of Pacific waters into the Atlantic and changes in the circulation and oceanographic conditions in the Arctic Ocean.
In late spring 2002, the chlorophyll levels were higher in the southern Gulf of St. Lawrence compared to the previous four years. In the eastern part of the Gulf, the chlorophyll and nitrate levels in the surface layer in late spring 2002 were not notably different than those observed in 1998-2001.
Discussion:
Among questions asked was whether the group would be interested in verifying the presence of Neodenticula seminae in samples collected in the Labrador Sea in 2001 and 2002. G. Harrison also suggested that Michel examine the recent CPR data to verify whether or not N. seminae was present. B. Petrie argued that since N. seminae is a highly siliceous diatom species, it would be interesting to present the temporal variability of the 0-50 m integrated value of the silicate.
State of the zooplankton in the Lower Estuary and the Gulf of St. Lawrence in 2002. (Michel Harvey)
In 2002, the zooplankton biomass in the Gaspé Current and the Anticosti Gyre follow the same pattern of temporal variations as in 1999, 2000, and 2001. The annual maximum and minimum zooplankton biomasses were observed in winter and spring respectively in the Anticosti Gyre while in the Gaspé Current the minimum biomass was observed in winter and the maximum in spring. In the Anticosti Gyre, the zooplankton biomass was higher and lower than usual in winter and spring respectively. The annual mean integrated zooplankton biomass was similar to previous years in the AG and 1.6 times higher than in 2001 in the GC. Likewise, the spatial pattern of variation of the zooplankton biomass observed in spring 2002 along the standard sections was similar to the one observed in spring 2001. The zooplankton biomass was lower in the estuary, the NW Gulf, and the southern Gulf and higher than 2001 in the northern Gulf, Cabot Strait, and along the Anticosti transect.
In 2002 there was a slight increase in mesozooplankton biomass in comparison with 2001 and no variation in the macrozooplankton biomass. The hyperiid amphipods accounted for 30% of the macrozooplankton biomass while the mysids represented less than 17% of the macrozooplankton biomass in 2002 compared to 38% in 2000. There was no change in the euphausiid abundance (M. norvergica and T. raschii) but a significant increase in the mean abundance of the chaetognath S. elegans and of the gelatinous zooplankton (Aglantha digitale, Beroe cucumis, Obelia spp.). Their mean abundance increased from 10 ind. m-2 in 2001 to 40 ind. m-2 in 2002. Likewise, there was no change in the abundance of the hyperiid amphipod T. libellula in 2002 (10 ind. m-2) but a slight increase in the abundance of T. abyssorum. Finally, the mean abundance of the mysid Boreomysis arctica decreased by half compared to 2001 (from 54 to 27 ind. m-2).
Discussion:
The discussion mostly concerned some technical points such as the sampling of the gelatinous zooplankton and the interpretation of the contour plot along a particular transect in the lower estuary without considering the fetch of the tide.


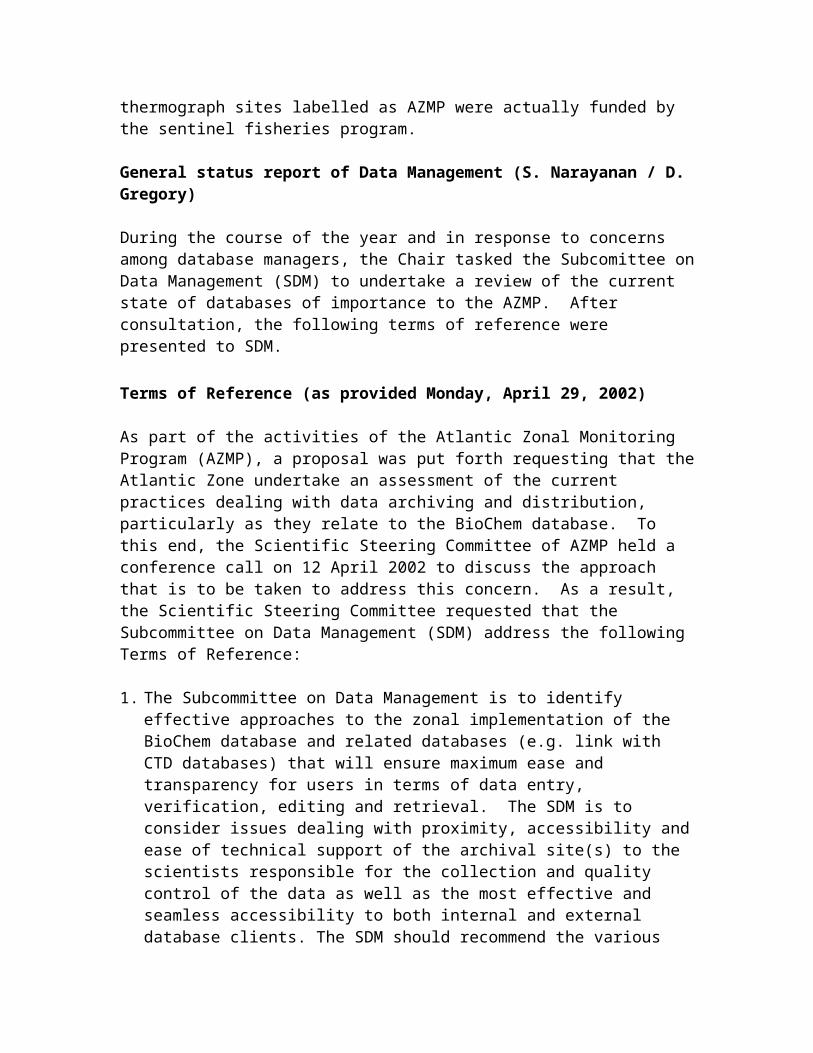
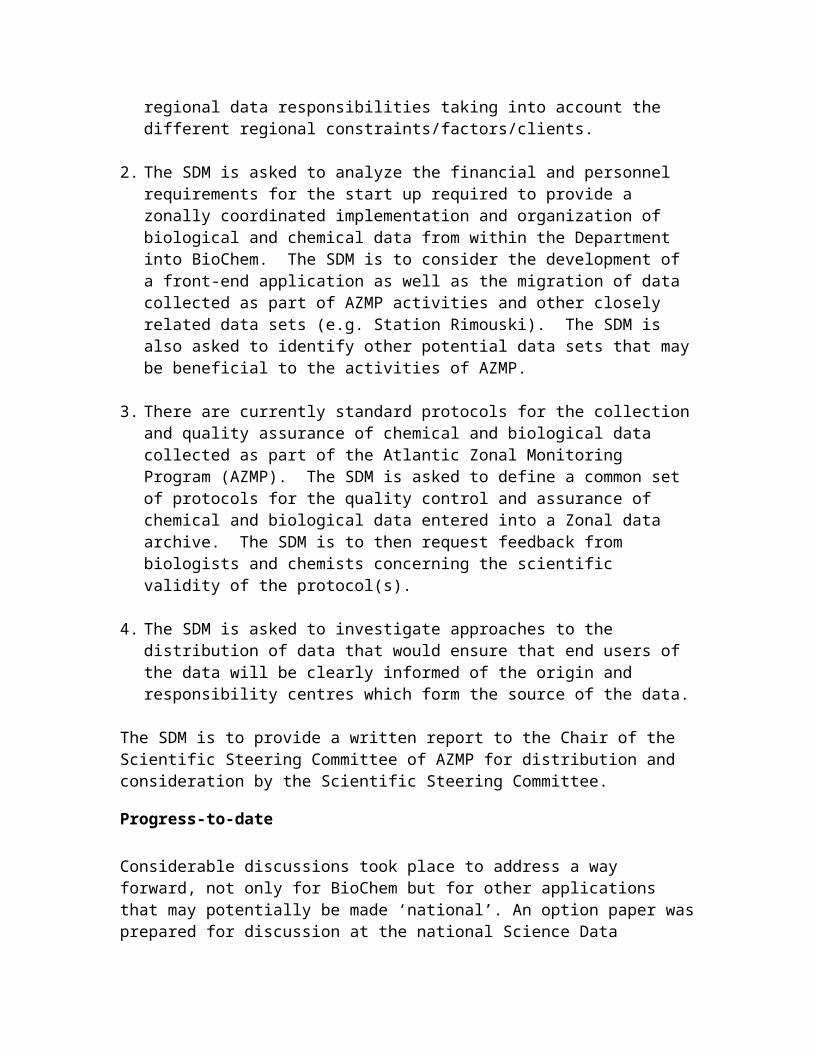
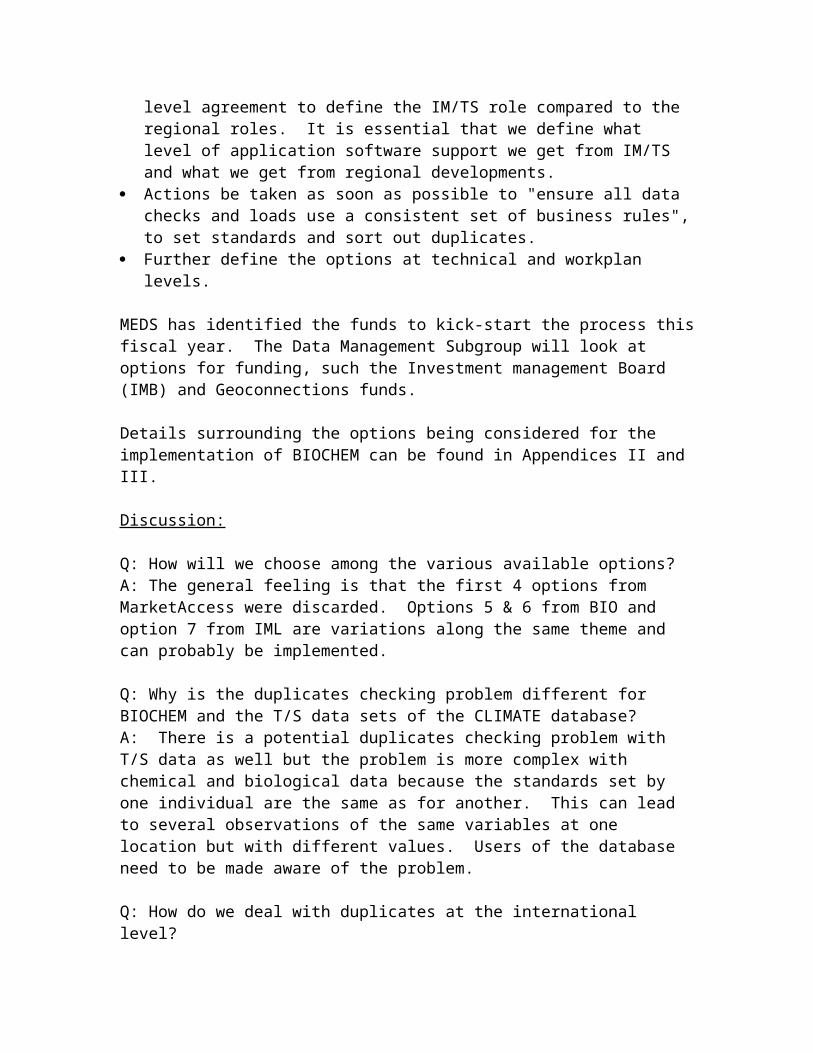
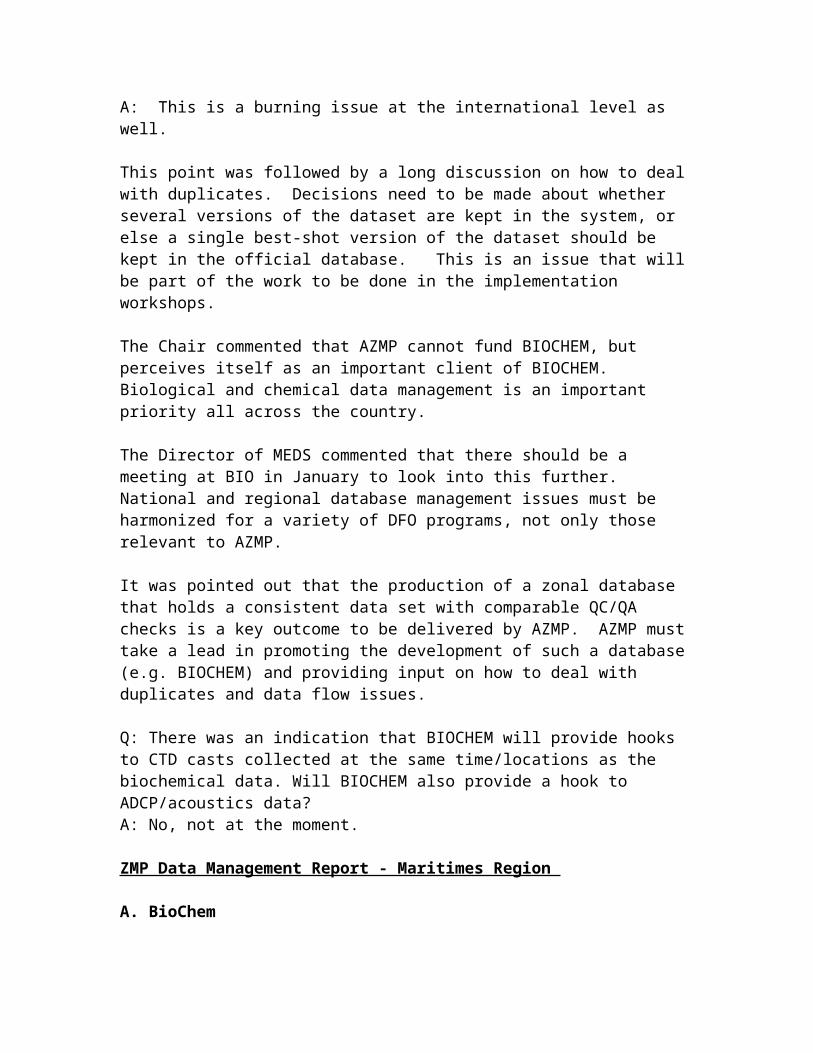


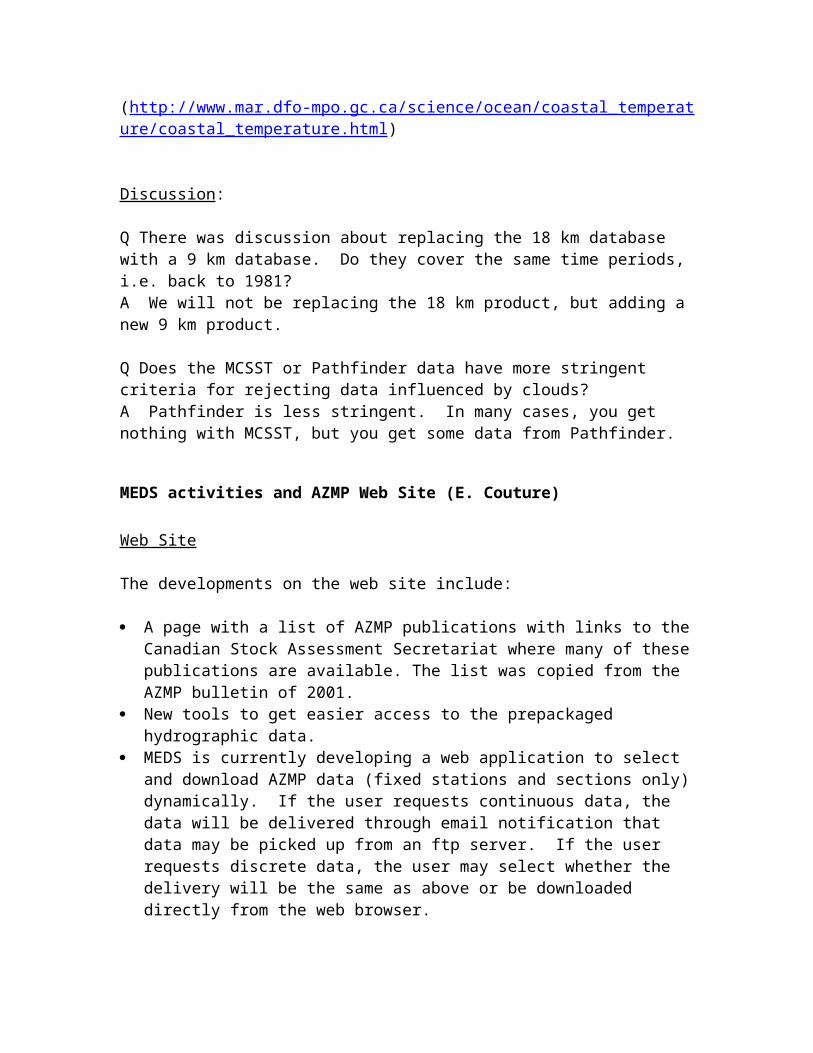
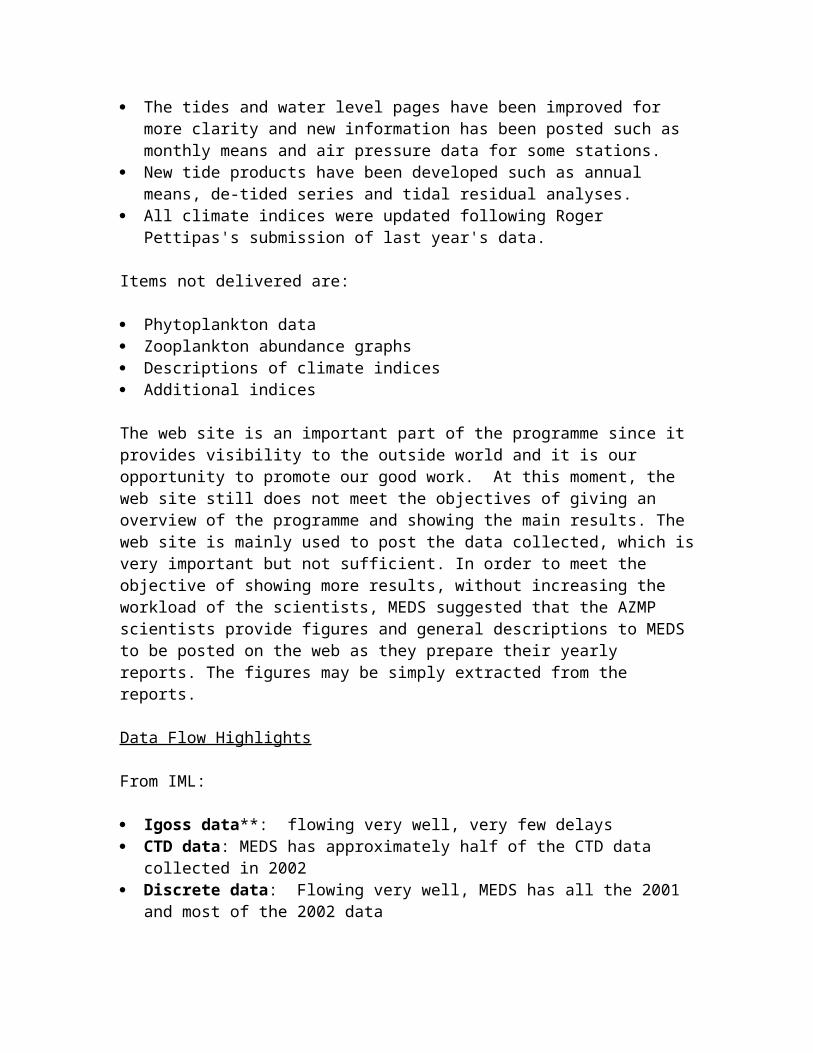
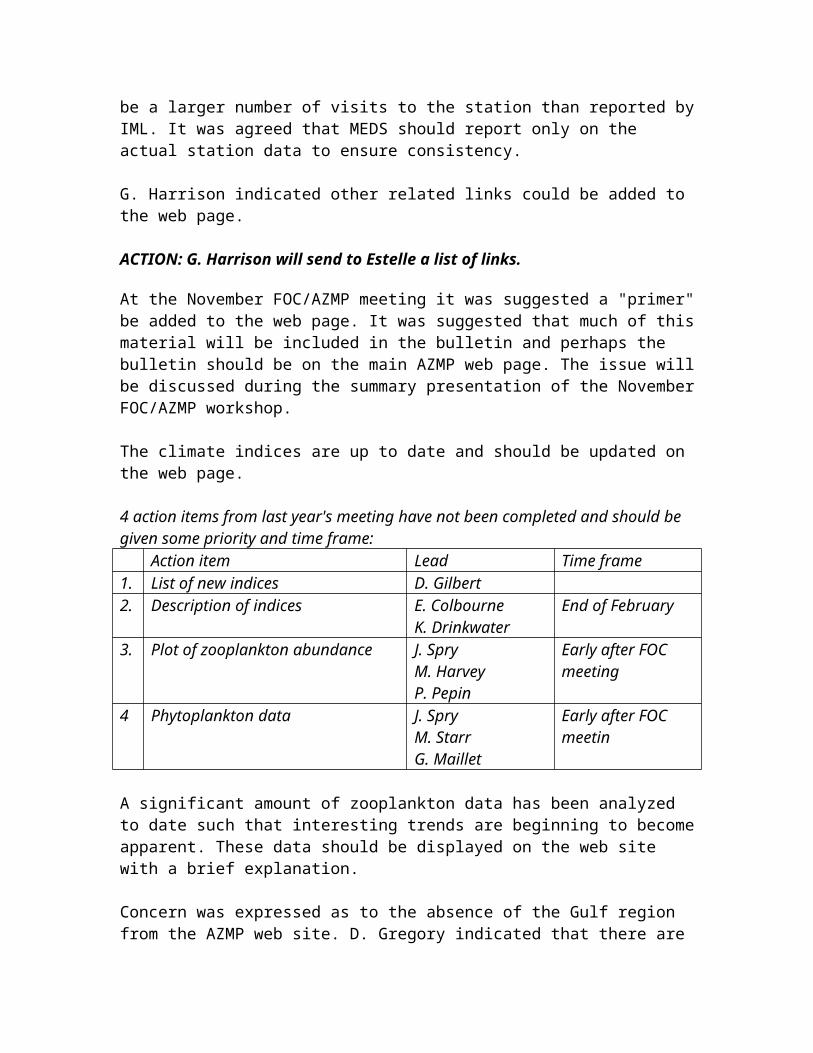


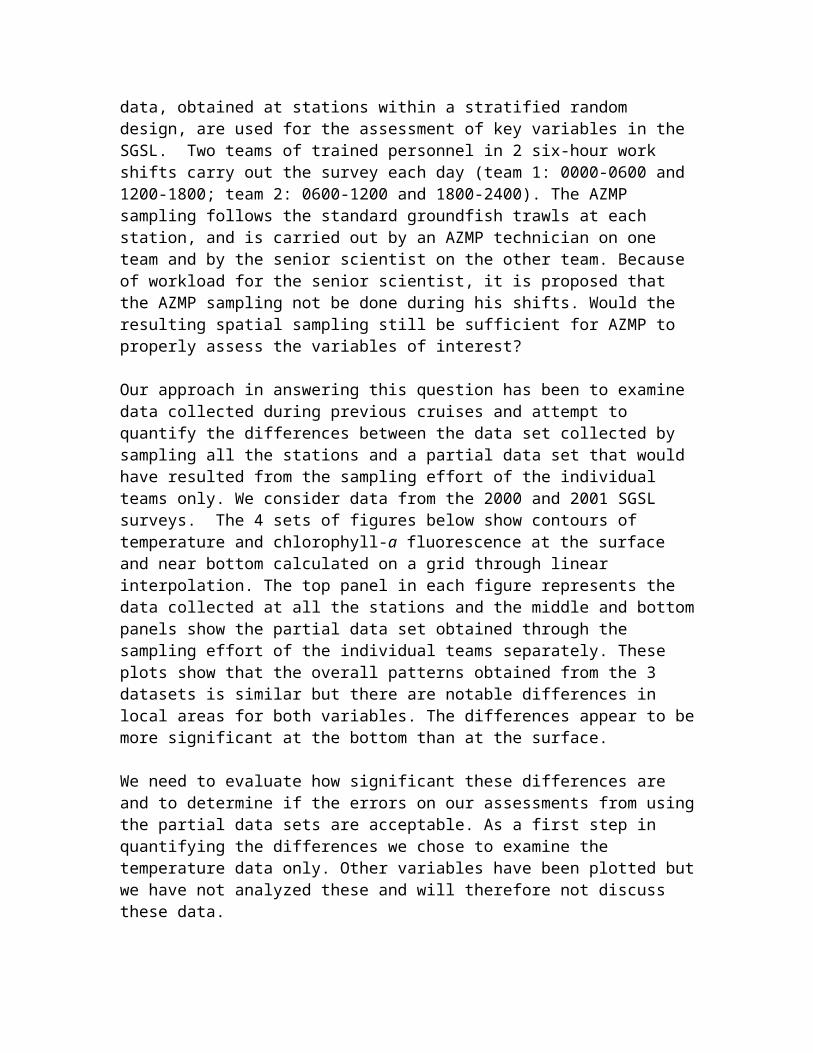

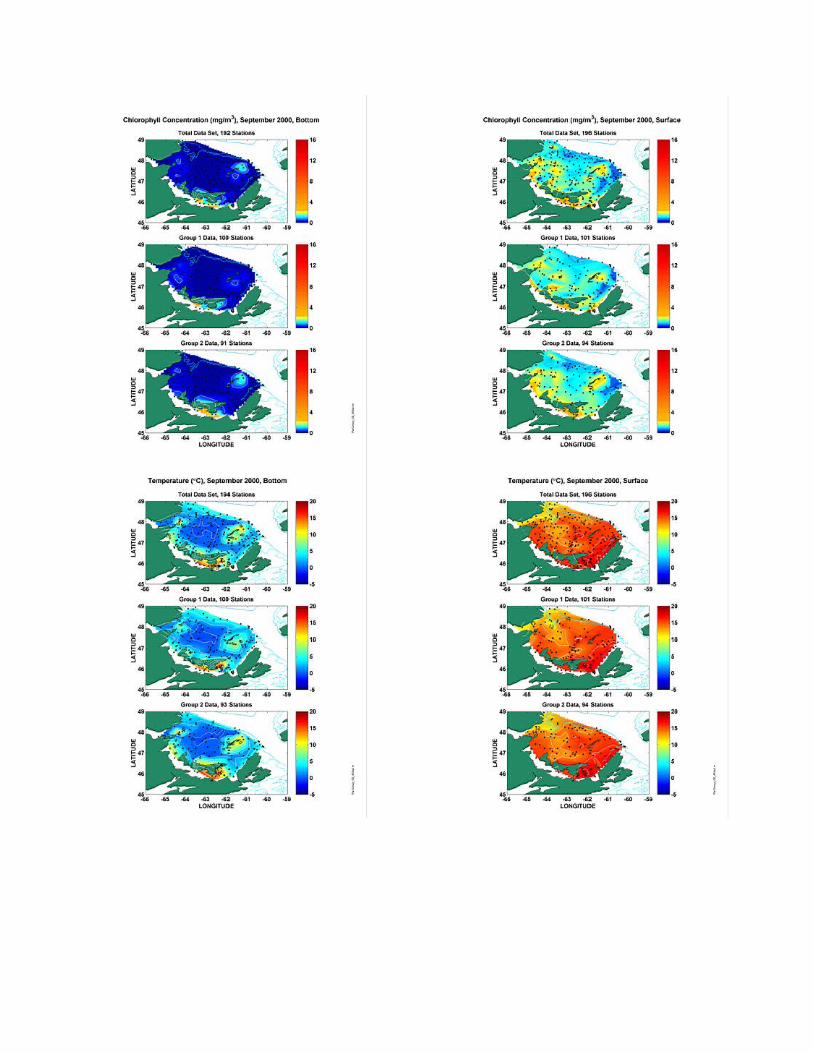
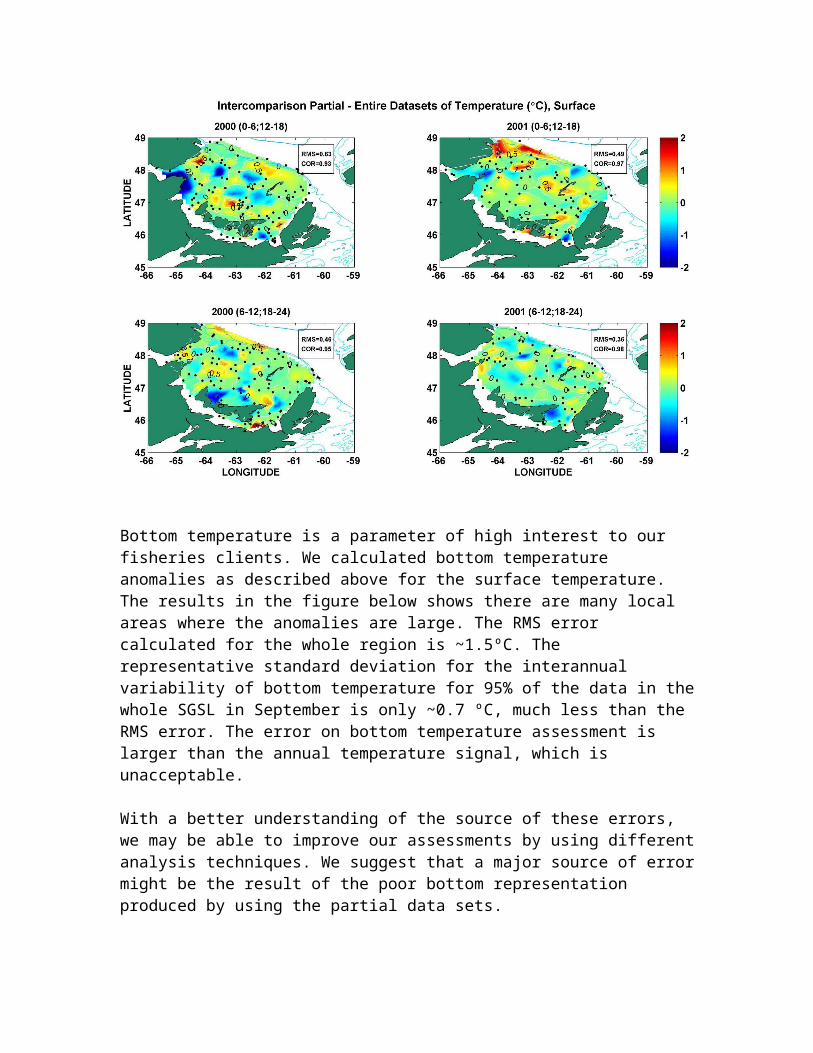


![[MS-AZMP]: Authorization Manager (AzMan) Policy File Format€¦ · 5 / 18 [MS-AZMP] - v20180912 Authorization Manager (AzMan) Policy File Format Copyright © 2018 Microsoft Corporation](https://static.documents.pub/doc/80x56/5ed9330d6714ca7f4769542e/ms-azmp-authorization-manager-azman-policy-file-format-5-18-ms-azmp-v20180912.jpg)

![President of the European Chapter of ISDM, C/O GAETSS, The ... · Adaptive Roadmap (CRe[5] The CRe-AM).-AM project was designed to examine the impact of disruptive digital technologies](https://static.documents.pub/doc/80x56/5f769b115da6496fd970eaf9/president-of-the-european-chapter-of-isdm-co-gaetss-the-adaptive-roadmap.jpg)


![[MS-AZMP]: Authorization Manager (AzMan) Policy File Format... · 2017-06-08 · The AzMan XML policy format is used in order to enable interoperability by implementers. By using](https://static.documents.pub/doc/80x56/5fa596b9a51d0c065530c3f4/ms-azmp-authorization-manager-azman-policy-file-format-2017-06-08-the.jpg)


![[MS-AZMP]: Authorization Manager (AzMan) Policy File Format... · the Microsoft Authorization Manager (AzMan) policy. AzMan policy files are typically used in two ways: 1. Loaded](https://static.documents.pub/doc/80x56/5fa59701e400b433fe529e07/ms-azmp-authorization-manager-azman-policy-file-format-the-microsoft.jpg)