22
Information Literacy Skills of Engineering Students: A Survey Azra Rafique Khalid Mahmood
| Date post: | 18-Dec-2015 |
| Category: |
Documents |
| Upload: | brianne-gloria-hubbard |
| View: | 213 times |
| Download: | 0 times |
Information Literacy Skills of
Engineering Students: A Survey
Azra Rafique
Khalid Mahmood
Introduction
• “To learn each and everything in a limited time frame of
degree course is not possible for students”. (Mahmood,
2013) Librarians can play very important role in improving
information literacy skills of users especially students for
their long life learning.
• The findings may be helpful for library professionals to
design an instructional program to improve students’ such
skills for better utilization of available printed and online
sources.

Objectives of study
To measure the perceived level of Information
Literacy Skills of the engineering students
To identify the relationship between selected personal
& academic variables and the level of information
literacy skills

MethodologyResearch Design
Quantitative research design was selected for study.
Method
• Survey method was used.
Population
All students of 15 engineering disciplines of UET’s
campuses of Lahore, Kala Shah Kaku, Faisalabad
and Rachna were population of this study.
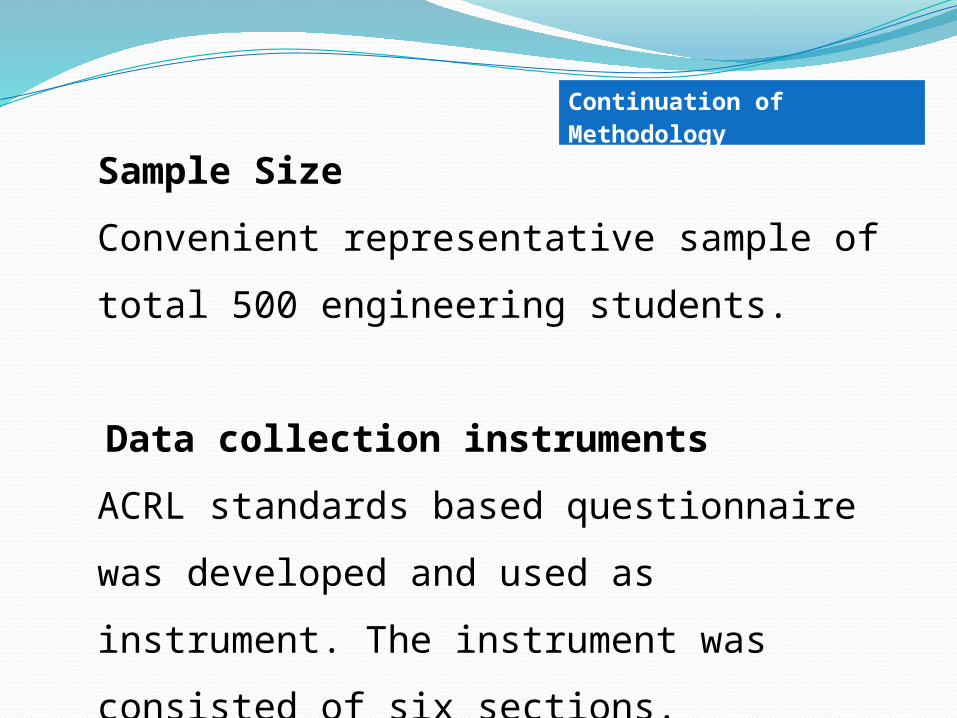
Sample Size
Convenient representative sample of total 500
engineering students.
Data collection instruments
ACRL standards based questionnaire was developed
and used as instrument. The instrument was
consisted of six sections.
Continuation of Methodology

Data Collection
Questionnaire was self administered by the
researcher and 500 questionnaires were
distributed out of which 460 were returned back.
Thus responding rate was 92 per cent of the total.
Data analysis
The data were analyzed by using SPSS Version
20.

Reliability
The coefficient of internal reliability for this
scale, Cronbach’s Alpha, was .967 which
demonstrates that the scale was highly
dependable.
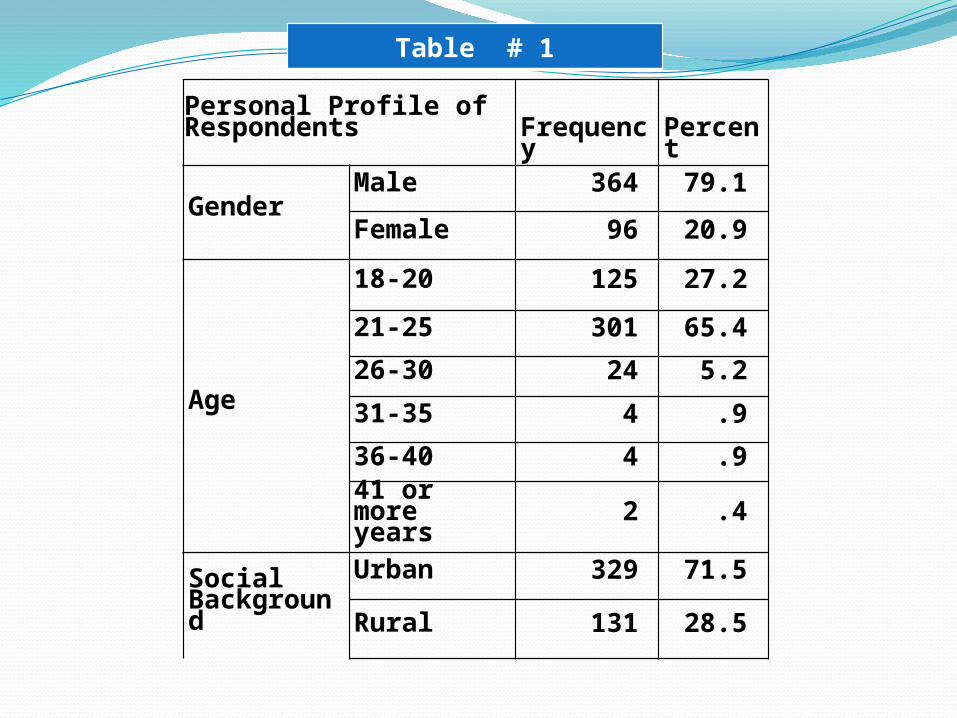
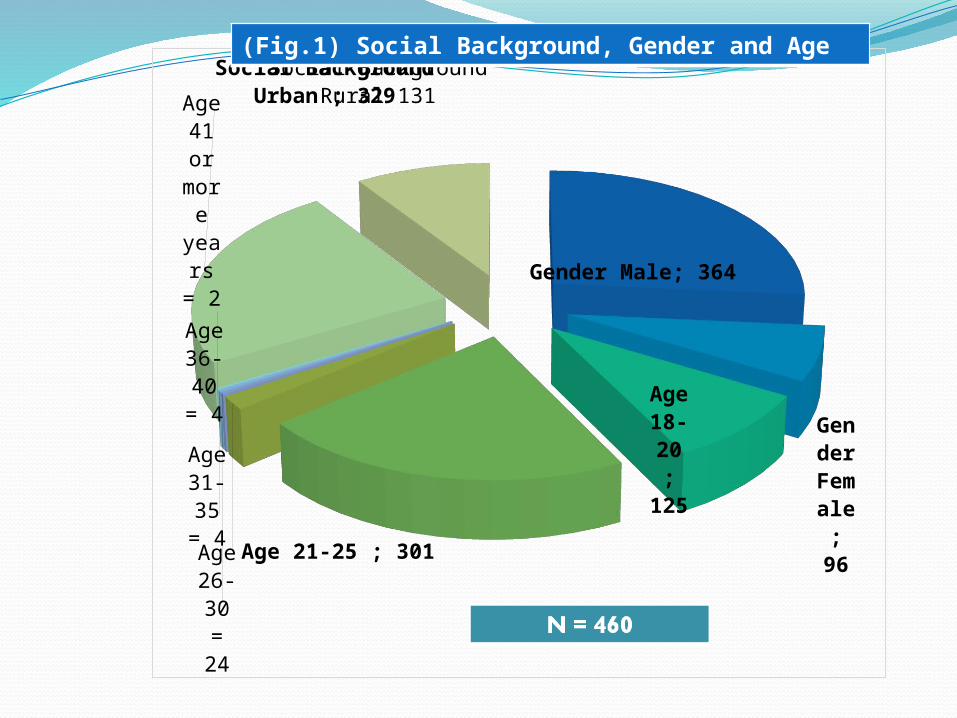
Personal Profile of Respondents Frequency Percent
GenderMale 364 79.1
Female 96 20.9
Age
18-20 125 27.2
21-25 301 65.4
26-30 24 5.2
31-35 4 .9
36-40 4 .9
41 or more years 2 .4
Social Background
Urban 329 71.5
Rural 131 28.5
Table # 1
Gender Male; 364
Gender Female; 96
Age 18-20 ; 125
Age 21-25 ; 301
Age 26-30 = 24
Age 31-35 =
4
Age 36-40 =
4
Age 41 or
more
years = 2
Social Background Urban ; 329
Social Background Rural 131
(Fig.1) Social Background, Gender and Age

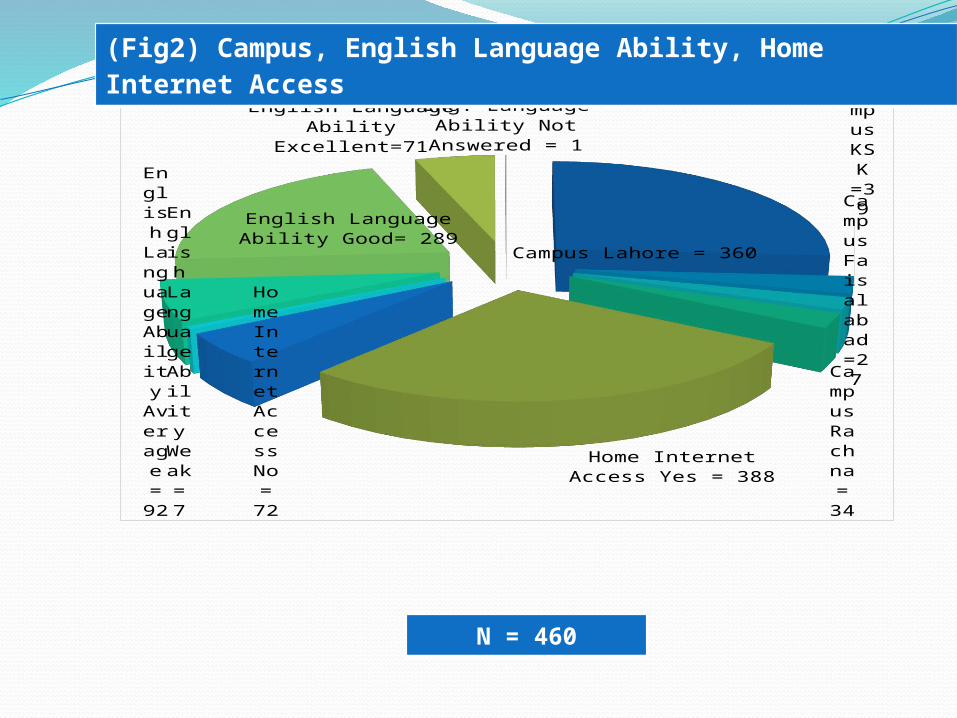
Profile of Respondents Frequency Percent
Campus
Lahore 360 78.3
KSK 39 8.5
Faisalabad 27 5.9
Rachna 34 7.4
Home Internet Access
Yes 388 84.3
No 72 15.7
English Language Ability
Weak 7 1.5
Average 92 20.0
Good 289 62.8
Excellent 71 15.4
Not Answered 1 .2
Table # 2
Campus Lahore = 360
Campus KSK
=39
Campus Faisal-abad
=27Campus
Rachna = 34
Home Internet Access Yes = 388
Home In-ter-net Ac-cess No = 72
English
Language
Ability Weak = 7
English
Language
Ability Aver-age = 92
English Language Ability Good= 289
English Language Ability Excellent=71
Eng. Language Ability Not Answered = 1
N = 460
(Fig2) Campus, English Language Ability, Home Internet Access

Descriptive Statistics
Performance Indicators to: N Mean Std. Dev.
1.1- Define and articulate the need for
information455 3.85 .531
1.2- Identify a variety of types and formats of
potential sources for information440 3.73 .579
1.3- Has a working knowledge of the literature of
the field and how it is produced442 3.70 .656
1.4- Consider the costs and benefits of acquiring
the needed information443 3.62 .701
Valid N (listwise) 410 Avg. .62
Scale: 5=Excellent, 4=Good, 3=Average, 2=Weak, 1=Not at All
Concept Identification
Descriptive Statistics
Performance Indicators to: N MeanStd. Dev.
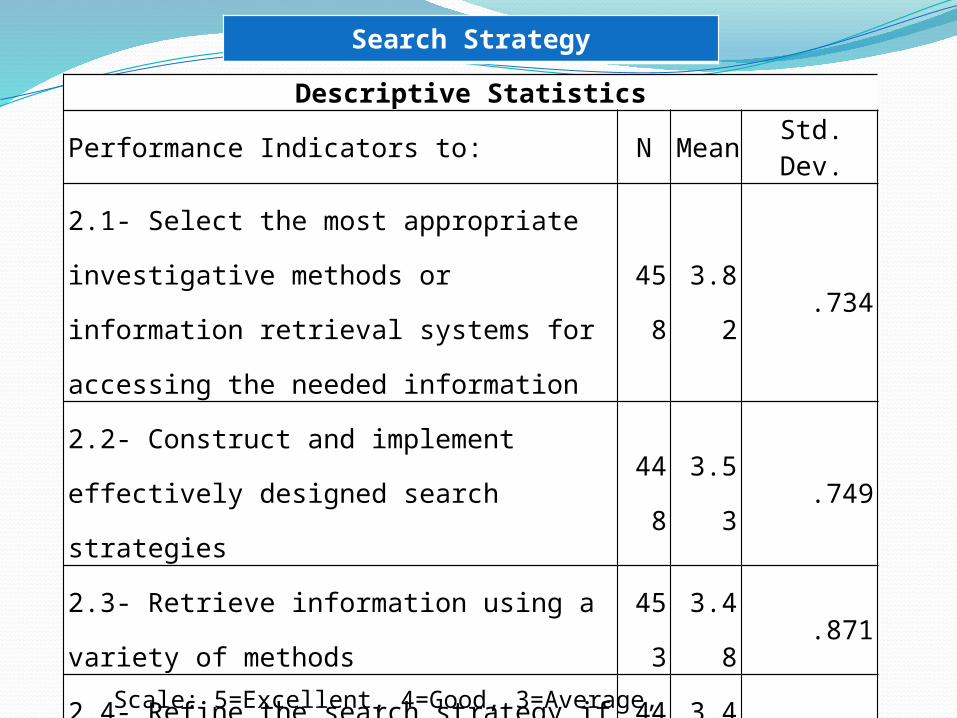
2.1- Select the most appropriate investigative
methods or information retrieval systems for
accessing the needed information
458 3.82 .734
2.2- Construct and implement effectively designed
search strategies448 3.53 .749
2.3- Retrieve information using a variety of
methods453 3.48 .871
2.4- Refine the search strategy if necessary 448 3.48 .889
2.5- Extract, record, transfer, and manage the
information and its sources454 3.57 .807
Valid N (listwise) 425 Avg. .81
Scale: 5=Excellent, 4=Good, 3=Average, 2=Weak, 1=Not at All
Search Strategy
Descriptive Statistics
Performance Indicator to: N Mean Std. Dev.
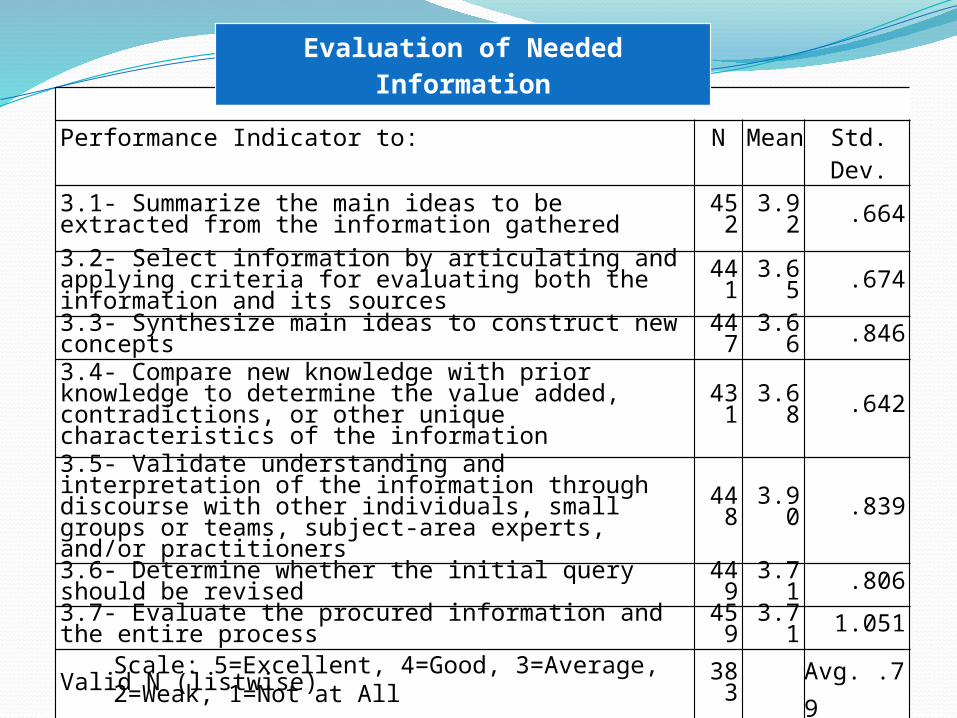
3.1- Summarize the main ideas to be extracted from the information gathered 452 3.92 .664
3.2- Select information by articulating and applying criteria for evaluating both the information and its sources 441 3.65 .674
3.3- Synthesize main ideas to construct new concepts 447 3.66 .846
3.4- Compare new knowledge with prior knowledge to determine the value added, contradictions, or other unique characteristics of the information
431 3.68 .642
3.5- Validate understanding and interpretation of the information through discourse with other individuals, small groups or teams, subject-area experts, and/or practitioners
448 3.90 .839
3.6- Determine whether the initial query should be revised 449 3.71 .8063.7- Evaluate the procured information and the entire process 459 3.71 1.051
Valid N (listwise) 383 Avg. .79
Evaluation of Needed Information
Scale: 5=Excellent, 4=Good, 3=Average, 2=Weak, 1=Not at All
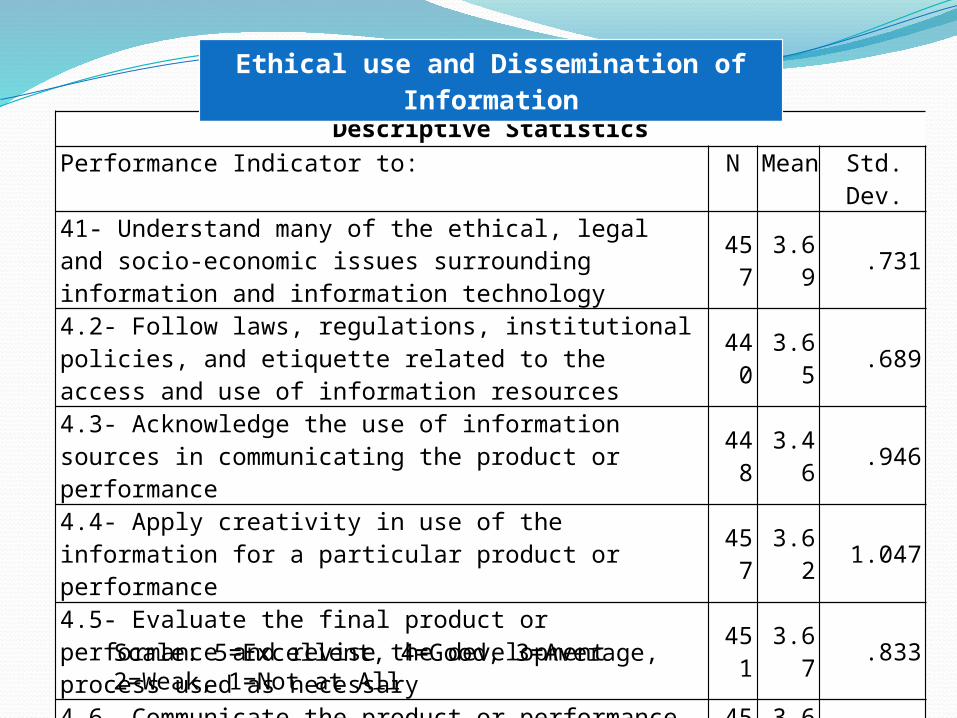
Descriptive Statistics
Performance Indicator to: N Mean Std. Dev.
41- Understand many of the ethical, legal and socio-economic issues surrounding information and information technology
457 3.69 .731
4.2- Follow laws, regulations, institutional policies, and etiquette related to the access and use of information resources
440 3.65 .689
4.3- Acknowledge the use of information sources in communicating the product or performance
448 3.46 .946
4.4- Apply creativity in use of the information for a particular product or performance
457 3.62 1.047
4.5- Evaluate the final product or performance and revise the development process used as necessary
451 3.67 .833
4.6- Communicate the product or performance effectively to others 454 3.68 .755
Valid N (listwise) 413 Avg. .83
Ethical use and Dissemination of Information
Scale: 5=Excellent, 4=Good, 3=Average, 2=Weak, 1=Not at All

Descriptive StatisticsPerformance Indicator to: N Mean Std. Dev.
5.1- Recognize the value of ongoing assimilation and preservation of knowledge in the field
454 3.87 .696
5.2- Use a variety of methods and emerging technologies for keeping current in the field 453 3.54 .827
Valid N (listwise) 447 Avg. .76
Lifelong Learning
Scale: 5=Excellent, 4=Good, 3=Average, 2=Weak, 1=Not at All

Group StatisticsGender N Mean Std.
DeviationStd. Error
Mean
1- Concept IdentificationMale 326 3.73 .502 .028
Female 84 3.69 .552 .060
2- Search StrategyMale 338 3.56 .656 .036
Female 87 3.68 .597 .064
3- Evaluation of Needed
Information
Male 304 3.77 .566 .032
Female 79 3.78 .584 .066
4- Ethical Use and
Dissemination of Information
Male 321 3.65 .608 .034
Female 92 3.60 .676 .070
5- Lifelong LearningMale 347 3.69 .672 .036
Female 94 3.75 .583 .060
Independent Sample T Test – Gender
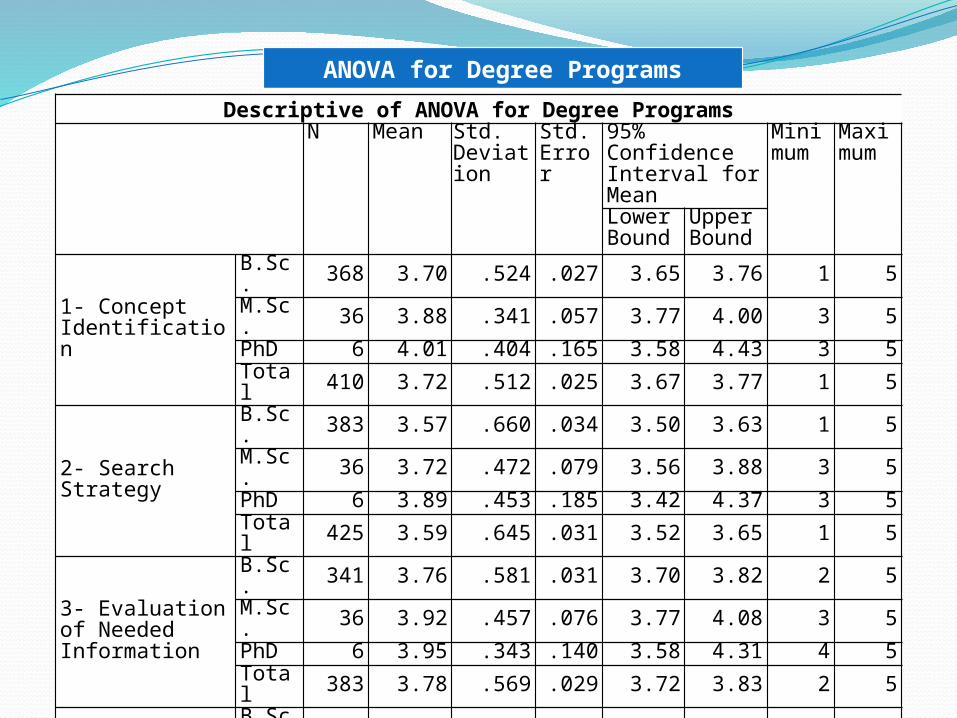
Descriptive of ANOVA for Degree ProgramsN Mean Std.
Deviation
Std. Error
95% Confidence Interval for Mean
Minimum
Maximum
Lower Bound
Upper Bound
1- Concept Identification
B.Sc. 368 3.70 .524 .027 3.65 3.76 1 5M.Sc. 36 3.88 .341 .057 3.77 4.00 3 5PhD 6 4.01 .404 .165 3.58 4.43 3 5Total 410 3.72 .512 .025 3.67 3.77 1 5
2- Search Strategy
B.Sc. 383 3.57 .660 .034 3.50 3.63 1 5M.Sc. 36 3.72 .472 .079 3.56 3.88 3 5PhD 6 3.89 .453 .185 3.42 4.37 3 5Total 425 3.59 .645 .031 3.52 3.65 1 5
3- Evaluation of Needed Information
B.Sc. 341 3.76 .581 .031 3.70 3.82 2 5M.Sc. 36 3.92 .457 .076 3.77 4.08 3 5PhD 6 3.95 .343 .140 3.58 4.31 4 5Total 383 3.78 .569 .029 3.72 3.83 2 5
4- Ethical Use and Dissemination of Information
B.Sc. 372 3.62 .636 .033 3.55 3.68 2 5M.Sc. 35 3.82 .462 .078 3.66 3.98 3 5PhD 6 3.73 .546 .223 3.16 4.30 3 5Total 413 3.64 .623 .031 3.58 3.70 2 5
5- Lifelong Learning
B.Sc. 398 3.69 .667 .033 3.63 3.76 1 5M.Sc. 37 3.80 .498 .082 3.63 3.97 3 5PhD 6 3.71 .611 .249 3.07 4.35 3 5Total 441 3.70 .654 .031 3.64 3.76 1 5
ANOVA for Degree Programs

Findings and discussion
• The engineering students were asked questions about 24 variables of
information literacy skills.
•All the students perceived their skills good according to means score
which remained between 3.92 and 3.46.
•The results revealed that there is no significant difference between
male and female in five major variables of information literacy skills.
•There is no significant difference seen between level of degrees that is
B.Sc., M.Sc. and PhD regarding information literacy skills.

Recommendations
1. More research on this subject for developing the information literacy
culture in Pakistan.
2. An effective instruction program should be designed.
3. Librarian should play an active role for developing such skills.
4. Librarian should try to coordinate with the faculty members for
designing and implementing an effective orientation or instruction
program.
5. An effective policy or framework should be designed at national level
for information literacy skills for all fields of life in Pakistan for
schools, colleges and universities students.
Conclusions
• The study shows that engineering students perceived their skills
overall good in all five variables of information literacy.
•Moreover, there is no significant difference regarding information
literacy skills between male and female students.
•Further, no significant difference was seen in information literacy
skills between levels of study like B.Sc., M.Sc. and PhD.
THANKs


