B. COOLER EXPERIMENT PREPARATION B.1. Introduction, H.O. Meyer During the past year, a large-scale effort has been devoted to the preparation for initial research activity with the Cooler. The equipment constructed had to be simple enough in order to be ready when the beam in the Cooler became available, general enough to allow us to demonstrate that the Oooler is a viable new instrument to study nuclear physics, and specialized enough to answer the need of the first, or first few, approved Cooler experiments. In addition, the same apparatus had to permit an investigation of the interaction between the cooled beam and an internal target during an early phase of Cooler operation. We decided to develop and build an internal gas jet target while at the same time devoting some effort to research in unorthodox technologies involving inhomogeneous tar- gets (fibers, powders). A detector system for scattered particles and reaction products was constructed that completely covers a forward cone of up to 22' opening half angle with the exception of a small central hole for the stored beam. The detector system consists of wire chambers and scintillators thick enough to stop 120 MeV protons. At least six of the early Cooler experiments will make use of this detector arrangement. In the course of the past year, the number of local personnel connected to the ex- perimental aspects of the Cooler has grown; at present the list includes six faculty, staff physicists and research associates, eight students, and five visitors or undergraduates. This project has also presented a considerable work load to the technical staff of the labora- tory. At this time, experimentation with the Cooler is still in the commissioning stage, conducted by a large, local group. This concentrated effort will split into individual exper- iments as understanding of the novel environment grows and the Cooler becomes a user facility. The following represents a description of the components of the apparatus constructed for early Cooler experiments, an account of performance testing and the commissioning of the equipment using the stored, cooled beam, and a report on the preparation of thin internal targets. B.2. Cooler Experiment Equipment B.2.1. Layout of the first experiment (CE-01), H.O. Meyer, P. Pancella, R.E. Pollock, P. Schwandt, F. Sperisen Figure B1 shows a floor plan of the G-section of the Cooler ring with the experimental equipment (June 1988). The jet target is located in the center of the vacuum chamber (see Fig. Bl). It is differentially pumped in four stages upstream and downstream by seven turbomolecular pumps, one cryogenic pump (all on the chamber) and two ion pumps which pump on the beamline about 1.5 rn upstream and downstream from the vacuum chamber, where the pressure has to be at the design value of the ring vacuum (IxIo-~ Torr for Nz). Details of the jet target and its vacuum system are described in Sect. B.4.2.2. below. The target is viewed by a stack of detectors (2) arranged with cylindrical symmetry around the
Transcript
B. COOLER EXPERIMENT PREPARATION
B.1. Introduction, H.O. Meyer
During the past year, a large-scale effort has been devoted to the preparation for initial research activity with the Cooler. The equipment constructed had to be simple enough in order to be ready when the beam in the Cooler became available, general enough to allow us to demonstrate that the Oooler is a viable new instrument to study nuclear physics, and specialized enough to answer the need of the first, or first few, approved Cooler experiments. In addition, the same apparatus had to permit an investigation of the interaction between the cooled beam and an internal target during an early phase of Cooler operation.
We decided to develop and build an internal gas jet target while at the same time devoting some effort to research in unorthodox technologies involving inhomogeneous tar- gets (fibers, powders). A detector system for scattered particles and reaction products was constructed that completely covers a forward cone of up to 22' opening half angle with the exception of a small central hole for the stored beam. The detector system consists of wire chambers and scintillators thick enough to stop 120 MeV protons. At least six of the early Cooler experiments will make use of this detector arrangement.
In the course of the past year, the number of local personnel connected to the ex- perimental aspects of the Cooler has grown; at present the list includes six faculty, staff physicists and research associates, eight students, and five visitors or undergraduates. This project has also presented a considerable work load to the technical staff of the labora- tory. At this time, experimentation with the Cooler is still in the commissioning stage, conducted by a large, local group. This concentrated effort will split into individual exper- iments as understanding of the novel environment grows and the Cooler becomes a user facility.
The following represents a description of the components of the apparatus constructed for early Cooler experiments, an account of performance testing and the commissioning of the equipment using the stored, cooled beam, and a report on the preparation of thin internal targets.
B.2. Cooler Experiment Equipment
B.2.1. Layout of the first experiment (CE-01), H.O. Meyer, P. Pancella, R.E. Pollock, P. Schwandt, F. Sperisen
Figure B1 shows a floor plan of the G-section of the Cooler ring with the experimental equipment (June 1988).
The jet target is located in the center of the vacuum chamber (see Fig. Bl). It is differentially pumped in four stages upstream and downstream by seven turbomolecular pumps, one cryogenic pump (all on the chamber) and two ion pumps which pump on the beamline about 1.5 rn upstream and downstream from the vacuum chamber, where the pressure has to be at the design value of the ring vacuum ( I x I o - ~ Torr for Nz). Details of the jet target and its vacuum system are described in Sect. B.4.2.2. below. The target is viewed by a stack of detectors (2) arranged with cylindrical symmetry around the
Figure B1. Layout of experiment CE-01 in the G-straight section of the cooler. The num- bers indicate: 1. gas jet target; 2. detectors; 3. target gas supply; 4., 5. beam travels from corner 4 to corner 5; 6. shielding wall; 7. mechanical pumps; 8. target control electronics; 9. helium compressor; 10. safety exhaust for flammable gases; 11. detector electronics; 12. cable trays.
beamline. A side view of the target and the detectors is given in Fig. B2. Three arrays of scintillators, labelled 'front', 'E', and 'veto' are described in detail in Sect. B.2.2. The wire chambers, which are of a unique design, feature 4 wire planes with single wire readout and allow the unambiguous localization of multi-prong events (see Sect. B.2.3.). The target is mounted in the center of a stainless steel box with twelve identical access flanges. Reaction products exit the target vacuum chamber through a 130 pm thick stainless steel foil which is brazed to the downstream beam pipe. The latter is composed of sections of increasing diameter which reflects the increase of the beam size with growing distance from the waist (center of the target box). All detectors are mounted on rails and can be moved along the beam axis. Also, the target can be mounted in either the upstream or the downstream position, instead of the center of the target box. This allows one to vary the acceptance solid angle of the detector setup.
B.2.2. Scintillators, K. Komisarsik, J. Vanderwerp, H.O. Meyer, and P. Schwandt
A stack of three plastic scintillator arrays (BC408, Bicron), with rotational symmetry around the beam axis is designed to stop 120 MeV protons. This is required by the first Cooler experiment (CE-01), where the goal is to measure the production of neutral pions close to threshold in the p+p system. A coincidence between the first two or all three of these arrays serves as a fast trigger. The 'front' detector, (see Fig. B2) which is located close to the target box is 1.5 mm thick and has a diameter of 25.4 cm. A central hole of 5.1 cm diameter allows the beam pipe to pass. The stopping (E) detector (diameter 73 cm, thickness 10.3 cm, central hole 8.8 cm) and the 'veto' detector (diameter 76 cm, thickness 0.64 cm, central hole 8.5 cm) are both segmented into octants in a way that allows one to change the size of the central hole, if that should become necessary, by sliding the segments along their edges. The segmentation gives fast information on the charged-particle multiplicity of an event. The front and the veto scintillators are equipped with Hamamatsu R329 photomultiplier tubes. The E scintillator segments are each viewed by two &inch Amperex XP2041 tubes with transistor stabilized bases. A series of tests were conducted parasitically with a proton beam from the Cyclotron. It was concluded that two photomultipliers per E segment, rather than a single one, are required to achieve the light collection efficiency necessary to obtain the desired 3% energy resolution for 100 MeV protons.
The scintillator arrays are mounted on individual supports within a frame around the experimental setup (Figs. B1 and B2). They can be moved along the beam axis in order to adjust the subtended solid angle with respect to the target vertex.
Figure B2. Target chamber and detector stack. The components are labelled in the figure and discussed in the text. The beam is travelling from left to right.
B.2.3. Wire Chambers, K. Solberg, A. Eads, J. Goodwin, H.O. Meyer, T. Rinckel, and A. Ross
July through December, 1987 saw an intense effort put into the fabrication of the wire chambers for CE-01, the first Cooler experiment. This measurement calls for complete coverage in the forward direction. This requirement suggested the use of a single chamber with the unusual feature of a hole in the middle in order to accomodate the beam line downstream from the target; this posed an interesting challenge in detector design.
A hint for a solution of this detector design problem came from the observation that a piece of paper placed on a wire plane of a multiwire proportional chamber could easily be supported by the fragile sense wires. After some development work, the following procedure was adapted for the construction of the wire chamber. First, a wire plane was wound in the ordinary manner onto a frame of G-10. Next, a ring was fabricated from copper clad G-10 with etched pads on which to solder the wires. Using an alignment jig, the ring was then placed precisely in the center of, and underneath, the wire plane. The sense wires were then soldered to the G-10 ring. After this, the wires inside the ring were cut, wrapped around the ring, and glued (for extra holding strength). Figure B3 shows the method of attaching the wires to the center ring. This solution works when the G-10 ring is small and light enough to be supported by the sense wires, and when the tension of the sense wires does not distort the G-10 ring too much. For the CE-01 detector, with a wire spacing of 6.35 mm, only 10 wires are connected to the 3.2 mm thick G-10 ring (outer diameter 69.1 mm, inner diameter 61.9 mm); for this geometry, no problems were encountered.
r S O L D E R PADS
Figure B3. G-10 ring showing the solder pads for the sense wires. The subsequent cut of the wires is indicated by an X.
RlNG
F i ~ u r e B4. Procedure to mount the center nylon ring on the foil planes. a) shows a side view; b) describes the cutting of the hole and c) illustrates the method used to glue the foil overlap.
BALLOON FORCES MYLAR TABS AGAINST EPOXY
GRAPHITE PAINT
NYLON RlNG
BALLOON
c)
Following the same principle, the high voltage cathode planes were equally simple to make. First, graphite was spray painted onto a 0.025 mm thick Mylar sheet. A mask was placed on the Mylar to match the active area of the detector. The Mylar plane was then glued to the G-10 frame using EccobondR 45 'clear' - 15 'clear' catalyst 'rigid' mixture.* Next, a jig was used to place a machined nylon ring onto the plane (Fig. B4a). The ring was epoxied in place using "Epoxi-patchR 907 Greenn.t When the epoxy cured, a gasket punch was used to punch a hole in the center of the Mylar. The Mylar was then cut radially inside the nylon ring every 3 mm (Fig. B4b). A thin layer of ' '~~oxi-patchR 907 G r e e d was placed on the inside of the ring and a balloon was blown up inside to push the mylar against the epoxy-covered nylon (Fig. B4c). The Mylar-epoxy formed an effective boundary to prevent sparking to the center of the hub which is at ground potential. As discussed below, a double window was used to provide a return path for the gas. The inner window was made of clear Mylar, 0.025 mm thick. We first tried to make the inner window with aluminized Mylar but found that with the aluminum coating it was impossible to keep the inner window from getting stuck to the nearest high voltage plane. The outer window is 0.025 mm thick aluminized Mylar. The aluminum acts as a shield against RF noise and diffusion of air into the chamber gas. The aluminum coating on the Mylar also carries the electrical ground to the center of the hub and grounds the aluminum center cylinder of the hub shown in Fig. B5. Both, inner and outer windows are attached to aluminum or nylon rings in the same manner as the cathode high voltage planes.
Figure B5. Cross section through hub region and outer frames. The parts are labeled in the figure. The gas flow to and from the hub region is indicated by arrows.
The assembly of the center hub and the outer frames is shown in Fig. B5. The foot of the aluminum cylinder forms the O-ring surface for O-ring #2 in Fig. B5. The outer surface of the aluminum cylinder forms the O-ring surface for O-ring #1 in the Figure. The pushing ring shown in Fig. B6 was designed to compress the rings together and to compress O-ring #2. When the chamber was assembled, the last piece to be put in place was this pushing ring. The set screws shown in Fig. B6 were turned in just far enough to hold in clearance holes drilled in the aluminum cylinder. Then screws in the holes designated 'compression screw hole' were tightened sufficiently to compress O-ring #2. When the chamber was being designed, it was anticipated that the hub would be loosely
,SET SCREW HOLES ( 6 )
Figure B6. The pushing ring which locks the hub structure into a unit and seals the unit by compressing O-ring #2.
' \COMPRESSION SCREW HOLES (6 )
held in place by the Mylar planes. However, these planes exert very little restoring force to any movement perpendicular to the plane itself. We therefore felt that it would be necessary to use the beam pipe to hold the hub in the precise alignment required for the proper operation of a multiwire proportional chamber. When the wire chamber was filled with gas, we were pleasantly surprised to find that the small pressure from the filling gas pushed out the outer windows and held the hub rigidly in place much the same as a bicycle tire is given shape by the gas pressure inside the tire. We were able to show that this chamber can be safely operated in a horizontal or a vertical position with no support required for the center hub.
The presence of the hub structure presents an obstacle to the flow of the counter gas which in a conventional chamber is from one side to the opposite side. We suspected that stagnant areas might occur under these circumstances. In order to prevent this, the gas is brought in to the center hub between the outside window and an inner window, added for this purpose. The gas then flows radially outward from the center of the hub. The gas flow is indicated in Figs. B5 and B7.
WIRE CHAMBER FRAME
Figure B7 Direction of the flow of the chamber gas.
One problem encountered in this design is that the two outer cathode planes in the center will attract each other if they are at a different potential. Hence, if an x-y pair are both powered separately and a spark occurs in, say, the x-plane, causing the x high voltage to trip off, the y high voltage plane nearest the x-detector will attract the closest x high voltage plane and the two will actually stick together. Usually, the only way to get them apart again is to disassemble the chamber. To avoid this problem, both chambers are operated at the same potential, using only one high voltage supply. The high voltage is set at the value required by the highest plateau voltage of the x-y pair.
The final product consists of a chamber containing an x and y wire plane with an active area of 74 cm x 74 cm. The wire spacing is 6.35 mm. The cathode to anode spacing is 9.53 mm. The inside diameter of the completely assembled hub structure is 57 mm. The outside diameter is 72 mm; this latter number was made as small as possible in order to minimize the insensitive area in the forward direction as well as to minimize the amount
of material to be suspended from wires and Mylar planes. Two such x-y units are required by CE-01; one rotated by 45O around the beam axis with respect to the other.
By the end of December we were successfully operating the CE-01 wire chamber on the bench. An electron beam arrangement consisting of a 'OSr source, a 6 mm slit and two scintillators as active collimators were mounted on a translation table in such a manner that the wire chamber efficiency could be scanned across the edge of the central hole. The plateau voltage for the electrons from the "sr source was found to be 2650 V. The gas used is a 33% Isobutane, 67% Argon mixture bubbled through an Isopropyl alcohol bath held at 10" C.
From these bench tests it followed that the circle in the center of the detector inside of which the efficiency was under 99.9% has a diameter of about 8.6 cm. Due to the intrinsic inaccuracies of these measurements and due to the long time needed to perform the tests, we decided to make use of split beam time in late January and early February to complete the investigation of the wire chamber efficiencies. In-beam tests yielded a somewhat larger diameter of 3.0 cm for the insensitive central region. This value is still acceptable for CE-01.
The first of the two wire chamber units for CE-01 was mounted in the G-section of the Cooler and successfully operated on April 2, 1988 (see Sec B.3). During this test it was realized that it is not possible to operate a wire chamber continuously in the Cooler because of the current drawn due to the high radiation level during stripping injection. It turns out, however, that it is easy to operate the chambers at some safe, low voltage during injection and then quickly (within 250 milliseconds) raise the high voltage to operating level for data acquisition. During this mode of operation the quiescent value of the high voltage has been 1300 V and the operating voltage 2900 V. This operating voltage was chosen to be well above the 2650 V measured on the bench as the lower end of the plateau. This unorthodox cyclic mode of operation, so far (in about 50 hours of operation), has not presented any problems.
* Eccobond is manufactured by Emerson and Cuming, Inc., Canton, Massachusetts. t Epoxi-Patch is manufactured by Hysol Division, The Dexter Corp., Olean, NY 14760.
B.2.4. Data Acquisition, T. Rinckel, H.O. Meyer
In order to minimize the decision making time, the electronics to process the signals from the detectors are located close to the experimental setup. For the first time at IUCF we are making use of ECL-standard modules that are remotely controllable via a CAMAC bus. This system offers great flexibility and is less prone to cabling and logic mistakes; on the other hand, its remote location makes run-time adjusting and checking of timing relations more difficult and special techniques were developed for this purpose.
In principle the electronics for the initial Cooler experimental setup are simple: 28 channels of photomultiplier signals are processed with respect to amplitude and timing, using LRS FERA ADC's and time-to-FERA converters (these devices can be operated in a way to suppress the readout of channels that contain a zero). Logic signals from the scintillators are processed to form a fast trigger to generate an event signal, ADC gates and timing circuit starts and stops. The logic circuit can filter any desired combination of
E segment events and is entirely under computer control. The digital information for each of the 512 wires in the 4 wire chamber planes is read if a valid trigger is encountered. The high-voltage power supplies for the photomultipliers are also computer controlled.
One novel aspect of Cooler experiments which has a profound impact on data acqui- sition comes from the fact that Cooler operation is cyclic. A typical cycle starts with the filling of the storage ring. At this time the gas flow to the target is shut off and since, at least with stripping injection, the filling is accompanied by a burst of radiation, the high voltage to the wire chambers is lowered to the quiescent level. After the desired beam is obtained (i.e. accelerated and cooled) target and wire chamber are turned on and data acquisition is enabled. Since, during the data taking phase, conditions change (at the least the beam current decreases exponentially) it is necessary to record with every event the time elapsed since the start of the cycle. Also, scaler rates have to be recorded with respect to this parameter. The management of the functions throughout the cycle is under con- trol of a timing circuit which is also connected to the CAMAC bus. The data acquisition software used is the program XSYS, which is the prime acquisition system maintained at IUCF. This system is relatively complex and requires some effort by the user but offers very high flexibility. In addition to adapting XSYS to the task of event processing for the Cooler experimental setup, the main software which has been developed involves service subroutines used to download the desired functions into the CAMAC units and to organize display, handling, and saving of this information which represents the actual experiment a1 configuration.
A microVAX ('Europa'), itself a node in the IUCF computer network, is dedicated for Cooler experiments. It is equipped with a 6250 BPI tape drive.
B.2.5 Delta Electron Suppression, M. Minty, H.O. Meyer
The passage of an ion beam through matter is accompanied by the emission of elec- trons. Cooler experiments with thin targets and large solid angles accepted in the forward direction are likely to face this unwanted background. It is likely to become a problem in particular with the Cooler experiment CE-02. In this experiment the effect of a pio- nic atom resonance in elastic proton scattering from 13C will be observed in coincidence with recoiling carbon nuclei at forward angles from 8"-18". At the design luminosity of L = 10~'crn-~s-' the rate of electrons in the carbon detector (an avalanche counter) is expected to be 15 MHz. The energy range of these electrons is 300 keV to 400 keV.
Various methods to remove these electrons while preserving cylindrical symmetry and maintaining an unobstructed view of the target have been considered. A conical electrostatic deflector system can not sufficiently bend the electron trajectories given the finite geometry of the target box in which the detector is to be placed. A solenoid placed around the target with field parallel to the proton trajectory requires too large a field to cause the electrons to spiral through the hole in the center of the detector. We are currently examining the possibility of a magnet array electron suppressor system.
The magnet array consists of eight permanent magnets positioned like the spokes of a wheel symmetrically about the path of the proton beam in such a way that the field is predominantly azimuthal. Preliminary calculations assuming purely azimuthal field lines, z= B(r)@, show that sufficient electron deflection is possible given that we seek to maxi-
mize the B/H ratio while minimizing the magnet volume: eight slabs (25.5 mm x 8.1 mm x 4.0 mm) of SmCo permanent magnets with B/H = 0.26 placed 10 cm downstream from the target deflect all 8-18" electrons away from the detector.
In a test setup, the actual field generated by the magnet array has been carefully mapped and a more realistic calculation has been made using measured values of the azimuthal and fringing fields. Figure B8 depicts 8-18O electron trajectories incident on the field region midway between two adjacent magnets. Again, the results are encouraging. The final support structure has now been machined, and further testing with an electron source will be carried out before the device is used in an actual experiment in the Cooler beam.
B.3. Experimental tests using the Cooler, A. Berdoz, J. Goodwin, H.O. Meyer, M. Minty, P. Pancella, R.E. Pollock, T. Rinckel, A. Ross, P. Schwandt, F. Sperisen
During a two-week shut down in February the target box with the gas jet target and the support structure for the detectors was moved into position in the G-region of the Cooler. Initially only one element of the front, and one element of the E detector were
t l l l l l l I I l l l t l l l l l l l I l l I , I , l i
0 2.5 5 7.5 10 12.5 Distance alonq Beam (cm)
Figure B8. Trajectories of 6-electrons originating from a target at (0,O). The trajectories are calculated using experimental values for magnetic fields obtained from a field map. The stored proton beam (not shown) travels on a horizontal line from left to right. In the upper left corner a sketch of the arrangement of the permanent magnets is shown as seen in the beam direction.
installed. By the end of March elastic scattering of a stored 45 MeV proton beam from Hz, N2, and Ar targets had been observed. Luminosities of up to ~ = 1 0 ~ ~ c m - ~ s - ' at the beginning of a beam cycle were measured. Since this test was carried out with uncooled beam, short lifetimes (50-360 ms, depending on target thickness) were expected. However, an attempt to determine the target thickness from the known Coulomb scattering cross section led to values that were about an order of magnitude larger than what we would have expected based on direct scattering measurements of the jet density using a tightly focussed electron beam (see Sect. B.4.2). This, and the observation of a substantial background in the energy spectrum, raised the suspicion that a large number of the observed coincidences between the front and the E detector did not originate in the target gas itself.
During the next break between Cooler commissioning runs two wire chamber planes were installed in the beam, with a preliminary readout of 16 wires. It was quickly real- ized, however, that the radiation condition that prevails when the storage ring is filled by stripping injection makes the operation of a wire chamber quite impossible. The solution was to change the wire chamber high voltage from a standby value of 1300 V during filling to an operating value of 2900 V during data taking and back for the next fill. It was demonstrated that this can be done with switching times of a few 100 ms and that the full efficiency of the chamber is reached as soon as the voltage reaches the operating level.
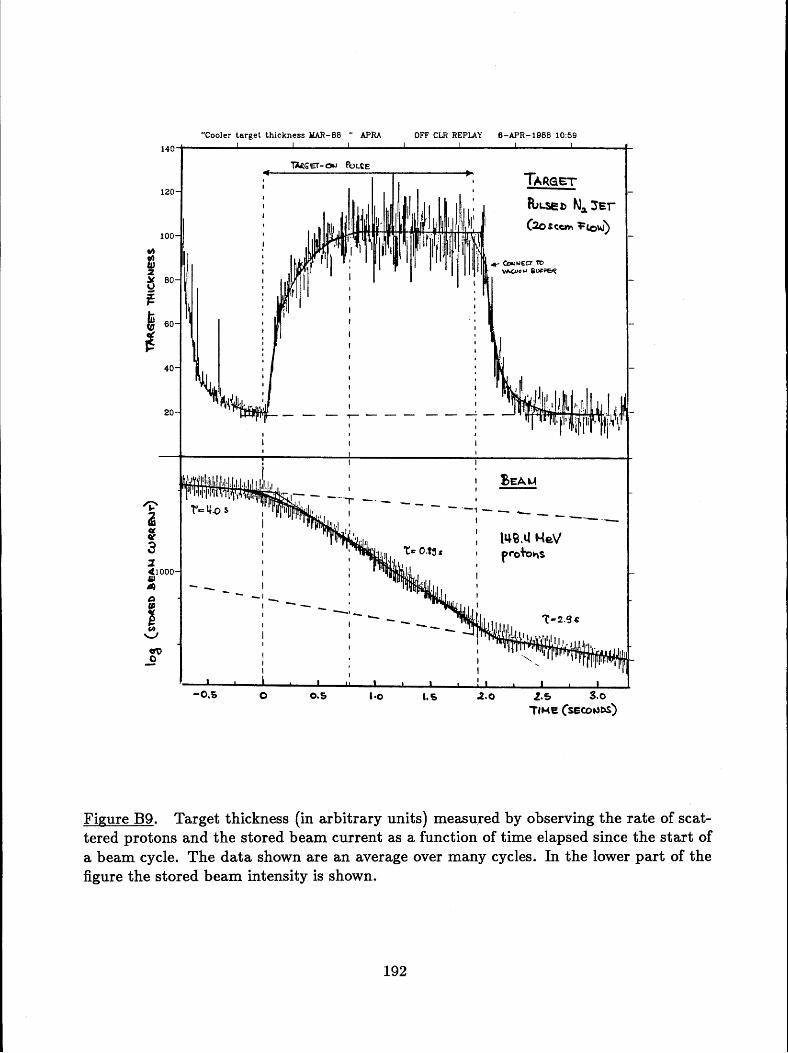
Another difficulty surfaced when an attempt was made to ramp the beam energy to some higher energy (148 MeV was chosen for these tests). Since the beam lifetime at injection energy (45 MeV) was too short with the target present it was necessary to install a fast, computer-controlled switching system to turn the gas flow off for filling and acceleration and on again for data taking. In Fig. B9 the relative target thickness, deduced from the rate of scattered protons is shown on the same time scale together with the stored beam intensity. The latter shows the presence of the target by a distinct change in lifetime. Also indicated in Fig. B9 are the times where the commands for target 'on' and 'off' were issued ('target-on pulse'). It can be seen that the time for the buildup of the full target
I density is about 500 ms.
Electron cooling at IUCF became a reality in the early morning hours on April 16, 1988. The next day, for the first time ever, an internal target was bombarded by a stored, cooled beam of 45 MeV protons. From the initial change in slope of the beam intensity as a function of time a transverse cooling time of about 0.7 s was deduced, in line with the predicted values for electron cooling. Using Hz and N2 as a target gas it could be demonstrated that the narrow energy distribution that is characteristic for a cooled beam persists even in the presence of an internal target. This is a confirmation of a prediction arrived at four years ago during a computer simulation of cooled beam interactions with targets.' The original data in the form of Schottky signals acquired either with an inter- nal target (5 ng/cm2, Hz) or without target are shown in Fig. B10. The energy spread measured is 3.9 keV, or 8 x times the beam energy and is practically independent of target thickness.
At this time, all scintillator elements are in place, two of the four wire chamber planes are operational, and the electronics setup is complete. This allows the start of a detailed investigation of the performance of all detector elements. As an example, Fig. B11 shows the wire chamber position for scattered protons during a run when only every other of the
Figure B9. Target thickness (in arbitrary units) measured by observing the rate of scat- tered protons and the stored beam current as a function of time elapsed since the start of a beam cycle. The data shown are an average over many cycles. In the lower part of the figure the stored beam intensity is shown.
eight E-segments is enabled and can lead to a trigger for the wire chamber. Of great importance now is the assessment and control of the beam position (and
emittance) at the site of the target, in order to identify and remove sources of background which arise from events originating at places other than the target.
I The primary goal of our efforts in 1987 was to have an internal target ready for Cooler commissioning and preparations of the first experiments in early 1988. We have succeeded ~ in meeting this goal by testing and installing a supersonic gas jet target in the Cooler where
I it was exposed to the beam for the first time on March 10, 1988. Below, we first describe
REF 33.8 dB@ ATTEN 0 dB
CENTER 54.68600 MHz (,S4% b & c ) SPAN 10.00 kHz RES BW lea HZ VBW lee HZ
Figure B10. Schottky signals observed with a cooled 45 MeV proton beam with either a 5 pg/cm2 Hz target or with no target. The presence of the target has very little efect on the narrow beam energy distribution. Shown here is the first such measurement (April 17, 1988).
"APRK TEST RUN " APRK Run 38 OFF CLRd:l ONLINE 2 3 - A P R - 1 9 8 8 1 8 : 0 5
Figure B11. Distribution of events observed with the wire chamber. Only four of the eight E detector segments are enabled and can lead to triggers for the reading out the wire chambers.
the development of the components of the gas jet, and then the design and performance of the actual target. A considerable amount of effort has also been expended in the development of microparticle targets. With the jet now operational, work on these "dust" targets has become our highest priority. Although several approaches have been pursued unsuccessfully, recent progress with a new scheme has brought us a step closer towards the realization of a microparticle target. Sect. B.4.3. is devoted to these developments. Finally, in Sect. B.4.4., we report our work with carbon foil strips and stripper foils. This has been pursued with low priority in the last year, but will receive more attention in 1988.
B.4.2. Gas Jet Target, F. Sperisen, A. Berdoz, J. Doskow, P. Li, W. Lozowski, H.O. Meyer, P. Pancella, T. Rinckel, and A. Ross, - IUCF; R. Barbieri and R.A. Bonham - IU Chemistry Department
B.4.2.1 Gas jet development
Our effort towards an internal gas target has been initiated and guided by the require- ments for the first Cooler experiment, CE-01, which calls for an Hz target, 1014 atoms/cm2 thick. Initial studies in 1986' showed that a 10 cm long storage cell, cooled to 20 OK, with
apertures large enough to clear the worst-case envelope of the uncooled beam, could serve as such a target. While this simple approach would have satisfied the minimum require- ments of CE-01, we expected that a gas jet would make a more localized and, for a given gas load to the Cooler ring, also a thicker target. Basically, two different types of gas jets have been used as nuclear targets. (i) Cluster jets3 are designed to keep the gas load to the beam line to a minimum by "skimming" some 99% off the molecular beam before it reaches the target region. This results in well localized (a few mm) targets in a high vacuum (< Torr) with relatively large clearance (several cm) for the beam. On the other hand, the maximum thickness is limited to about 4 x 10¹⁴ H atoms/cm2. This kind of jet has commonly been used as internal target in high energy accelerators. (ii) The other type of jet target is typically found in extracted low energy beams.4 The ion beam crosses the supersonic jet very close (a few mm) to the nozzle where the gas density is high. Such targets are relatively thick (typically 1017-1020 atoms/cm2), but leave little clearance for the beam (a few mm) and one has to deal with a relatively large gas load to the beam line. Based on a feasibility study4 we expected that the required clearance for the Cooler beam (10 mm vertical at the center of the G straight section) and the ring vacuum (lo-' Torr Nz, Torr Hz) would allow us to build a type (ii) jet target and achieve a thickness considerably above that of the best existing cluster jet. However, since the requirements for our internal targets are much different from those used in extracted low energy beams, experimental development and testing was neccessary. The following three problems had to be studied before we could begin with the design of the actual target. (1) Optimization of nozzle/catcher tube geometry, with the goal of minimizing the gas load to the Cooler ring. (2) Direct experimental verification of expected jet thickness. (3) Nozzle cooling; effect on jet shape.
Following is a brief description of these experimental studies and a summary of their results.
Optimization of nozzle/catcher tube geometry. The experimental set-up used for these investigations is shown schematically in Fig. B12. A nozzle is mounted on a side flange of a cylindrical vacuum chamber. The expanding jet is caught in a catcher tube which is pumped by a 500 11s turbomolecular pump (Balzers TPU 510). The part of the gas not removed through the catcher tube is pumped by two 1500 11s turbo pumps (Balzers
Figure B12. Schematic of the experimen- tal set-up for nozzle/catcher tube geome-
/ \
p +500tls try optimization. (See text for details).
TPU 1500), mounted on the axis perpendicular to the jet. The pressure pl in the chamber is measured by an ionization gauge, while a capacitance sensor (MKS Baratron) is used to measure p2 in the catcher tube. The gas flow rate Q, through the nozzle is controlled and measured by a flow meter/controller (Vacuum General UltraFlo UC); the corresponding pushing pressure p, is monitored by a Granville-Phillips Convectron gauge. The goal of our measurements with this set-up was to measure and maximize the fraction f of the gas flow removed through the catcher tube, thus minimizing the gas load to be pumped differentially along the Cooler beam in the actual target. This fraction was determined from f = Q2/Qo, where Q2 = p2S and S is the pumping speed of the TPU 510. The latter was measured using the same set-up (Fig. BIZ) with the two 1500 11s pumps turned off, so that Q2 = Q, and thus S = Qo/p2. Alternatively, f could be obtained by observing pl with open (TPU 510 on) as well as closed catcher tube. This pressure ratio equals 1- f assuming constant pumping speed of the 1500 11s turbos as well as good linearity of the ionization gauge over this pressure range (typically 50-300 pTorr). In the case of hydrogen, these assumptions seemed to be violated, while for nitrogen the results for f from the two methods agreed very well. The nozzle was connected to a push-pull feedthrough which allowed for easy adjustment of the distance between nozzle exit and entrance of the catcher tube (this distance defines the clearance for the Cooler beam).
Fourteen different combinations of six nozzles and five catcher tubes have been studied. The six nozzles varied considerably in material, geometrical shape and surface quality. They were all circular in cross-section, with throat diameters between 0.10 and 0.23 mm, diverging over about 5 mm to exit hole diameters between 0.9 and 1.9 mm. Two nozzles were machined from aluminum at Oak Ridge National Laboratory; another two were pre- machined locally from copper with holes laser-drilled by a contract~r .~ The last two nozzles used in our test series were made by us from Pyrex glass capillaries. Inspection under the microscope showed very rugged surfaces for the metal nozzles, in contrast to the smooth surfaces of the glass nozzles.
The first catcher tube used in our optimization studies was cylindrical, 25.4 mm in diameter and 127 mm long. The other four catcher tubes were all of a conical shape as shown in Fig. BIZ, with diameters at the entrance from 11.8 to 29.2 mm, increasing to 115 mm at the cylindrical part of the tube. The angle of the cone was chosen such that its (imaginary) tip is at the nozzle exit for d = 10 mm.
The results can be summarized as follows:
e Given the considerable differences among the nozzles used (material, geometry, surface quality), their effect on the catching fraction f was generally found to be quite small (at flow rates Q, approximately 45 cc/min). Especially for hydrogen jets, and with catcher tubes roughly matched to the jet (at d = 10 mm; see below), the results for f were practically the same with all nozzles. (The distance d between nozzle and catcher tube was varied between 5 and 20 mm). Even for unmatched tubes, i.e. entrance diameter too large (29.2 mm) or too small (11.8 mm), f differed by no more than a few percent. A somewhat more pronounced influence of the nozzle geometry was observed with N2 jets. These seem to be more diffuse from nozzles with small divergence. For example, the nozzle with the smallest divergence (ratio of exit-to-throat diameters = 3.9) produced a jet for which f = 61%, compared with
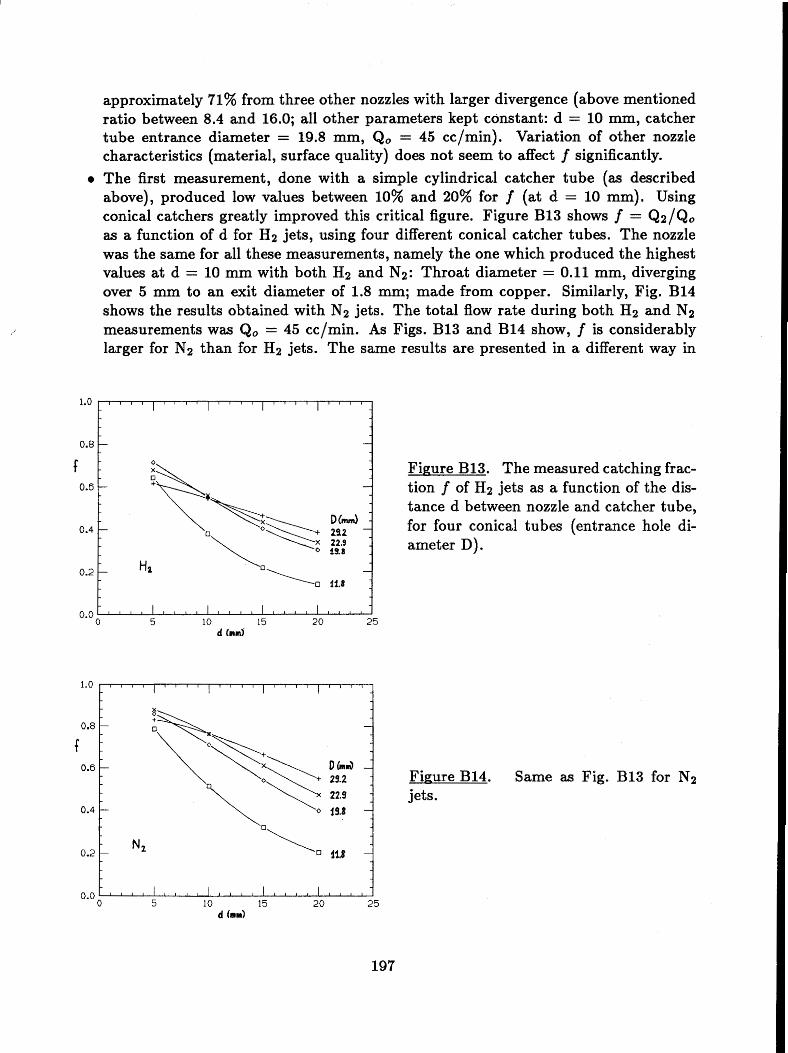
approximately 71% from three other nozzles with larger divergence (above mentioned ratio between 8.4 and 16.0; all other parameters kept constant: d = 10 mm, catcher tube entrance diameter = 19.8 mm, Q, = 45 cc/min). Variation of other nozzle characteristics (material, surface quality) does not seem to affect f significantly.
a The first measurement, done with a simple cylindrical catcher tube (as described above), produced low values between 10% and 20% for f (at d = 10 mm). Using conical catchers greatly improved this critical figure. Figure B13 shows f = Q2/Qo as a function of d for Hz jets, using four different conical catcher tubes. The nozzle was the same for all these measurements, namely the one which produced the highest values at d = 10 mm with both Hz and N2: Throat diameter = 0.11 mm, diverging over 5 mm to an exit diameter of 1.8 mm; made from copper. Similarly, Fig. B14 shows the results obtained with N2 jets. The total flow rate during both H2 and N2 measurements was Q, = 45 cc/min. As Figs. B13 and B14 show, f is considerably larger for N2 than for Ha jets. The same results are presented in a different way in
1.0 ~ I I I , ~ I I I ( I I I I ~ I I I I , 1 1 1 1
0.8 - -
f :
F i ~ u r e B14. Same as Fig. B13 for N2 x 22.9 - jets.
1 Figure B13. The measured catching frac- - tion f of Hz jets as a function of the dis-
tance d between nozzle and catcher tube, - for four conical tubes (entrance hole di-
ameter D). - Ha
11.8
" " ~ " " ~ " " ~ ' " ' ~ " " 0 5 10 15 20 25
d (nn)
Figure B15. The measured catching frac- tion f of H2 jets as a function of the solid angle R subtended by the intake tube, for four conical tubes (entrance hold diame- ter D).
0.8
f 0.6
Figure B16. Same as Fig. B15 for N2 jets.
0.2 0 113
Figs. B15 and B16. Here, f is plotted against the solid angle R which is subtended by the catcher tube. If the jet molecules would move away from the nozzle in straight flight paths, and if there were no backstreaming of gas from the catcher, then f would be expected to depend only on R, i.e. all curves for different catchers in Figs. B15 and B16 would coincide. Obviously, this is not the case, and we observe again a quantitative difference between the two gases. The curves converge towards smaller solid angles, suggesting that the high density "coren of the jet is caught more efficiently by the catcher than the lower density fringe where backstreaming from the tube might lower the catching efficiency.
Yet another difference between H2 and N2 jets was found in the dependence of f on the flow rate Q,. For example, lowering Q, from 45 cc/min by a factor of 2, resulted in a drop in f by only about 1% for Hz, but by 7% for N2 (at d = 10 mm, nearly independent of catcher tube geometry).
Jet density profile measurements. In a separate experiment we have measured one of the most important design parameters, namely the jet thickness or area density. A beam of 25 keV electrons was scattered elastically from the jet into a detector set at about lo. The counting rate was calibrated by replacing the jet by a gas cell of measured density. Details of this experiment, carried out on a presision electron spectrometer at the IU Chemistry Department, have been described elsewhere? By moving the jet through the electron beam we obtained area density profiles such as the ones shown in Fig. B17: A hydrogen jet was scanned transversally (x) at different distances (z) from the nozzle tip (the same nozzle as used for measurement of Figs. B13 to B16). The available pumping capacity limited the gas flow rate to 40 cc/min, a factor of five below the maximum rate of the CE-01 jet target. The measured peak densities are in reasonable agreement with the calculation of Ref. 4, in contrast to earlier findings.7 These measurements are currently the basis for determining the thickness of the CE-01 target at room temperature (assuming that the jet thickness is proportional to Q,) .
x (mm)
I h
I 6 J
Figure B17. Density profiles of a Hz jet at different distances (z) from the nozzle. $
0 The flow rate for this measurement (at room temperature) was 40 cc/min, w
whereas with the CE-01 jet target it can 2 1 be up to 200 cc/min, with proportionally -- 3 I
higher densities which can be further in- V, C
I
creased by nozzle cooling. t2 I
1 0
Nozzle cooling. Cooling the jet to a temperature T is expected to increase its density by a factor of 1 1 0 for a given flow rate.4 We wanted to verify, however, that cooling does not lead to a more divergent jet shape, since this effect could lowere the catching fraction and thus offset the benefit from a lower T. For this purpose the nozzle was mounted on a cold head (Leybold RG 1040 closed cycle He expander). Otherwise the set-up was the same as shown in Fig. B12. With the jet cooled to approximately 30 OK for Hz and 100" K for N2, as determined from the decrease in p, at constant Q,, we observed the same catching fraction as before at room temperature.
Conclusion. For N2 jets the fraction f that can be removed by the catcher is con- siderably larger than for Hz jets. In both cases, f shows a fairly smooth dependence on the catcher tube entrance diameter. We find no indication for sharp jet boundaries. For hydrogen, very little influence was observed from the nozzle parameters or the flow rate Q,. Therefore, at room temperature, significant improvement in f for H2 jets seems rather unlikely.
o 2=2 .5 mm - o 2 - 5 . 0 m m
+ 2=7 .5 mm 2- -
[\ - /O%l0
/.4q+z*\Tt - - +"I
3 - a%, - 0 hd"&. .
I I \O*g'*-* .+ I I
- 10 0 10
The calculation in Ref. 4 predicts the jet density fairly well, but it does not account for the observed dependence of f on Q, for nitrogen jets. Cooling is expected to improve the jet density by about a factor of 3 for Hz, and to nearly double the intensity of N2 jets (at constant Q,). The gain could be even larger if clusterization occurs in the cold nozzle. We will soon be able to observe directly the effect of nozzle cooling using elastic scattering of the Cooler proton beam in the CE-01 experimental set-up.
B.4.2.2 The CE-01 jet target
Design criteria. The following Cooler and CE-01 related requirements have been im- posed on the target design:
e Ring vacuum: Torr N2 equivalent (approx. Torr for Hz). e Clearance for the worst-case envelope of uncooled beam (10 mm vertical and 25 mm
horizontal in the center of the G straight section). Minimum target thickness: 1014 H atoms/cm2. Detection of 45 MeV protons at scattering angles between lo and 20°, with full az- imuthal acceptance.
I
Design. Clean detection of 45 MeV protons requires a thin exit window that withstands atmospheric pressure. A thin wall is import ant because of multiple scattering which affects the angular resolution. The closer the window is to the target the smaller its size (for a given solid angle acceptance) and thus its thickness needs to be. On the other hand, space between target and window is required for differential pumping. The available space critically determines the achievable maximum target thickness.
In order to accommodate these competing requirements we chose the following mod- ular arrangement for the gas jet target. Figure B18 shows a side view of its present configuration. The jet is located at the center of a general purpose vacuum chamber, 38 x 38 cm2 in cross-section (inside) and 127 cm long. Each of the four side plates has three 26 cm i.d. port flanges. Internally, the chamber can be partitioned into three sections, each of which has four side ports.
The nozzle (N) is made from copper and has a throat diameter of 0.11 mm, expanding over 5 mm to an exit diameter of 1.8 mm. It is mounted on top of a copper holder which in turn is connected to a cold head (Leybold RG1040). An electric resistance heater, mounted to this holder between coldhead and nozzle allows control of the nozzle temperature between approximately 10 and 100 OK. The temperature is measured by a Lake Shore platinum RTD PT-102. The jet expands vertically upwards and enters the catcher tube (C) 12 mm above the nozzle (entrance diameter of catcher: 22.9 mm). Nozzle and catcher geometry have been optimized to minimize the gas load to the ring. This was done in a separate set-up, as described above. Thus, most of the jet is removed through the catcher which is pumped by a 500 l/s turbomolecular pump (Balzers TPU 510).
The first pumping stage, a 15 cm diameter vertical tube around the jet, is pumped from below by a 1500 11s (1400 l/s for H2) turbo pump (Balzers TPH 1500). Two such pumps are used for the second stage, consisting of a 25 cm diameter horizontal tube, with cylindrical extension ports on the beam axis upstream and downstream. The downstream section of the vacuum chamber serves as a third stage and is pumped by three 1500 l/s
Figure B18. Side view of the CE-01 jet target in its present configuration. Nominal pumping speeds are given for N2; see text for Hz pumping speeds.
turbo pumps, flanged to the chamber on the left, right and bottom. From here, a 203 cm long, narrow beam tube leads through the detector array to an 800 11s (1600 11s for Hz) ion pump (Varian Triode VacIon). This beam tube has been carefully designed to hug the worst-case beam envelope, thus minimizing its conductance (10.4 l/s for Hz, 2.8 11s for N2). Between the target and the exit window downstream, the pumping stages are separated by thin mylar foils, in order to minimize the multiple scattering of reaction products which pass through them. Each of these foils has an oval hole (12 mm vertical and 30 mm horizontal) which allows the unscattered beam to pass unobstructed. Upstream of the target, the gas conductance between pumping states is made much smaller by separating them with tubes for the beam instead of holes. Between the first and second stages, the electrodes of the beam position monitor form an oval tube 7.5 cm long. The second and third stages in the upstream section of the chamber are connected by a 39 cm long oval tube. Because of the low conductances of these tubes, the pressure in the third stage upstream is low enough that it can be pumped by a cryopump (Leybold RPK 3500; 3500 11s for Nz, 4500 11s for Hz). Differential pumping upstream is completed by a 400 11s (800 11s for Hz) ion pump (Varian Triode VacIon), 2.7 m from the target.
The maximum scattering angle is limited by the 26 cm diameter (downstream) exit window (0.13 mm stainless steel wall), the minimum angle by the outer diameter of the beam tube connected to this window. With the jet in its current position at the center of the chamber, these angles are 13.6" and 1.7". The set-up can also be assembled with the jet in the downstream section of the vacuum chamber. This will increase the maximum scattering angle to 22". On the other hand, the smallest angle (1.1") can be obtained with the jet in the upstream section. The maximum target thickness, limited by the differential pumping capacity, depends on the configuration of the set-up. It is largest with the jet in the upstream section because in this configuration the most space is available for pumping the downstream gas flow which is much less restricted than the flow upstream (for the reasons explained above).
In order to maximize the average luminosity the jet should be present only during the actual data taking time of the Cooler cycle, and it should be off during filling, acceleration and cooling, when the beam intensity suffers more from a shorter lifetime. For this purpose the gas flow through the nozzle is controlled by two solenoid valves. One of them opens the inlet line from a buffer tank in which the pushing pressure is maintained at a pre-set value (using a Datametrics controller model 1454 with Barocel 590 capacitance sensor). For fast jet turn-off another solenoid valve opens the nozzle inlet to a relief tank which is kept evacuated. The timing of these valves is provided by a computer programmable CAMAC module (Jorway mod. 221).
Performance. The jet target has been in smooth operation so far for several hundred hours. Cooled and uncooled proton beams have been scattered from hydrogen, nitrogen and argon jets. For these gases we have measured pressures at various locations in the vacuum chamber and its neighborhood in the ring for different nozzle flow rates. Figure B19 shows some results obtained with N2. A pressure increase above the 800 11s ion pump of no more than 1 ~ 1 0 - ~ Torr for N2 or 1 x 1 0 - ~ Torr for Hz is considered to set an upper limit to the flow rate and thus the target thickness. By this standard, our measurements show that, with the target configuration shown in Fig. B18, we will be able to run with a maximum flow rate of 200 cc/min for H2 and 100 cc/min for Nz. (So far, poor performance of the 800 l/s ion pump has prevented us from achieving these values). The maximum target thickness is then expected to be around 2~ 1015 atoms/cm2 for both gases, assuming nozzle cooling. The expected benefit of the latter has not yet been verified directly, but we should soon be able to do so using nuclear scattering of the Cooler beam. At room temperature, the jet thickness for these flow rates is around 9 x 1 0 ' ~ atoms/cm2, as determined by electron scattering.
The fast jet timing system has been operated successfully and proved a very valuable feature, especially for our early tests of the CE-01 set-up. Observation of the scattering rate showed that the jet is turned on and off within about 500 ms (Fig. B9).
1. A. Berdoz et al., IUCF Scientific and Technical Report 1986, p. 116. 2. H.O. Meyer, Feasibility Study for a Cluster Jet Target for the Indiana Cooler, unpub-
lished report, March 1986. 3. See e.g.: W. Tietsch et al., Nucl. Instr. Meth. 158, 41 (1979); H.W. Becker et al.,
Nucl. Instr. Meth. 198, 277 (1982); D. Shapira et al., Nucl. Instr. Meth. 228, 259 (1985).
Figure B19. Pressure measured at various locations in the target chamber and its neigh- borhood in the ring for several flow rates of nitrogen. The peak pressure is measured at the pumping stage around the jet; the coressponding density is still a factor of 50 lower than the density in the core of the jet.
4. D. Shapira and F. Sperisen, IUCF internal report no. 477 (1986). 5. Precision Aperture, Fort Wayne, Indiana. 6. F. Sperisen et al., IUCF Newsletter No. 41, p. 9 (1987). 7. In Ref. 6, mistakenly, a large discrepancy between calculation and measurement has
been reported. This statement was based on an incorrect method of extrapolating measured densities to the nozzle exit (z=O) for a comparison with calculated values.
B.4.3 Microparticle Target, A. Berdoz, J. Doskow, W. Lozowski, T. Marvin, H.O. Meyer, H. Nann, P. Pancella, D. Petasis, T. Rinckel, A. Ross, F. Sperisen, and S. Swamy
The thickness of targets used in Cooler experiments is limited by the cooling force, this constraint rules out self-supporting foil targets. Solid material in the stored beam thus requires unconventional targetry involving inhomogeneous targets consisting of mi- croparticles or fibers. The effort to construct a microparticle target has continued at IUCF throughout this year.
Most of the effort up to date was concentrated on the use of electrostatic forces to either produce a beam of charged microparticles or to confine moving powder in a (windowless) volume.
An important part of our studies was devoted to the process of charging powdery materials. An attempt to charge graphite powder by electron bombardment was not successful. Subsequently, we concentrated our efforts on the charging process proposed by ~helton,' where particles in a strong electric field are charged by ohmic contact with the electrodes. The charging process was measured by observing the current, I, between the electrodes. The influence of the electrode material was found to be rather weak, but the size of the microparticles had a pronounced effect. Using a microscope, we noticed that the shape and size of the dust grains changed significantly when exposed to the electric field for a long time. Most of the rough edges disappeared and the surface of the particles seemed to become smoother. This clarified a previous result where we measured an increase in the current as the particles continued to move about the cavity for several hours.
Naive interpretations of those results were quite unsuccessful. In an initial attempt we used a simple model, where the electric force was the only force acting on the dust. We took the induced current I to be q n v, where n is the number density of the particles, v the particle velocity and q the average charge per particle imparted at contact with the electrode^.^ A charging asymmetry was encountered when we used an A.C. power supply instead of the usual D.C. one. We have even been able to see a cloud of dust moving from one electrode to the other at the same frequency at which the external field changed sign. This implies that the charging process depends on the sign of the charge picked up at contact. This supports a claim by Latham and Brah3 by which the charging is not ohmic but is rather achieved by electron tunneling through the oxide layer on the electrodes and on the surface of the particles.
In order to accelerate the charged particles we first followed a scheme suggested by shelton.' This setup consisted of two coupled cavities, one of which had a hole of 1 mm diameter through which the moving particles emerged. Exiting particles traversed a fo- cussing system consisting of two einzel lenses. We quickly realized, however, that most of the emerging particles settled around the hole and between the stages of the lens system. This phenomenon could be reduced when the voltage of the charging cavity was kept as low as possible and only a very small amount of powder was introduced. The number of particles thus accelerated, however, was less than the desired flow rate by four orders of magnitude. Increasing the amount of powder did not increase the flow rate in the dust beam but led to a large number of weakly charged particles which settled everywhere in the field-free region after the lens.
An attempt to establish a dust-filled volume by trapping the particles between two concave electrodes was initially more successful. The first tests were carried out in air and confinement times of several hours were observed. In vacuum, however, the particles were lost within a fraction of a second through the open gap between the electrodes. This can be understood in terms of the missing viscous damping force in the latter case: transverse velocity components are generated at impact with the rough (on a scale of a few pm) surface of the electrode and build up quickly. We tried unsuccessfully to remove this effect by inserting two grids between the electrodes and applying high voltage in such a way that the particles were first accelerated and then decelerated, before they touched the opposite electrode. Obviously, the air provides a "cooling" mechanism for which we have so far not been able to find a substitute which also would work in vacuum. Nevertheless, we studied the lifetime of the dust cloud in vacuum as a function of the shape of the concave electrodes. A marked increase in lifetime to several tens of minutes was obtained when the electrodes were shaped like a stairway with steps a few mm wide rather than being smooth.
When an Argon laser setup (see below) became available, we used it as a diagnostic device. This instrument turned out to be a very useful quantitative analysis tool. With it we can count single microparticles as they traverse the laser beam.
An early task in which the laser probe was used was in trying to establish a relation between the number density and the current flowing in a closed cavity. It turned out that the two parameters are not well correlated. For instance, a current could still flow even with no dust moving between the electrodes. It was also found that the dust density steadily decreased over the duration of the experiment and that the density was discontinuous with sudden jumps to zero and back to some finite value (see Fig. B20). Another observation was that of all particles in the cavity, only a small fraction was actually moving between the electrodes. This suggested that the moving particles represent a perturbation of the system rather than the main effect. We tried various schemes to perturb the dust layer covering the electrodes. Good results were achieved with a setup where an electrostatic trap was fed from below by a simple dust gun. The particles oscillated in the gun cavity and only a few of them entered the "trap" cavity. The feeding rate was determined by
TIME (sl
Figure B20. Rate of Particles crossing the laser beam (proportional to the den- sity) as a function of duration of experi- ment. This measurement was carried out with the two-gun arrangement, shown in Fig. B21.
the hole aperture and the gun voltage. The emerging dust particles may have provided the needed destabilizing factor. After a few minutes of operation, however, the system suddenly stopped operating and we found a lot of graphite dust packed on the bottom plate.
We tried to improve this device by using two guns "shooting" at each other (Fig. B21). If we could focus the two dust beams we thought that one gun could feed the other. The results obtained with such a system were quite encouraging. As a matter of fact, we were able to bring dust from the bottom gun to the upper one. But, for all the electrode configurations tested so far, the density slowly decayed and became unstable. Since, the
Figure B21. rnent '.
The 'Double gun arrange-
focussing was never perfect, the dust gradually spoiled all the electrodes, and we ended with the same problem as before, where only a small fraction of the dust particles were moving between the electrodes thus creating an unstable situation.
In order to quantitatively assess the number density in a given test volume we con- structed a laser probe, described in last year's annual report.4 Dust particles crossing the laser beam volume produce a light flash due to Mie scattering.5 The duration of this sig- nal is inversely proportional to the particle velocity and its height is related to the dust particle size. The scattered light is collected by a doublet lens system onto a photodiode or a photomultiplier, while the primary unscattered laser beam is stopped using a tube with a small entrance hole. The scattered light signal was interfaced with the Keithley Pulse Counting Module (PIMI) and the counting rate was recorded by an IBM-PC. The most recently available tool is a DAC module built here which uses the Keithley Digital Input/Output Module (DIO1). The idea was to drive a programmable high voltage power
supply in a feedback loop, to compensate for any target density variation sensed by the above detection system.
The laser beam width in the reaction volume was measured with a photodiode mounted on a stepping motor scanning across the laser beam. The motor was controlled by an IBM-PC and a driver which was developed at IUCF. This driver was interfaced via a Keithley Digital Input/Output Module (DIO1). The photodiode used was a standard P-N junction Silicon photocell. The photodiode output signal was recorded through a Keithley 500 ADC interface (AMMI). The measured width of the laser beam (as shown in Fig. B22) was 0.15 f 0.10 mm.
Figure B22. Typical laser beam profile measured with a silicon photodiode.
The trapping of microparticles or the generation of 'dust' beams with purely elec- trostatic means proved to be more difficult than anticipated. More recently, we have concentrated our studies on a scheme which exploits the drag force on particles in a vis- cous medium. This new setup consists of a cavity filled with a mixture of dust and gas, which is connected to vacuum by a capillary (with about 100 pm inner diameter). The viscous drag accelerates the particles in the direction of the gas flow, while the Bernoulli force concentrates the particles near the axis of the tube, where the velocity is largest. At the exit of the pipe the gas diffuses, but the particles, due to their large mass, continue on a straight line. While it was easy to demonstrate that this mechanism works in principle, the realization of a viable target requires the solution of a number of technical problems. One is the mixing of the powder with a gas. Surprisingly, purely mechanical mixers (pro-
I pellers, magnetic stirrers, ...) did not yield a steady, homogenous mixture. We have found, however, that an excited membrane provides an excellent gas-dust mixer for the different powders we have tried (C, Cu, A1203, SiOz). We plan to monitor the density in the mixing cavity by a measurement of light attenuation. Early tests using a He laser coupled to a photodiode gave promising results. Another problem is the transition from the cavity to the tube, where we have to find the best intake shape which allows the maximum drag efficiency without clogging the entrance of the tube. Stability tests (see Fig. B23) as well as beam profile measurements (see Fig. B24) show very encouraging results.
! The next steps in the development will be a systematic study of the dust beam prop- erties as a function of the parameters of the system and the construction of a differential pumping system to remove the carrier gas.
Figure B24. Scan of the profile of the dust beam 20 mm from the end of the capillary.
W t- < L1:
$ 20000~- 3 0 0
100000-
0
-
-
0 2 4 6 8 10 scan (mm)
Distance laser-neddle (mm) : 20
1. H. Shelton et al., J. Appl. Phys. 31, 1243 (1960). 2. C.D. Hendricks, Chap. 4 in Electrostatics and its Applications, ed. A.D. Moore (1973);
A.Y.H. Cho, J. Appl. Phys. 35, 1243 (1964). 3. R.V. Latham and A.S. Brah, J. Phys. D: Appl. Phys. 10, 151 (1977). 4. IUCF Scientific and Technical Report 1986, p. 116. 5. G . Mie Ann. Phys. 25, 377 (1908), H.C. van de Hulst, Light Scattering by Small
Particles (John Wiley, New York, 1957).
0 50 100 150 200 250 TIME (s )
" " ~ " " ~ " " ~ " " ~ " ' ~
B.4.4. Microribbon Targets and Stripper Foils, W. Lozowski, A. Berdoz, J. Doskow, K. Komisarcik, T. Marvin, and F. Sperisen
In-beam tests with 400 keV H+ were conducted with 5-15 pg/cm2 open edge carbon stripper foils for the Cooler as well as more limited tests with vacuum evaporated ribbons. For an existing aluminum chamber, a multi-target positioning assembly, a water cooled beam collimator with interchangeable apertures, a detector mount, and a water cooled Faraday cup were designed and constructed.
Unfortunately, the chamber with an inner diameter of 21 cm proved to be too small to allow measurements with low background for any beam intensity above 10 nA. Adjusting
- Figure B23. Rate of particles 5 mm from the end of the capillary as a function of time (stability test).
-
I I
the collimation of the beam and the shielding for the detector (after ray tracing primary and secondary paths) was only minimally helpful. At low intensity, it was possible to confirm the thickness of the C stripper foils within 20%; however, an intensity of about 20 pA was necessary for a useful interaction rate with the 15 pg/cm2, 35 pm wide ribbons. These ribbons were 5 pg/cm2 thinner than those achieved in 1986. With a television monitor and high beam currents (20-25 PA), the setup did provide encouraging evidence that the carbon stripper foils (and foil edges) and carbon strips would withstand repeated heating far beyond incandescence. Tests in the Cooler ring with ribbons and fibers are planned for July of 1988.
We have also developed a three position stripper foil ladder and transfer tube for the ring startup. An attempt was made to keep this initial apparatus as simple as possible because the foil attrition rate with high current beam will not be known until sometime in 1988.
In the device constructed, foil positioning is accomplished with an O-ring sealed rod which may be decoupled from the ladder. This feature enables the ring vacuum to be free of the O-ring seal, except during foil changes, by isolating the rod in the separately pumped transfer tube. Other design features are: a 300 mm quartz window for visual confirmation of manipulations and foil condition; light-action detent positioning (spring loaded ball bearing) of the foils; and a single-piece stainless-steel guide and stop for the ladder in the ring magnet box. The system worked well enough that no stripper foil has been damaged thus far after being used, examined and retrieved many times.


![The Green Lab - [05 B] Experiment design (advanced)](https://static.documents.pub/doc/80x56/58828f3a1a28abca6d8b6285/the-green-lab-05-b-experiment-design-advanced.jpg)


![The Green Lab - [04 B] [PWA] Experiment setup](https://static.documents.pub/doc/80x56/58a27fbf1a28ab891a8b5815/the-green-lab-04-b-pwa-experiment-setup.jpg)

