Doubled haploid (DH) systems are now available in a num-ber of crop species (Snape, 1989; Raina, 2010; Murovec and
Bohanec, 2011), including barley (Hordeum vulgare L.), rapeseed (Brassica napus L.), maize (Zea mays L.), and wheat (Triticum aesti-vum L.) (Zheng et al., 2002; Liu et al., 2002; Melchinger et al., 2005). These systems allow completely homozygous lines to be developed from heterozygous parents in a single generation (Bru-ins et al., 1996; Kunz et al., 1999; Zheng et al., 2002; Forster and Thomas, 2010). In open-pollinating species, such as maize, hap-loid induction offers a promising alternative to recurrent selfing for rapid inbred line development (Murovec and Bohanec, 2011).
Doubled Haploids versus Conventional Breeding in CIMMYT Wheat Breeding Programs
Huihui Li, Ravi P. Singh, Hans-Joachim Braun, Wolfgang H. Pfeiffer, and Jiankang Wang*
ABSTRACTDoubled haploid (DH) technology has been used in breeding programs for several decades and is currently the method of choice in a number of crop species, including barley (Hordeum vulgare L.), rapeseed (Brassica napus L.), maize (Zea mays L.), and wheat (Triticum aestivum L.). In this study we investigated via computer simulation the benefit of using DHs compared with the conventional wheat breeding strategy used at CIMMYT. Two strategies using DHs were considered: DH lines directly derived from F1 hybrids (F1–DH), and DH lines derived from F3 individuals that are retained following selection for agronomic traits in the F2 generation (F3–DH). Genetic gains per cycle, per year, and per dollar spent were consistently higher for conventional breeding than for DH breeding strategies, especially gains per dollar. Though the F1–DH strategy saved 1 yr in completing a breeding cycle, genetic gains per year for the adaptation trait from F1–DH were much lower than those from conventional breeding, where two growing seasons are used per year. Though the DH breeding strategy showed no significant advantages over the conventional wheat shuttle-breeding regime of CIMMYT, we did not exclude the possibility that the DH breeding strategy may have advantages when genetic gains per unit of time are considered, and only one generation is grown per year. The conventional shuttle regime will continue to be the major wheat breeding strategy at CIMMYT, where two cycles can be grown per year and breeders can do selection in large populations in both cycles.
H. Li and J. Wang, Institute of Crop Science, CIMMYT China, and The National Key Facility for Crop Gene Resources and Genetic Improvement, Chinese Academy of Agricultural Sciences, Beijing 100081, China; R.P. Singh and H.-J. Braun, International Maize and Wheat Improvement Center (CIMMYT), Apdo. Postal 6-641, 06600 Mexico, D.F., Mexico; W.H. Pfeiffer, HarvestPlus Challenge Programme and International Center for Tropical Agriculture (CIAT-HarvestPlus), A.A. 6713, Cali, Colombia. Received 20 Feb. 2012. *Corresponding author ([email protected] or [email protected]).
Abbreviations: CBs, crossing blocks; DH, doubled haploid; F1–DH, the breeding strategy of DH lines directly derived from the F1 hybrids; F3–DH, the breeding strategy of DH lines derived from F3 individuals that are retained from the selection of agronomic traits in the F2 generation; ID, identification; MODPED, modified pedigree/bulk selection method; QuLine, a QU-GENE application breeding simulation module; QU-GENE, a simulation platform for quantitative analysis of genetic models developed by the University of Queensland (http://www.uq.edu.au/lcafs/qugene/), Australia; SELBLK, selected bulk selection method.
All rights reserved. No part of this periodical may be reproduced or transmitted in any form or by any means, electronic or mechanical, including photocopying, recording, or any information storage and retrieval system, without permission in writing from the publisher. Permission for printing and for reprinting the material contained herein has been obtained by the publisher.
In self-pollinating species (e.g., wheat), such a system can be used to increase the efficiency of cultivar development programs (Bruins et al., 1996; Kunz et al., 1999; Liu et al., 2002; Zheng et al., 2002). Time can be saved in obtaining desired materials and there may be an increase in selection efficiency over conventional practices because of increased additive genetic variance, absence of dominance variation and within-family segregation, and decreased environ-mental effects through greater possibilities for replication (Forster and Thomas, 2010). Through studying DH pop-ulations, more than 130 quantitative traits have been suc-cessfully mapped in many crop species, including barley, cabbage (Brassica capitata var. alba L.), flax (Linum usitatis-simum), maize, mustard (Brassicaceae), pepper (Capsicum annuum), rapeseed, rice (Oryza sativa), and wheat (Forster and Thomas 2010). In breeding, Bernardo (2009) showed that DHs should be induced from F2 plants rather than F1 plants to sustain long-term response. Simulation stud-ies have also suggested that selection gains may be higher if testcrosses of F2 plants are first evaluated in yield tri-als, and DHs are subsequently developed only from the F2 plants (or their F3 families) with the best performance (Longin et al., 2007b; Wegenast et al., 2008). Longin et al. (2006) investigated the optimum resource allocation in hybrid maize breeding with doubled haploids (DHs). In two-stage selection, they found the optimum allocation of resources involves evaluation of (i) a large number of lines in a small number of test locations in the first year and (ii) a small number of the selected superior lines in a large number of test locations in the second year. For the choice of testers, Longin et al. (2007a) determined the optimum allocation of number of lines, test locations, and the number and type of testers in hybrid maize breeding using DHs in a two-stage selection process for improve-ment of general combining ability and showed that testers combining a large number of divergent lines were best.
The global impact of the CIMMYT wheat improve-ment program has been significant and well documented (Rajaram et al., 1994; Rajaram, 1999; Ortiz et al., 2007; Ortiz et al., 2008). One main element of the program has been the shuttle breeding between two contrasting loca-tions in Mexico (Rajaram et al., 1994; van Ginkel et al., 2002; Ortiz et al., 2007). Two cropping seasons can be grown each year: one is from November to April in Ciu-dad Obregón (27° N lat, 39 m above sea level), and the other is from May to October in Toluca (19° N lat, 2640 m above sea level). Therefore, 3 to 4 yr are needed to advance the breeding populations to F6 or F7, when the yield tri-als can be conducted; and 4 to 5 yr to advance to F9 or F10, when breeding materials can be distributed to national agricultural research systems of developing and developed countries. CIMMYT does not officially release cultivars, but CIMMYT’s partners and collaborators release elite materials from the international trials and nurseries.
Another key factor for the success of CIMMYT’s wheat breeding has been the efficient and effective breed-ing strategies adopted by CIMMYT breeders. Pedigree selection methods were used primarily from 1944 until 1985. From 1985 to the mid-1990s, the main selec-tion method was a modified pedigree/bulk method (MODPED) (van Ginkel et al., 2002; Wang et al., 2003), which successfully produced many of the widely adapted wheat cultivars now being grown in the developing world. This method was replaced in the late 1990s by the selected bulk method (SELBLK) (Singh et al., 1998; van Ginkel et al., 2002) to improve resource-use efficiency. The major advantage of SELBLK compared with MODPED was that fewer seed lots needed to be harvested, threshed, and visually selected for seed appearance. In addition, there were significant savings in time, labor, and costs associated with nursery preparation, planting, and plot labeling, and potential sources of error were avoided (van Ginkel et al., 2002; Wang et al., 2003).
The DH technology has been extensively used in breeding programs worldwide (Cost Action 851, 2012) for self-pollinating species, such as wheat (Bruins et al., 1996; Kunz et al., 1999; Zheng et al., 2002; Liu et al., 2002; Mago et al., 2011), barley (Emebiri et al., 2009), and rape-seed (Custers 2003), and for cross-pollinating species, such as maize (Forster and Thomas, 2010). In breeding pro-grams for self-pollinating species, advanced homozygous lines are the final breeding products, whereas for open-pollinating species the major objective is to improve the testcross performance as well as select superior hybrids. It is not clear whether DH technology has significant advan-tages if used in CIMMYT’s conventional wheat shuttle-breeding scheme, where two cycles can be grown per year and selection can be conducted in both cycles. The objec-tive of this study was to use computer simulation to inves-tigate the benefit of using DH technology under a wide range of genetic models when compared with the SELBLK method currently used in the CIMMYT wheat breeding.
MATERIALS AND METHODSGenotype by Environment System Used in SimulationWe used QU-GENE simulation program (The University of Queensland, 2012), in which a genotype by environment sys-tem needs to be defined; it requires information on environ-ment types, traits, genes, the effect of genes on traits in different types of environment, and trait heritabilities (Wang et al., 2003, 2004). One environment type (i.e., no gene by environment interaction) and two traits were defined. The first trait is the so-called adaptation (trait identification [ID] is 1) and the other is yield (trait ID is 2). Adaptation is a combined index of various breeding target traits, such as maturity, plant height, yield com-ponents, and quality, which can be selected for in early gen-erations before yield trials begin. We considered 210 additive
and ends with the generation when the selected advanced lines are returned to the CB as new parents. One breeding cycle was considered in the simulation. Thirty single crosses were made at the beginning of each breeding cycle. Only the final selected lines were used as parents for the next breeding cycle. The parents in the current CB were considered for crossing in the following cycles. Three breeding strategies were considered in the simulation. These were abbreviated as F1–DH, F3–DH, and SELBLK. These strategies are explained below.
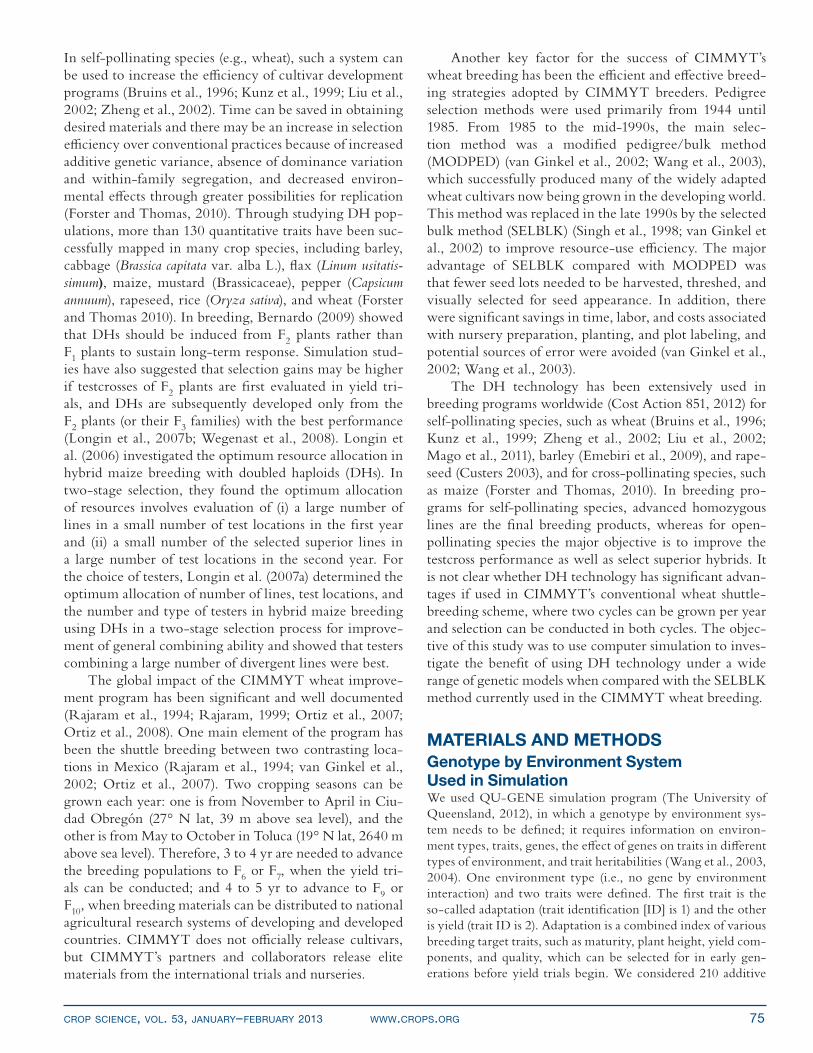
Definition of the F1–DH Breeding StrategyFour generations were included in each breeding cycle in F1–DH (Fig. 1). Ten F1 individuals were generated from each hand-pollinated cross between two parents in a CB and harvested in bulk, resulting in just one family in the next generation, with “bulk” being defined as the generation advance method. In the “F1–DH” generation, 100 DH lines from each F1 were produced from the pollens of the 10 F1 individuals and then harvested
genes, whose effects were randomly drawn from uniform dis-tribution U[0, 1]. Ten genes were evenly distributed on each of the 21 wheat chromosomes, and the distance between two neighboring genes was set at 10 cM.
Eight genetic models were considered on the basis of the number of adaptation, yield, and pleiotropic genes (Table 1). Yield is the most important trait in breeding. In general, selection for most other traits is expected to increase final yield, indicated by their correlations to yield (Wang et al., 2003). Pleiotropic gene effects are assumed to cause the correlation between two traits. Close genetic linkage can also give rise to a correlation between traits, which in most cases cannot be distinguished from pleiotropic effects. Among the eight genetic models con-sidered in this study, we assumed that Models 1, 2, 3, 4, and 5 might be more realistic, though the true genetic model of adap-tation, yield, and their relationship is hardly known in practice. Models 6 and 7 may be less relevant, as selection on agronomic traits in early generations always results in indirect genetic gain for yield. Model 8 represented another extreme scenario where every adaptation gene had a pleiotropic effect on yield.
Heritability in broad sense at the individual plant level was set at 0.50 for adaptation and 0.20 for yield. Nine crossing blocks (CBs), each consisting of 200 inbred parents, were generated. The nine CBs represented allele frequencies of 0.1, 0.2, 0.3, 0.4, 0.5, 0.6, 0.7, 0.8, and 0.9, respectively. Two outcomes from run-ning QU-GENE were used for simulating the breeding pro-gram: one was the genetic model, from which the phenotypic values of defined traits for any individual were determined and then used in selection, and the other was the initial breeding parental population from which the crosses were made.
Doubled Haploid and Conventional Breeding StrategiesQuLine (available from http://www.uq.edu.au/lcafs/qugene/ [accessed 14 Sept. 2012]) is a QU-GENE application module that simulates breeding programs for developing inbred lines. It has been used to compare two selection strategies (Wang et al., 2003), to study the effects on selection of dominance and epistasis (Wang et al., 2004), to predict cross performance using known gene information (Wang et al., 2005), to optimize marker-assisted selection to efficient pyramid multiple genes (Wang et al., 2007a), to investigate the use of identified quan-titative trait loci marker associations in improving rice qual-ity (Wang et al., 2007b), and to investigate the efficiency of a single backcross-breeding strategy in wheat breeding (Wang et al., 2009). The two output files from QU-GENE are the input files to QuLine. Besides that, breeding methods need to be clearly defined to run QuLine. One breeding method con-tains the crossing and selection details in each generation in an entire breeding cycle. A breeding cycle begins with crossing
Table 1. Number of adaptation genes, yield genes, and pleiotro-pic genes in the eight putative genetic models in the simulation.
Genetic Model 1 2 3 4 5 6 7 8Adaptation (A) only 100 50 0 30 0 150 60 0
Yield (Y) only 60 60 60 150 150 60 150 0
A daptation and Yield (AY)
50 100 150 30 60 0 0 210
Figure 1. Definition of the F1–double haploid (DH) breeding strategy in QuLine. Four generations were included in one breeding cycle in F1–DH. Ten F1 individuals were generated from each hand-pollinated cross between two parents in a crossing block and harvested in bulk, resulting in just one family in the next generation, with “bulk” being defined as the generation advance method. in the F1–DH generation, 100 DH lines from each F1 were produced from the pollens of the 10 F1 individuals and then harvested individually, resulting in a total of 3000 DH families in the next generation, with “pedigree” being defined as the generation advance method. each F1–DH individual was selfed to increase the seed for adaptation and yield tests. Among-family selection was conducted for adaptation, with 1 as the trait identification (iD) in selection. Selection mode “T” and selected amount 0.1 indicated 10% of the 3000 DH families (i.e., 300) with the highest agronomic performance were selected. each selected family was harvested in bulk. To perform the yield test, 100 plants were generated by selfing the 10 individuals in each DH family. Among-family selection was conducted on yield, with 2 as the iD in selection, and 30 DH families (i.e., 10% of the 300) with the highest yield were selected. nR, number of selection rounds; SS, seed source indicator; GT, generation title; PT, seed propagation type; GA, generation advance method; RP, number of replications for each family; PS, population size in each replication for each family; nL, number of test locations; eT, environment types for all locations; AT, number of among-family selection traits; iD, trait number; SP, selected proportion; SM, selection mode; WT, number of within-family selection traits; T, top.
individually, resulting in a total of 3000 DH families in the next generation, with “pedigree” being defined as the genera-tion advance method. Each “F1–DH” individual was selfed to increase the seeds for adaptation and yield tests. Among-family selection was conducted for adaptation, with 1 as the trait ID in selection (Fig. 1). Selection mode “T” and selected amount 0.1 indicated 10% of the 3000 DH families (i.e., 300) with the highest agronomic performance were selected. Each selected family was harvested in bulk. To do the yield test, 100 plants were generated by selfing the 10 individuals in each DH family. Among-family selection was conducted for yield, with 2 as the ID in selection (Fig. 1). Thirty DH families (i.e., 10% of 300) with the highest yield were finally selected and used to calcu-late the genetic gain to compare with the other two strategies.
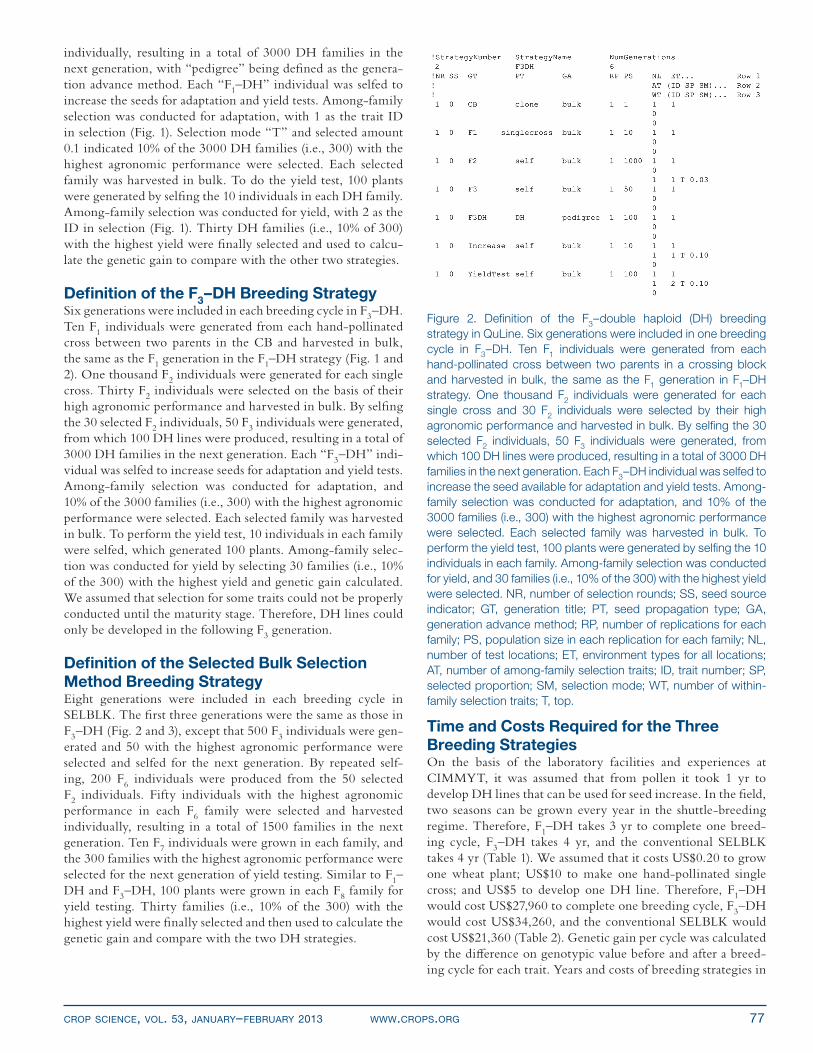
Definition of the F3–DH Breeding StrategySix generations were included in each breeding cycle in F3–DH. Ten F1 individuals were generated from each hand-pollinated cross between two parents in the CB and harvested in bulk, the same as the F1 generation in the F1–DH strategy (Fig. 1 and 2). One thousand F2 individuals were generated for each single cross. Thirty F2 individuals were selected on the basis of their high agronomic performance and harvested in bulk. By selfing the 30 selected F2 individuals, 50 F3 individuals were generated, from which 100 DH lines were produced, resulting in a total of 3000 DH families in the next generation. Each “F3–DH” indi-vidual was selfed to increase seeds for adaptation and yield tests. Among-family selection was conducted for adaptation, and 10% of the 3000 families (i.e., 300) with the highest agronomic performance were selected. Each selected family was harvested in bulk. To perform the yield test, 10 individuals in each family were selfed, which generated 100 plants. Among-family selec-tion was conducted for yield by selecting 30 families (i.e., 10% of the 300) with the highest yield and genetic gain calculated. We assumed that selection for some traits could not be properly conducted until the maturity stage. Therefore, DH lines could only be developed in the following F3 generation.
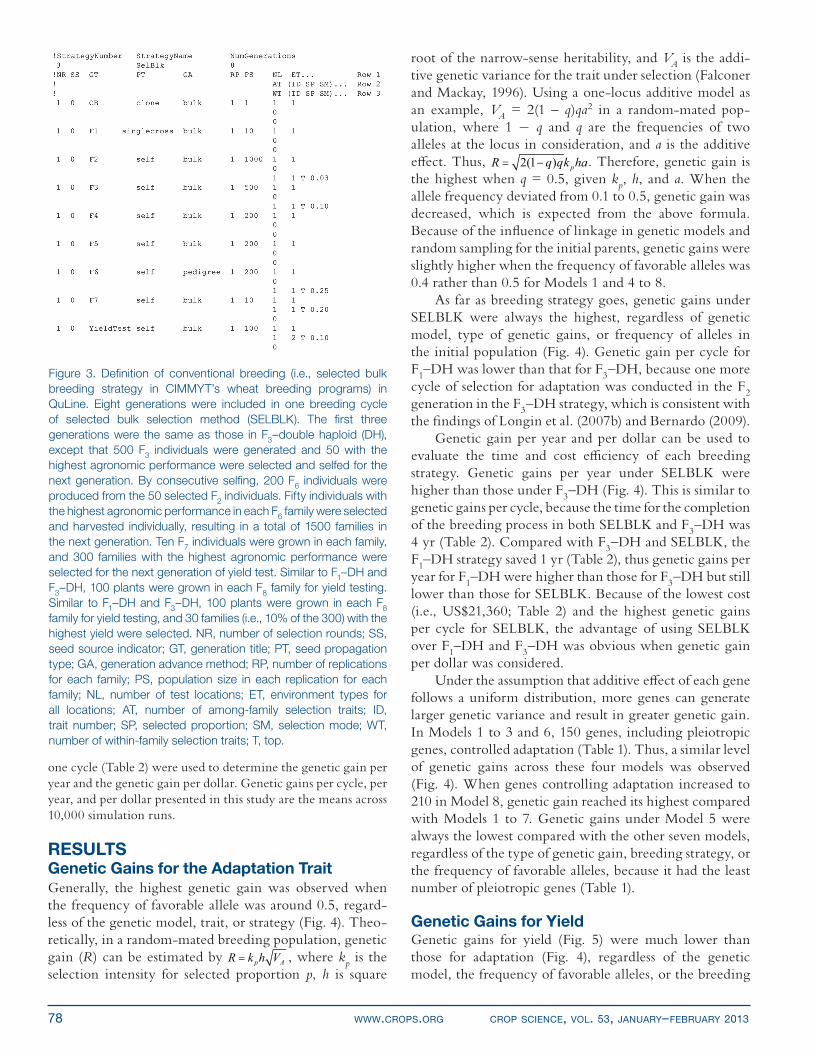
Definition of the Selected Bulk Selection Method Breeding StrategyEight generations were included in each breeding cycle in SELBLK. The first three generations were the same as those in F3–DH (Fig. 2 and 3), except that 500 F3 individuals were gen-erated and 50 with the highest agronomic performance were selected and selfed for the next generation. By repeated self-ing, 200 F6 individuals were produced from the 50 selected F2 individuals. Fifty individuals with the highest agronomic performance in each F6 family were selected and harvested individually, resulting in a total of 1500 families in the next generation. Ten F7 individuals were grown in each family, and the 300 families with the highest agronomic performance were selected for the next generation of yield testing. Similar to F1–DH and F3–DH, 100 plants were grown in each F8 family for yield testing. Thirty families (i.e., 10% of the 300) with the highest yield were finally selected and then used to calculate the genetic gain and compare with the two DH strategies.
Time and Costs Required for the Three Breeding StrategiesOn the basis of the laboratory facilities and experiences at CIMMYT, it was assumed that from pollen it took 1 yr to develop DH lines that can be used for seed increase. In the field, two seasons can be grown every year in the shuttle-breeding regime. Therefore, F1–DH takes 3 yr to complete one breed-ing cycle, F3–DH takes 4 yr, and the conventional SELBLK takes 4 yr (Table 1). We assumed that it costs US$0.20 to grow one wheat plant; US$10 to make one hand-pollinated single cross; and US$5 to develop one DH line. Therefore, F1–DH would cost US$27,960 to complete one breeding cycle, F3–DH would cost US$34,260, and the conventional SELBLK would cost US$21,360 (Table 2). Genetic gain per cycle was calculated by the difference on genotypic value before and after a breed-ing cycle for each trait. Years and costs of breeding strategies in
Figure 2. Definition of the F3–double haploid (DH) breeding strategy in QuLine. Six generations were included in one breeding cycle in F3–DH. Ten F1 individuals were generated from each hand-pollinated cross between two parents in a crossing block and harvested in bulk, the same as the F1 generation in F1–DH strategy. One thousand F2 individuals were generated for each single cross and 30 F2 individuals were selected by their high agronomic performance and harvested in bulk. By selfing the 30 selected F2 individuals, 50 F3 individuals were generated, from which 100 DH lines were produced, resulting in a total of 3000 DH families in the next generation. each F3–DH individual was selfed to increase the seed available for adaptation and yield tests. Among-family selection was conducted for adaptation, and 10% of the 3000 families (i.e., 300) with the highest agronomic performance were selected. each selected family was harvested in bulk. To perform the yield test, 100 plants were generated by selfing the 10 individuals in each family. Among-family selection was conducted for yield, and 30 families (i.e., 10% of the 300) with the highest yield were selected. nR, number of selection rounds; SS, seed source indicator; GT, generation title; PT, seed propagation type; GA, generation advance method; RP, number of replications for each family; PS, population size in each replication for each family; nL, number of test locations; eT, environment types for all locations; AT, number of among-family selection traits; iD, trait number; SP, selected proportion; SM, selection mode; WT, number of within-family selection traits; T, top.
one cycle (Table 2) were used to determine the genetic gain per year and the genetic gain per dollar. Genetic gains per cycle, per year, and per dollar presented in this study are the means across 10,000 simulation runs.
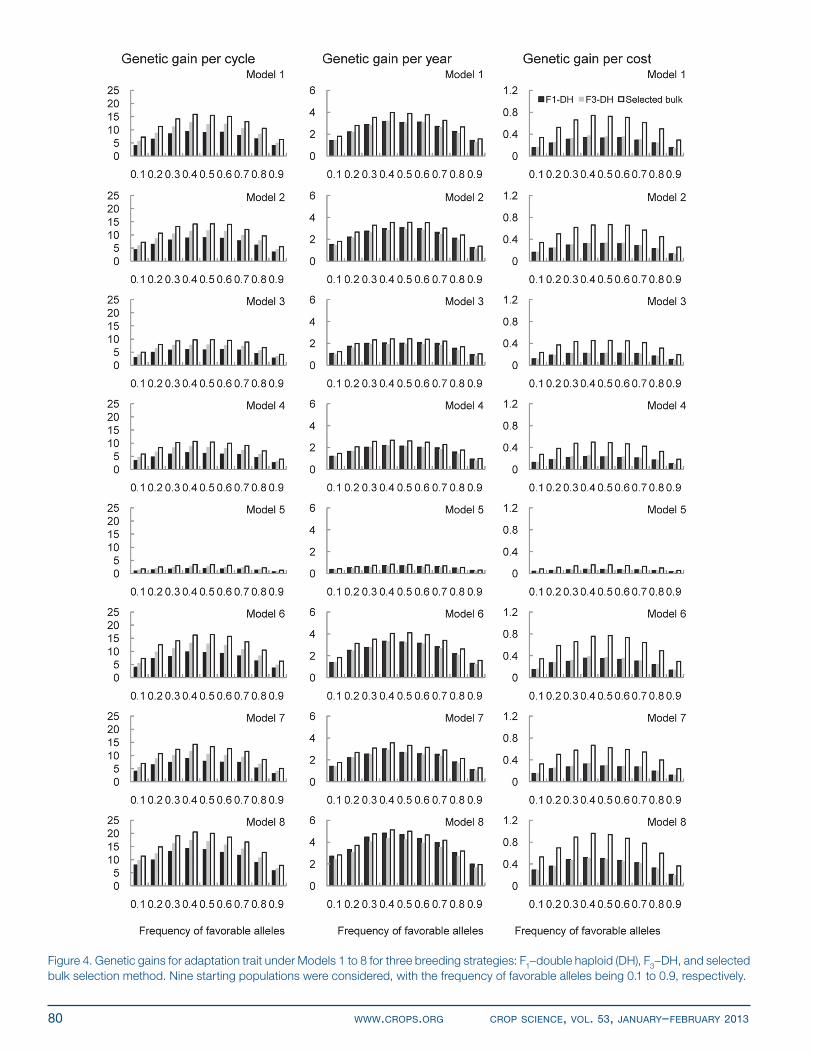
RESULTSGenetic Gains for the Adaptation TraitGenerally, the highest genetic gain was observed when the frequency of favorable allele was around 0.5, regard-less of the genetic model, trait, or strategy (Fig. 4). Theo-retically, in a random-mated breeding population, genetic gain (R) can be estimated by p AR k h V , where kp is the selection intensity for selected proportion p, h is square
root of the narrow-sense heritability, and VA is the addi-tive genetic variance for the trait under selection (Falconer and Mackay, 1996). Using a one-locus additive model as an example, VA = 2(1 – q)qa2 in a random-mated pop-ulation, where 1 - q and q are the frequencies of two alleles at the locus in consideration, and a is the additive effect. Thus, 2(1 ) pR q qk ha . Therefore, genetic gain is the highest when q = 0.5, given kp, h, and a. When the allele frequency deviated from 0.1 to 0.5, genetic gain was decreased, which is expected from the above formula. Because of the influence of linkage in genetic models and random sampling for the initial parents, genetic gains were slightly higher when the frequency of favorable alleles was 0.4 rather than 0.5 for Models 1 and 4 to 8.
As far as breeding strategy goes, genetic gains under SELBLK were always the highest, regardless of genetic model, type of genetic gains, or frequency of alleles in the initial population (Fig. 4). Genetic gain per cycle for F1–DH was lower than that for F3–DH, because one more cycle of selection for adaptation was conducted in the F2 generation in the F3–DH strategy, which is consistent with the findings of Longin et al. (2007b) and Bernardo (2009).
Genetic gain per year and per dollar can be used to evaluate the time and cost efficiency of each breeding strategy. Genetic gains per year under SELBLK were higher than those under F3–DH (Fig. 4). This is similar to genetic gains per cycle, because the time for the completion of the breeding process in both SELBLK and F3–DH was 4 yr (Table 2). Compared with F3–DH and SELBLK, the F1–DH strategy saved 1 yr (Table 2), thus genetic gains per year for F1–DH were higher than those for F3–DH but still lower than those for SELBLK. Because of the lowest cost (i.e., US$21,360; Table 2) and the highest genetic gains per cycle for SELBLK, the advantage of using SELBLK over F1–DH and F3–DH was obvious when genetic gain per dollar was considered.
Under the assumption that additive effect of each gene follows a uniform distribution, more genes can generate larger genetic variance and result in greater genetic gain. In Models 1 to 3 and 6, 150 genes, including pleiotropic genes, controlled adaptation (Table 1). Thus, a similar level of genetic gains across these four models was observed (Fig. 4). When genes controlling adaptation increased to 210 in Model 8, genetic gain reached its highest compared with Models 1 to 7. Genetic gains under Model 5 were always the lowest compared with the other seven models, regardless of the type of genetic gain, breeding strategy, or the frequency of favorable alleles, because it had the least number of pleiotropic genes (Table 1).
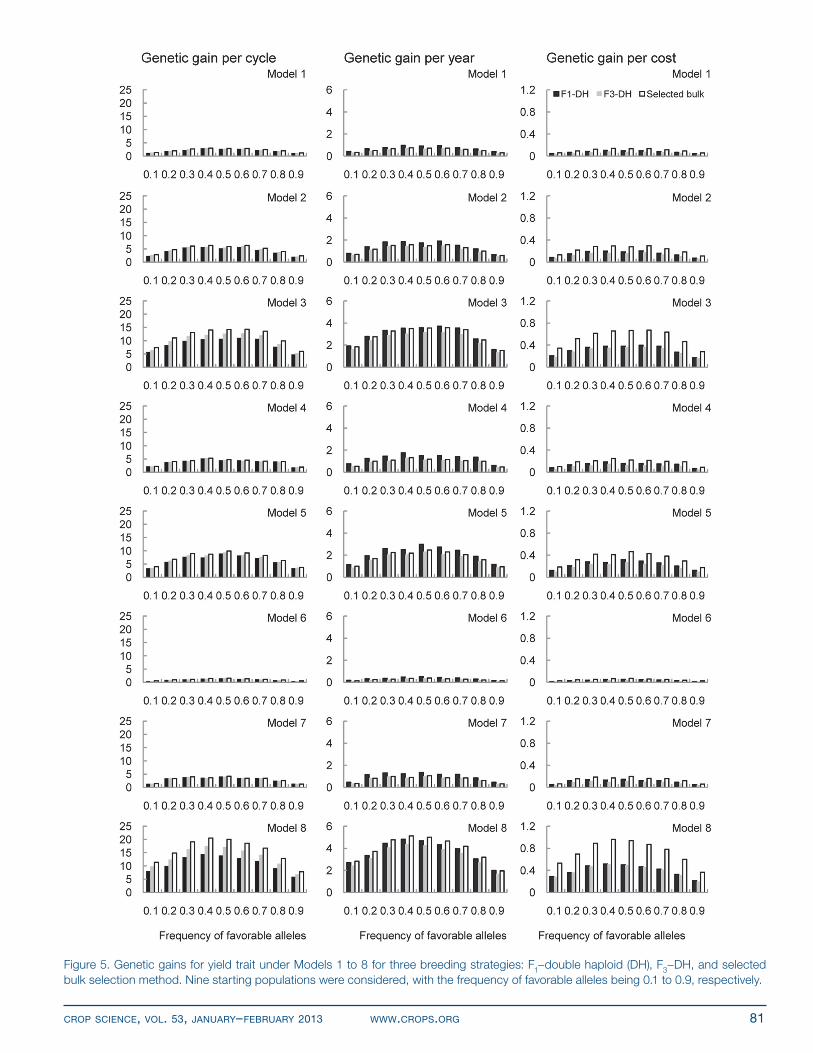
Genetic Gains for YieldGenetic gains for yield (Fig. 5) were much lower than those for adaptation (Fig. 4), regardless of the genetic model, the frequency of favorable alleles, or the breeding
Figure 3. Definition of conventional breeding (i.e., selected bulk breeding strategy in ciMMYT’s wheat breeding programs) in QuLine. eight generations were included in one breeding cycle of selected bulk selection method (SeLBLK). The first three generations were the same as those in F3–double haploid (DH), except that 500 F3 individuals were generated and 50 with the highest agronomic performance were selected and selfed for the next generation. By consecutive selfing, 200 F6 individuals were produced from the 50 selected F2 individuals. Fifty individuals with the highest agronomic performance in each F6 family were selected and harvested individually, resulting in a total of 1500 families in the next generation. Ten F7 individuals were grown in each family, and 300 families with the highest agronomic performance were selected for the next generation of yield test. Similar to F1–DH and F3–DH, 100 plants were grown in each F8 family for yield testing. Similar to F1–DH and F3–DH, 100 plants were grown in each F8 family for yield testing, and 30 families (i.e., 10% of the 300) with the highest yield were selected. nR, number of selection rounds; SS, seed source indicator; GT, generation title; PT, seed propagation type; GA, generation advance method; RP, number of replications for each family; PS, population size in each replication for each family; nL, number of test locations; eT, environment types for all locations; AT, number of among-family selection traits; iD, trait number; SP, selected proportion; SM, selection mode; WT, number of within-family selection traits; T, top.
strategy, because the selection intensity for yield was lower than that for adaptation (Fig. 1–3). As expected, genetic gains for yield for an allele frequency around 0.5 reached the highest among nine frequencies of favorable alleles (Fig. 5), which is similar to the results in Fig. 4. Genetic gains per cycle under SELBLK were always higher com-pared with those under F1–DH and F3–DH, with gains for F3–DH being higher than F1–DH. Genetic gains per year under SELBLK were still higher than those under F3–DH (Fig. 5), considering both strategies took the same amount of time to complete one breeding cycle. The breeding process of F1–DH saved 1 yr compared with F3–DH and SELBLK, and genetic gains per cycle under SELBLK for Models 1 to 7 were slightly higher than those under F1–DH. Thus genetic gains per year under SELBLK for Mod-els 1 to 7 were lower than those under F1–DH.
Because of the lower cost of SELBLK (Table 1), genetic gains per dollar under SELBLK were much higher than those under F1–DH and F3–DH (Fig. 5), with gains for F1–DH being higher than those for F3–DH for yield.
The reason is that genetic gains per cycle under F3–DH were slightly higher than those under F1–DH for yield, whereas the cost for F3–DH (i.e., US$34,260; Table 2) was higher than that for F1–DH (i.e., US$27,960; Table 2). Across the eight genetic models, genetic gains under Model 6 were the lowest, because there were only 60 genes controlling yield in this model and more yield genes in other models. For Model 8, there were 210 pleiotropic genes and no genes specifically controlling adaptation or yield; genetic gains for yield were exactly the same as those for adaptation (Fig. 4 and 5).
DISCUSSIONIn this simulation study, eight genetic models were con-sidered with a different number of adaptation, yield, and pleiotropic genes. Nine CBs were defined by favorable allele frequencies and used as the initial breeding popula-tion to compare the DH breeding strategy (i.e., F1–DH and F3–DH) with the conventional wheat breeding strat-egy (i.e., SELBLK) used at CIMMYT. Simulation results
Table 2. Costs during the breeding process for each breeding method. We assume that it takes 1 yr to develop double haploid (DH) lines from pollen that can be used for seed increase, and it costs US$0.20 to grow one wheat plant, US$10 to make one hand-pollinated single cross, and US$5 to develop one DH line. In the field, two seasons can be grown every year under the shuttle-breeding regime.
Figure 4. Genetic gains for adaptation trait under Models 1 to 8 for three breeding strategies: F1–double haploid (DH), F3–DH, and selected bulk selection method. nine starting populations were considered, with the frequency of favorable alleles being 0.1 to 0.9, respectively.
Figure 5. Genetic gains for yield trait under Models 1 to 8 for three breeding strategies: F1–double haploid (DH), F3–DH, and selected bulk selection method. nine starting populations were considered, with the frequency of favorable alleles being 0.1 to 0.9, respectively.
from genetic gains per cycle, per year, and per dollar were fairly consistent. Conventional breeding methods were more efficient both genetically and economically than DH breeding strategies. For adaptation, genetic gains per year for the DH breeding strategy were lower than those for conventional breeding, even though the breeding pro-cess of the F1–DH strategy saved 1 yr. Therefore, the DH breeding strategy showed no significant advantages over the conventional wheat breeding used in CIMMYT’s shuttle-breeding approach.
For yield, genetic gains per year for the DH breeding strategy were higher than those for conventional breeding in most cases, because of the time efficiency of the DH breeding strategy. Therefore, we did not exclude the possibility that genetic gains per unit of time from a DH breeding strategy may have advantages in breeding programs where only one season can be grown every year, or where DHs can be produced in 6 mo or even less. CIMMYT wheat breeders will continue to use conventional wheat breeding, while DH technology can be used to develop some special materials for genetic studies.
The results observed in wheat seem to be contradictory to those that have been reported in maize breeding, as DH has been adopted as a routine method in many maize breeding programs (Bernardo, 1991; Seitz, 2005; Longin et al., 2006, 2007a,b). This may be understandable when we consider the different breeding objectives in maize and wheat. In maize, selection on the basis of performance of testcross is more important than that of line per se in early generations. In addition, maize F2 populations are normally much smaller (e.g., 100–200) than those of wheat F2 populations (e.g., 1000–3000). The development of DH is still costly and time consuming. Normally, only around 100 DH lines can be generated from an F1 hybrid. In this sense, much stronger selection can be applied in conventional breeding, resulting in faster genetic gains. Therefore, we cannot extend these results to other crops unconditionally.
The DH method can be exploited not only to increase the efficiency in hybrid maize breeding, but also to construct genetic maps and locate genes associated with breeding traits. In fact, if selection is to be avoided as much as possible, DHs are ideal for generating genetic populations. The DH lines with completely homozygous individuals can be instantly produced so they have essentially no within-line genetic variance, whereas the genetic variance between lines is considerable, and each DH represents a different multilocus genotype (Lynch and Walsh, 1998). The DH lines can be easily bulked and assessed in multiple sites and seasons in replicated trials so that phenotype can be measured precisely, environmental variance can be controlled effectively, and genotype by environment interactions can be studied. Therefore, the lower efficiency of DHs compared with conventional breeding should not exclude the use of DH in genetic studies.
AcknowledgmentsThis research was supported by the HarvestPlus Challenge Program of CGIAR. Development of the simulation tool QuLine was funded by Grains Research and Development Corporation (GRDC) of Australia and the Generation Challenge Program (GCP) of CGIAR. The authors wish to thank two anonymous reviewers and the editor for their constructive comments and editing, which have greatly improved the scientific quality and English of this paper.
ReferencesBernardo, R. 1991. Correlation between testcross performance of
lines in early and late selfing generations. Theor. Appl. Genet. 82:17–21. doi:10.1007/BF00231272
Bernardo, R. 2009. Should maize double haploids be induced among F1 or F2 plants? Theor. Appl. Genet. 119:255–262. doi:10.1007/s00122-009-1034-1
Bruins, M.B.M., M. Rakoczy-Trojanowska, and C.H.A. Snijders. 1996. Isolated microspore culture in wheat (Triticum aestivum L.): The effect of co-culture of wheat or barley ovaries on embryogenesis. Cereal Res. Commun. 24:401–408.
Cost Action 851. 2012. Gametic cells and molecular breeding for crop improvement. http://www.scri.ac.uk/assoc/COST851/Default.htm (accessed 9 May 2012).
Custers, J.B.M. 2003. Microspore culture in rapeseed (Brassica napus L.). In: M. Maluszynski, K.J. Kasha, B.P. Forster, and I. Szare-jko, editors, Doubled haploid production in crop plants. Klu-wer Academic Publishers, Norwell, MA. p. 185–194.
Emebiri, L., P. Michael, D.B. Moody, C. Ogbonnaya, and C. Black. 2009. Pyramiding QTLs to improve malting quality in barley: Gains in phenotype and genetic diversity. Mol. Breed. 23:219–228. doi:10.1007/s11032-008-9227-x
Falconer, D.S., and T.F.C. Mackay. 1996. Introduction to quantita-tive genetics. 4th ed. Longman, Essex, UK.
Forster, B.P., and W.T.B. Thomas. 2010. Doubled haploids in genetics and plant breeding. In: J. Janick, editor, Plant breed-ing reviews, vol. 25. John Wiley & Sons, Oxford, UK. doi: 10.1002/9780470650301.ch3
Kunz, C., S.M.S. Islam, J. Berberat, S.O. Peter, B. Büter, P. Stamp, and J.E. Schmid. 1999. Assessment and improvement of wheat microspore derived embryo induction and regeneration. J. Plant Physiol. 156:190–196. doi:10.1016/S0176-1617(00)80305-3
Liu, W., M.Y. Zheng, E.A. Polle, and C.F. Konzak. 2002. Highly efficient doubled-haploid production in wheat (Triticum aestivum L.) via induced microspore embryogenesis. Crop Sci. 42:686–692. doi:10.2135/cropsci2002.0686
Longin, C.F.H., H. Friedrich Utz, J.C. Reif, W. Schipprack, and A.E. Melchinger. 2006. Hybrid maize breeding with doubled haploids: I. One-stage versus two-stage selection for testcross performance. Theor. Appl. Genet. 112:903–912. doi:10.1007/s00122-005-0192-z
Longin, C.F.H., H. Friedrich Utz, A.E. Melchinger, and J.C. Reif. 2007a. Hybrid maize breeding with doubled haploids: II. Opti-mum type and number of testers in two-stage selection for general combining ability. Theor. Appl. Genet. 114:393–402. doi:10.1007/s00122-006-0422-z
Longin, C.F.H., H. Friedrich Utz, A.E. Melchinger, and J.C. Reif. 2007b. Hybrid maize breeding with doubled haploids: III. Effi-ciency of early testing prior to doubled haploid production in two-stage selection for testcross performance. Theor. Appl. Genet. 115:519–527. doi:10.1007/s00122-007-0585-2
Lynch, M., and B. Walsh. 1998. Genetics and analysis of quantitative traits. Sinauer Associates, Inc., Sunderland, MA.
Mago, R., G.J. Lawrence, and J.G. Ellis. 2011. The application of DNA marker and doubled-haploid technology for stack-ing multiple stem rust resistance genes in wheat. Mol. Breed. 27:329–335. doi:10.1007/s11032-010-9434-0
Melchinger, A.E., C.F. Longin, H.F. Utz, and J.C. Reif. 2005. Hybrid maize breeding with double haploids lines: Quanti-tative genetic and selection theory for optimum allocation of resources. In: Proceedings of 41st Annual Illinois Corn Breed-ers School, 7–8 Mar. 2005, Urbana, University of Illinois at Urbana-Champaign. p. 8–21.
Murovec, J., and B. Bohanec. 2011. Haploids and doubled hap-loids in plant breeding. In: I.Y. Abdurakhmonov, editor, Plant breeding. InTech. doi: 10.5772/29982
Ortiz, R., R. Trethowan, G.O. Ferrara, M. Iwanaga, J.H. Dodds, J.H. Crouch, J. Crossa, and H.J. Braun. 2007. High yield poten-tial, shuttle breeding and new international wheat improve-ment strategy. Euphytica 157:365–384. doi:10.1007/s10681-007-9375-9
Ortiz, R., H.-J. Braun, J. Crossa, J.H. Crouch, G. Davenport, J. Dixon, S. Dreisigacker, E. Duveiller, Z. He, J. Huerta, A.K. Joshi, M. Kishii, P. Kosina, Y. Manes, M. Mezzalama, A. Mor-gounov, J. Murakami, J. Nicol, G.O. Ferrara, J.I. Ortiz-Mon-asterio, T.S. Payne, J. Pena, M.P. Reynolds, K.D. Sayre, R.C. Sharma, R.P. Singh, J. Wang, M. Warburton, H. Wu, and M. Iwanaga. 2008. Wheat genetic resources enhancement by the International Maize and Wheat Improvement Center (CIM-MYT). Genet. Resour. Crop Evol. 55:1095–1140. doi:10.1007/s10722-008-9372-4
Raina, S.K. 2010. Doubled haploid breeding in cereals. In: J. Janick, editor, Plant breeding reviews, vol. 15. John Wiley & Sons, Oxford, UK. doi: 10.1002/9780470650097.ch5
Rajaram, S. 1999. Historical aspects and future challenges of an international wheat program. In: M. van Ginkel, A. McNab, and J. Krupinsky, editors, Septoria and Stagonospora diseases of cereals: A compilation of global research. CIMMYT, D.F., Mexico. p. 1–17.
Rajaram, S., M. van Ginkel, and R.A. Fischer. 1994. CIMMYT’s wheat breeding mega-environments (ME). In: Proceedings of the 8th International Wheat Genetics Symposium. China Agricultural Scientech., Beijing, China. p. 1101–1106.
Seitz, G. 2005. The use of doubled haploids in corn breeding. In: Proceedings of the 41st Annual Illinois Corn Breeders’ School 2005, Urbana-Champaign, IL. p. 1–7.
Singh, R.P., S. Rajaram, A. Miranda, J. Huerta-Espino, and E. Autrique. 1998. Comparison of two crossing and four selection schemes for yield, yield traits, and slow rust-ing resistance to leaf rust in wheat. Euphytica 100:35–43. doi:10.1023/A:1018391519757
Snape, J. 1989. Doubled haploid breeding: Theoretical basis and practical applications. In: A. Mujeeb-Kazi and L.A. Sitch, edi-tors, Review of advances in plant biotechnology. Los Banos, Laguna (Philippines): IRRI, 1989. p. 19–30.
The University of Queensland. 2012. QU-GENE. http://www.uq.edu.au/lcafs/qugene/ (accessed 9 May 2012).
van Ginkel, M., R. Trethowan, K. Ammar, J. Wang, and M. Lil-lemo. 2002. Guide to bread wheat breeding at CIMMYT. Wheat Special Report 5. CIMMYT, D.F., Mexico.
Wang, J., S.C. Chapman, D.B. Bonnett, G.J. Rebetzke, and J. Crouch. 2007a. Application of population genetic theory and simulation models to efficiently pyramid multiple genes via marker-assisted selection. Crop Sci. 47:580–588.
Wang, J., H.A. Eagles, R. Trethowan, and M. van Ginkel. 2005. Using computer simulation of the selection process and known gene information to assist in parental selection in wheat qual-ity breeding. Aust. J. Agric. Res. 56:465–473. doi:10.1071/AR04285
Wang, J., M. van Ginkel, D. Podlich, G. Ye, R. Trethowan, W. Pfeiffer, I.H. DeLacy, M. Cooper, and S. Rajaram. 2003. Com-parison of two breeding strategies by computer simulation. Crop Sci. 43:1764–1773. doi:10.2135/cropsci2003.1764
Wang, J., M. van Ginkel, R. Trethowan, G. Ye, I. DeLacy, D. Pod-lich, and M. Cooper. 2004. Simulating the effects of domi-nance and epistasis on selection response in the CIMMYT Wheat Breeding Program using QuCim. Crop Sci. 44:2006–2018. doi:10.2135/cropsci2004.2006
Wang, J., R.P. Singh, H.J. Braum, and W.H. Pfeiffer. 2009. Inves-tigating the efficiency of the single backcrossing breeding strategy through computer simulation. Theor. Appl. Genet. 118:683–694. doi:10.1007/s00122-008-0929-6
Wang, J., X. Wan, H. Li, W. Pfeiffer, J. Crouch, and J. Wan. 2007b. Application of the identified QTL-marker associations in rice quality improvement through a design breeding approach. Theor. Appl. Genet. 115:87–100. doi:10.1007/s00122-007-0545-x
Wegenast, T., C.F.H. Longin, H.F. Utz, A.E. Melchinger, H.P. Maurer, and J.C. Reif. 2008. Hybrid maize breeding with doubled haploids. IV. Number versus size of crosses and impor-tance of parental selection in two-stage selection for testcross performance. Theor. Appl. Genet. 117:251–260. doi:10.1007/s00122-008-0770-y
Zheng, M.Y., Y. Weng, W. Liu, and C.F. Konzak. 2002. The effect of ovary-conditioned medium on microspore embryogenesis in common wheat (Triticum aestivum L.). Plant Cell Rep. 20:802–807. doi:10.1007/s00299-001-0411-2