www.ambest.com Page 1 of 19 Printed August 2, 2018 www.ambest.com Page 1 of 19 Printed August 2, 2018 BEST’S RATING REPORT A M BEST A- Excellent Financial Strength Rating National American Insurance Company (OK) 1010 Manvel Avenue, Chandler, Oklahoma, United States 74834 Mailing Address: P.O. Box 9, Chandler, Oklahoma, United States 74834 AMB #: 000672 NAIC #: 23663 FEIN#: 47-0247300 Phone: 405-258-0804 Fax: 405-258-4574 Website: www.naico.com
Transcript
XXXXX Company Name Here XXXXXBEST’S RATING REPORT
www.ambest.com
Page 1 of 19 Printed August 2, 2018
BEST’S RATING REPORT
www.ambest.com
Page 1 of 19 Printed August 2, 2018
BEST’S RATING REPORT
AM BEST
A- Excellent
Financial Strength Rating
National American InsuranceCompany (OK)
1010 Manvel Avenue, Chandler, Oklahoma, United States 74834
Mailing Address: P.O. Box 9, Chandler, Oklahoma, United States 74834
Oklahoma based NAICO is a multi-line insurer specializing in energy and niche casualty business. NAICO has a sister company,Chandler Insurance Managers, Inc. ("CIMI") that is an underwriting manager and wholesaler, offering insurance products to businessesin various industries. Both companies are wholly owned subsidiaries of Chandler (USA) ("CUSA") an intermediate holding company.Chandler Insurance Company, Ltd. ("CICL"), a Cayman Islands corporation, is the ultimate parent holding company. CICL acts as acaptive reinsurer for the group writing reinsurance for profitable NAICO business and provides additional financial flexibility to theintermediate holding company CUSA.
Rating Rationale:
Balance Sheet Strength: Very Strong
www.ambest.com
Page 3 of 19 Printed August 2, 2018
BEST’S RATING REPORT National American Insurance Company (OK)
• Strongest level of risk-adjusted capitalization as measured by Best's Capital Adequacy Ratio (BCAR) at the 99.6% VaR level.
• Conservative and consistent reserving practices, which have resulted in favorable loss development trends in recent years.
• Somewhat constrained surplus growth over the most recent five-year period (averaging 3.8% per year) mainly attributed to theongoing payment of stockholder dividends.
• High reinsurance dependence exhibited by ceded leverage ratios, which are more than double the composite average; however,this is slightly mitigated with fully collateralized recoverables.
• Debt at the intermediate holding company comprised of trust preferreds, although debt to total capital ratios are moderate andwithin A.M. Best's guidelines.
Operating Performance: Adequate
• Profitable pre-tax operating return measures trail the composite averages on a five- and ten-year average basis.
• Solid underwriting performance, benefited by a pure loss ratio that exceeds the composite average by nearly ten points and issomewhat offset with an elevated expense ratio.
• Consistent net investment income generated in the five-year period, reflective of consistent growth in the invested asset basedriven by profitable operations.
• Premium growth exhibits moderate volatility, directly linked to the oil and gas industry.
Business Profile: Neutral
• The company's geographic footprint spans across 38 states, primarily concentrated in Oklahoma (43%) and Texas (21%) andsurrounding southern states.
• Niche specialists with a focus in oil and gas, underwritten through strong regional relationships.
• Although several products are high risk such as workers' compensation or general liability, they are the most profitable lines ofbusiness.
• Seasoned, experienced management team with a proven track record of executing strategy and producing profitable results.
Enterprise Risk Management: Appropriate
• Risk management capabilities are considered appropriate and well aligned with the risk profile of the company.
• A formal ERM program is empowered from the top of the organization and includes various committees to ensure appropriaterisk management and oversight are provided.
• A comprehensive, multi-layered reinsurance program is appropriate, and the book of business of National American InsuranceCompany (OK) (NAICO) is carefully managed to protect policyholder surplus from the impact of catastrophe losses from its cat-exposed lines of business.
OutlookThe stable outlooks reflect the strongest level of risk-adjusted capitalization as measured by BCAR and the expectation of continuedfavorable underwriting and operating performance.
Rating DriversPositive rating actions could occur should operating results improve to a level that outperforms the peer composite and can besustained going forward.
www.ambest.com
Page 4 of 19 Printed August 2, 2018
BEST’S RATING REPORT National American Insurance Company (OK)
Alternatively, negative rating actions may occur should operating performance deteriorate markedly.
In addition, negative rating actions may occur should capitalization considerably weaken due to the emergence of adverse reservedevelopment, an increase in natural catastrophe losses, or strong premium growth.
Financial Data Notes:
Time Period: Annual - 2017 Status: A.M. Best Quality Cross Checked Data as of: 06/15/2018
Key Financial Indicators:
Key Financial Indicators (000)Year End - December 31
Source: Bestlink - Best's Statement File - P/C, US
(*) Within several financial tables of this report, this company is compared against the Commercial Casualty Composite.(*) Data reflected within all tables of this report has been compiled from the company-filed statutory statement.
www.ambest.com
Page 5 of 19 Printed August 2, 2018
BEST’S RATING REPORT National American Insurance Company (OK)
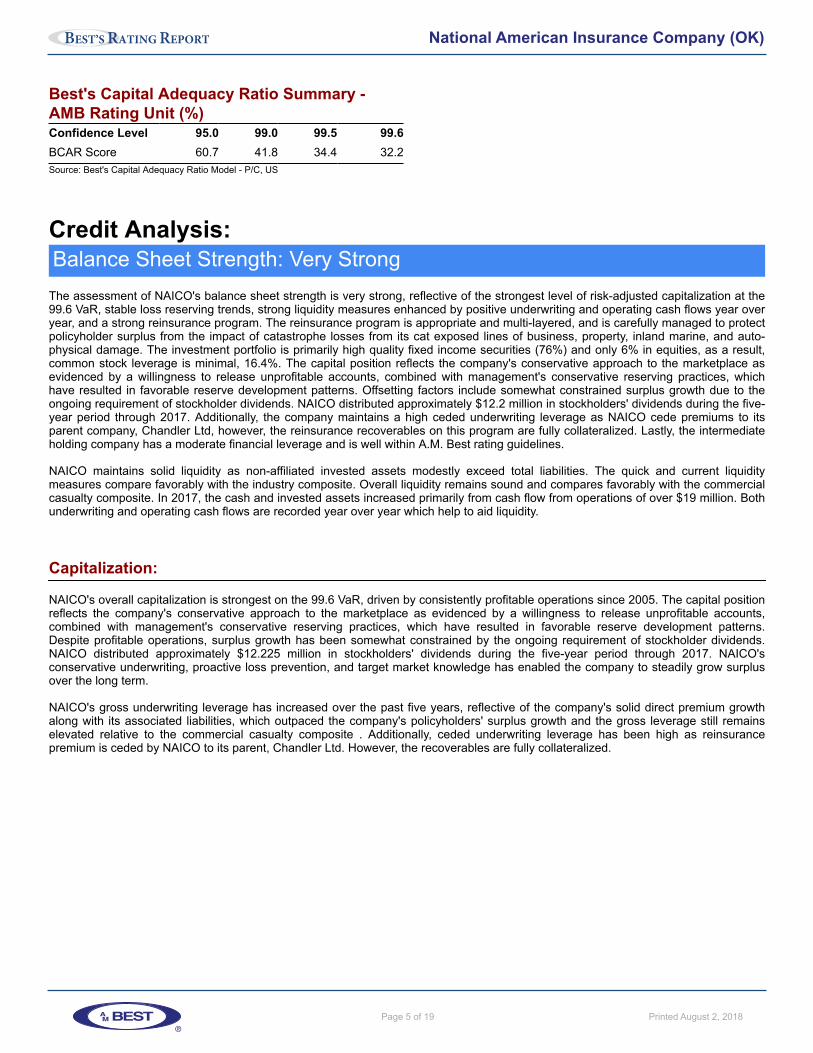
Best's Capital Adequacy Ratio Summary -AMB Rating Unit (%)Confidence Level 95.0 99.0 99.5 99.6BCAR Score 60.7 41.8 34.4 32.2Source: Best's Capital Adequacy Ratio Model - P/C, US
Credit Analysis:Balance Sheet Strength: Very Strong
The assessment of NAICO's balance sheet strength is very strong, reflective of the strongest level of risk-adjusted capitalization at the99.6 VaR, stable loss reserving trends, strong liquidity measures enhanced by positive underwriting and operating cash flows year overyear, and a strong reinsurance program. The reinsurance program is appropriate and multi-layered, and is carefully managed to protectpolicyholder surplus from the impact of catastrophe losses from its cat exposed lines of business, property, inland marine, and auto-physical damage. The investment portfolio is primarily high quality fixed income securities (76%) and only 6% in equities, as a result,common stock leverage is minimal, 16.4%. The capital position reflects the company's conservative approach to the marketplace asevidenced by a willingness to release unprofitable accounts, combined with management's conservative reserving practices, whichhave resulted in favorable reserve development patterns. Offsetting factors include somewhat constrained surplus growth due to theongoing requirement of stockholder dividends. NAICO distributed approximately $12.2 million in stockholders' dividends during the five-year period through 2017. Additionally, the company maintains a high ceded underwriting leverage as NAICO cede premiums to itsparent company, Chandler Ltd, however, the reinsurance recoverables on this program are fully collateralized. Lastly, the intermediateholding company has a moderate financial leverage and is well within A.M. Best rating guidelines.
NAICO maintains solid liquidity as non-affiliated invested assets modestly exceed total liabilities. The quick and current liquiditymeasures compare favorably with the industry composite. Overall liquidity remains sound and compares favorably with the commercialcasualty composite. In 2017, the cash and invested assets increased primarily from cash flow from operations of over $19 million. Bothunderwriting and operating cash flows are recorded year over year which help to aid liquidity.
Capitalization:
NAICO's overall capitalization is strongest on the 99.6 VaR, driven by consistently profitable operations since 2005. The capital positionreflects the company's conservative approach to the marketplace as evidenced by a willingness to release unprofitable accounts,combined with management's conservative reserving practices, which have resulted in favorable reserve development patterns.Despite profitable operations, surplus growth has been somewhat constrained by the ongoing requirement of stockholder dividends.NAICO distributed approximately $12.225 million in stockholders' dividends during the five-year period through 2017. NAICO'sconservative underwriting, proactive loss prevention, and target market knowledge has enabled the company to steadily grow surplusover the long term.
NAICO's gross underwriting leverage has increased over the past five years, reflective of the company's solid direct premium growthalong with its associated liabilities, which outpaced the company's policyholders' surplus growth and the gross leverage still remainselevated relative to the commercial casualty composite . Additionally, ceded underwriting leverage has been high as reinsurancepremium is ceded by NAICO to its parent, Chandler Ltd. However, the recoverables are fully collateralized.
www.ambest.com
Page 6 of 19 Printed August 2, 2018
BEST’S RATING REPORT National American Insurance Company (OK)
Capitalization: (Continued...)
Capital Generation AnalysisYear End - December 31
2017 2016 2015 2014 2013
Pre-tax Operating Income ($000) 4,370 5,164 7,300 5,739 7,244Realized Capital Gains ($000) 345 1,814 134 99 78Income Taxes ($000) 2,115 1,063 1,314 1,304 2,654Unrealized Capital Gains ($000) 1,679 298 -172 402 418Net Contributed Capital ($000) -3,000 -3,000 -2,475 -2,200 -1,550Other Changes ($000) -1,460 -656 -1,244 -334 906Change in Policyholders' Surplus($000)
-180 2,559 2,229 2,402 4,443
Change in Policyholders' Surplus (%) -0.3 3.9 3.5 3.9 7.9Source: Bestlink - Best's Statement File - P/C, US
Liquidity Analysis (%)Company Industry Composite
Year End - December 31 Year End - December 312017 2016 2015 2014 2013 2017 2016 2015 2014 2013
The investment portfolio is primarily high quality fixed income securities (76%) and only 6% in equities, as a result, common stockleverage is minimal at 16.4%. The bulk of the fixed income portfolio is held in tax-free government agency bonds and corporate bonds,with the balance in government bonds. NAICO also has approximately 10% of its invested assets in BA Assets, and when combinedwith Home Office Properties (3%), the company ranks high on high risk assets to surplus compared to peers. The company's BAAssets mainly reflect a combination of collateral loans to affiliate, Chandler Insurance Managers which have enhanced investmentincome in recent years.
Bond Portfolio - 2017 Bonds Distribution by Maturity (%)Years Years Average
0-1 1-5 5-10 10-20 20+ Maturity
Government 1.2 5.9 3.0 3.7 0.1 7.1Government Agencies and Municipal Bonds 1.1 12.3 15.4 11.1 0.2 8.1Industrial and Misc. 1.3 19.2 24.2 1.4 ... 5.7Total 3.5 37.4 42.6 16.2 0.2 6.8
Source: Bestlink - Best's Statement File - P/C, US
www.ambest.com
Page 7 of 19 Printed August 2, 2018
BEST’S RATING REPORT National American Insurance Company (OK)
US Government (%) Foreign-All Other (%) State/Special Revenue-US (%) Industrial and Misc-US (%)
Source: Bestlink - Best's Statement File - P/C, US
Reserve Adequacy:
NAICO has reported favorable accident year development during each of the prior nine years reflective of management initiatives tomaintain adequate rates in combination with conservatively established reserve positions. Viewed on a calendar year basis, resultshave been improving as evidenced by favorable calendar year reserve development during each of the most recent three calendaryears. The improved reserve development patterns reflect management's conservative approach towards pricing and reserving actionswhich have resulted in the establishment of stronger initial reserve positions on more recent accident years. Adverse loss reservedevelopment in calendar year 2014 was driven primarily by the Fidelity and Surety line in closing out a surety claim. The developmentwas partially offset by favorable reserve development occurring on the Other Liability, WC, Comm Auto Liability and Product Liabilitylines of business. Nonetheless, consistent reserving practices have been demonstrated year over year which have equated to nearlythree points on the combined ratio in 2017.
NAICO does not typically provide coverage for environmental exposures. However, the company has insured certain truckingcompanies and pest control operators that are required to provide proof of insurance which, in some cases, assures payment forcleanup and restoration of damage resulting from sudden and accidental release or discharge of contaminants or other substances thatmay be classified as pollutants. In addition, NAICO insures independent oil and gas producers that may purchase coverage for theescape of oil, saltwater, or other substances, which may be harmful to persons or property. NAICO maintains claims records thatsegregate this type of risk for the purpose of evaluating environmental risk exposure. Based upon the nature of such lines of businessand current data regarding the limited severity and infrequency of such matters, it appears that potential environmental risks are not asignificant portion of claims reserves and therefore would not likely have a material impact, if any, on the company's financial condition.
www.ambest.com
Page 8 of 19 Printed August 2, 2018
BEST’S RATING REPORT National American Insurance Company (OK)
Reserve Adequacy: (Continued...)
Loss and Allocated Loss Adjustment Expense Reserve Development
Year End - December 31
Calendar Year: 2017 2016 2015 2014 2013
Original Loss Reserves ($000) 80,782 75,205 71,380 58,441 51,255
Developed Reserves Thru Latest Year End ($000) 80,782 73,229 68,597 53,945 47,784
Development to Original (%) ... -2.6 -3.9 -7.7 -6.8
Development to Policyholder Surplus (%) ... -2.9 -4.2 -7.1 -5.7
Developed Reserves to Net Premiums Earned (%) 106.0 110.6 96.5 71.0 63.2
Unpaid Reserves @ Latest Year End ($000) 80,782 52,641 36,065 21,760 13,150
Unpaid Reserves to Developed Reserves (%) 100.0 71.9 52.6 40.3 27.5
Year End - December 31
Accident Year: 2017 2016 2015 2014 2013
Original Loss Reserves ($000) 28,141 25,299 27,292 29,530 30,153
Developed Reserves Thru Latest Year End ($000) 28,141 25,290 25,342 29,521 23,260
Development to Original (%) ... ... -7.1 ... -22.9
Unpaid Reserves @ Latest Year End ($000) 28,141 16,576 14,305 8,610 5,578
Accident Year Loss Ratio (%) 60.2 59.3 58.0 60.1 50.9
Accident Year Combined Ratio (%) 97.6 97.5 97.9 96.9 84.1Source: Bestlink - Schedule P (Loss Reserves) - P/C, US
The financial analysis of the intermediate parent Chandler USA, Inc. and the ultimate parent, Chandler Insurance Company, Ltd. havea neutral impact on the rating of the operating insurance company, National American Insurance Company. Chandler InsuranceCompany, Ltd. ("CICL") owns 100% of Chandler USA ("CUSA") which in turn owns 100% of NAICO and Chandler InsuranceManagers, Inc. ("CIMI"). There is no debt held at CICL, but rather at Chandler USA. There is a very strong level of risk-adjustcapitalization at the 99.6 VaR as viewed on a consolidated GAAP basis at CICL and solid and improved operating results through themost recent five-year period should also be noted. Additionally, improved financial flexibility at the ultimate parent company wasachieved through debt reduction to $20.2 million, combined with approximately $1 million in cash and cash equivalents at the ultimateparent. The group's adjusted debt to total capital was 18.6% at December 31, 2017. The financial flexibility, liquidity, and access tocapital markets are considered adequate.
The debt balance of $20.2 million is comprised of Trust Preferreds issued May 22, 2003 and December 16, 2003 with approximately 17years remaining to maturity. Both of these tranches are held at Chandler USA, Inc. The adjusted debt to total capital at December 31,2017 is modest at 18.6% and is within A.M. Best guidelines. In addition to NAICO, Chandler USA has other sources of earnings withinthe organization to service its debt including CIMI, a growing MGA with an expanding third party commission income stream.
NAICO anticipates paying $2 to $4 million in stockholder dividends in 2018 to the holding company, depending on earnings. Thedividends are used for the financial flexibility at Chandler USA, Inc., such as interest payments on the trust preferred debt) and potentialprincipal retirement). Additionally, dividends can be used to free up funds to retire preferred shares or for other internal needs.
www.ambest.com
Page 9 of 19 Printed August 2, 2018
BEST’S RATING REPORT National American Insurance Company (OK)
Operating Performance: AdequateNAICO's operating performance remains consistently profitable, driven by favorable underwriting performance and augmented bymodest but increasing levels of investment income. NAICO has reported pre-tax operating income every year over the most recent ten-year period. Viewed in the aggregate, operating earnings over the recent five-year period have been driven by underwriting income andinvestment income.
An unusually large other income adjustment supplemented pre-tax earnings in 2013, driven by the close of a transaction on a self-insured association that NAICO helped create back in 1984. At the time of the transaction, there were only 11 open claims whichNAICO has handled since day one. During 2013, NAICO entered into a loss portfolio transfer assumption agreement with anunaffiliated self-insurer. NAICO accounted for this transaction as retroactive reinsurance. During 2013, NAICO received cash, net ofcommissions paid, of $1.7 million for the loss portfolio transfer assumption agreement and paid claims in the amount of $210,000. AtDecember 31, 2013, NAICO had a liability for the retroactive reinsurance reserve assumed in the amount of $204,000 and $1.25 millionwas recorded in other income for the gain on retroactive reinsurance reserve assumed.
Despite consistent pre-tax operating income year over year, pre-tax return on revenue measures trail that of the industry compositeover both the recent five and ten-year period, mainly as a reflection of the somewhat low investment returns given the sustained lowinterest rate environment as well as the high ceded premiums.
NAICO has reported consistently sound performance as measured by the combined ratio which has outperformed the commercialcasualty peer composite over the recent five and ten-year period. Net underwriting income has been recorded every year in the pastfive year period through 2017. Underwriting results benefit from a very favorable pure loss ratio, which average 46.0% for the past fiveyears through 2017, as compared to the composite average of 56.4%. However, NAICO gives up some of this benefit with theunderwriting expense ratio which exceeds the peer composite by approximately seven points.
Current market conditions indicate a soft market environment with pockets of firming in GL, APD and slightly harder in AL. Workers'compensation rates are mostly flat but loss costs in the company's geographic spread have been consistently on the decline, thusresulting in lower rates on this book of business. However, workers' compensation margins have remained relatively flat, but top linegrowth has proven more difficult. NAICO continues to be a market leader for oil and gas in Oklahoma and Texas.
Over the past five years, the company's premium growth exhibited some volatility attributed to being directly linked to the oil and gasindustry. Net written premium growth has grown as high as 25.4% in 2013 and as low as a decline of 12.9% the following year. In 2017,net written premium growth of 24.3% was driven by an increase in exposures and rates. NAICO seeks controlled premium growth witha target range of 3-10%, which will maintain an adequate capital position as well as plans to conservatively appoint new agents in keystates. These appointed agents that specialize in NAICO's target industries will have a range of $3 million to $20 million in premiums.Targeting agents within this profile has shown to be positive due to their high level of appreciation for a regional carrier. The company'scurrent directive for 2018 and 2019 is to not reduce workers' compensation rates below the respective NCCI loss cost change in anattempt to offset rate decreases. Management is targeting a 10% to 15% rate increase in auto liability, as this line has under perform forquite some time. The anticipated result and goal is to get the AL line back to a point of break-even. Increasing the general liability andworkers' compensation writing improves the cash flow and overall underwriting results.
NAICO's investment income has increased over the past five years largely due to an increased invested asset base driven byconsistent positive underwriting and operating cash flows. When viewed over the five-year period, the investment yield has declinedsince 2013 and is approximately half that of the peer composite over the long term. The investment yield has remained flat in recentyears at 2.0%, slightly improved from the 1.9% reported during the 2013 to 2014 period. The total return on invested assets also trailsthat of the peer composite as measured over both the five and ten-year period, given the small amount of realized and unrealizedcapital gains reported during the time-frame. The total return on invested asset measure improved in 2016 to 3.9%, benefiting from$1.8 million in realized gains. In 2017, less realized gains were taken and earnings were still strong.
Financial Performance Summary (000)
Year End - December 312017 2016 2015 2014 2013
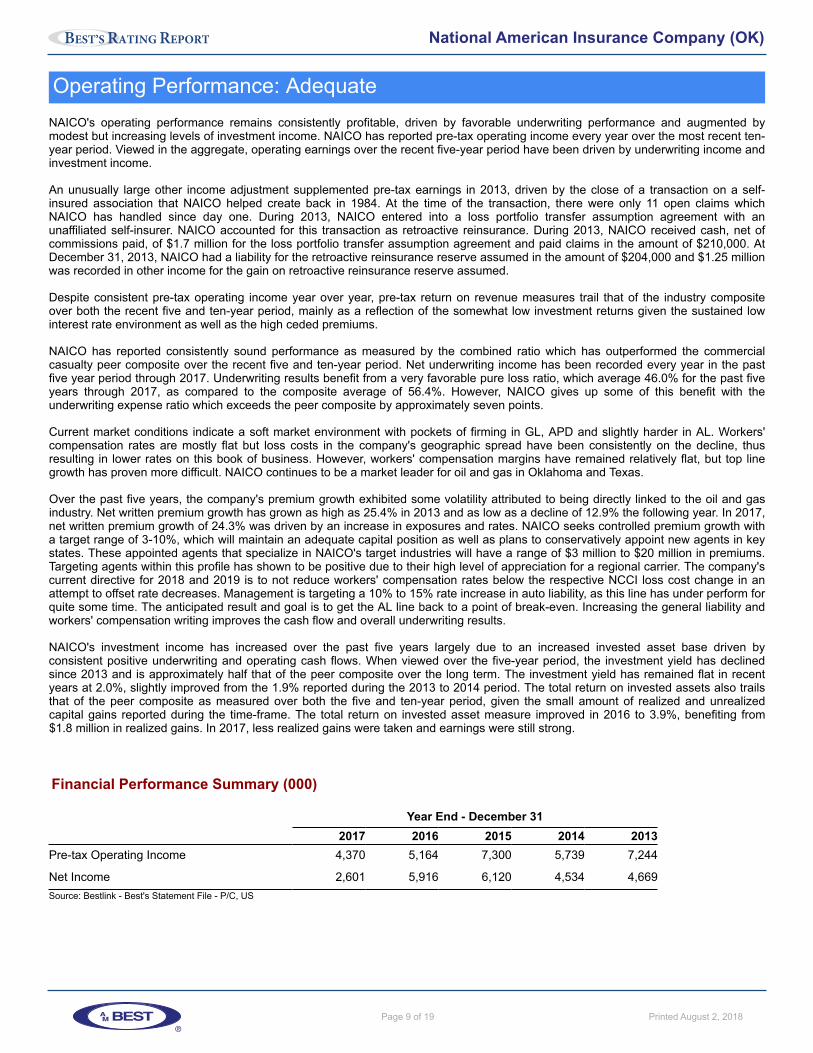
Pre-tax Operating Income 4,370 5,164 7,300 5,739 7,244
Net Income 2,601 5,916 6,120 4,534 4,669Source: Bestlink - Best's Statement File - P/C, US
www.ambest.com
Page 10 of 19 Printed August 2, 2018
BEST’S RATING REPORT National American Insurance Company (OK)
A.M. Best Ratios (%)Company Industry Composite
Year End - December 31 Year End - December 312017 2016 2015 2014 2013 2017 2016 2015 2014 2013
- Combined Ratio - Loss & LAE Ratio - Expense Ratio
www.ambest.com
Page 11 of 19 Printed August 2, 2018
BEST’S RATING REPORT National American Insurance Company (OK)
2017 Pure Loss Ratio by Product Line (%)
0
15
30
45
60
75
Workers'
Comp
Oth Liab O
ccur
Comm'l Auto Liab
Auto Physica
l
Prod Liab
Occ
ur
Surety
Inland M
arine
All Other
41.8 40.9
68.857.2
5.6
24.2 24.5
55.9
Source: Bestlink - Best's Statement File - P/C, US
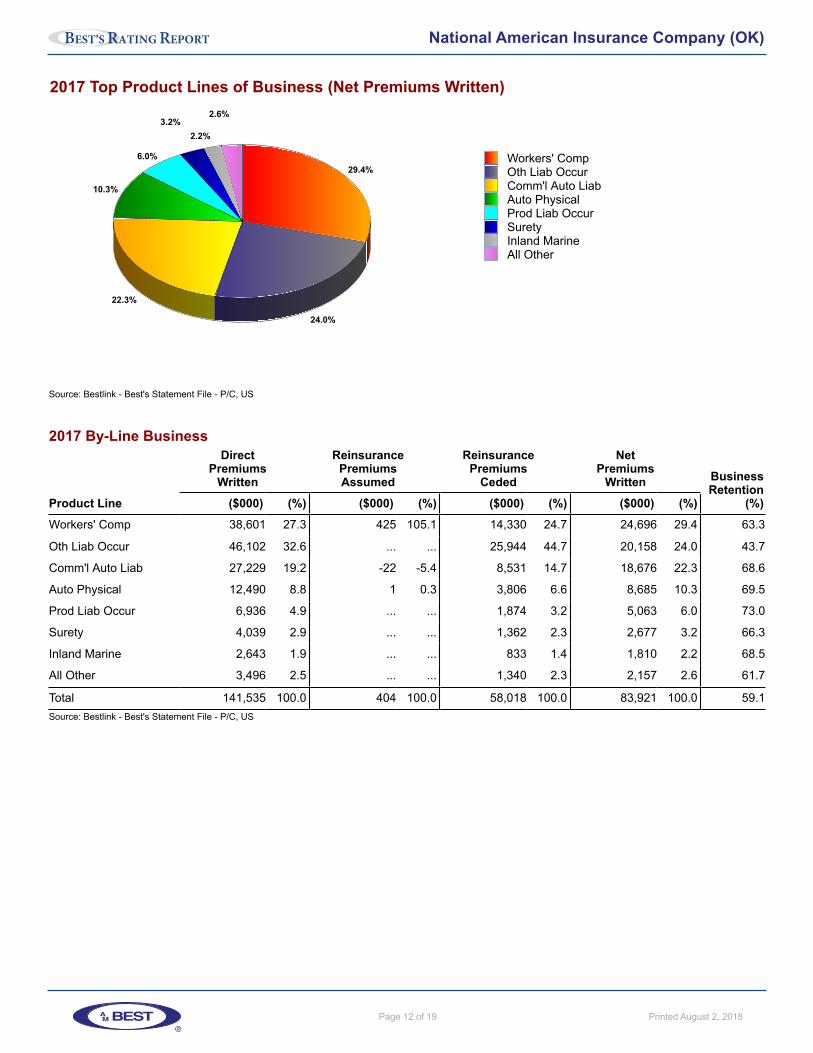
Business Profile: NeutralNAICO's business profile is viewed as neutral due to a well-established oil & gas market presence throughout 38 states in the US,mainly Oklahoma and Texas. NAICO offers various property and casualty insurance products underwritten through its network ofindependent insurance agents. Under the standard lines program, the company's insurance offerings include workers' compensation,auto liability and physical damage, general liability, products liability and umbrella liability insurance. Targeted industry classes includeconstruction, manufacturing, wholesale & retail trade and oil and gas primarily in Oklahoma and Texas. Currently, the company'spremium volume is comprised primarily of WC (29%), Other Liability (24%), Commercial Auto liability (22%), Auto Physical Damage(10%) and Product Liability (6%). NAICO has reduced its auto liability writings in recent years with increased emphasis on writinggeneral liability and workers' comp, which have been its most profitable lines.
The company has partnered with CorVel to lower medical claims costs through auditing medical bills, use of a nationwide PPO networkand the assignment of medical nurses as case managers. They have four people on the company's premises and work directly inNAICO's systems for medical bill review and nurse case management, among other things. In 2017, approximately 60% was saved offof every invoiced medical bill, after CorVel's fees.
Chandler Insurance Managers, Inc. (CIMI), a sister wholesale and MGA operation, also supports the enterprise by placing variouscoverages through a network of unrelated insurance carriers. CIMI's operations provide risk-free fee income to provide additionalfinancial flexibility to the organization.
All Other 3,496 2.5 ... ... 1,340 2.3 2,157 2.6 61.7
Total 141,535 100.0 404 100.0 58,018 100.0 83,921 100.0 59.1Source: Bestlink - Best's Statement File - P/C, US
www.ambest.com
Page 13 of 19 Printed August 2, 2018
BEST’S RATING REPORT National American Insurance Company (OK)
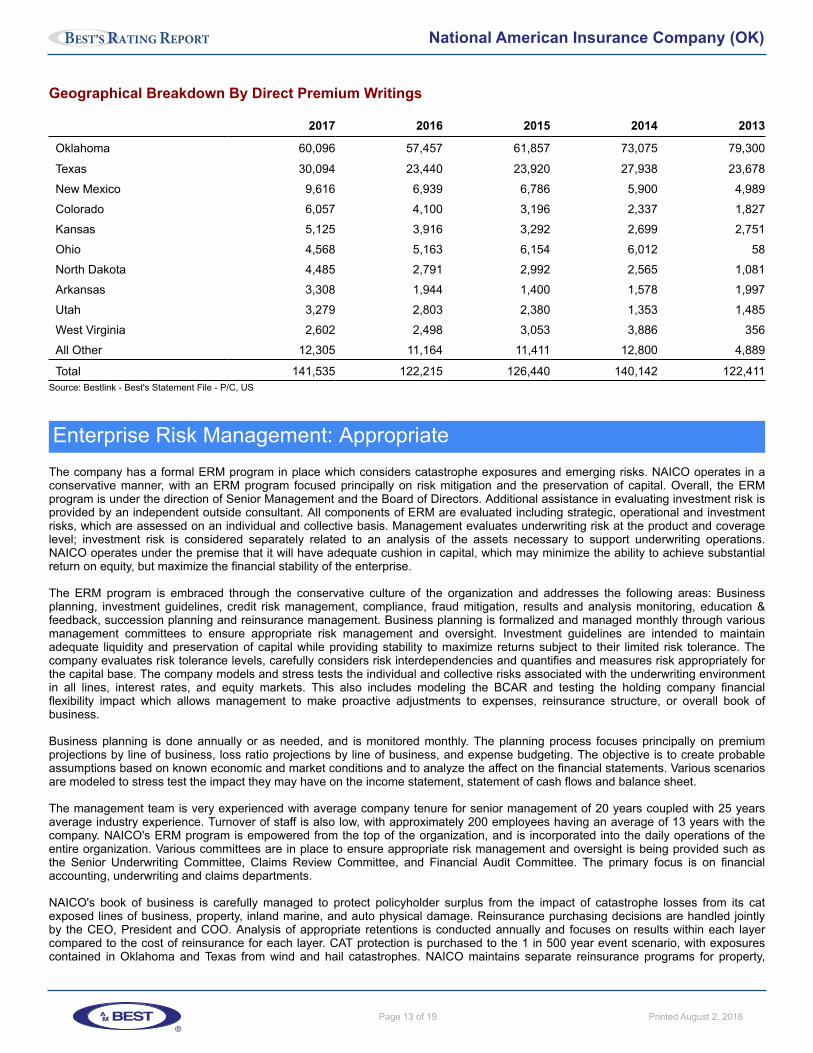
Geographical Breakdown By Direct Premium Writings
2017 2016 2015 2014 2013
Oklahoma 60,096 57,457 61,857 73,075 79,300
Texas 30,094 23,440 23,920 27,938 23,678
New Mexico 9,616 6,939 6,786 5,900 4,989
Colorado 6,057 4,100 3,196 2,337 1,827
Kansas 5,125 3,916 3,292 2,699 2,751
Ohio 4,568 5,163 6,154 6,012 58
North Dakota 4,485 2,791 2,992 2,565 1,081
Arkansas 3,308 1,944 1,400 1,578 1,997
Utah 3,279 2,803 2,380 1,353 1,485
West Virginia 2,602 2,498 3,053 3,886 356
All Other 12,305 11,164 11,411 12,800 4,889
Total 141,535 122,215 126,440 140,142 122,411Source: Bestlink - Best's Statement File - P/C, US
Enterprise Risk Management: AppropriateThe company has a formal ERM program in place which considers catastrophe exposures and emerging risks. NAICO operates in aconservative manner, with an ERM program focused principally on risk mitigation and the preservation of capital. Overall, the ERMprogram is under the direction of Senior Management and the Board of Directors. Additional assistance in evaluating investment risk isprovided by an independent outside consultant. All components of ERM are evaluated including strategic, operational and investmentrisks, which are assessed on an individual and collective basis. Management evaluates underwriting risk at the product and coveragelevel; investment risk is considered separately related to an analysis of the assets necessary to support underwriting operations.NAICO operates under the premise that it will have adequate cushion in capital, which may minimize the ability to achieve substantialreturn on equity, but maximize the financial stability of the enterprise.
The ERM program is embraced through the conservative culture of the organization and addresses the following areas: Businessplanning, investment guidelines, credit risk management, compliance, fraud mitigation, results and analysis monitoring, education &feedback, succession planning and reinsurance management. Business planning is formalized and managed monthly through variousmanagement committees to ensure appropriate risk management and oversight. Investment guidelines are intended to maintainadequate liquidity and preservation of capital while providing stability to maximize returns subject to their limited risk tolerance. Thecompany evaluates risk tolerance levels, carefully considers risk interdependencies and quantifies and measures risk appropriately forthe capital base. The company models and stress tests the individual and collective risks associated with the underwriting environmentin all lines, interest rates, and equity markets. This also includes modeling the BCAR and testing the holding company financialflexibility impact which allows management to make proactive adjustments to expenses, reinsurance structure, or overall book ofbusiness.
Business planning is done annually or as needed, and is monitored monthly. The planning process focuses principally on premiumprojections by line of business, loss ratio projections by line of business, and expense budgeting. The objective is to create probableassumptions based on known economic and market conditions and to analyze the affect on the financial statements. Various scenariosare modeled to stress test the impact they may have on the income statement, statement of cash flows and balance sheet.
The management team is very experienced with average company tenure for senior management of 20 years coupled with 25 yearsaverage industry experience. Turnover of staff is also low, with approximately 200 employees having an average of 13 years with thecompany. NAICO's ERM program is empowered from the top of the organization, and is incorporated into the daily operations of theentire organization. Various committees are in place to ensure appropriate risk management and oversight is being provided such asthe Senior Underwriting Committee, Claims Review Committee, and Financial Audit Committee. The primary focus is on financialaccounting, underwriting and claims departments.
NAICO's book of business is carefully managed to protect policyholder surplus from the impact of catastrophe losses from its catexposed lines of business, property, inland marine, and auto physical damage. Reinsurance purchasing decisions are handled jointlyby the CEO, President and COO. Analysis of appropriate retentions is conducted annually and focuses on results within each layercompared to the cost of reinsurance for each layer. CAT protection is purchased to the 1 in 500 year event scenario, with exposurescontained in Oklahoma and Texas from wind and hail catastrophes. NAICO maintains separate reinsurance programs for property,
www.ambest.com
Page 14 of 19 Printed August 2, 2018
BEST’S RATING REPORT National American Insurance Company (OK)
workers' compensation, casualty, auto physical damage, and surety bonds. Multi-line excess of loss agreements recover casualtylosses above $2 million up to $20 million and an underlying quota share agreement with Chandler Ltd. reduces the company's netretention to 78% of the first $2 million. The quota share was changed effective 7/1/17, reduced to 22% ceded to Chandler Ltd. from30% in prior years. Casualty programs are covered through umbrella excess of loss treaties providing coverage in the amount of $10million excess of $1 million retention. Workers' compensation losses are covered for limits excess of $1 million up to $30 million, and anunderlying quota share agreement with Chandler Ltd. reduces the company's retention to 78% of the first $1 million of loss peroccurrence. Auto physical damage risks are reinsured for losses above $2 million up to $5 million, while an underlying quota shareagreement with Chandler Ltd. reduces the company's net retention to 78% of the first $2 million. Property risks are reinsured for lossesabove $500,000 of loss per risk, while an underlying quota share agreement with Chandler Ltd. reduces the company's net retention to78% of the first $500,000. Boiler and machinery risks are reinsured 100% under a quota share treaty. The workers' compensationexcess of loss and umbrella quota share treaties both include terrorism coverage. NAICO passes the terrorism stress test on all VaRs.
Risk concentration is largely driven by two states and within a few lines of business, although the company has a strong understandingof its markets. Oklahoma is the biggest state (43%), but the regulatory environment is very favorable for workers' compensationbusiness. Claims can be closed on a full and final basis in Oklahoma and are typically closed very quickly. In 2013, a sizemicearthquake driven by oil and gas was experienced in Oklahoma, and thus an earthquake exclusion was added to all policies thereafter.No adverse trends have been acknowledged given the concentration.
Emerging risks are continually identified and monitored. Oil and gas fracking exposure is an emerging risk for energy writers. NAICOadheres to a best practices policy in order to avoid this exposure. NAICO provides limited coverage for fracking environmental losses.Fracking service contractors are an excluded class, Casing and Cementing service contractors are an excluded class, and NAICO hasreduced exposures to lease operators with fracking exposures. NAICO is also considering adding cyber to its GL policies as it is alsoan emerging risk. This would be 100% pass through to HSB and NAICO would bear no risk.
The company's IT system is solid and fully integrated into the operations. However, it is currently undergoing a user interface updatethat is 40% complete and will make it more intuitive for the internal system. A web developer was hired for this update.
www.ambest.com
Page 15 of 19 Printed August 2, 2018
BEST’S RATING REPORT National American Insurance Company (OK)
Other expenses incurred ... Other income / expense ...
Dividends to policyholders ... Dividends to policyholders ...
Net underwriting income 890 Underwriting cash flow 16,623
Net transfer ...
Net investment income 3,474 Investment income 4,876
Other income/expense 6 Other income/expense 6
Pre-tax operating income 4,370 Pre-tax cash operations 21,505
Realized capital gains 345
Income taxes incurred 2,115 Income taxes pd (recov) 2,017
Net income 2,601 Net oper cash flow 19,488Source: Bestlink - Best's Statement File - P/C, US
www.ambest.com
Page 17 of 19 Printed August 2, 2018
BEST’S RATING REPORT National American Insurance Company (OK)
National American Insurance Company (OK)Report Revision Date:July 11, 2018
Company Attributes:
Industry: InsuranceBusiness Type: Property/CasualtyEntity Type: Operating CompanyOrganization Type: StockBusiness Status: In Business - Actively UnderwritingMarketing Type: Independent AgencyFinancial Size: VII ($50 Million to $100 Million)
Company History:
Date Incorporated: 04/11/1919 Date Commenced: 1919 Domicile: United States: Oklahoma
This company was incorporated on April 11, 1919, under the laws of Nebraska as the American National Fire Insurance Company andbegan business October 23, 1919. Shortly after commencement of business, the title was changed to the National American FireInsurance Company. Another revision made early in 1952 eliminated the word "Fire" from the name. The company was redomesticatedfrom Nebraska to Oklahoma on May 19, 2000. Paid-up capital of $5,000,000 consists of 20,000 shares of $250 par value commonstock. There are 30,000 authorized common shares.
Affiliations: The company is a member of the Insurance Services Office, the National Council on Compensation Insurance and theNational Association of Independent Insurers.
Company Operations:
Licensed Territory: (Current since 06/27/2018).The company is licensed in the District of Columbia, AL, AK, AZ, AR, CA, CO, CT, DE,FL, GA, HI, ID, IL, IN, IA, KS, KY, LA, ME, MD, MI, MN, MS, MO, MT, NE, NV, NH, NJ, NM, NY, NC, ND, OH, OK, OR, PA, RI, SC, SD,TN, TX, UT, VT, VA, WA, WV, WI and WY.
2017Rank Top 5 Lines of Business by NPW1 Workers' Comp 29.4%2 Oth Liab Occur 24.0%3 Comm'l Auto Liab 22.3%4 Auto Physical 10.3%5 Prod Liab Occur 6.0%
2017Rank Top 5 Geographic Distribution by DPW1 United States: OK 42.5%2 United States: TX 21.3%3 United States: NM 6.8%4 United States: CO 4.3%5 United States: KS 3.6%
Source: Bestlink - Best's Statement File - P/C, US
Company Management:
Last significant update on 05/09/2017
www.ambest.com
Page 18 of 19 Printed August 2, 2018
BEST’S RATING REPORT National American Insurance Company (OK)
Company Management: (Continued...)
The affairs of the company are directed by experienced insurance executives headed by W. Brent LaGere, chairman of the board andchief executive officer. Mr. LaGere also serves in the same capacity with Chandler Insurance Managers, Inc., Chandler U.S.A. Inc., andChandler Insurance Company, Ltd., as do certain other members of senior management.
Officers
Chairman of the Board and CEO: W. Brent LaGereVice Chairman and Chief Investment Officer: Mark T. PadenPresident and COO: Lance A. LaGereEVP: Malinda K. LairdSVP, Secretary and General Counsel: R. Patrick GilmoreSVP, Treasurer and CFO: Mark C. Hart (Finance)SVP: Richard L. Evans (Claims)SVP: Gary C. LaGereVice President: N. Kyle Baker (Marketing)Vice President: J. Steven Bell (Claims-Legal)Vice President: M. Steven Blain (Underwriting)Vice President: Douglas S. Bridge (Administration)Vice President: Anthony G. Gray (Loss Control)Vice President: Tracie A. LaGere (Claims, Administration)Vice President: David A. Little (MIS)
Directors
R. Patrick GilmoreLance A. LaGereW. Brent LaGere (Chairman)W. Scott MartinMark T. Paden (Vice Chairman)Kerwin R. Price, Jr.Robert L. Rice
Regulatory:
Auditor: HoganTaylor LLP
An examination of the financial condition was made as of December 31, 2015, by the insurance department of Oklahoma. The 2017annual independent audit of the company was conducted by HoganTaylor LLP. The annual statement of actuarial opinion is provided byE. James Stergiou, ACAS, MAAA, SG Risk, LLC.
A Best's Financial Strength Rating opinion addresses the relative ability of an insurer to meet its ongoing insurance obligations. The ratings are not assigned to specific insurance policies or contracts anddo not address any other risk, including, but not limited to, an insurer's claims-payment policies or procedures; the ability of the insurer to dispute or deny claims payment on grounds of misrepresentationor fraud; or any specific liability contractually borne by the policy or contract holder. A Financial Strength Rating is not a recommendation to purchase, hold or terminate any insurance policy, contract orany other financial obligation issued by an insurer, nor does it address the suitability of any particular policy or contract for a specific purpose or purchaser.
A Best's Issue/Issuer Credit Rating is an opinion regarding the relative future credit risk of an entity, a credit commitment or a debt or debt-like security.
Credit risk is the risk that an entity may not meet its contractual, financial obligations as they come due. These credit ratings do not address any other risk, including but not limited to liquidity risk, marketvalue risk or price volatility of rated securities. The rating is not a recommendation to buy, sell or hold any securities, insurance policies, contracts or any other financial obligations, nor does it address thesuitability of any particular financial obligation for a specific purpose or purchaser.
In arriving at a rating decision, A.M. Best relies on third-party audited financial data and/or other information provided to it. While this information is believed to be reliable, A.M. Best does notindependently verify the accuracy or reliability of the information. Any and all ratings, opinions and information contained herein are provided "as is," without any express or implied warranty.
Visit http://www.ambest.com/ratings/notice.asp for additional information or http://www.ambest.com/terms.html for details on the Terms of Use. For current rating visit www.ambest.com/ratings