89
EKC316 – Separation Process Drying Process Dr. Azam Taufik Mohd Din School of Chemical Engineering Universiti Sains Malaysia
| Date post: | 09-Jul-2016 |
| Category: |
Documents |
| Upload: | sathiswaran-selvam |
| View: | 227 times |
| Download: | 2 times |

EKC316 – Separation Process Drying Process
Dr. Azam Taufik Mohd Din
School of Chemical Engineering
Universiti Sains Malaysia
W e l e a d
• What is drying?
• A method to remove moisture via evaporation from one material through a supply of heat to form a solid.
• One of the oldest/basic chemical engineering unit operation.

W e l e a d
Dried grapes/raisins

W e l e a d

W e l e a d

W e l e a d

W e l e a d
W e l e a d
W e l e a d
• Supplying heat in drying process
– Convection
– Conduction
– Radiation
– Microwave
– Radio frequency electromagnetic field
– Combination

W e l e a d
• Moisture is driven out over time through the following means:
– Liquid diffusion
– Vapour diffusion
– Knudsen diffusion
– Surface diffusion (unproven)
– Hydrostatic pressure differences
– Combination
W e l e a d
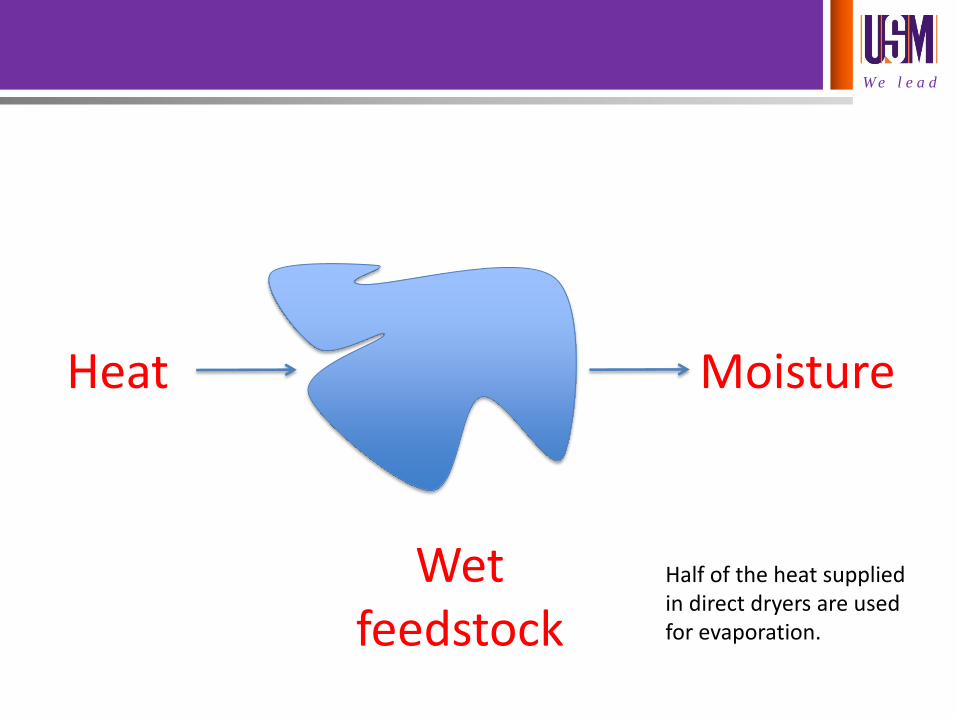
Heat Moisture
Wet feedstock
Half of the heat supplied in direct dryers are used for evaporation.

W e l e a d

W e l e a d
• Radiation

W e l e a d
• Purpose of drying:
– Preservation and storage of products
– Ease logistics and transportation cost
– Product packaging

W e l e a d
• In drying of food materials, which requires careful hygienic attention, the availability of water for growth of microorganisms, germination of spores, and participation in several types of chemical reaction becomes an important issue.

W e l e a d
• Water activity, aw, is defined as the ratio of the partial pressure, p, of water over the wet solid system to the equilibrium vapor pressure, pw, of water at the same temperature.
• Thus, aw, which is also equal to the relative humidity of the surrounding humid air, is defined as:
aw = p/pw
W e l e a d
• If aw is reduced below these values by dehydration or by adding water-binding agents like sugars, glycerol, or salt, microbial growth is inhibited.

W e l e a d

W e l e a d
• Liverwurst 0.96
• Cheese Spread 0.95
• Red Bean Paste 0.93
• Caviar 0.92
• Fudge Sauce 0.83
• Soy Sauce 0.80
• Peanut Butter 15% total moisture 0.70
• Dry Milk 8% total moisture 0.70
WATER ACTIVITY (a w) OF SOME COMMON FOODS*
*http://www.fda.gov/ICECI/Inspections/InspectionGuides/InspectionTechnicalGuides/ucm072916.htm

W e l e a d

W e l e a d
Fig: Deterioration rates as a function of water activity for food systems
Browning reaction: https://www.youtube.com/watch?v=gk_rPkglyao https://www.youtube.com/watch?v=ZwU8xY5VnQk&ebc=ANyPxKrHOt_AATu6xf6lIUNU76pqVeO7uufKUNbmTxX12ZV7prxumLWCwA36rub7IyIAH2ISNinP

W e l e a d
• Drying terminalogy:
• Bound moisture - Liquid physically and/or chemically bound to solid matrix so as to exert a vapor pressure lower than that of pure liquid at the same temperature.
• Unbound moisture - Moisture in solid which exerts vapor pressure equal to that of pure liquid at the same temperature.

W e l e a d
• If the equilibrium moisture content of a given material is continued to its intersection with the 100% humidity line, the moisture is called bound water.
• If such a material contains more than indicated by intersection with the 100% humidity line, it can still exert only a vapor pressure as high as that of ordinary water at the same temperature. This excess moisture content is called unbound water, and it is held primarily in the voids of solid.
• Hygroscopic materials - Substances containing bound water.

W e l e a d

W e l e a d
• Free moisture content is the moisture above the equilibrium moisture content.
• Free moisture content is the moisture that can be removed by drying under a given set of conditions (T and humidity of drying gas).

W e l e a d
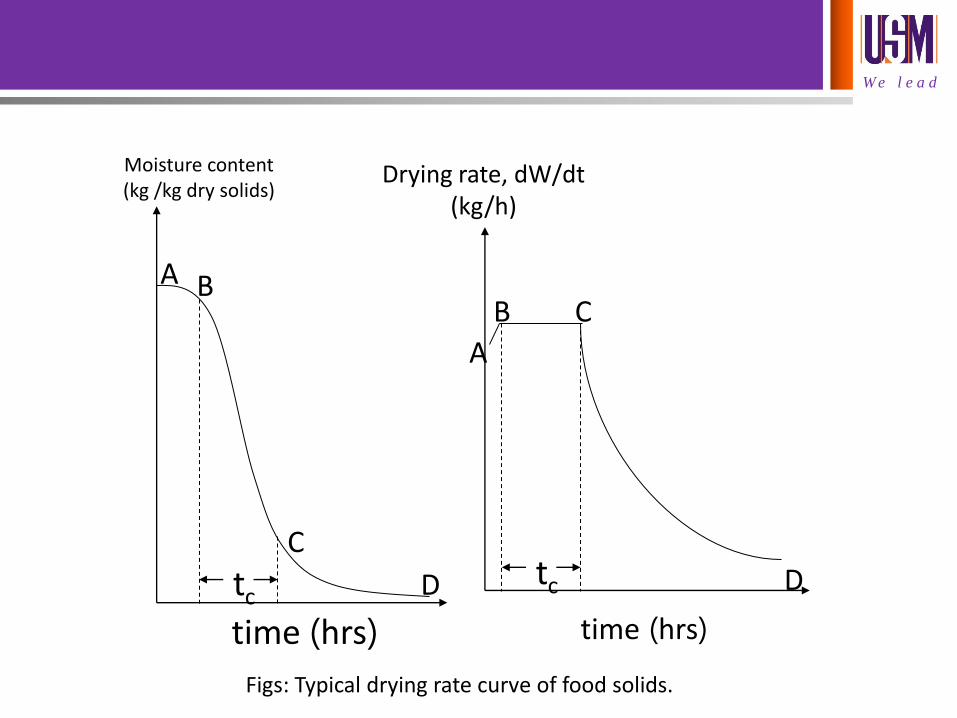
• Constant rate drying period - under constant drying conditions, drying period when evaporation rate per unit drying area is constant (when surface moisture is removed).
• Falling rate drying period - under constant drying conditions, during which the rate falls continuously in time.
W e l e a d
time (hrs)
A B
C
D
time (hrs)
Moisture content (kg /kg dry solids)
D
Drying rate, dW/dt (kg/h)
A
B C
tc tc
Figs: Typical drying rate curve of food solids.
W e l e a d
• AB = Settling down period where the solid surface conditions come into equilibrium with the drying air.
• BC = Constant rate period which the surface of the solid remains saturated with liquid because the movement of water vapour to the surface equals the evaporation rate. Thus the drying rate depends on the rate of heat transfer to the drying surface and temperature remains constant.
• C = Critical moisture content where the drying rate starts falling and surface temperature rises.
• CD = Falling rate period which surface is drying out and the drying rate falls. This is influenced by the movement of moisture within the solid and take time.

W e l e a d
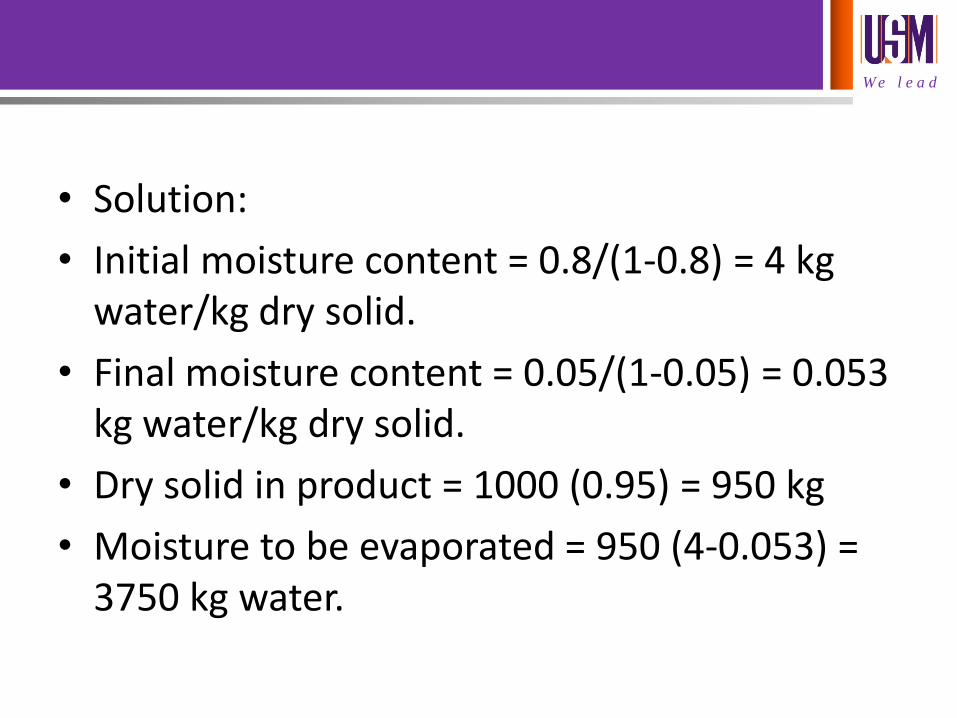
• In-class Example:
• A wet solid is to be dried from 80% to 5% moisture. Compute the moisture to be evaporated, per 1000 kg of dried products.
W e l e a d
• Solution:
• Initial moisture content = 0.8/(1-0.8) = 4 kg water/kg dry solid.
• Final moisture content = 0.05/(1-0.05) = 0.053 kg water/kg dry solid.
• Dry solid in product = 1000 (0.95) = 950 kg
• Moisture to be evaporated = 950 (4-0.053) = 3750 kg water.

W e l e a d
Quiz 1:
A wet solid is to be dried from 75% to 10% moisture. Compute the moisture to be evaporated, per 500 kg of dried products.

W e l e a d
• Rate of drying curves for constant drying conditions
– Conversion of data to rate-of-drying curve
– Plot of rate-of-drying curve

W e l e a d

W e l e a d
The drying-rate curve is obtained by plotting R vs. the moisture content.

W e l e a d

W e l e a d
W e l e a d

W e l e a d
• Drying in the constant-rate period:
• The surface of the solid is initially very wet and a continuous film of water exists on the drying surface.
• The water is entirely unbound water.
• The rate of evaporation is essentially the same as the rate from a free liquid surface.

W e l e a d
• Drying-rate in falling period:

W e l e a d
W e l e a d
• Moisture movement in solids during falling rate period drying:
• Liquid diffusion – concentration difference
• Capillary action – surface tension
• Shrinkage – hard layer/case hardening

W e l e a d

W e l e a d
• Calculation method for constant-rate drying period:
– Using drying curve.
– Using rate-of-drying curve.

W e l e a d
• In-class example 2 (drying curve):
A solid whose drying curve is represented in Fig 9.5-1a is to be dried from a free moisture content X1 = 0.35 kg water/kg dry solid to X2 = 0.25 kg H2o/kg dry solid. Estimate the time, t required.

W e l e a d
• From Fig 9.5-1a,
• X1 = 0.35, t = 1.60 h
• X2 = 0.25, t = 3.0 h
• t = 3.0 – 1.6 = 1.4 h

W e l e a d
• From Eq 9.5-3, integrate over t interval for drying at X1, t1 = 0 and X2, t2 = t and rearrange:

W e l e a d
• Since drying at constant-rate period, X1 and X2 are greater than Xc, then R = Rc.
• Integrate 9.6-1 to:

W e l e a d
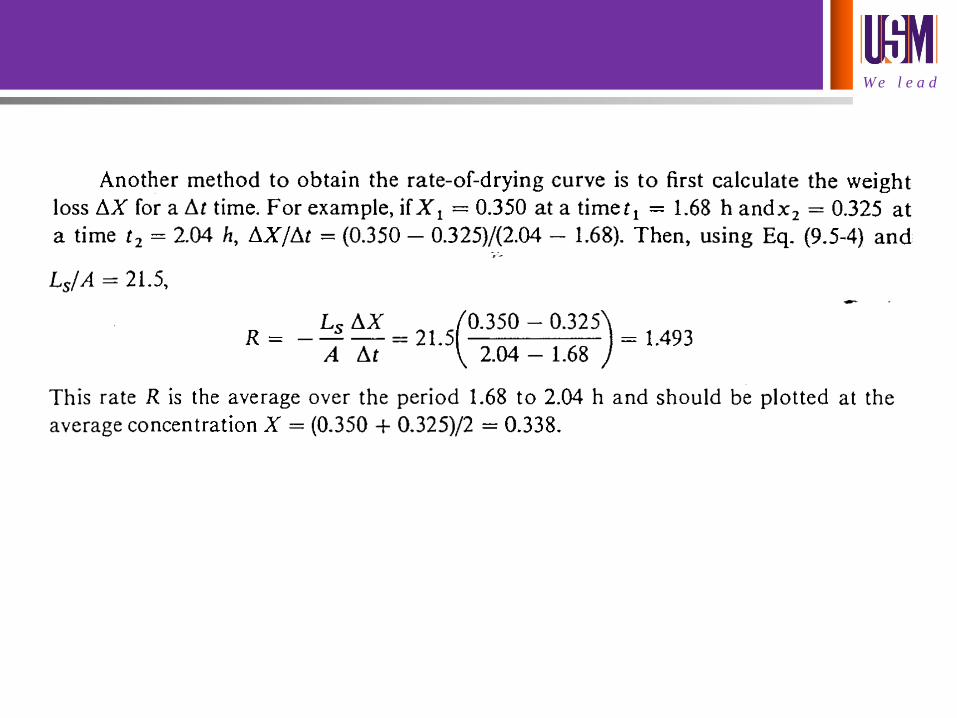
• In-class example 3 (drying-rate curve):
• Repeat in-class example 2 but use Fig 9.5-1b.
• Ls/A is given as 21.5.
• Rc = -21.5 [(0.35-0.25)/(1.6-3.0)] = 1.53 kg water/h.m2
• t = (21.5/1.53)(0.35-0.25) = 1.4 h

W e l e a d
• Use of predicted transfer coefficient for constant-rate drying period.
W e l e a d
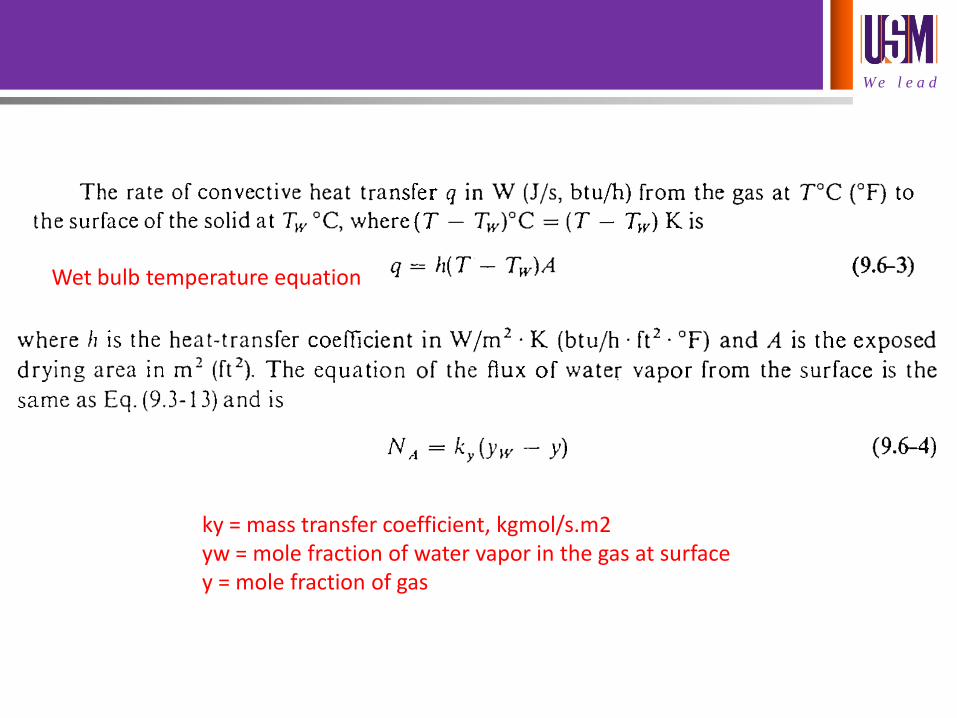
ky = mass transfer coefficient, kgmol/s.m2 yw = mole fraction of water vapor in the gas at surface y = mole fraction of gas
Wet bulb temperature equation
W e l e a d

W e l e a d
• Using the approximation from Eq. 9.3-15 and substituting into Eq. 9.6-4:
NA = ky(MB/MA)(Yw – Y) (9.6-5)
• Where MB = mw for air, MA = mw for water, Yw = humidity of air at wet bulb temp, Y = humidity of air at T.

W e l e a d
Rc = q/(Aλw) = [h(T-Tw)]/ λw]
= kyMB(Yw-Y) 9.6-7
9.6-8

W e l e a d

W e l e a d

W e l e a d
• In-class example 4:

W e l e a d
• T dry bulb = 65.6 ºC = 338.6 K
• Y’ = 0.01 kg water/kg dry air.
• Use Psychrometric chart to obtain Tw and Yw.
• Tw = 28.9 ºC = 301.9 K
• Yw = 0.026 kg water/kg dry air

W e l e a d
• Calculate humid volume:
• ѵH = 0.974 m3/kg dry air

W e l e a d
• The density of dry air (1.0 kg dry air) + moisture (0.01 kg water):
• ρ = mass/volume = (1.0 + 0.01)/0.974
= 1.037 kg/m3
Calculate mass velocity, G:
G = vρ = (6.1 m/s)(3600 s/h)(1.037 kg/m3) = 22770
kg/m2.h

W e l e a d
• Use Equation 9.6-9 to calculate h (parallel flow)
• h = 0.0204G0.8 = 0.0204 (22770)0.8
= 62.45 W/m2.K

W e l e a d
• To calculate Rc, we need the value of λw
(latent heat) at Tw = 28.9 ºC. Use steam table.

W e l e a d
• Interpolation to get λw = 2433 kJ/kg
Rc solved for = 3.39 kg water/h.m2
Total evaporation rate = RcA
= (3.39)(0.457 x 0.457)
= 0.708 kg water/h

W e l e a d
• Effect of process variables on constant-rate period.
– Air velocity, v
• The Rc is proportional to h and G0.8 for air flow paralel to the surface. (when radiation & convection off)
• Effect of v is less important when radiation and conduction are present.

W e l e a d
Drying rate increased with air velocity for moisture contents above approximately 40% to 50%.

W e l e a d

W e l e a d
W e l e a d
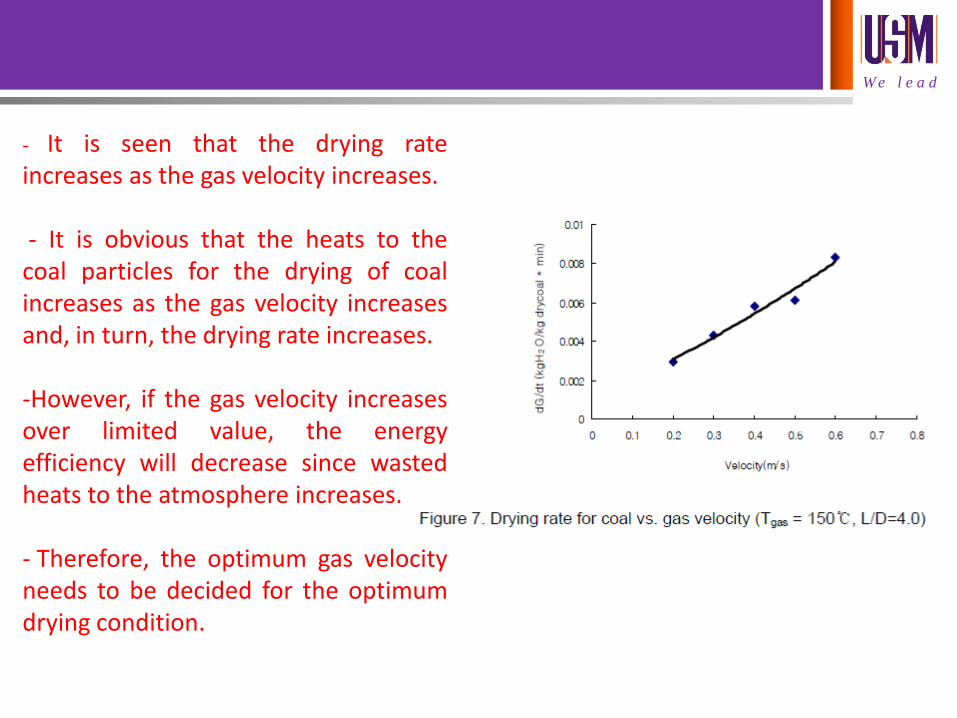
- It is seen that the drying rate increases as the gas velocity increases. - It is obvious that the heats to the coal particles for the drying of coal increases as the gas velocity increases and, in turn, the drying rate increases. -However, if the gas velocity increases over limited value, the energy efficiency will decrease since wasted heats to the atmosphere increases. - Therefore, the optimum gas velocity needs to be decided for the optimum drying condition.

W e l e a d
– Gas humidity, Y
• If the gas humidity, Y is decreased for a given T of the gas, then from the psychrometric chart the Tw will decrease.
• At initial, Rc1, T1, Tw, Y1 and Yw1; then Y1 changed to Y2 and Yw1 to Yw2:
W e l e a d

W e l e a d

W e l e a d
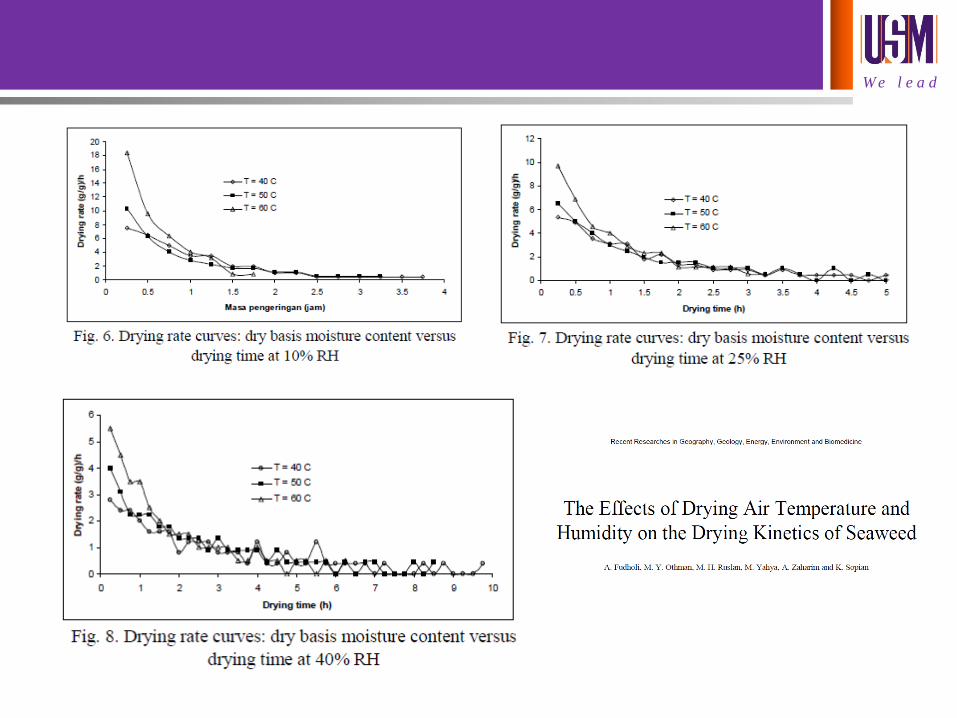
• Figure 3a & b show the effect of different relative humidities on the drying rates at 70 and 75C. At the lower temperatures (55, 60 and 65C), only slight differences were observed between drying rate maxima at different drying air RH's. The maximum drying rates at 70C decreased as RH increased. The trend was also observed at 75C (Figure 3b), except at 30 and 35% RH, which both had slightly higher drying rate maximums than at 25% RH, probably due to higher initial product temperatures causing initial drying rates to be higher. This is contrary to the work of Kiranoudis el al. (8) on green peppers, who found that relative humidity did not affect drying rate, but this was probably due to the very low humidities (5 - 17% RH) used by these authors. The results of this study are in agreement with Rocha et al. (20) who found that increasing air humidity decreased the drying rate of basil. The observed effect of RH, in this study is in agreement with theoretical considerations (2, 3, 9, 18), as well as that found for other vegetables or spices (20). Water evaporation at the surface of the food is dependent on the water vapour pressure gradient between the surface of the food and the air (19). Humid air has the effect of lowering the gradient and thus retarding evaporation and the drying rate.

W e l e a d
• Effect of gas temperature
– If T is increased, Tw is also increased some, but not as much as the increase in T.

W e l e a d
The slopes of the curves in Figure 3 designate rate of drying. It is seen that the drying rate increases as the gas temperature increases.

W e l e a d
• Effect of solid thickness
– The Rc is independent of the thickness x1 of the solid (heat transfer by convection).
– The drying time t between fixed moisture content X1 and X2 will be directly proportional to the thickness x.
– Increasing of thickness with a constant A will directly increase the amount of Ls kg dry solid.

W e l e a d

W e l e a d
Calculation method for falling-rate period.
• In the falling rate period, the rate of drying is not constant but decreases when drying passing the critical free moisture content, Xc.

W e l e a d
• For any shape of falling-rate drying curve, Eq. 9.6-1 can be graphically integrated by plotting 1/R vs. X and compute the are under the curve.

W e l e a d
• In-class example 5

W e l e a d
Solution:

W e l e a d

W e l e a d

W e l e a d

W e l e a d
• When R is a linear function of X
• R = aX + b (If both X1 & X2 < XC, R is linear in X)
slope

W e l e a d

W e l e a d
• If rate is linear trough origin:
• R = aX

W e l e a d

W e l e a d
• In-class example 6

W e l e a d
• Solution:

Thank you
Presented by
Name | Centre/Schools/Units etc


