Page 1
Nwankwo S. I et al Int. Journal of Engineering Research and Applications www.ijera.com
ISSN : 2248-9622, Vol. 4, Issue 2( Version 4), February 2014, pp.05-26
www.ijera.com 5 | P a g e
Post-Occupancy Evaluation of Modification of Residential
Buildings for Effective and Efficient Mass Housing Delivery: Case
Study of Owerri Urban, South-Eastern Nigeria
Nwankwo S. I1, Diogu J. O
2, Nwankwo C. V
3 & Okonkwo M. M
4
1Department of Architecture, Abia State University Uturu, Nigeria
2Department of Architecture, Imo State University Owerri, Nigeria
4Department of Architecture, Nnamdi Azikiwe University Awka, Anambra State, Nigeria
3Department of Estate Management, Abia State University Uturu, Nigeria.
ABSTRACT This study evaluates Aladinma and Prefab Housing Estates in Owerri Urban South-Eastern Nigeria which is
experiencing population increase emanating from rapid urbanization. The aim is to improve future mass housing
delivery in the area through feed-back information from the building consumers. The specific objectives were:
to establish the nature and extent of post-occupancy modifications carried out in the estates; to determine the
reasons for the modification and factors of satisfaction that are necessarily required to be considered in the
programming and design of residential buildings in the study area for optimal performance; and to develop a
mathematical method of conducting post-occupancy evaluation of modification of residential buildings.. The
evaluation was based on a theoretical frame work of tripartite quality of architecture emphasized by Vitruvius;
Utilitas (functionality or utility value: the social dimension), Firmitas (strength and rigidity: the technological
dimension) and Venustas (beauty: the aesthetic dimension). The methodology involved field survey or case
study. The field study involves six research approaches: archival retrieval; comparative mapping; physical trace
identification; observations; questionnaires and interviews. The sample population of 405 building consumers
and 409 housing units from the population of 1261 were used. The quantitative data were analyzed using SPSS
software and the results were exported to Microsoft Excel to generate the graphs used. The research revealed
that Overall Modification Index for model predicted data was 0.9126 and overall experimental data was 0.9126
with Overall Deviation of 0.00%. Average Modification Index for Housing Estates in Owerri South-Eastern
Nigeria was 0.9126. Design factors that necessitated post-occupancy modifications in the study area were:
functionality- 92.6 percent; Aesthetic- 92.7 percent; and Constructional issue- 97.3 percent. This implied that for
a sustainable housing estate to be achieved, the concept of Equilibrium of Appropriate Balance (Construct-
Functional Aesthetic Balance) has to be adopted. The consumers of building products should be involved in the
programming, design and construction of their buildings to capture their needs and aspirations. Overall
Modification Index for Owerri was 91.26%. The Authors successfully developed a mathematical model for
Post-occupancy evaluation of modification of residential buildings in Owerri, South-Eastern Nigeria
𝑀𝐼𝑀𝑂𝐷𝑂𝑣𝑒𝑟𝑎𝑙𝑙 = 𝐶𝐼𝑀𝐼𝐼𝐴𝑉 which can be used in evaluating modification of public residential buildings in other
states in Nigeria.
Keywords: Post-occupancy evaluation, modification, Mass Housing, Building Consumers, Index.
I. INTRODUCTION Housing is one of the three basic needs of
mankind and it is the most important for the physical
survival of man after the provision of food. Many
researchers Kadir (2005), Aribigbola (2008), Adedeji
(2005), Ademiluyi and Raji (2008) have viewed
housing shortage as a result of urbanization which
resulted in increase in population in urban centers. In
Nigeria, government has actively sought to alleviate
the problem of housing by addressing basic needs of
the urban poor through ambitious initiatives such as
public housing schemes (Wahab, 1983). These public
housing initiatives have been implemented for over
five decades with the completion and occupation of
thousands of houses in different housing estates
spread all over the six geo-political zones of Nigeria.
Imo State Housing Corporation Owerri in South-
Eastern Nigeria has thirteen housing estates to her
credit while Federal Housing Authority Owerri has
four. The housing estates include Aladinma Housing
Estate, Prefab Housing Estate, Uratta Road Housing
Estate, Federal Housing Estate Egbeada, Trans-Egbu
Housing Estate, Uratta Road Housing Estate, Federal
Housing Estate Egbeada and etcetera.
Reconnaissance or pilot survey done by the
researchers on some of the public housing estates in
the study area reveals that most of the building units
RESEARCH ARTICLE OPEN ACCESS
Page 2
Nwankwo S. I et al Int. Journal of Engineering Research and Applications www.ijera.com
ISSN : 2248-9622, Vol. 4, Issue 2( Version 4), February 2014, pp.05-26
www.ijera.com 6 | P a g e
have been modified while the remaining ones are
currently undergoing modification. Since 1995 till
date, the researchers have modified so many
buildings for clients in Federal Housing Estate
Egbeada, Aladinma and Prefab Housing Estates. This
modification could rightly be viewed as
acknowledgement of failure of the estates and at the
same time deflates the exalted regard for the
architectural profession and social role of architecture
on society. The architectural designs of the
residential buildings in the housing estates which are
being modified were in their days succeeded to be
registered and approved for construction thus became
a contract of the architect with the society‟s spirit of
the time (Zeitgeist) for generation of a material
culture of a people (Nwankwo, 2013). And so, the
post-occupancy modification constitutes a breach, as
it were, of an essential aspect of that contract and it
distorts and manipulates the harmony of a people‟s
built environment and historical development,
especially in their material culture. The built
environment is at the very heart of the identity of the
Owerri urban centre. This modification has become
frequent that it needs to be investigated. Owerri urban
which was known for its colorful architectural
character has gradually been losing the architectural
identity as the urban-scape continually changes. No
concerted effort has been made or researches
conducted to find out these user preferences that have
resulted in this post-occupancy modification. The
modification is an attempt by the building consumers
to presumably personalize the houses to meet their
unattended needs and aspirations during
programming, design and construction. There is a
challenge therefore to carry out a study on post-
occupancy evaluation of modification of public
residential building in the study area, directed on the
occupants in order to obtain feed-back information
that is needed for future policy formulation, program
and design development of public residential
buildings in the zone. The problem this research is to
tackle is therefore this lack of adequate feed-back
information from public housing consumers on the
performance of buildings in-use that necessitates the
frequent modification of residential building.
According to the World Health Organization, health
is not merely the absence of disease and infirmity but
a state of optimal physical, mental and social well-
being. Building characteristics may affect health and
well-being of the consumers in a positive or negative
way by such things as light, noise, indoor air quality,
colors and materials. The well-known studies of
Ulrich (1984, 1991, and 2000 quoted in Nwankwo,
2013) show that views from a window may influence
recovery of patients. Later studies have been carried
out into the positive effects of nice environments,
leading to the so-called “healing environment”
(Malkin, 1992; Haskin and Haggard 2001 quoted in
Nwankwo, 2013). A stream of studies has considered
the negative effects of poorly designed residential
buildings and environments and the „Sick building
syndrome‟ (SBS) (Hedge, 1986; Burge, 1987;
Molhave, 1987; Valjborn, 1989; Norback, 1990;
DeBoo, 1990 quoted in Nwankwo, 2013). In 1982,
the World Health Organization officially reorganized
SBS as a medical condition where people in a
building suffer from symptoms or illness or feel
unwell for no apparent reason. Public buildings in the
study area were not built to address the health
implications of the consumers. Unfortunately, no
attempt has been made by any past researcher to
conduct post-occupancy evaluation on the existing
public housing estates in the study area. Therefore,
the contribution of this study is a welcome
development in the housing sector for optimal
performance.
The outcome of this research is expected to
improve the design of future public residential
buildings and minimize the incidence of modification
and defacing of housing estates in the study area. By
designing new buildings with an understanding of
how similar buildings perform in-use, mistakes will
be avoided and successful design features would be
sustained (Nwankwo, 2013). The result of this
research will establish the design factors that require
adequate consideration at the programming and
design stages. Information and data from the research
will equally be a reference for teaching architects and
future operators in the area of public residential
building development. The continuous feed-back
from post-occupancy evaluation on performance of
buildings in-use can be used to document deficiencies
as part of the justification of new construction or
remodeling projects. The result of this study will also
serve as a platform for empirical studies on public
residential buildings performance in any other Urban
Center in Nigeria. Post-occupancy evaluation aims at
discovering how the completed building performs;
determining possible misfits, mistakes or omission;
and accumulating information for future
programming and design (Duffy, 2008). According to
Watson (2003) post-occupancy evaluation is a
systematic evaluation of opinions about buildings in
use, from the perspective of users. Post-occupancy
evaluation by the actual users of buildings is
therefore important in order to discover the root
course of post-occupancy modification of these
buildings and for improving future design quality.
Aim and Objectives
The aim of the study is to come up with
parameters for post-occupancy evaluation using
consumer feed-back information that will improve
the performance of public housing delivery in the
Page 3
Nwankwo S. I et al Int. Journal of Engineering Research and Applications www.ijera.com
ISSN : 2248-9622, Vol. 4, Issue 2( Version 4), February 2014, pp.05-26
www.ijera.com 7 | P a g e
study area. The objectives are: to establish the nature
and extent of post-occupancy modification carried
out in the residential buildings; to determine the
reasons for the modification and establish consumer
group-factors that are necessarily required to be
considered in the programming and design of mass
residential buildings for optimal performance; and to
develop an assessment model for conducting post-
occupancy modification.
Study Area
Owerri is in South-Eastern Nigeria which is
located between latitude 04o
151 and 07
oN and
longitude 05o 50
1 and 09
o 30
1E. Its lowland rain
forest lies between the rain forest savanna acetone
and the salt and fresh water swamp forest along the
coast (Igbozurike, 1975 quoted in Nwankwo, 2013).
South-East is bounded on the north by Kogi and
Benue States of North-Central geo-political zone and
on the east, west and south by Cross River, Akwa
Ibom, Rivers, Bayelsa, Delta and Edo States of
South-South geo-political zone. The Tropical
rainforest climate is found in the South-Eastern part
of Nigeria. This climate is influenced by the
monsoons originating by the South Atlantic Ocean,
which is brought into the area by the maritime
tropical air mass, a warm moist sea to land seasonal
wind. Its warmth and high humidity gives it a strong
tendency to ascend and produce copious rainfall,
which is a result of the condensation of water vapor
in the rapidly rising air.
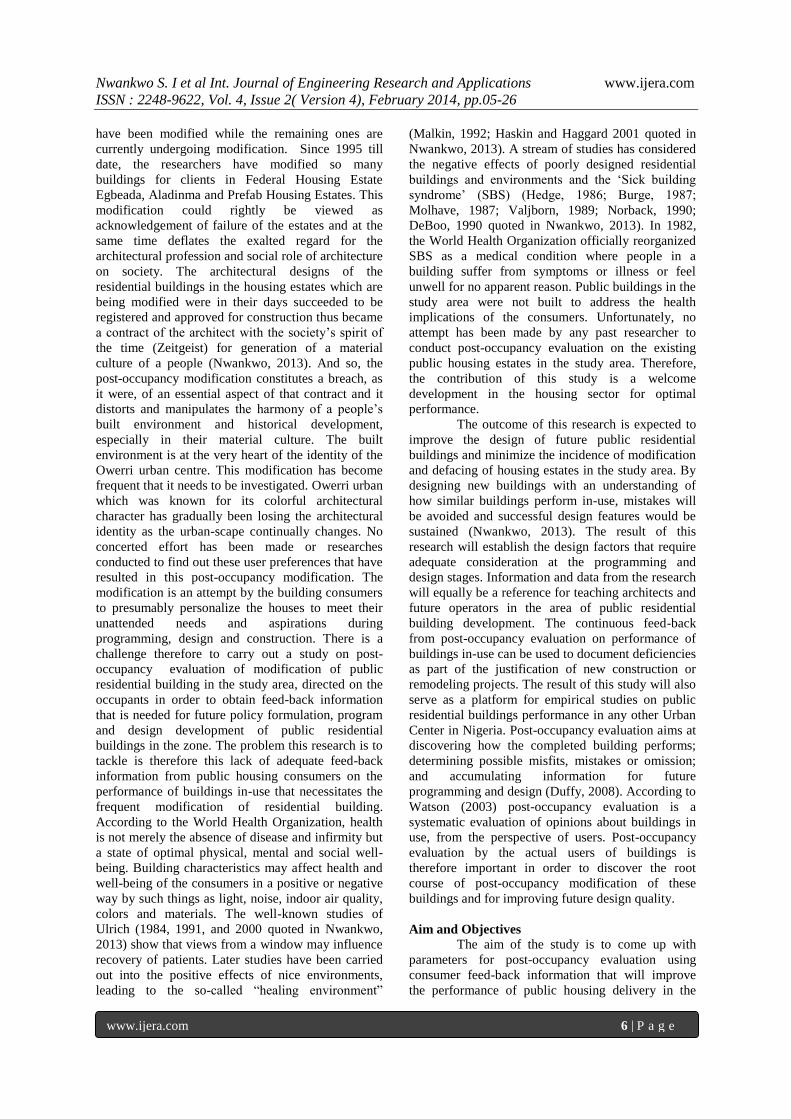
The Tropical rainforest climate has a very
small temperature range. The temperature ranges in
Owerri, South-East Nigeria are almost constant
throughout the year. According to Nwankwo, (2010)
Owerri records a mean maximum temperature of
28oC for its hottest month‟s ranging from February to
march before the rain storms in June to October while
its lowest mean temperature is 26oC in its coldest
months ranging from July to September (Fig.1&
Fig.2). In the study area, there is a need to reduce
environmental heat in or on buildings to increase
human comfort. The following measures are taken to
address the issues of tropical heat intensity in the
study area: at critical places thermal insulators are
introduced to reduce heat transmission; natural cross
ventilation is achieved through wide openings to
create steady normal air flow and to ensure that
temperature values remain at considerable limit;
tree planting is used to achieve both shading and
cooling effects; and since thermal expansion is likely
to occur in long buildings, expansion joints are
employed.
Fig. 1: Line charts showing mean daily Maximum & Minimum temperatures in Owerri (2004-2005).
January
Febuary
March April May June July AugustSeptember
October
November
December
Average Minimum Temperature (C) 26.3 26.4 26.6 26.6 26.2 26.2 25.3 25.7 25.6 26.5 26.3 26.2
Average Maximum Temperature (C) 28.4 29.2 29.1 28.3 28.4 27.4 28.1 28.4 28.3 28.4 28.4 28.2
26.3 26.4 26.6 26.626.2 26.2
25.325.7 25.6
26.5 26.3 26.2
28.4
29.2 29.1
28.3 28.4
27.4
28.128.4 28.3 28.4 28.4 28.2
23
24
25
26
27
28
29
30
Ave
rage
te
mp
era
ture
ran
ges
Page 4
Nwankwo S. I et al Int. Journal of Engineering Research and Applications www.ijera.com
ISSN : 2248-9622, Vol. 4, Issue 2( Version 4), February 2014, pp.05-26
www.ijera.com 8 | P a g e
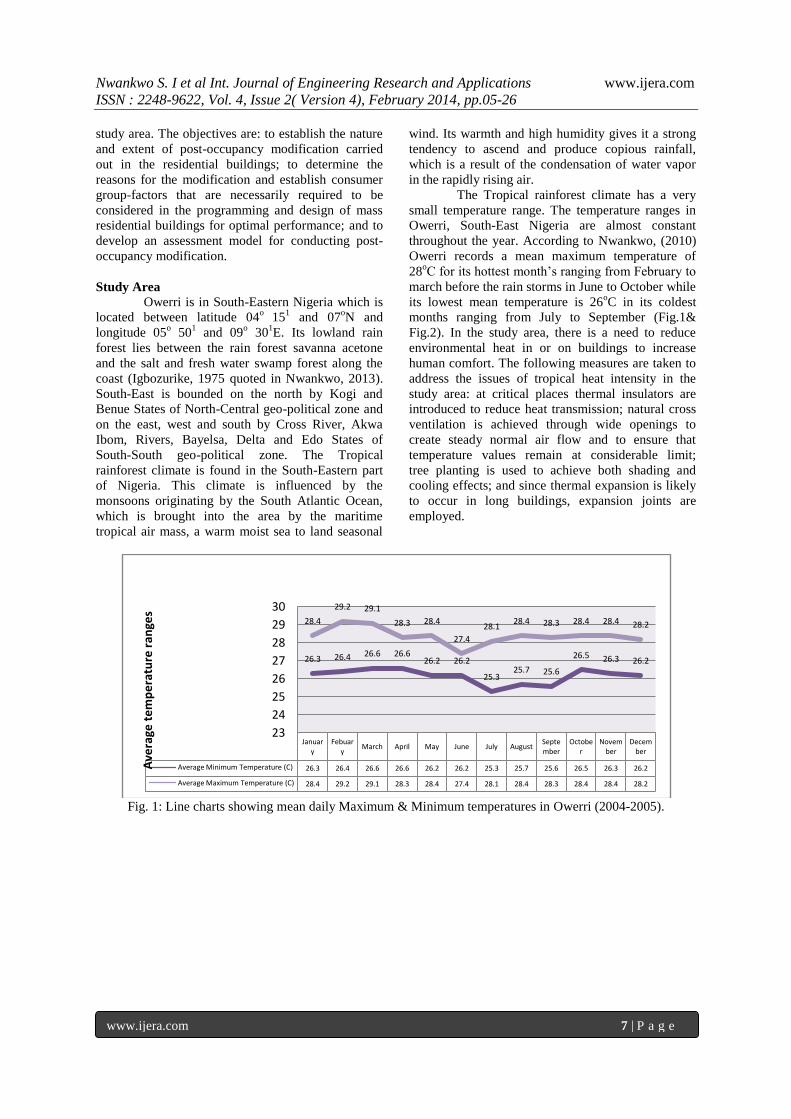
Fig. 2: Line charts showing mean daily Maximum & Minimum temperatures in Owerri (2006-2008).
The annual rainfall received in the study
area is very high, usually above the 2000mm rainfall
totals giving for tropical rainforest climates
worldwide. The area receives between 2000mm to
3000mm of rain per year. The study area experiences
double rainfall maxima characterized by two rainfalls
speaks with a short dry season and a longer dry
season falling before and after each peak. According
to Nwankwo, (2013),the first rainy season begins
around March and lasts to the end of July with a peak
in June, this rainy season is followed by a short dry
break in August known as August break which is a
short dry season lasting for two or three weeks in
August. This break is broken by Short rainy season
starting around early September and lasting to Mid
October with a peak period at the end of September.
The ending of the short rainy season in October is
followed by Long Dry Season. This period starts
from late October and lasts till early March with peak
dry conditions between early December and late
February. When buildings are not well protected,
dampness can occur. Dampness in building is a
possible result of several factors which include:
penetration of rain water through the walls and roof;
penetration of rain water window cracks;
condensation on internal surfaces of water vapors
generated in the building; and penetration of water at
ground level through the floor and up the walls. The
following design solutions are employed to address
the problem of dampness: buildings are designed to
have enough roof overhangs to protect the building
walls from diving rain; and the roof pitch of the
buildings is designed to be high enough to ensure
rapid rain water run-off.
January
Febuary
March April May June July AugustSeptember
October
November
December
Average Minimum Temperature (C) 26.5 26.3 26.5 26.5 26.4 26.7 25.3 25.6 25.4 26.8 26.5 26.5
Average Maximum Temperature (C) 28.4 29.4 29.6 28.4 28 28.1 28.4 27.6 27.8 28.1 28.4 28.5
26.526.3
26.5 26.5 26.426.7
25.325.6
25.4
26.826.5 26.5
28.4
29.429.6
28.428 28.1
28.4
27.627.8
28.128.4 28.5
23
24
25
26
27
28
29
30A
vera
ge T
em
pe
ratu
res
Page 5
Nwankwo S. I et al Int. Journal of Engineering Research and Applications www.ijera.com
ISSN : 2248-9622, Vol. 4, Issue 2( Version 4), February 2014, pp.05-26
www.ijera.com 9 | P a g e
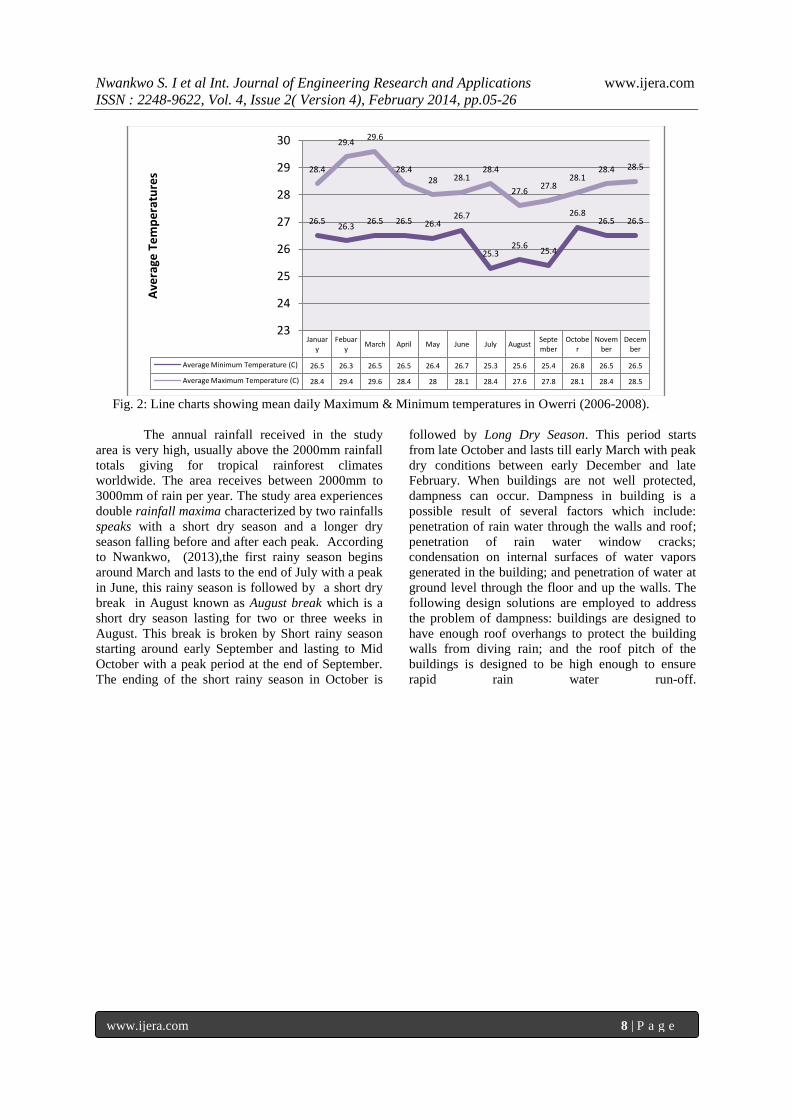
Fig. 3: Bar chart showing record of rainfall and radiation intensity in Owerri (2004-2009)
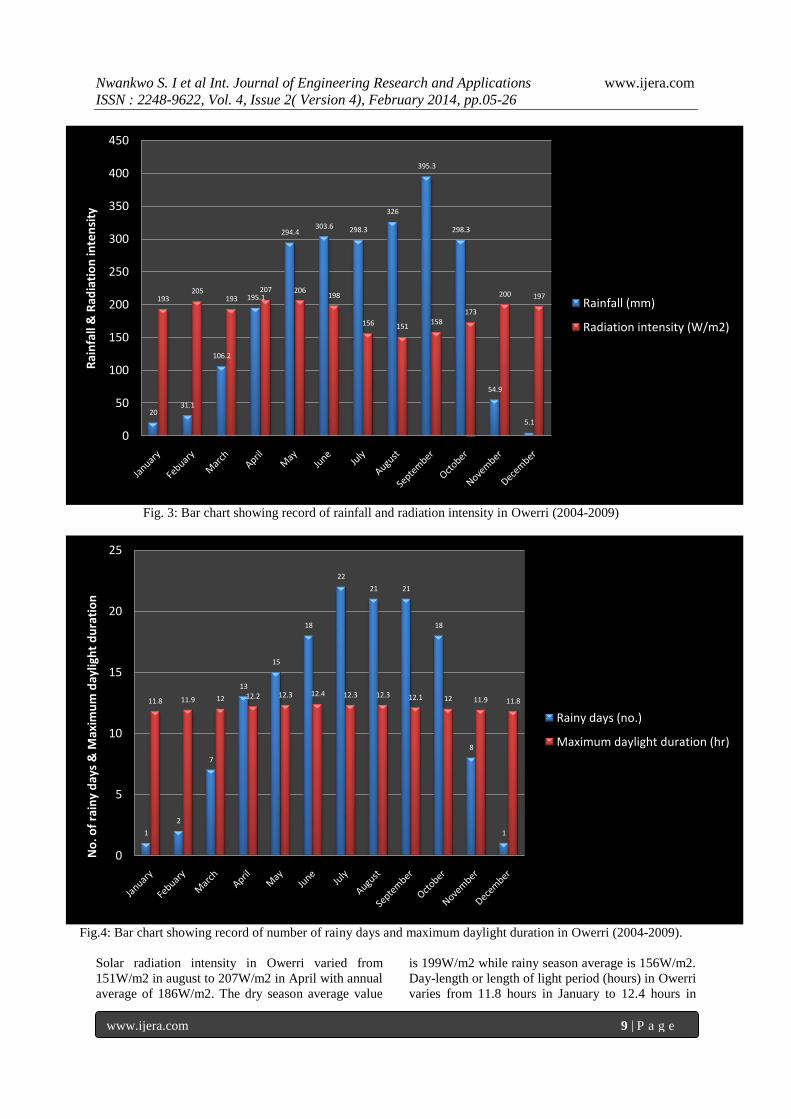
Fig.4: Bar chart showing record of number of rainy days and maximum daylight duration in Owerri (2004-2009).
Solar radiation intensity in Owerri varied from
151W/m2 in august to 207W/m2 in April with annual
average of 186W/m2. The dry season average value
is 199W/m2 while rainy season average is 156W/m2.
Day-length or length of light period (hours) in Owerri
varies from 11.8 hours in January to 12.4 hours in
2031.1
106.2
195.1
294.4303.6 298.3
326
395.3
298.3
54.9
5.1
193205
193207 206
198
156 151158
173
200 197
0
50
100
150
200
250
300
350
400
450
Rai
nfa
ll &
Rad
iati
on
inte
nsi
ty
Rainfall (mm)
Radiation intensity (W/m2)
1
2
7
13
15
18
22
21 21
18
8
1
11.8 11.9 12 12.2 12.3 12.4 12.3 12.3 12.1 12 11.9 11.8
0
5
10
15
20
25
No
. of
rain
y d
ays
& M
axim
um
day
ligh
t d
ura
tio
n
Rainy days (no.)
Maximum daylight duration (hr)
Page 6
Nwankwo S. I et al Int. Journal of Engineering Research and Applications www.ijera.com
ISSN : 2248-9622, Vol. 4, Issue 2( Version 4), February 2014, pp.05-26
www.ijera.com 10 | P a g e
June with an annual average of 12.08 hours. The
average day lengths during the rainy season and dry
season are 12.2 hours and 11.9 hours respectively.
The region has a prevalence of short-day condition
with a difference of only 36 minutes between the
longest and shortest day in the year. Actual mean
daily sunshine vary from 2.4 hours in August to 5.8
hours in December with an annual mean value of 4.6
hours. The mean daily value for sunshine duration is
27 percent greater in the dry season than in rainy
season.
Knowing exactly how the sun will strike a
building means that it is possible to precisely
calculate the length of the overhang of a sun shade,
depth of a fin, the angle of a solar collector, the
placement of a courtyard, the length of the shadows
cast by nearby buildings, or even the way sunset will
be affected by distant hills or other objects that rise
above the local horizon.
Relative humidity is the actual water vapor
pressure to the saturated vapor pressure expressed in
percentage. This could be termed the ratio of amount
of water vapor actually present in the air to the
amount the air could hold. In the study area, the
following deductions were made: Vapor pressure
increases with increase in relative humidity and
Vapor pressure and relative humidity rise sharply
between January and April; and vapor pressure and
relative humidity are fairly constant between July and
September and Low relative humidity results in low
pressure. Design solutions usually employed in the
study area to counter problems associated with
relative humidity include provision of proper
ventilation in the buildings to enhance air flow. This
will help to maintain the comfort zone in heavy
humid periods.
Soil inventory of the high rainfall region of
Owerri, Southeastern Nigeria shows that the
major soil unit consists of deep, course textured,
well-drained acidic loam, largely derived from
coastal plain sand sediments, sandstones, and shale.
The study area has a mixture of flat, undulating and
rugged topography. The study area supports a
mixture of savanna and a luxuriant type of dense
vegetation – the tropical rain forest because of the
very heavy rainfall and uniformly high temperature.
The vegetation is set on flat plains, hills and valleys.
The vegetation comprises a multitude of evergreen
trees that yield tropical hardwood, e.g. mahogany,
ebony, greenheart, cabinet woods, palm trees, and
dyewood. These trees supply most of the wooden
building materials required in the area.
II. LITERATURE REVIEW The term post-occupancy evaluation
describes studies that focus on completed building
projects. Preiser and Schramn, (1998) attempted to
widen the scope in the direction of building
performance evaluation, to integrate user and
aesthetic factors with technical and economic factors.
Watt, (2007) uses the term „Building pathology‟ to
describe that aspect of building appraisal that is
concerned principally with defects and associated
remedial action. Although Duffy, (2008) suggests the
existence of a terminological dilemma, all of these
concepts aim at discovering how the completed
building performs; determining possible misfits,
mistakes or omissions; and accumulating information
for future programming and design efforts. Preiser
and Vischer (2004), however, consider post-
occupancy evaluation to be the most commonly used
term for the activity of evaluating buildings in- use.
Post-occupancy evaluation is about
procedures for determining whether or not design
decisions made by the architect are delivering the
performance needed by those who use the building.
By using occupants as a benchmark in evaluation,
post-occupancy evaluation provides enormous
potential for improving the performance of a
building. Post-occupancy evaluation evolved to fill
the gap in the conventional building process, which
consists of planning, programming, design,
construction and occupancy of a building. It
represents the vital diagnostic step needed to feed the
prescriptive tools of planning and programming
(voordt and Wegen, 2005).
Post-occupancy evaluation is a systematic
manner of evaluating buildings after they have been
built and occupied for duration of time (Preiser,
1995, 2002). The gap between the actual performance
of buildings and explicitly stated performance criteria
constitute the evaluation (Preiser et al, 1988). One of
the applications of the post-occupancy evaluation is
the comparison between the use that the designer
intended for an environment and that to which its
users put it. Watson (2003) defined post-occupancy
evaluation as a systematic evaluation of opinions
about buildings in use, from the perspective of users.
It is important to elicit the perceptions of the
residents and correlate these with the performance
level of housing as determined by post-occupancy
evaluation.
The merits of post-occupancy evaluation are
diverse. First, it ensures the sustenance of building
performance, particularly of public residential
buildings and facilities. Vischer (2002) suggests that
post-occupancy evaluation is used in determining
building defects, formulating design and construction
criteria, supporting performance measures for asset
and facility management, lowering facility life cycle
costs by identifying design errors that could lead to
increased maintenance and operating costs, and
clarifying design objectives. Second, post-occupancy
evaluation provides a mechanism for understanding
Page 7
Nwankwo S. I et al Int. Journal of Engineering Research and Applications www.ijera.com
ISSN : 2248-9622, Vol. 4, Issue 2( Version 4), February 2014, pp.05-26
www.ijera.com 11 | P a g e
the mutual interaction between buildings and users‟
aspirations and for proposing ways of improving the
environment necessary to accommodate these
aspirations. In addition, post–occupancy evaluation
serves as multifaceted tool to account for building
quality through the identification of successful design
features, redundant or unnecessary building features,
problems to mitigate, and defects to rectify (Watson,
2003). Several other authors including Bordas and
Leaman, (2000); Vischer, (2002); add that post-
occupancy evaluation helps to empower users to
negotiate building issues and reduce maintenance
works and cost.
In history, building performance was
evaluation in an informal manner, and the lessons
learned were applied in subsequent building cycles of
similar building types (Preiser, 2002). Although
informal, subjective evaluations of the environment
have been conducted throughout history, systematic
evaluations, employing explicitly stated performance
criteria with which performance measures of
buildings are compared, is of more recent origin.
Post-occupancy evaluation evolved from the
architectural programming techniques of the late
1950s and early 1960s. Early significant evaluative
efforts were in response to severe problems faced in
institutions such as mental hospitals and prisons,
some of which were attributable to the built
environment. The 1960s saw the growth of research
that focused on the relationship between human
behavior and building design, leading to the creation
of the new field of environmental design research and
the formation of interdisciplinary professional
associations, such as the Environmental Design
Research Association in 1968.The 1970s witnessed
significant increase in the scope, number, complexity
and magnitude of evaluation studies and publications,
with developments such as: the use of multiple
buildings for data collection and comparative
analysis; the use of multi-method approaches to
building evaluation; the investigation of a
comprehensive set of environmental factors, not as
isolated variables, but to access their relative
importance to the users of the facilities; and the
addition of technical and functional factors to the
scope of evaluation studies, compared with the earlier
emphasis on strictly behavioral research. The final
decades of the century was the era of applied
evaluation in which Post–Occupancy Evaluations
become routinely used (Preiser, 2002)
From the early 1970s, the tools of Post-
Occupancy Evaluation became more relevant to
public housing in the developed countries of the
world. Some evaluation projects relating to housing
for the elderly and public housing were conducted.
The work done by Newman (1973 quoted in
Nwankwo, 2013) which examined data from 100
housing projects, and linked the incidence of crime to
housing form and disposition, site design and
circulation stands out in terms of scope and influence.
Though provocative, Newman‟s work was well
published and effectively influential on housing
policy on the national level, stimulating the
renovation of existing public housing projects.
Researchers at the University of Illinois also
conducted an important evaluation study that
significantly influenced policy of the United States
Department of Housing and Urban Development
(Francescato et al, 1979 quoted in Nwankwo, 2013).
This effort included project management as part of
the study and demonstrated its importance to the
residents‟ satisfaction. It tested the nature and relative
importance of various factors that contribute to
residents‟ satisfaction.
Evaluation research in architecture and
housing fall into three environmental dimensions: the
physical, the social and the socio- physical
environments. In all cases, the assumption is that
residents judge the adequacy or habitability of their
environments based on predefined standards of
quality. Some studies evaluate cognitive responses to
the physical environment, focusing on issues such as
the perceived quality of buildings and environmental
quality (Kane et al, 2000; Fornara et al, 2006; Cold,
1993 quoted in Nwankwo, 2013). They concluded by
viewing the experience of „quality‟ not as a static,
objective, rational concept, but as originating in the
interaction between the individual and the object,
building or place. Voordt and Wegen (2005)
described quality as the extent to which a product
fulfils the requirements set for it; and architectonic
quality as an umbrella term covering various aspects
of quality such as aesthetic, functional (building
efficiency) symbolic and cultural value. Other studies
attend to the evaluation of the quality of the built
environment in terms of effective responses, using
user assessment of the environments (AL-Momani,
2003). Satisfaction, attitudes and preferences are
three types of criterion normally used. Though these
affective responses are not mutually exclusive,
satisfaction as an affective criterion has been more
widely investigated (Lawrence, 1987; Varady, 2004
quoted in Nwankwo, 2013).
Three levels of effort in typical Post-
Occupancy Evaluation work have been identified
namely: (1) indicative (2) investigative and (3)
diagnostic (Preiser and Vischer, 2004). „Effort‟ refers
to the amount of time, resources and personnel, the
depth and breadth of investigation, and the implicit
cost involved in conducting a Post–Occupancy
Evaluation. Indicative Post-Occupancy Evaluations
give an indication of major strengths and weaknesses
of a particular building‟s performance. Investigative
Post–Occupancy Evaluations go into more depth
Page 8
Nwankwo S. I et al Int. Journal of Engineering Research and Applications www.ijera.com
ISSN : 2248-9622, Vol. 4, Issue 2( Version 4), February 2014, pp.05-26
www.ijera.com 12 | P a g e
whereby objective evaluation criteria are explicitly
stated. Diagnostic Post–Occupancy Evaluations
require considerable effort and expense and utilize
sophisticated measurement techniques. This review
of literature confirms the relevance of Post-
Occupancy Evaluation in public housing evaluation.
However, despite the preponderance of research in
the context of building performance, Post-Occupancy
Evaluation as a systematic method of collecting data
on buildings in use has not found wide usage for
public housing in Owerri, South-Eastern Nigeria
hence the need for this study.
III. METHODOLOGY Six research approaches have been
employed to obtain the data used in this research and
they have been derived from the text „Architectural
Research Methods‟ (Groat & Wang, 2002, Voordt &
Wegen, 2005). These approaches were: comparative
mapping through systematic sampling process;
Physical Trace Documentation which enabled the
researcher to understand the nature and extent of
post-occupancy modification in the study area;
Environmental Observation was a technique used to
investigate the relationship between human activities
and physical settings in the housing estates;
Questionnaires and interviews were used to explore
the impulse of consumers and their expectations
about their buildings; „Archival Retrieval approach
which helped retrieve documents such as original site
plans, plot designs and building construction
techniques from the authorities concerned. The final
step employed was the evaluation which was based
on a theoretical frame work of tripartite quality of
architecture; Utilitas(functionality or utility value: the
social dimension), Firmitas(strength and rigidity: the
technological dimension) and Venustas(beauty: the
aesthetic dimension). Thirteen performance criteria
developed and used in this post-occupancy evaluation
were as follows: Functional efficiency; Functional
flexibility, Functional accessibility, Functional
Spatial orientation, Functional physical well-being,
Aesthetic visual quality, Aesthetic representational
quality, Aesthetic symbolic quality, Visual and
cultural history, Order and complexity,
Constructional safety, Environmental friendliness,
and Sustainability. Fifty two questions were
developed and used in this evaluation based on the
thirteen performance criteria: Twenty five for
Functionality Factor; Nineteen for Aesthetic Factor;
and Eight for Constructional Issues. These came in
form of structured questionnaires administered to
sample population of 405 building owners from the
population of study of 1261. In this research,
probability sample technique was adopted which
according to De Vaus cited by Uji (2009), is one in
which each person/ object in the population has an
equal, or, at least, a known, chance (probability) of
being selected. The researcher deemed it fit that the
most commonly acceptable way of providing an
equal probability of selection of samples from
populations is to use principle of systematic
sampling. In this systematic sampling, the researcher
worked out a sampling fraction by dividing the
required sample size by the size of the population
(𝑛/𝑁), then selecting one case out of every (𝑛/𝑁)
case in the population. This would enable the
collection of information from a representative group
good enough to permit conclusion to be drawn about
the large study group. Through this method, a
template of one out of every three buildings was
developed for the sample population. The most
common ways in which data collected in this
research were organized, summarized and presented
included the use of illustrations such as Tables and
Graphs. After sorting out, organizing and
summarizing the data in a presentable manner, the
returned questionnaire was collated and analyzed
using SPSS software and Microsoft Excel to generate
the graphs used for presentation.
IV. RESULTS AND DISCUSSION Nature and Extent of Post-Occupancy
Modification
Eight major indices of modification were
identified (Table 1).
Table 1: Eight Major Indices of Modification Identified
S/No Index
Description/Index of Modification
Index 1 Addition of fence
Index 2 Paving around the perimeter of the house
Index 3 Extended eaves/addition of porch
Index 4 Addition of security house, shop, plant house and boys quarters
Index 5 Change affecting materials and finishes
Index 6 Alteration of form/ change of roof composition
Index 7 Increase in size of spaces e.g. living room, bedrooms and kitchen
Index 8 Increase in number of bedrooms
Page 9
Nwankwo S. I et al Int. Journal of Engineering Research and Applications www.ijera.com
ISSN : 2248-9622, Vol. 4, Issue 2( Version 4), February 2014, pp.05-26
www.ijera.com 13 | P a g e
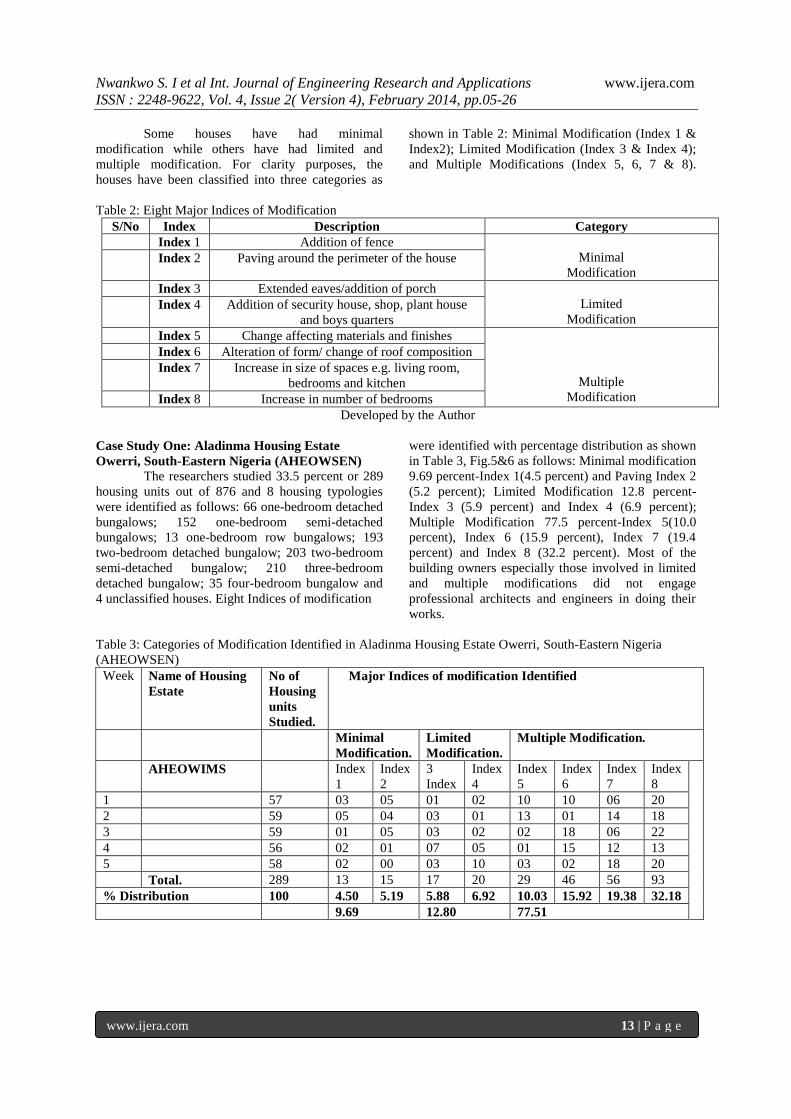
Some houses have had minimal
modification while others have had limited and
multiple modification. For clarity purposes, the
houses have been classified into three categories as
shown in Table 2: Minimal Modification (Index 1 &
Index2); Limited Modification (Index 3 & Index 4);
and Multiple Modifications (Index 5, 6, 7 & 8).
Table 2: Eight Major Indices of Modification
S/No Index Description Category
Index 1 Addition of fence
Minimal
Modification Index 2 Paving around the perimeter of the house
Index 3 Extended eaves/addition of porch
Limited
Modification Index 4 Addition of security house, shop, plant house
and boys quarters
Index 5 Change affecting materials and finishes
Multiple
Modification
Index 6 Alteration of form/ change of roof composition
Index 7 Increase in size of spaces e.g. living room,
bedrooms and kitchen
Index 8 Increase in number of bedrooms
Developed by the Author
Case Study One: Aladinma Housing Estate
Owerri, South-Eastern Nigeria (AHEOWSEN)
The researchers studied 33.5 percent or 289
housing units out of 876 and 8 housing typologies
were identified as follows: 66 one-bedroom detached
bungalows; 152 one-bedroom semi-detached
bungalows; 13 one-bedroom row bungalows; 193
two-bedroom detached bungalow; 203 two-bedroom
semi-detached bungalow; 210 three-bedroom
detached bungalow; 35 four-bedroom bungalow and
4 unclassified houses. Eight Indices of modification
were identified with percentage distribution as shown
in Table 3, Fig.5&6 as follows: Minimal modification
9.69 percent-Index 1(4.5 percent) and Paving Index 2
(5.2 percent); Limited Modification 12.8 percent-
Index 3 (5.9 percent) and Index 4 (6.9 percent);
Multiple Modification 77.5 percent-Index 5(10.0
percent), Index 6 (15.9 percent), Index 7 (19.4
percent) and Index 8 (32.2 percent). Most of the
building owners especially those involved in limited
and multiple modifications did not engage
professional architects and engineers in doing their
works.
Table 3: Categories of Modification Identified in Aladinma Housing Estate Owerri, South-Eastern Nigeria
(AHEOWSEN)
Week Name of Housing
Estate
No of
Housing
units
Studied.
Major Indices of modification Identified
Minimal
Modification.
Limited
Modification.
Multiple Modification.
AHEOWIMS Index
1
Index
2
3
Index
Index
4
Index
5
Index
6
Index
7
Index
8
1 57 03 05 01 02 10 10 06 20
2 59 05 04 03 01 13 01 14 18
3 59 01 05 03 02 02 18 06 22
4 56 02 01 07 05 01 15 12 13
5 58 02 00 03 10 03 02 18 20
Total. 289 13 15 17 20 29 46 56 93
% Distribution 100 4.50 5.19 5.88 6.92 10.03 15.92 19.38 32.18
9.69 12.80 77.51
Page 10
Nwankwo S. I et al Int. Journal of Engineering Research and Applications www.ijera.com
ISSN : 2248-9622, Vol. 4, Issue 2( Version 4), February 2014, pp.05-26
www.ijera.com 14 | P a g e
Fig. 5: Bar Charts Showing Distribution of Modification Indices in Aladinma Housing Estate Owerri
South-Eastern Nigeria (AHEOWSEN)
Fig. 6:3D Pie Charts Showing Percentage Distribution of Eight Major Indices of Modification in Aladinma
Housing Estate. Owerri , South-Eastern Nigeria (AHEOWSEN)
Fig. 7:3D Pie Charts Showing Percentage Distribution of Categories of Modification in Aladinma Housing
Estate Owerri, South-Eastern Nigeria (AHEOWSEN)
INDEX-1 INDEX-2 INDEX-3 INDEX-4 INDEX-5 INDEX-6 INDEX-7 INDEX-8
Minimal Modification 13 15
Limited Modification 17 20
Multiple Modification 29 46 56 93
13 15 1720
29
46
56
93
0
10
20
30
40
50
60
70
80
90
100
no
. of
un
its
Minimal Modification Limited Modification Multiple Modification
INDEX 1Addition of fence
4.5%
INDEX 2Paving around the
perimeter of the house5.19%
INDEX 3Extended eaves/addition
of porch5.88%
INDEX 4Addition of security
house, shop, plant house & boys quarters
6.92%
INDEX 5Change affecting materials
& finishes 10%
INDEX 6Alteration of form/change
of roof composition15.9%
INDEX 7Increase in size of spaces e.g. living room, bedroom
& kitchen19.38%
INDEX 8Increase in number of
bedrooms32.18%
MINIMAL MODIFICATION9.69% LIMITED MODIFICATION
12.8%MULTIPLE
MODIFICATION77.51%
MINIMAL MODIFICATION LIMITED MODIFICATION MULTIPLE MODIFICATION
Page 11
Nwankwo S. I et al Int. Journal of Engineering Research and Applications www.ijera.com
ISSN : 2248-9622, Vol. 4, Issue 2( Version 4), February 2014, pp.05-26
www.ijera.com 15 | P a g e
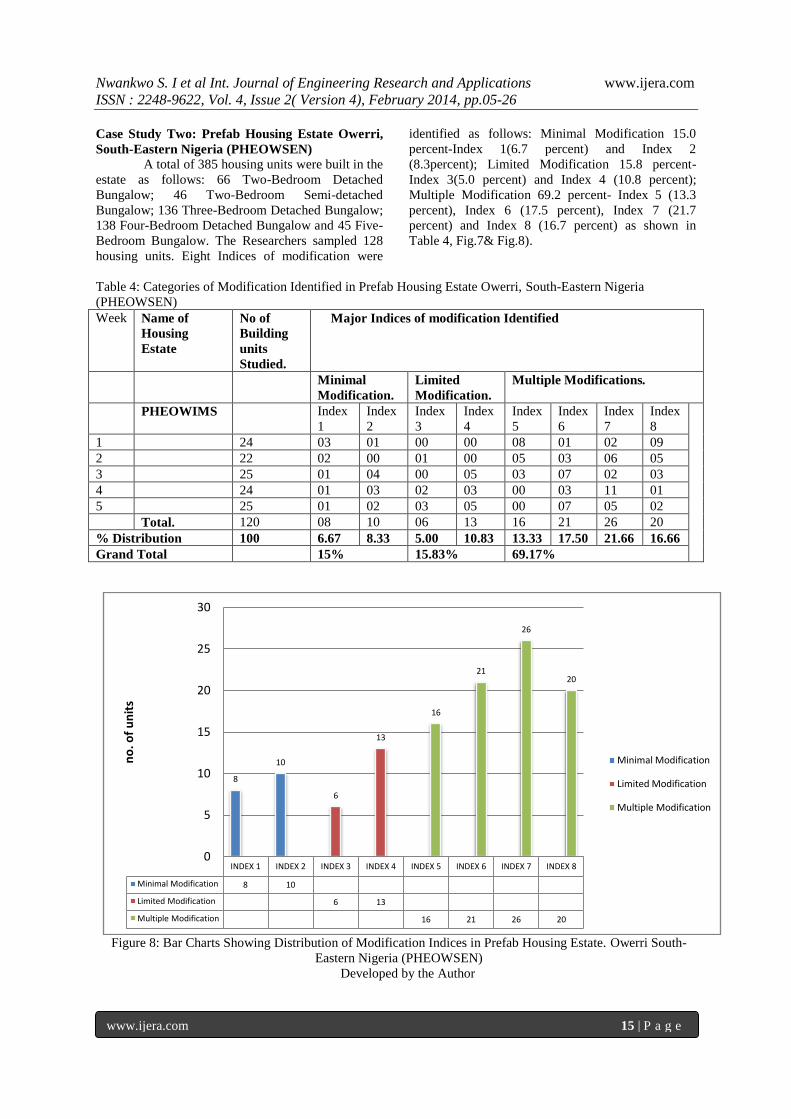
Case Study Two: Prefab Housing Estate Owerri,
South-Eastern Nigeria (PHEOWSEN)
A total of 385 housing units were built in the
estate as follows: 66 Two-Bedroom Detached
Bungalow; 46 Two-Bedroom Semi-detached
Bungalow; 136 Three-Bedroom Detached Bungalow;
138 Four-Bedroom Detached Bungalow and 45 Five-
Bedroom Bungalow. The Researchers sampled 128
housing units. Eight Indices of modification were
identified as follows: Minimal Modification 15.0
percent-Index 1(6.7 percent) and Index 2
(8.3percent); Limited Modification 15.8 percent-
Index 3(5.0 percent) and Index 4 (10.8 percent);
Multiple Modification 69.2 percent- Index 5 (13.3
percent), Index 6 (17.5 percent), Index 7 (21.7
percent) and Index 8 (16.7 percent) as shown in
Table 4, Fig.7& Fig.8).
Table 4: Categories of Modification Identified in Prefab Housing Estate Owerri, South-Eastern Nigeria
(PHEOWSEN)
Week Name of
Housing
Estate
No of
Building
units
Studied.
Major Indices of modification Identified
Minimal
Modification.
Limited
Modification.
Multiple Modifications.
PHEOWIMS Index
1
Index
2
Index
3
Index
4
Index
5
Index
6
Index
7
Index
8
1 24 03 01 00 00 08 01 02 09
2 22 02 00 01 00 05 03 06 05
3 25 01 04 00 05 03 07 02 03
4 24 01 03 02 03 00 03 11 01
5 25 01 02 03 05 00 07 05 02
Total. 120 08 10 06 13 16 21 26 20
% Distribution 100 6.67 8.33 5.00 10.83 13.33 17.50 21.66 16.66
Grand Total 15% 15.83% 69.17%
Figure 8: Bar Charts Showing Distribution of Modification Indices in Prefab Housing Estate. Owerri South-
Eastern Nigeria (PHEOWSEN)
Developed by the Author
INDEX 1 INDEX 2 INDEX 3 INDEX 4 INDEX 5 INDEX 6 INDEX 7 INDEX 8
Minimal Modification 8 10
Limited Modification 6 13
Multiple Modification 16 21 26 20
8
10
6
13
16
21
26
20
0
5
10
15
20
25
30
no
. of
un
its
Minimal Modification
Limited Modification
Multiple Modification
Page 12
Nwankwo S. I et al Int. Journal of Engineering Research and Applications www.ijera.com
ISSN : 2248-9622, Vol. 4, Issue 2( Version 4), February 2014, pp.05-26
www.ijera.com 16 | P a g e
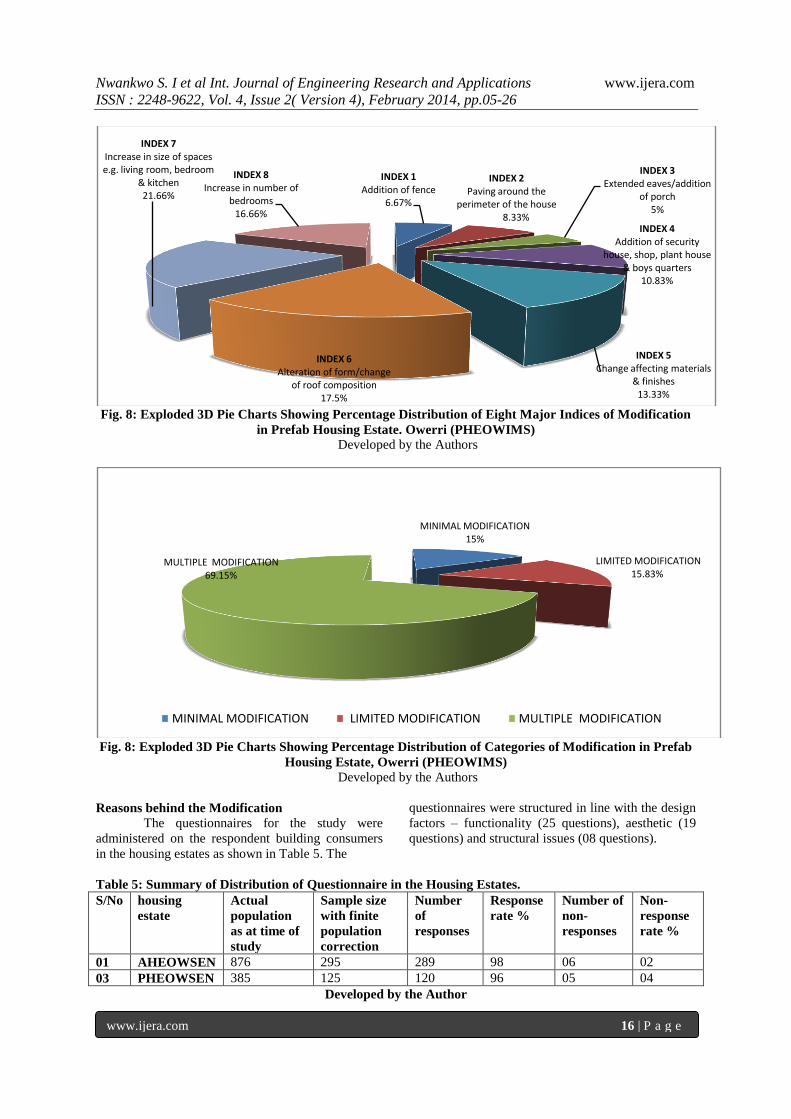
Fig. 8: Exploded 3D Pie Charts Showing Percentage Distribution of Eight Major Indices of Modification
in Prefab Housing Estate. Owerri (PHEOWIMS)
Developed by the Authors
Fig. 8: Exploded 3D Pie Charts Showing Percentage Distribution of Categories of Modification in Prefab
Housing Estate, Owerri (PHEOWIMS)
Developed by the Authors
Reasons behind the Modification
The questionnaires for the study were
administered on the respondent building consumers
in the housing estates as shown in Table 5. The
questionnaires were structured in line with the design
factors – functionality (25 questions), aesthetic (19
questions) and structural issues (08 questions).
Table 5: Summary of Distribution of Questionnaire in the Housing Estates.
S/No housing
estate
Actual
population
as at time of
study
Sample size
with finite
population
correction
Number
of
responses
Response
rate %
Number of
non-
responses
Non-
response
rate %
01 AHEOWSEN 876 295 289 98 06 02
03 PHEOWSEN 385 125 120 96 05 04
Developed by the Author
INDEX 1Addition of fence
6.67%
INDEX 2Paving around the
perimeter of the house8.33%
INDEX 3Extended eaves/addition
of porch5%
INDEX 4Addition of security
house, shop, plant house & boys quarters
10.83%
INDEX 5Change affecting materials
& finishes 13.33%
INDEX 6Alteration of form/change
of roof composition17.5%
INDEX 7Increase in size of spaces e.g. living room, bedroom
& kitchen21.66%
INDEX 8Increase in number of
bedrooms16.66%
MINIMAL MODIFICATION15%
LIMITED MODIFICATION15.83%
MULTIPLE MODIFICATION69.15%
MINIMAL MODIFICATION LIMITED MODIFICATION MULTIPLE MODIFICATION
Page 13
Nwankwo S. I et al Int. Journal of Engineering Research and Applications www.ijera.com
ISSN : 2248-9622, Vol. 4, Issue 2( Version 4), February 2014, pp.05-26
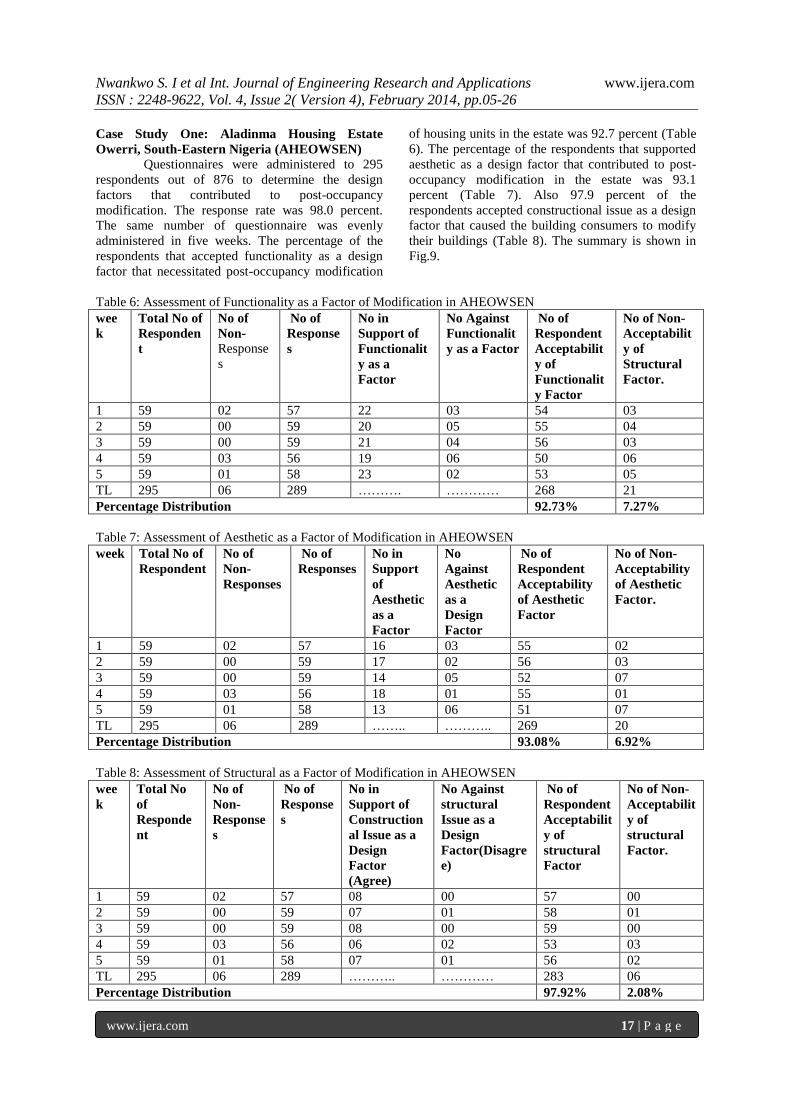
www.ijera.com 17 | P a g e
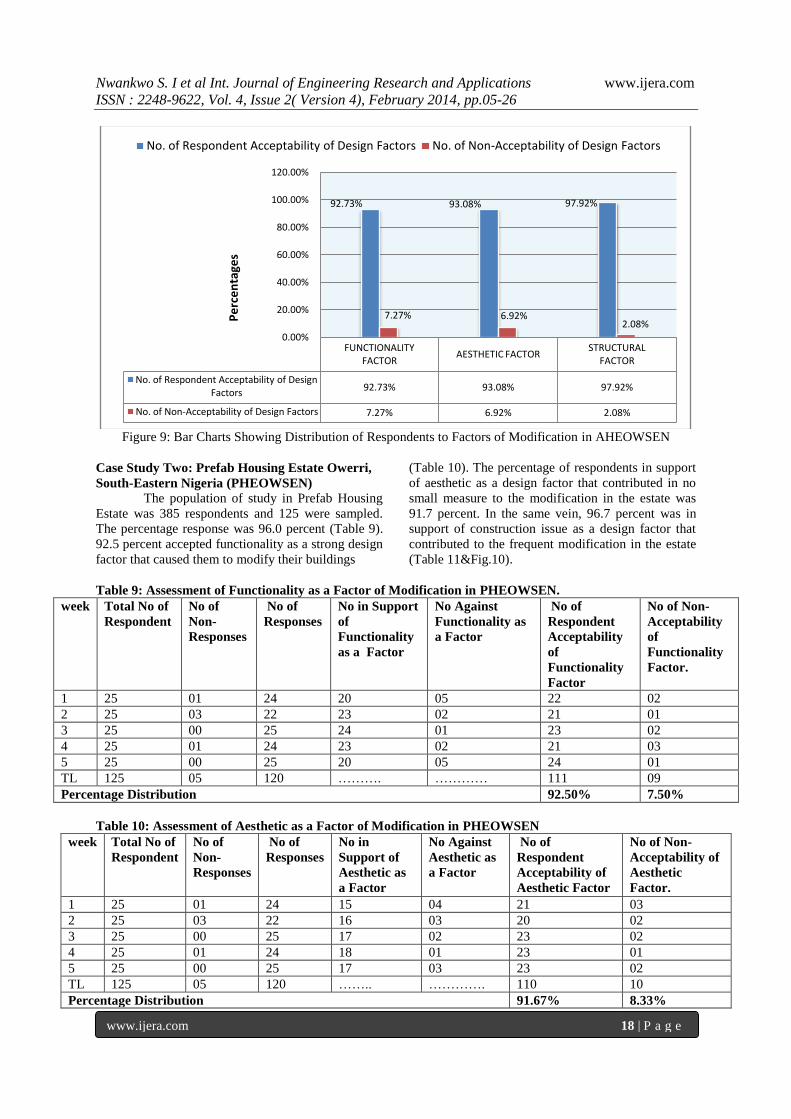
Case Study One: Aladinma Housing Estate
Owerri, South-Eastern Nigeria (AHEOWSEN)
Questionnaires were administered to 295
respondents out of 876 to determine the design
factors that contributed to post-occupancy
modification. The response rate was 98.0 percent.
The same number of questionnaire was evenly
administered in five weeks. The percentage of the
respondents that accepted functionality as a design
factor that necessitated post-occupancy modification
of housing units in the estate was 92.7 percent (Table
6). The percentage of the respondents that supported
aesthetic as a design factor that contributed to post-
occupancy modification in the estate was 93.1
percent (Table 7). Also 97.9 percent of the
respondents accepted constructional issue as a design
factor that caused the building consumers to modify
their buildings (Table 8). The summary is shown in
Fig.9.
Table 6: Assessment of Functionality as a Factor of Modification in AHEOWSEN
wee
k
Total No of
Responden
t
No of
Non-
Response
s
No of
Response
s
No in
Support of
Functionalit
y as a
Factor
No Against
Functionalit
y as a Factor
No of
Respondent
Acceptabilit
y of
Functionalit
y Factor
No of Non-
Acceptabilit
y of
Structural
Factor.
1 59 02 57 22 03 54 03
2 59 00 59 20 05 55 04
3 59 00 59 21 04 56 03
4 59 03 56 19 06 50 06
5 59 01 58 23 02 53 05
TL 295 06 289 ………. ………… 268 21
Percentage Distribution 92.73% 7.27%
Table 7: Assessment of Aesthetic as a Factor of Modification in AHEOWSEN
week Total No of
Respondent
No of
Non-
Responses
No of
Responses
No in
Support
of
Aesthetic
as a
Factor
No
Against
Aesthetic
as a
Design
Factor
No of
Respondent
Acceptability
of Aesthetic
Factor
No of Non-
Acceptability
of Aesthetic
Factor.
1 59 02 57 16 03 55 02
2 59 00 59 17 02 56 03
3 59 00 59 14 05 52 07
4 59 03 56 18 01 55 01
5 59 01 58 13 06 51 07
TL 295 06 289 …….. ……….. 269 20
Percentage Distribution 93.08% 6.92%
Table 8: Assessment of Structural as a Factor of Modification in AHEOWSEN
wee
k
Total No
of
Responde
nt
No of
Non-
Response
s
No of
Response
s
No in
Support of
Construction
al Issue as a
Design
Factor
(Agree)
No Against
structural
Issue as a
Design
Factor(Disagre
e)
No of
Respondent
Acceptabilit
y of
structural
Factor
No of Non-
Acceptabilit
y of
structural
Factor.
1 59 02 57 08 00 57 00
2 59 00 59 07 01 58 01
3 59 00 59 08 00 59 00
4 59 03 56 06 02 53 03
5 59 01 58 07 01 56 02
TL 295 06 289 ……….. ………… 283 06
Percentage Distribution 97.92% 2.08%
Page 14
Nwankwo S. I et al Int. Journal of Engineering Research and Applications www.ijera.com
ISSN : 2248-9622, Vol. 4, Issue 2( Version 4), February 2014, pp.05-26
www.ijera.com 18 | P a g e
Figure 9: Bar Charts Showing Distribution of Respondents to Factors of Modification in AHEOWSEN
Case Study Two: Prefab Housing Estate Owerri,
South-Eastern Nigeria (PHEOWSEN)
The population of study in Prefab Housing
Estate was 385 respondents and 125 were sampled.
The percentage response was 96.0 percent (Table 9).
92.5 percent accepted functionality as a strong design
factor that caused them to modify their buildings
(Table 10). The percentage of respondents in support
of aesthetic as a design factor that contributed in no
small measure to the modification in the estate was
91.7 percent. In the same vein, 96.7 percent was in
support of construction issue as a design factor that
contributed to the frequent modification in the estate
(Table 11&Fig.10).
Table 9: Assessment of Functionality as a Factor of Modification in PHEOWSEN.
week Total No of
Respondent
No of
Non-
Responses
No of
Responses
No in Support
of
Functionality
as a Factor
No Against
Functionality as
a Factor
No of
Respondent
Acceptability
of
Functionality
Factor
No of Non-
Acceptability
of
Functionality
Factor.
1 25 01 24 20 05 22 02
2 25 03 22 23 02 21 01
3 25 00 25 24 01 23 02
4 25 01 24 23 02 21 03
5 25 00 25 20 05 24 01
TL 125 05 120 ………. ………… 111 09
Percentage Distribution 92.50% 7.50%
Table 10: Assessment of Aesthetic as a Factor of Modification in PHEOWSEN
week Total No of
Respondent
No of
Non-
Responses
No of
Responses
No in
Support of
Aesthetic as
a Factor
No Against
Aesthetic as
a Factor
No of
Respondent
Acceptability of
Aesthetic Factor
No of Non-
Acceptability of
Aesthetic
Factor.
1 25 01 24 15 04 21 03
2 25 03 22 16 03 20 02
3 25 00 25 17 02 23 02
4 25 01 24 18 01 23 01
5 25 00 25 17 03 23 02
TL 125 05 120 …….. …………. 110 10
Percentage Distribution 91.67% 8.33%
FUNCTIONALITY FACTOR
AESTHETIC FACTORSTRUCTURAL
FACTOR
No. of Respondent Acceptability of Design Factors
92.73% 93.08% 97.92%
No. of Non-Acceptability of Design Factors 7.27% 6.92% 2.08%
92.73% 93.08% 97.92%
7.27% 6.92%2.08%
0.00%
20.00%
40.00%
60.00%
80.00%
100.00%
120.00%
Pe
rce
nta
ges
No. of Respondent Acceptability of Design Factors No. of Non-Acceptability of Design Factors
Page 15
Nwankwo S. I et al Int. Journal of Engineering Research and Applications www.ijera.com
ISSN : 2248-9622, Vol. 4, Issue 2( Version 4), February 2014, pp.05-26
www.ijera.com 19 | P a g e
Table11: Assessment of Structural as a Factor of Modification in PHEOWSEN
week Total No of
Respondent
No of
Non-
Responses
No of
Responses
No in
Support of
Structural
as a
Factor
No
Against
Structural
as a
Factor
No of
Respondent
Acceptability
of Structural
Factor
No of Non-
Acceptability
of Structural
Factor.
1 25 01 24 07 01 23 01
2 25 03 22 06 02 20 02
3 25 00 25 08 00 25 00
4 25 01 24 08 00 24 00
5 25 00 25 07 01 24 01
TL 125 05 120 ………. …………. 116 04
Percentage Distribution 96.70% 3.33%
Figure 10: Bar Charts Showing Distribution of Respondents to Factors of Post Occupancy Modification in
PHEOWIMS
Models for Evaluation of Post-Occupancy
Modification of Residential Buildings in Public
Housing Estates in Owerri, South-Eastern Nigeria
The models were products derived from the
identified design factors that necessitated the post-
occupancy modifications in the selected housing
estates in the South-Eastern Nigeria (see field data:
Table 5- Table 12 below).
𝐒𝐲𝐦𝐛𝐨𝐥𝐬
𝑇𝑅 = 𝑇𝑜𝑡𝑎𝑙 𝑅𝑒𝑠𝑝𝑜𝑛𝑑𝑒𝑛𝑡,𝑁𝑅 = 𝑁𝑜 𝑅𝑒𝑠𝑝𝑜𝑛𝑠𝑒,𝑅= 𝑅𝑒𝑠𝑝𝑜𝑛𝑠𝑒
𝑃𝑆𝐹 = 𝑃𝑜𝑖𝑛𝑡𝑠 𝑆𝑢𝑝𝑝𝑜𝑟𝑡𝑖𝑛𝑔 𝐹𝑢𝑛𝑐𝑡𝑖𝑜𝑛𝑎𝑙𝑖𝑡𝑦 ,
𝑃𝐴𝐹 = 𝑃𝑜𝑖𝑛𝑡𝑠 𝐴𝑔𝑎𝑖𝑛𝑠𝑡 𝐹𝑢𝑛𝑐𝑡𝑖𝑜𝑛𝑎𝑙𝑖𝑡𝑦 𝐹𝐼𝐹 = 𝐹𝑢𝑛𝑐𝑡𝑖𝑜𝑛𝑎𝑙𝑖𝑡𝑦 𝐼𝑛𝑝𝑢𝑡 𝐹𝑎𝑐𝑡𝑜𝑟 ,𝑅𝐴𝑀= 𝑁𝑜 𝑂𝑓 𝑅𝑒𝑠𝑝𝑜𝑛𝑑𝑒𝑛𝑡 𝐴𝑐𝑐𝑒𝑝𝑡𝑖𝑛𝑔 𝑀𝑜𝑑𝑖𝑓𝑖𝑐𝑎𝑡𝑖𝑜𝑛
𝑀𝐴𝑅 = 𝑀𝑜𝑑𝑖𝑓𝑖𝑐𝑎𝑡𝑖𝑜𝑛 𝐴𝑐𝑐𝑒𝑝𝑡𝑎𝑏𝑖𝑙𝑖𝑡𝑦 𝑅𝑎𝑡𝑖𝑜
,𝑃𝑆𝐴 = 𝑃𝑜𝑖𝑛𝑡𝑠 𝑆𝑢𝑝𝑝𝑜𝑟𝑡𝑖𝑛𝑔 𝐴𝑒𝑠𝑡𝑒𝑡𝑖𝑐𝑠
𝑃𝑆𝐶= 𝑃𝑜𝑖𝑛𝑡𝑠 𝑆𝑢𝑝𝑝𝑜𝑟𝑡𝑖𝑛𝑔 𝐶𝑜𝑛𝑠𝑡𝑟𝑢𝑐𝑡𝑖𝑜𝑛𝑎𝑙 𝐼𝑠𝑠𝑢𝑒,𝑃𝐴𝐴= 𝑃𝑜𝑖𝑛𝑡𝑠 𝐴𝑔𝑎𝑖𝑛𝑠𝑡 𝐴𝑒𝑠𝑡𝑒𝑡𝑖𝑐 𝑃𝐴𝐶 = 𝑃𝑜𝑖𝑛𝑡𝑠 𝐴𝑔𝑎𝑖𝑛𝑠𝑡 𝐶𝑜𝑛𝑠𝑡𝑟𝑢𝑐𝑡𝑖𝑜𝑛𝑎𝑙 𝐼𝑠𝑠𝑢𝑒,𝐴𝐼𝐹
= 𝐴𝑒𝑠𝑡𝑒𝑡𝑖𝑐 𝐼𝑛𝑝𝑢𝑡 𝐹𝑎𝑐𝑡𝑜𝑟 (𝑦) 𝐶𝐼𝐹 = 𝐶𝑜𝑛𝑠𝑡𝑟𝑢𝑐𝑡𝑖𝑜𝑛𝑎𝑙 𝐼𝑛𝑝𝑢𝑡 𝐹𝑎𝑐𝑡𝑜𝑟 (𝛾) ,
𝑀𝐼 = 𝑀𝑜𝑑𝑖𝑓𝑖𝑐𝑎𝑡𝑖𝑜𝑛 𝐼𝑛𝑑𝑒𝑥
𝑭𝑰𝑭 =𝑷𝑺𝑭
𝑷𝑺𝑭+𝑷𝑨𝑭 ………………………………… (1)
𝑨𝑰𝑭 =𝑷𝑺𝑨
𝑷𝑺𝑨+𝑷𝑨𝑨 …….……………………………(2)
𝑪𝑰𝑭 =𝑷𝑺𝑪
𝑷𝑺𝑪+𝑷𝑨𝑪 ………………………………… (3)
𝑴𝑨𝑹 =𝑹𝑨𝑴
𝑻𝑹 …………………………………..... (4)
FUNCTIONALITY FACTOR
AESTHETIC FACTORSTRUCTURAL
FACTOR
No. of Respondent Acceptability of Design Factors
92.50% 91.67% 96.70%
No. of Non-Acceptability of Design Factors 7.50% 8.33% 3.33%
92.50% 91.67%96.70%
7.50% 8.33% 3.33%
0.00%
20.00%
40.00%
60.00%
80.00%
100.00%
120.00%
Pe
rce
nta
ges
No. of Respondent Acceptability of Design Factors No. of Non-Acceptability of Design Factors
Page 16
Nwankwo S. I et al Int. Journal of Engineering Research and Applications www.ijera.com
ISSN : 2248-9622, Vol. 4, Issue 2( Version 4), February 2014, pp.05-26
www.ijera.com 20 | P a g e
𝑴𝑰𝑬𝑿𝑷 =𝟏
𝟑[𝑴𝑨𝑹𝑭𝑰𝑭𝒊
+ 𝑴𝑨𝑹𝑨𝑰𝑭𝒊+ 𝑴𝑨𝑹𝑪𝑰𝑭𝒊
]
………………………………….. (5)
𝑴𝑰𝑴𝑶𝑫𝑶𝒗𝒆𝒓𝒂𝒍𝒍 =
𝑴𝑰𝑰𝑨𝑽…………………………………………… (6)
𝑫𝒆𝒗𝒊𝒂𝒕𝒊𝒐𝒏 𝑫𝑽 =𝑷𝒓𝒆𝒅𝒊𝒄𝒕𝒆𝒅 𝑽𝒂𝒍𝒖𝒆−𝑬𝒙𝒑𝒆𝒓𝒊𝒎𝒆𝒏𝒕𝒂𝒍 𝑽𝒂𝒍𝒖𝒆
𝑬𝒙𝒑𝒆𝒓𝒊𝒎𝒆𝒏𝒕𝒂𝒍 𝑽𝒂𝒍𝒖𝒆× 𝟏𝟎𝟎%
…………………… (7)
𝑪𝒐𝒓𝒓𝒆𝒄𝒕𝒊𝒐𝒏 𝑭𝒂𝒄𝒕𝒐𝒓 𝑪𝒇 = −𝑫𝑽 ….………….. (8)
𝑪𝒇 =−𝟏𝟎𝟎[𝑷𝒓𝒆𝒅𝒊𝒄𝒕𝒆𝒅 𝑽𝒂𝒍𝒖𝒆−𝑬𝒙𝒑𝒆𝒓𝒊𝒎𝒆𝒏𝒕𝒂𝒍 𝑽𝒂𝒍𝒖𝒆]
[𝑬𝒙𝒑𝒆𝒓𝒊𝒎𝒆𝒏𝒕𝒂𝒍 𝑽𝒂𝒍𝒖𝒆] …... (9)
𝑪𝑰 = 𝑪𝒐𝒆𝒇𝒇𝒊𝒄𝒊𝒆𝒏𝒕 𝒐𝒇 𝒎𝒐𝒅𝒊𝒇𝒊𝒄𝒂𝒕𝒊𝒐𝒏 𝒇𝒐𝒓 𝑰𝒎𝒐 𝑺𝒕𝒂𝒕𝒆
Aladinma Housing Estate Owerri, South-Eastern
Nigeria (AHEOWSEN)
𝑴𝑰𝟏 = −𝑨𝟏𝑿𝟐 + 𝑨𝟐𝑿 − 𝑩𝟏𝒀
𝟐 + 𝑩𝟐𝒀 − 𝑪𝟏𝜸𝟐 +
𝑪𝟐𝜸 − 𝑫
𝑰𝒏𝒕𝒓𝒐𝒅𝒖𝒄𝒊𝒏𝒈 𝒕𝒉𝒆 𝒄𝒐𝒏𝒔𝒕𝒂𝒏𝒕 𝒗𝒂𝒍𝒖𝒆𝒔 𝒐𝒇𝑨𝟏,𝑨𝟐,𝑩𝟏,𝑩𝟐,𝑪𝟏,𝑪𝟐,𝑫 W
𝑾𝒉𝒆𝒓𝒆 𝑨𝟏 = 𝟑.𝟕𝟖𝟒𝟐,𝑨𝟐 = 𝟔.𝟒𝟐𝟖,𝑩𝟏 = 𝟎.𝟓𝟏𝟕𝟑,𝑩𝟐 = 𝟎.𝟗𝟒𝟓𝟏,𝑪𝟏 = 𝟎.𝟓𝟒𝟑𝟓,𝑪𝟐 = 𝟏.𝟎𝟔𝟒𝟏,𝑫 = 𝟐.𝟕𝟐𝟓𝟕
𝑴𝑰𝑰 = −𝟑.𝟕𝟖𝟒𝟐𝑿𝟐 + 𝟔.𝟒𝟐𝟖𝑿 − 𝟎.𝟓𝟏𝟕𝟑𝒀𝟐 + 𝟎.𝟗𝟒𝟓𝟏𝒀 − 𝟎.𝟓𝟒𝟑𝟓𝜸𝟐 + 𝟏.𝟎𝟔𝟒𝟏𝜸 − 𝟐.𝟕𝟐𝟓𝟕
Prefab Housing Estate Owerri, South-Eastern
Nigeria (PHEOWSEN)
𝑴𝑰𝑰 = 𝑨(𝑿𝟐 + 𝒀𝟐 + 𝜸𝟐) + 𝑩(𝑿 + 𝒀 + 𝜸) + 𝑫
𝑰𝒏𝒕𝒓𝒐𝒅𝒖𝒄𝒊𝒏𝒈 𝒕𝒉𝒆 𝑪𝒐𝒏𝒔𝒕𝒂𝒏𝒕 𝒗𝒂𝒍𝒖𝒆𝒔 𝒐𝒇 𝑨,𝑩 𝒂𝒏𝒅 𝑫
𝑾𝒉𝒆𝒓𝒆 𝑨 = 𝟗.𝟔𝟔𝟔𝟕 𝒙 𝟏𝟎−𝟒,𝑩 = 𝟏.𝟖𝟑𝟑𝟑 𝒙 𝟏𝟎−𝟑,𝑫 = 𝟎.𝟖𝟖𝟖𝟏
𝑴𝑰𝑰 = 𝟎.𝟗𝟔𝟔𝟕𝒙𝟏𝟎−𝟒 (𝑿𝟐 + 𝒀𝟐 + 𝜸𝟐)
+ 𝟏.𝟖𝟑𝟑𝟑 𝒙 𝟏𝟎−𝟑 (𝑿 + 𝒀 + 𝜸) + 𝟎.𝟖𝟖𝟖𝟏
Evaluation of Modification Index of the Housing
Estates
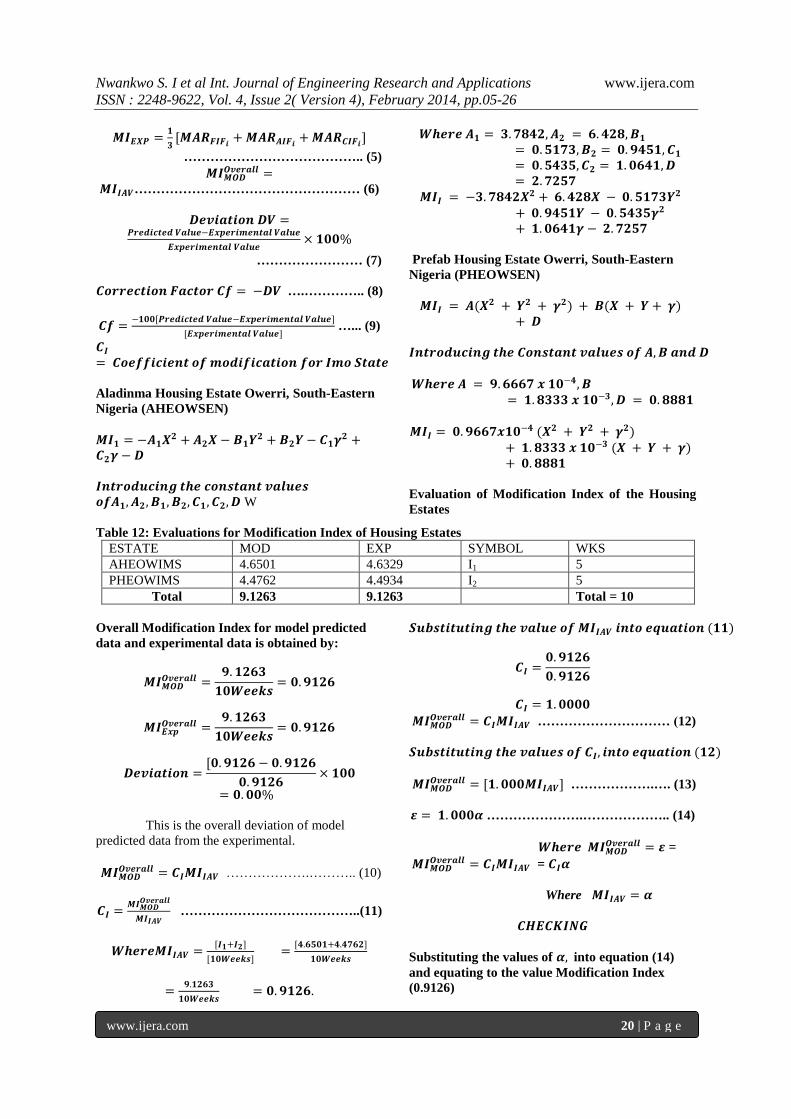
Table 12: Evaluations for Modification Index of Housing Estates
ESTATE MOD EXP SYMBOL WKS
AHEOWIMS 4.6501 4.6329 I1 5
PHEOWIMS 4.4762 4.4934 I2 5
Total 9.1263 9.1263 Total = 10
Overall Modification Index for model predicted
data and experimental data is obtained by:
𝑴𝑰𝑴𝑶𝑫𝑶𝒗𝒆𝒓𝒂𝒍𝒍 =
𝟗.𝟏𝟐𝟔𝟑
𝟏𝟎𝑾𝒆𝒆𝒌𝒔= 𝟎.𝟗𝟏𝟐𝟔
𝑴𝑰𝑬𝒙𝒑𝑶𝒗𝒆𝒓𝒂𝒍𝒍 =
𝟗.𝟏𝟐𝟔𝟑
𝟏𝟎𝑾𝒆𝒆𝒌𝒔= 𝟎.𝟗𝟏𝟐𝟔
𝑫𝒆𝒗𝒊𝒂𝒕𝒊𝒐𝒏 =[𝟎.𝟗𝟏𝟐𝟔 − 𝟎.𝟗𝟏𝟐𝟔
𝟎.𝟗𝟏𝟐𝟔× 𝟏𝟎𝟎
= 𝟎.𝟎𝟎%
This is the overall deviation of model
predicted data from the experimental.
𝑴𝑰𝑴𝑶𝑫𝑶𝒗𝒆𝒓𝒂𝒍𝒍 = 𝑪𝑰𝑴𝑰𝑰𝑨𝑽 ……………….……….. (10)
𝑪𝑰 =𝑴𝑰𝑴𝑶𝑫
𝑶𝒗𝒆𝒓𝒂𝒍𝒍
𝑴𝑰𝑰𝑨𝑽 …………………………………..(11)
𝑾𝒉𝒆𝒓𝒆𝑴𝑰𝑰𝑨𝑽 =[𝑰𝟏+𝑰𝟐]
[𝟏𝟎𝑾𝒆𝒆𝒌𝒔] =
[𝟒.𝟔𝟓𝟎𝟏+𝟒.𝟒𝟕𝟔𝟐]
𝟏𝟎𝑾𝒆𝒆𝒌𝒔
=𝟗.𝟏𝟐𝟔𝟑
𝟏𝟎𝑾𝒆𝒆𝒌𝒔 = 𝟎.𝟗𝟏𝟐𝟔.
𝑺𝒖𝒃𝒔𝒕𝒊𝒕𝒖𝒕𝒊𝒏𝒈 𝒕𝒉𝒆 𝒗𝒂𝒍𝒖𝒆 𝒐𝒇 𝑴𝑰𝑰𝑨𝑽 𝒊𝒏𝒕𝒐 𝒆𝒒𝒖𝒂𝒕𝒊𝒐𝒏 (𝟏𝟏)
𝑪𝑰 =𝟎.𝟗𝟏𝟐𝟔
𝟎.𝟗𝟏𝟐𝟔
𝑪𝑰 = 𝟏.𝟎𝟎𝟎𝟎
𝑴𝑰𝑴𝑶𝑫𝑶𝒗𝒆𝒓𝒂𝒍𝒍 = 𝑪𝑰𝑴𝑰𝑰𝑨𝑽 ………………………… (12)
𝑺𝒖𝒃𝒔𝒕𝒊𝒕𝒖𝒕𝒊𝒏𝒈 𝒕𝒉𝒆 𝒗𝒂𝒍𝒖𝒆𝒔 𝒐𝒇 𝑪𝑰, 𝒊𝒏𝒕𝒐 𝒆𝒒𝒖𝒂𝒕𝒊𝒐𝒏 (𝟏𝟐)
𝑴𝑰𝑴𝑶𝑫𝑶𝒗𝒆𝒓𝒂𝒍𝒍 = [𝟏.𝟎𝟎𝟎𝑴𝑰𝑰𝑨𝑽] ……………….…. (13)
𝜺 = 𝟏.𝟎𝟎𝟎𝜶 ………………….……………….. (14)
𝑾𝒉𝒆𝒓𝒆 𝑴𝑰𝑴𝑶𝑫𝑶𝒗𝒆𝒓𝒂𝒍𝒍 = 𝜺 =
𝑴𝑰𝑴𝑶𝑫𝑶𝒗𝒆𝒓𝒂𝒍𝒍 = 𝑪𝑰𝑴𝑰𝑰𝑨𝑽 = 𝑪𝑰𝜶
Where 𝑴𝑰𝑰𝑨𝑽 = 𝜶
𝑪𝑯𝑬𝑪𝑲𝑰𝑵𝑮
Substituting the values of 𝜶, into equation (14)
and equating to the value Modification Index
(0.9126)
Page 17
Nwankwo S. I et al Int. Journal of Engineering Research and Applications www.ijera.com
ISSN : 2248-9622, Vol. 4, Issue 2( Version 4), February 2014, pp.05-26
www.ijera.com 21 | P a g e
𝟎.𝟗𝟏𝟐𝟔 = (𝟏.𝟎𝟎𝟎𝟎 𝒙 𝟎.𝟗𝟏𝟐𝟔 = 𝟎.𝟗𝟏𝟐𝟔
0.9126 = 0.9126
Therefore, Post-occupancy Modification
Evaluation for Housing Estates in Owerri, South-
Eastern Nigeria can be conducted using the
model:
[𝜺 = 𝟏.𝟎𝟎𝟎𝟎𝜶 ]
𝑾𝒉𝒆𝒓𝒆 𝑴𝑰𝑰𝑨𝑽 = 𝑨𝒗𝒆𝒓𝒂𝒈𝒆 𝑴𝒐𝒅𝒊𝒇𝒊𝒄𝒂𝒕𝒊𝒐𝒏 𝒊𝒏𝒅𝒆𝒙
𝒇𝒐𝒓 𝒉𝒐𝒖𝒔𝒊𝒏𝒈 𝒆𝒔𝒕𝒂𝒕𝒆𝒔 𝒊𝒏 𝑶𝒘𝒆𝒓𝒓𝒊.
𝜺 = 𝑶𝒗𝒆𝒓𝒂𝒍𝒍 𝑴𝒐𝒅𝒊𝒇𝒊𝒄𝒂𝒕𝒊𝒐𝒏 𝒊𝒏𝒅𝒆𝒙 𝒇𝒐𝒓 𝑶𝒘𝒆𝒓𝒓𝒊. 𝑪𝑰 = 𝑪𝒐𝒆𝒇𝒇𝒊𝒄𝒊𝒆𝒏𝒕 𝒐𝒇 𝑴𝒐𝒅𝒊𝒇𝒊𝒄𝒂𝒕𝒊𝒐𝒏 𝒇𝒐𝒓 𝑶𝒘𝒆𝒓𝒓𝒊. 𝑩𝒂𝒔𝒆𝒅 𝒐𝒏 𝒕𝒉𝒆 𝒇𝒐𝒓𝒆𝒈𝒐𝒊𝒏𝒈, 𝒊𝒏 𝑶𝒘𝒆𝒓𝒓𝒊 𝒔𝒕𝒂𝒕𝒆
𝑶𝒗𝒆𝒓𝒂𝒍𝒍 𝑴𝒐𝒅𝒊𝒇𝒊𝒄𝒂𝒕𝒊𝒐𝒏 𝒊𝒏𝒅𝒆𝒙 𝜺 = 𝟎.𝟗𝟏𝟐𝟔 𝒐𝒓 𝟗𝟏.𝟐𝟔%
GRAPHICAL REPRESENTATION OF
VARIATION OF MODIFICATION INDEX
WITH DESIGN FACTORS
Aladinma Housing Estate Owerri, South-Eastern
Nigeria (AHEOWSEN)
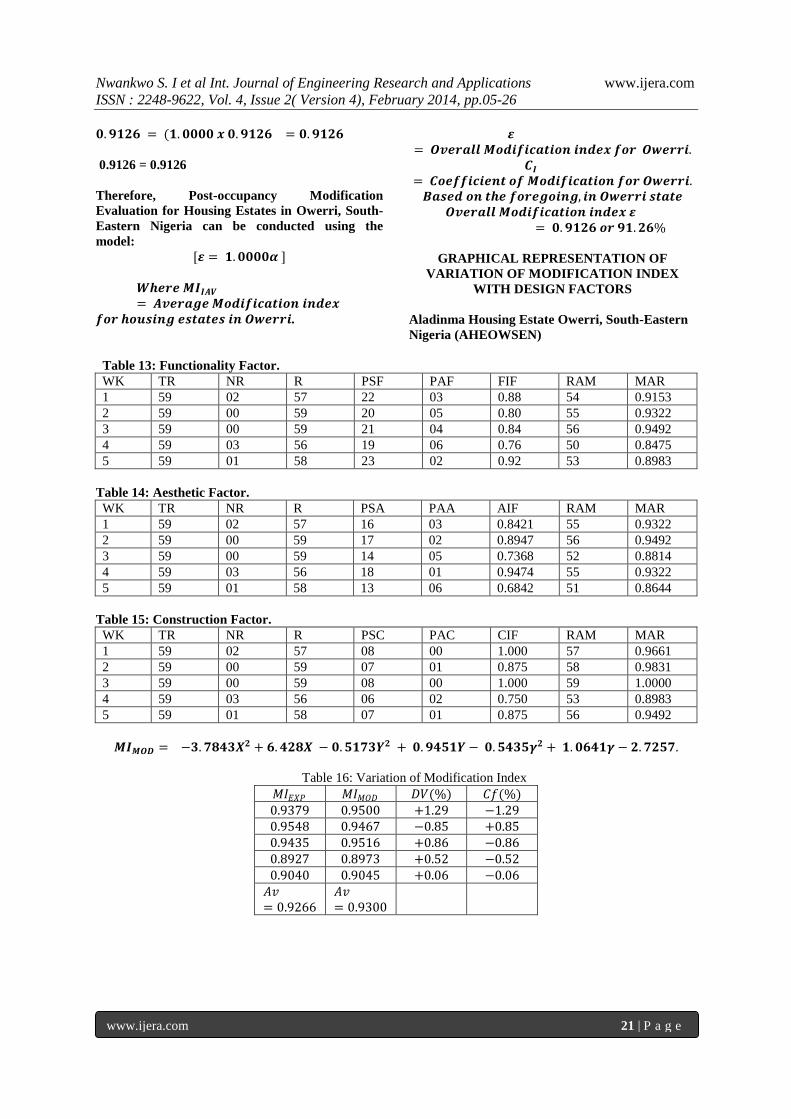
Table 13: Functionality Factor.
WK TR NR R PSF PAF FIF RAM MAR
1 59 02 57 22 03 0.88 54 0.9153
2 59 00 59 20 05 0.80 55 0.9322
3 59 00 59 21 04 0.84 56 0.9492
4 59 03 56 19 06 0.76 50 0.8475
5 59 01 58 23 02 0.92 53 0.8983
Table 14: Aesthetic Factor.
WK TR NR R PSA PAA AIF RAM MAR
1 59 02 57 16 03 0.8421 55 0.9322
2 59 00 59 17 02 0.8947 56 0.9492
3 59 00 59 14 05 0.7368 52 0.8814
4 59 03 56 18 01 0.9474 55 0.9322
5 59 01 58 13 06 0.6842 51 0.8644
Table 15: Construction Factor.
WK TR NR R PSC PAC CIF RAM MAR
1 59 02 57 08 00 1.000 57 0.9661
2 59 00 59 07 01 0.875 58 0.9831
3 59 00 59 08 00 1.000 59 1.0000
4 59 03 56 06 02 0.750 53 0.8983
5 59 01 58 07 01 0.875 56 0.9492
𝑴𝑰𝑴𝑶𝑫 = −𝟑.𝟕𝟖𝟒𝟑𝑿𝟐 + 𝟔.𝟒𝟐𝟖𝑿 − 𝟎.𝟓𝟏𝟕𝟑𝒀𝟐 + 𝟎.𝟗𝟒𝟓𝟏𝒀 − 𝟎.𝟓𝟒𝟑𝟓𝜸𝟐 + 𝟏.𝟎𝟔𝟒𝟏𝜸 − 𝟐.𝟕𝟐𝟓𝟕.
Table 16: Variation of Modification Index 𝑀𝐼𝐸𝑋𝑃 𝑀𝐼𝑀𝑂𝐷 𝐷𝑉(%) 𝐶𝑓(%) 0.9379 0.9500 +1.29 −1.29 0.9548 0.9467 −0.85 +0.85 0.9435 0.9516 +0.86 −0.86 0.8927 0.8973 +0.52 −0.52 0.9040 0.9045 +0.06 −0.06 𝐴𝑣= 0.9266
𝐴𝑣= 0.9300
Page 18
Nwankwo S. I et al Int. Journal of Engineering Research and Applications www.ijera.com
ISSN : 2248-9622, Vol. 4, Issue 2( Version 4), February 2014, pp.05-26
www.ijera.com 22 | P a g e
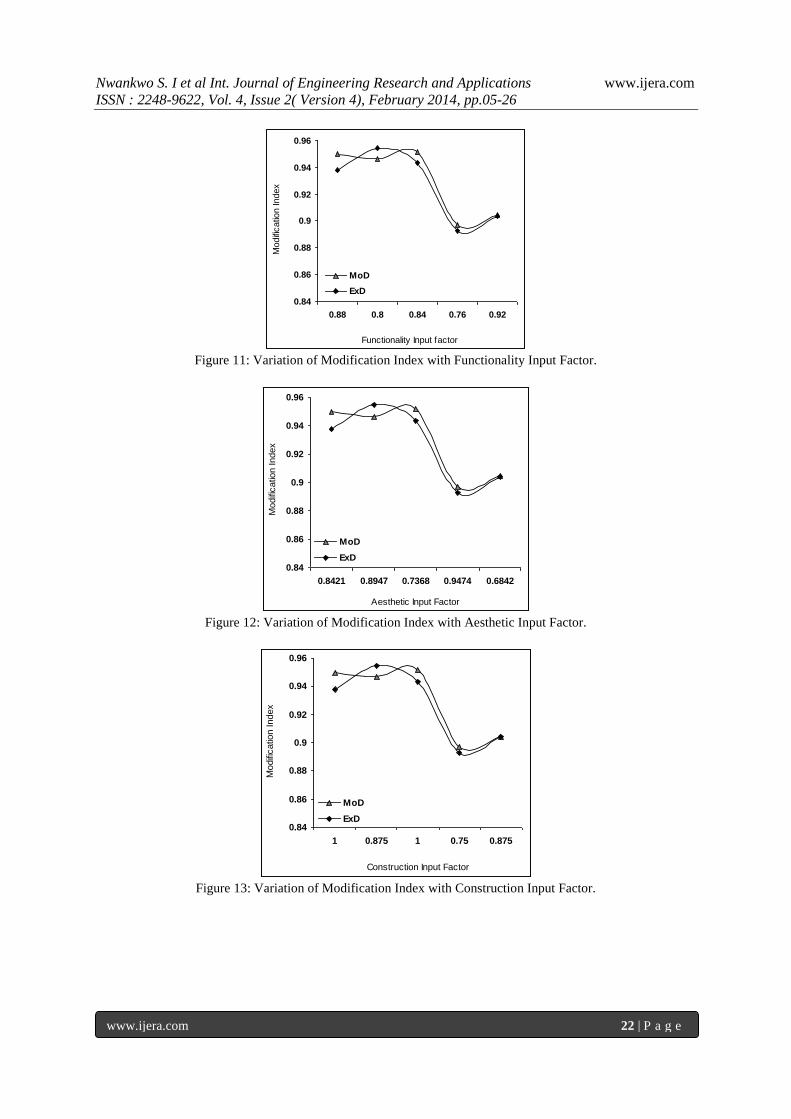
Figure 11: Variation of Modification Index with Functionality Input Factor.
Figure 12: Variation of Modification Index with Aesthetic Input Factor.
Figure 13: Variation of Modification Index with Construction Input Factor.
0.84
0.86
0.88
0.9
0.92
0.94
0.96
0.88 0.8 0.84 0.76 0.92
Functionality Input factor
Modifi
catio
n Index
MoD
ExD
0.84
0.86
0.88
0.9
0.92
0.94
0.96
0.8421 0.8947 0.7368 0.9474 0.6842
Aesthetic Input Factor
Modifi
catio
n Index
MoD
ExD
0.84
0.86
0.88
0.9
0.92
0.94
0.96
1 0.875 1 0.75 0.875
Construction Input Factor
Modifi
catio
n Index
MoD
ExD
Page 19
Nwankwo S. I et al Int. Journal of Engineering Research and Applications www.ijera.com
ISSN : 2248-9622, Vol. 4, Issue 2( Version 4), February 2014, pp.05-26
www.ijera.com 23 | P a g e
Prefab Housing Estate Owerri (PHEOWSEN)
Table 17: Functionality Factor.
WK TR NR R PSF PAF FIF RAM MAR
1 25 01 24 20 05 0.80 22 0.88
2 25 03 22 23 02 0.92 21 0.84
3 25 00 25 24 01 0.96 23 0.92
4 25 01 24 23 02 0.92 21 0.84
5 25 00 25 20 05 0.80 24 0.96
Table 18: Aesthetic Factor.
WK TR NR R PSA PAA AIF RAM MAR
1 25 01 24 15 04 0.7895 21 0.84
2 25 03 22 16 03 0.8421 20 0.80
3 25 00 25 17 02 0.8947 23 0.92
4 25 01 24 18 01 0.9474 23 0.92
5 25 00 25 17 02 0.8947 23 0.92
Table 19: Construction Factor.
WK TR NR R PSC PAC CIF RAM MAR
1 25 01 24 07 01 0.875 23 0.92
2 25 03 22 06 02 0.75 20 0.80
3 25 00 25 08 00 1.00 25 1.00
4 25 01 24 08 00 1.00 24 0.96
5 25 00 25 07 01 0.875 24 0.96
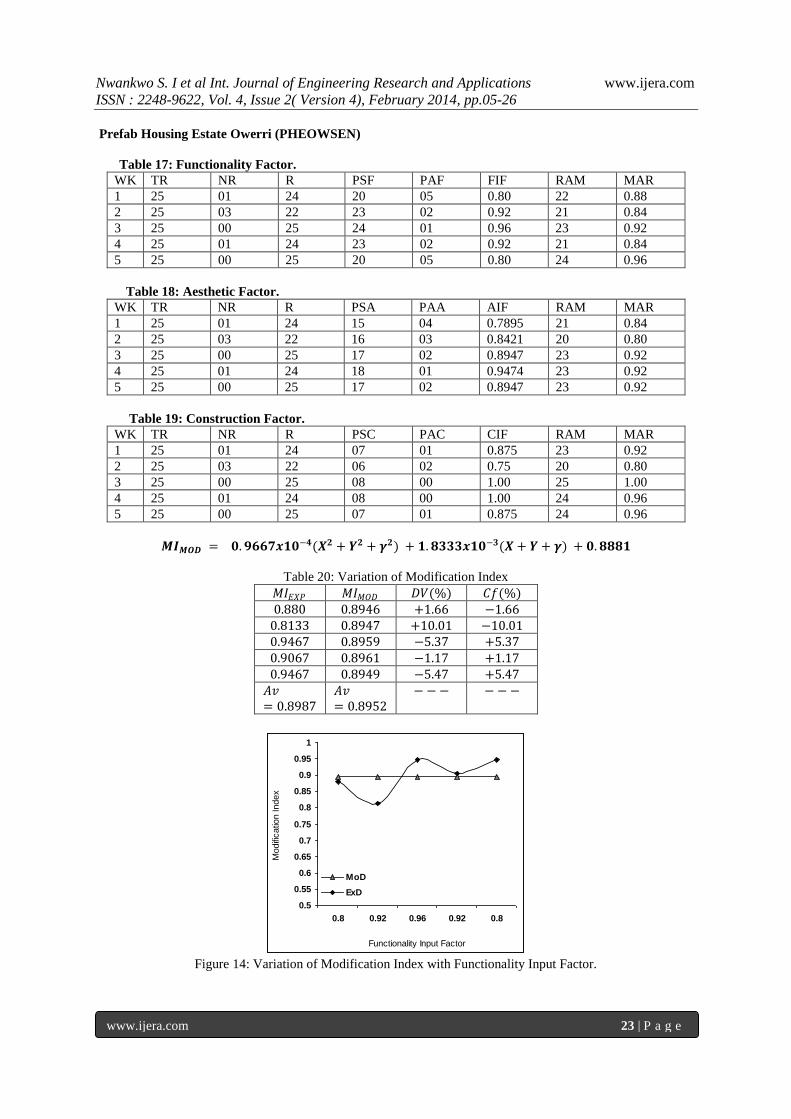
𝑴𝑰𝑴𝑶𝑫 = 𝟎.𝟗𝟔𝟔𝟕𝒙𝟏𝟎−𝟒(𝑿𝟐 + 𝒀𝟐 + 𝜸𝟐) + 𝟏.𝟖𝟑𝟑𝟑𝒙𝟏𝟎−𝟑(𝑿 + 𝒀 + 𝜸) + 𝟎.𝟖𝟖𝟖𝟏
Table 20: Variation of Modification Index 𝑀𝐼𝐸𝑋𝑃 𝑀𝐼𝑀𝑂𝐷 𝐷𝑉(%) 𝐶𝑓(%) 0.880 0.8946 +1.66 −1.66
0.8133 0.8947 +10.01 −10.01 0.9467 0.8959 −5.37 +5.37 0.9067 0.8961 −1.17 +1.17 0.9467 0.8949 −5.47 +5.47 𝐴𝑣= 0.8987
𝐴𝑣= 0.8952
− −− − −−
Figure 14: Variation of Modification Index with Functionality Input Factor.
0.5
0.55
0.6
0.65
0.7
0.75
0.8
0.85
0.9
0.95
1
0.8 0.92 0.96 0.92 0.8
Functionality Input Factor
Modifi
catio
n Index
MoD
ExD
Page 20
Nwankwo S. I et al Int. Journal of Engineering Research and Applications www.ijera.com
ISSN : 2248-9622, Vol. 4, Issue 2( Version 4), February 2014, pp.05-26
www.ijera.com 24 | P a g e
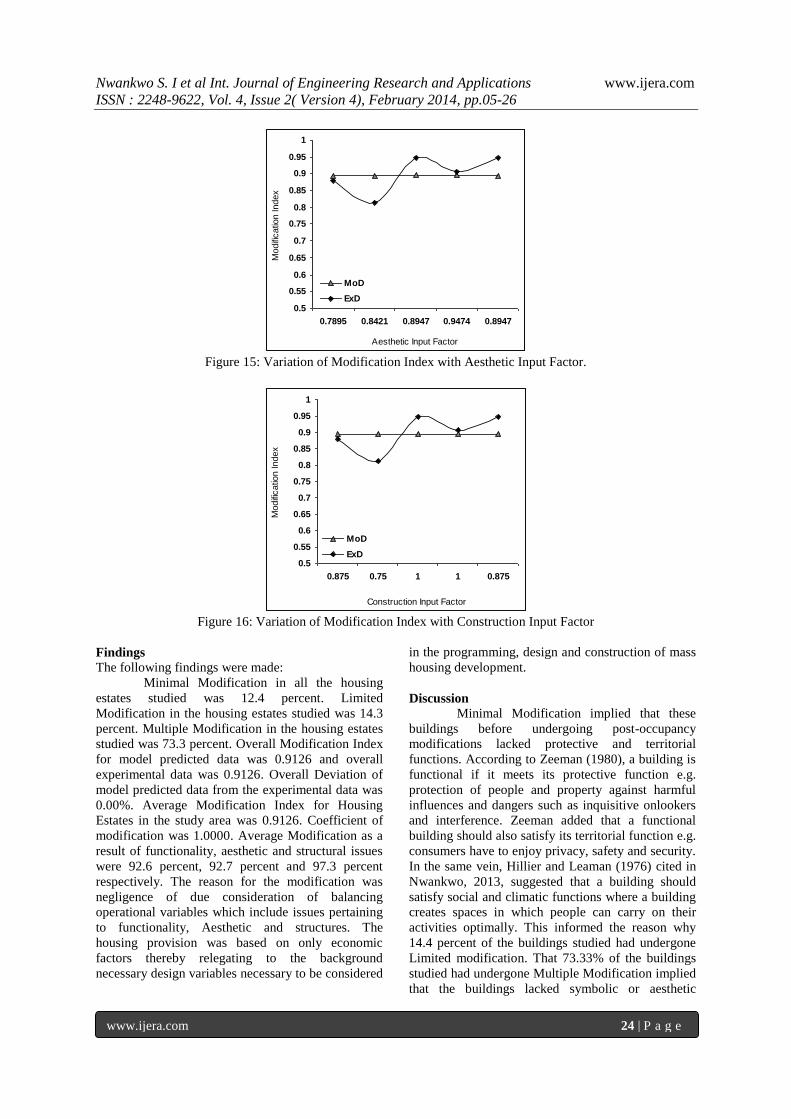
Figure 15: Variation of Modification Index with Aesthetic Input Factor.
Figure 16: Variation of Modification Index with Construction Input Factor
Findings
The following findings were made:
Minimal Modification in all the housing
estates studied was 12.4 percent. Limited
Modification in the housing estates studied was 14.3
percent. Multiple Modification in the housing estates
studied was 73.3 percent. Overall Modification Index
for model predicted data was 0.9126 and overall
experimental data was 0.9126. Overall Deviation of
model predicted data from the experimental data was
0.00%. Average Modification Index for Housing
Estates in the study area was 0.9126. Coefficient of
modification was 1.0000. Average Modification as a
result of functionality, aesthetic and structural issues
were 92.6 percent, 92.7 percent and 97.3 percent
respectively. The reason for the modification was
negligence of due consideration of balancing
operational variables which include issues pertaining
to functionality, Aesthetic and structures. The
housing provision was based on only economic
factors thereby relegating to the background
necessary design variables necessary to be considered
in the programming, design and construction of mass
housing development.
Discussion
Minimal Modification implied that these
buildings before undergoing post-occupancy
modifications lacked protective and territorial
functions. According to Zeeman (1980), a building is
functional if it meets its protective function e.g.
protection of people and property against harmful
influences and dangers such as inquisitive onlookers
and interference. Zeeman added that a functional
building should also satisfy its territorial function e.g.
consumers have to enjoy privacy, safety and security.
In the same vein, Hillier and Leaman (1976) cited in
Nwankwo, 2013, suggested that a building should
satisfy social and climatic functions where a building
creates spaces in which people can carry on their
activities optimally. This informed the reason why
14.4 percent of the buildings studied had undergone
Limited modification. That 73.33% of the buildings
studied had undergone Multiple Modification implied
that the buildings lacked symbolic or aesthetic
0.5
0.55
0.6
0.65
0.7
0.75
0.8
0.85
0.9
0.95
1
0.7895 0.8421 0.8947 0.9474 0.8947
Aesthetic Input Factor
Modifi
catio
n Index
MoD
ExD
0.5
0.55
0.6
0.65
0.7
0.75
0.8
0.85
0.9
0.95
1
0.875 0.75 1 1 0.875
Construction Input Factor
Modifi
catio
n Index
MoD
ExD
Page 21
Nwankwo S. I et al Int. Journal of Engineering Research and Applications www.ijera.com
ISSN : 2248-9622, Vol. 4, Issue 2( Version 4), February 2014, pp.05-26
www.ijera.com 25 | P a g e
function before undergoing modifications. Leaman
(1976) suggested that a building should be seen as the
material embodiment of the specific ideas and
expectations and as such should be seen as a cultural
object with social and cultural significance and
meaning. This implied that some consumers modified
their buildings in search of identity and image.
According to Van Dijk and De Graaf (1990),
consumers of building products believe that a
building only becomes architecture when it plays a
part in aesthetic and cultural discussion and there
should be expression of experiential value,
conveyance of meaning, visual quality, aesthetic and
symbolism. It implied that this category of buildings
originally failed to satisfy functional or utility quality
and as such could not be suitable for the activities
that were meant to take place inside. According to
Van der Voordt and Vrielink (1987) cited in
Nwankwo, 2013, a building should fulfill its required
functional quality or utility value without which it
becomes a failure.
From the above discussions, aesthetic,
functionality and constructional issues were
established as necessary design factors that could not
be ignored at the formulation/programming, design
and construction stages of public residential buildings
in mass housing provision. According to Van der
Voordt and Van Wegen (2005), this was in line with
the three components of architecture distinguished by
Vitruvius as: utilitas(functionality or utility value: the
social dimension), firmitas(strength and rigidity: the
technological dimension) and venustas (beauty: the
aesthetic dimension). The factor variables should be
in Equilibrium. The researchers entitled this approach
Equilibrium of Appropriate Balance which is an
attempt to reconcile and bring design factors into
equilibrium (Martins, 2010). The „Equilibrium of
Appropriate Balance‟ describes the state of
intellectual balance between opposing design forces
and actions that is deliberately designed to be in
harmonious balance.
The authors observed that the programming and
design of public residential buildings in the study
area were based only on one portion of a total
theoretical design-economic design factor and this
has led to frequent modification of residential
buildings at post-occupancy stage.
From the analysis result, it was discovered
that the overall modification Index for model
predicted data was 0.9126 and overall experimental
data was 0.9126. Overall deviation of model
predicted data from the experimental data was
calculated to be 0.00 percent. Average modification
index (𝑴𝑰𝑰𝑨𝑽) for Owerri necessitated by
functionality, aesthetic and constructional input
factors based on field data was 0.8914 with
coefficient of modification (𝑪𝑰) of 1.0000. This
implied that 91.3 percent of the buildings in housing
estates studied in Owerri had undergone post-
occupancy modifications since inception.
Mathematical model for post-occupancy evaluation
for Owerri was developed to be 𝑴𝑰𝑴𝑶𝑫𝑶𝒗𝒆𝒓𝒂𝒍𝒍 =
𝑪𝑰𝑴𝑰𝑰𝑨𝑽 .
V. Conclusion and Recommendation For efficient and effective mass housing
delivery to be achieved in the study area, the
following recommendations are made:
Mass housing providers in Owerri, South-
Eastern Nigeria should develop the culture of
conducting post-occupancy evaluation of
residential buildings in the housing estates they
provide with a view to determining the success
of their building products through feed-back
information from the consumers.
The post-occupancy evaluation is made possible
using the model 𝑴𝑰𝑴𝑶𝑫𝑶𝒗𝒆𝒓𝒂𝒍𝒍 = 𝑪𝑰𝑴𝑰𝑰𝑨𝑽
developed in this study. This approach would
bring the necessary improvement required in the
housing sector.
The consumers of the building products should
be involved in the design and construction of
their buildings and their opinions respected since
this research revealed that post-occupancy
modification was a reaction in response to needs
and aspirations not met.
The building products should be made
consumer-specific.
The concept of Equilibrium of Appropriate
Balance which the researcher entitled Construct-
Functional Aesthetic Balance should be used in
the design and construction of mass housing.
Tertiary Institutions in the study area should
restructure their academic curriculum on mass
housing delivery to capture the contributions of
this study.
REFERENCES [1] Adedeji, Y.M.D. (2005). Sustainable low-
cost housing technologies in cities:
Accelerated construction initiatives option.
Journal of Land Use and Development
Studies, 1(1), 102-108
[2] Ademiluyi, A.I. & Raji, B.A. (2008). Public
and private developers as agents in urban
housing delivery in Sub-Saharan Africa: The
situation in Lagos State. Humanity & Social
Sciences Journal, 3(2), 143-150.
[3] Aribigbola, A. (2008), Housing Policy
Formulation in Developing Countries:
Evidence of Programme Implementation
from Akure, Ondo State, Nigeria. Journal of
Human Ecology, 23(2), 125-134.
Page 22
Nwankwo S. I et al Int. Journal of Engineering Research and Applications www.ijera.com
ISSN : 2248-9622, Vol. 4, Issue 2( Version 4), February 2014, pp.05-26
www.ijera.com 26 | P a g e
[4] Al-Momani, A.H. (2003) Housing quality:
Implications for design and management.
Journal of Urban Planning and Design,
129(4), 177-194.
[5] Bordas, B., and Leaman, A. (Eds.) (2000)
Assessing building performance in use.
Building Research & Information 29 (2), 34-
40
[6] Duffy, F. (2008) Building Appraisal : A
personal View. Journal of Building
Appraisal 4(3): 149-156./ Article.
[7] Groat, L., & Wang, D. (2002). Architectural
research methods. New York: J. Wiley.
[8] Nwankwo, S. I. (2013), Developing a Model
for Post-Occupancy Evaluation of
Modification of Residential Buildings in
Public Housing Estates in South-Eastern
Nigeria. Ph.D. Thesis Unpublished, Abia
State University Uturu, Nigeria
[9] Preiser, W.F. and Schramm, U. (1998)
Building performance evaluation. In D.
Watson, M.J Crossbie and J.H. Callender
(eds.) Time-saver satandards, 7th
ed. New
York: McGraw Hill.
[10] Preiser, W.F. and Vischer, J.C. (eds.) (2004)
Assessing building performance: Methods
and Case Studies. Oxford: Elsevier.
[11] Preiser, W.F. (2002) The evolution of post–
occupancy evaluation, Towards Building
Performance and Design Evaluation,
Washington: FFCM Academy Press
[12] Preiser, W.F, (1995) Post-occupancy
evaluation: How to make buildings work
better. Journal of Facilities 13(11), 19-28.
[13] Vischer, J. (2002) Post-occupancy
Evaluation: A multifaced tool for building
improvement, (Chap. 3). United States
Federal Facilities Council. The National
Academy Press, pp. 23-34.
[14] Uji, Z.A (2009) Tools and Instruments of
Research in Design and Allied Disciplines:
Jos-Nigeria Ichejum Publishers Voordt V.
and Van Wegen, H.B (2005) Architecture in
Use: An Introduction to the Programming,
Design and Evaluation of Buildings. Oxford:
Elservier Wahab, K. A. (1983), More than
shelter, inaugural lecture series 10 Ile-Ife:
University of Ife.
[15] Watson, C. (2003) Review of Building
Quality Using Post-occupancy Evaluation.
Journal of Programme Education Building
35: 1-5.
[16] Watt, D (2007) Building pathology, 2nd
ed.
Oxford: Blackwell Watson, C. (2003)
Review of building quality using post-
occupancy evaluation. Journal of
Programme Education Building 35: 1-5.
[17] Zeeman, J. (1980) Funkionele Analyse.
Voorbereiding en Methodiek Bij Het
Ontwerpen Van Gebouwen (Functional
Analysis, Preparation and Methodology for
the Design of Duildings). Lectures by W.N.
de Bruijn. Faculty of Architecture, Delft
University of Technology.