e University of Maine DigitalCommons@UMaine Bulletins Maine Agricultural and Forest Experiment Station 5-1958 B571: Contract Broiler Growing in Maine Richard F. Saunders Follow this and additional works at: hps://digitalcommons.library.umaine.edu/aes_bulletin Part of the Agricultural Economics Commons , and the Poultry or Avian Science Commons is Report is brought to you for free and open access by DigitalCommons@UMaine. It has been accepted for inclusion in Bulletins by an authorized administrator of DigitalCommons@UMaine. For more information, please contact [email protected]. Recommended Citation Saunders, R.F. 1958. Contract broiler growing in Maine. Maine Agricultural Experiment Station Bulletin 571.
Transcript
The University of MaineDigitalCommons@UMaine
Bulletins Maine Agricultural and Forest Experiment Station
5-1958
B571: Contract Broiler Growing in MaineRichard F. Saunders
Follow this and additional works at: https://digitalcommons.library.umaine.edu/aes_bulletin
Part of the Agricultural Economics Commons, and the Poultry or Avian Science Commons
This Report is brought to you for free and open access by DigitalCommons@UMaine. It has been accepted for inclusion in Bulletins by an authorizedadministrator of DigitalCommons@UMaine. For more information, please contact [email protected].
Recommended CitationSaunders, R.F. 1958. Contract broiler growing in Maine. Maine Agricultural Experiment Station Bulletin 571.
The development and growth of the broiler industry in Maine has been without exception the most remarkable event in the history of Maine agriculture. By now the broiler industry has become well established in Maine, and this relatively young industry is fast becoming recognized as a very important segment of the economy of the State of Maine. The broiler industry has provided a new source of income to Maine people and has done much to bolster the economy of the state. The unique organization of the broiler industry, compared to other agricultural enterprises, has resulted in continued growth, increased efficiency, quality control, and income stability unprecedented in the history of agriculture. There is no question but what the broiler industry in Maine will continue to grow in the future. Further expansion is currently being scheduled, planned and promoted. Although, undoubtedly, there will be temporary periods of economic stress, as in any dynamic business enterprise, all indications point to a very bright future for Maine's broiler industry. It is hoped this publication will help provide a better understanding of the broiler industry in Maine.
TABLE OF CONTENTS
sUMMARy .. . . . DEVELOPMENT AND GROWTH OF THE BROILER
"INDUSTRY IN MAINE .. PROGRESS IN PRODUCTION EFFICIENCY . . . THE MAINE BROILER GROWER ..
Occupation Age . . .. Previous Occupation . Financing Buildings and Equipment . Capital Invested in Buildings and Equipment . .. . .. . . . Contract Grower's Costs of Producing Broilers Contract Grower's Gross Returns . Financial Condition of Growers . Grower's Satisfaction With Growing Arrangement .
MANAGEMENT PRACTICES . Size of Broiler Farms . . . Month Started .. . Mortality Feed Conversion . Age When Processed . Weight When Processed . Labor Efficiency . . . . ... . . . . Production Costs .. .
COMPARATIVE EFFICIENCY OF SYSTEMS OF BROILER PRODUCTION .
Contract and Independent Systems .. Flat-Fee and Profit-Sharing Plans .
FAClORS AFFECTING PRODUCTION COSTS . Size of Lot . Feed Conversion Lab? r Efficiency . . .. . . . . . .
The Maine broiler industry had its beginning in the late 1920's and early 1930's with the greatest development occurring after W orld War II. Live poultry buyers, who later became proces. sors, were the originators of the industry and have played the lead. ing role in its development. Processing and broiler production along with hatching egg production and hatchery operations are vertically integrated to a relatively high degree in Maine. Broiler production is primarily under the management and supervision of processors or their affiliates who contract with growers for raising the broilers. The grower owns and furnishes the buildings, equipment and labor for which he receives a guara'nteed payment from the processor based either on a per bird, per square foot or aprofit.sharing arrangement. The processor furnishes the chicks, feed, fuel, litter, medicine, insurance on the birds, lights in some instances, flock supervision, and makes most of the management decisions dealing with production and marketing.
Broiler production in Maine has continued to increase at a more rapid rate than broiler production in the entire United States. By 1957 broiler production in Maine had reached 50 million birds which amounted to 3.5 per cent of total U. S. broiler production, mal{ing Maine the 10th ranking broiler slate. In recent years Maine has become the largest single supplier of processed poultry to New York City obtaining a 25 per cent share of this market, and at the same time receiving a premium price for its broilers. An increasing proportion of Maine's broiler production also is finding its way into nearby New England markets.
Along with the expansion that has taken place in the broiler industry there have been substantial advances in production effi· ciency which have lowered production costs in spite of continually rising costs of labor, buildings, equipment and supplies.
The average size broiler operation in Maine in 1956 was sIi~htly over 11,000 birds per lot with most growers raisinQ: four lots per year. About 80 per cent of the growers devoted full time to broiler growing. Before going into raising broilers about 40 per cent of the growers were engaged in some type of non-farm work. Slightly less than half of the growers obtained their first hroiler house by remodeling a dairy barn while an equal number built a new broiler house. About half of the growers paid cash i'or the remodeling or construction of buildings and the other half obtained loans, mostly from local banks. Capital invested in hroiler buildings amounted to an average of $14,074 per farm
- .20 per bird capacity. Contract growers had net worths that
d 21,692 in 1955. ontract broiler growers' costs of producing broilers in 1955
0.3 cents per bird delivered, or 2.9 cents per pound ~or l' • buildin and equipment furnished by the grower. BuIld· ' d qtripme:nt costs averaged 4.6 cents per bird delivered or
p~ pomid, and varied froUl a low of 1.1 cenls p~r pound larger lo~ ,to ovcr 3 cents a pound for thc sma.llest lOts.
to conl:ra t '!rowers during the period July 1950 W
"v.,.:r8Jled -~ .. (), 'cents per pound, or nearly one cent pel' '1
tract bra:'uer growers were generally satisfied witil for owing broilers and their par,iculaL"
few bJdicatcd, however, that they would like to ar payments. When asked if they would
broiler on Jan independent basis if they could obtain IllIlaIlCl.ng, m-;; t 'of the growers said they would not, mainly
becalJae of the x -: k involved. For oihe 300,lot,s of broilers marketed during the 12-month
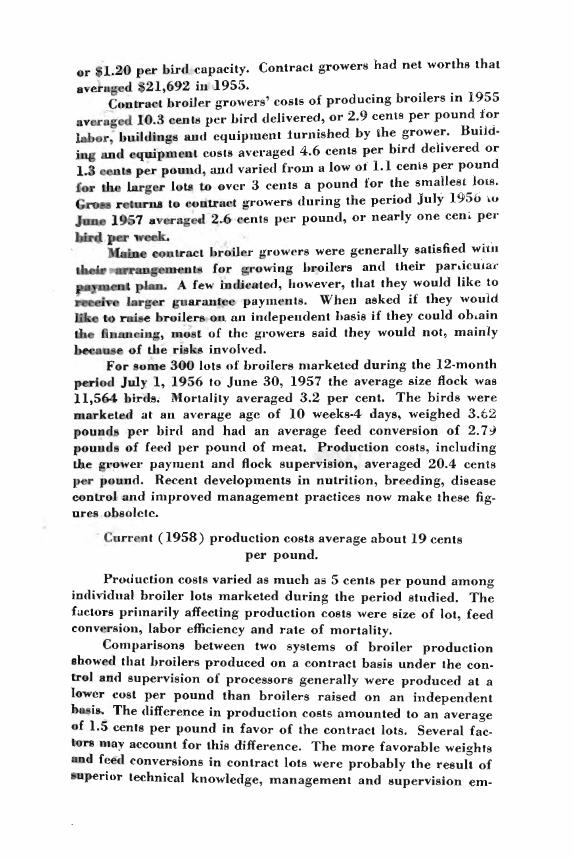
Jul 1, 1956 to June 30, 1957 the average size flock was 11,5 bir . Mortality averaged 3.2 per cent. The birds were
k e le.d at- an average age of 10 weeks·4 days, weighed 3.c2 pou~ ·per bird and had an average feed conversion of 2.7'0) pound of feed per pound of meat. Production costs, including the river payment and flock supervision, averaged 20.4 cents
pOlUld. Recent developments in nutrition, breeding, disease ntroland improved management practices now make these fig.
ur .. obsolete.
- Curr nt (1958) production costs average about 19 cents . per pound.
Production costs varied as much as 5 cents per pound among individual broiler lots marketed during the period studied. The f ctors primarily affecting production costs were size of lot, feed conv 'rsion, labor efficiency and rate of mortality .
. Comparisons between two syst.ems of broiler production how d that broilers produced on a contract basis under the con.
trol alld supervision of processors generally were produced at a I wer cost per pound than broilers raised on an independent b i. The difference in production costs amounted to an averaae f 1.5 cents per pound in favor of the contract lots. Several fa"c.
t may account for this difference. The more favorable weigh.s d feed conversions in contract lots were probably the result of peri or technical knowledge, management and supervision em.
ployed by the relatively large, vertically integrated broiler operations. Also, there are economies associated with large volume purchasing of feed, chicks and supplies that the larger integrated operations may be able to take advantage of more readily than smaller independent growers. One of the alleged weaknesses of the contract system has been that it provides less incentive to Ihe grower to do a good job in caring for the birds. This weakness apparently has been overcome to a considerable extent in Maine through good management and close supervision on the part of processor-contractors, incentive and profi t-sharing arrangements, and the lil{elihood of a grower being dropped if satisfactory performance is not attained.
Broilers grown under profit-sharing or incentive plans with minimum guarantees were generally produced at a lower cost per pound than broilers grown under flat-fee grower payment plans. The difference in production costs averaged 1.4 cents per pound in favor of profit-sharing plans. Although part of the difference was due to slightly lower grower payments for profit-sharing lots, most of the difference was due to their better average feed effi. ciency. It would appear then that profit-sharing plans with minimum guarantees provide more incentive to contract growers 10
reduce production costs than do plans that offer growers a :Rat rate payment per bird.
The findings from this study of contract broiler growing in Maine indicate that carefully planned, vertical integration by processors is a sound method of cost reduction and quality control. Furthermore, contract broiler growers generally are satisfied with their arrangements for growing broilers and prefer the contract system to growing broilers independently. The Maine broiler industry in tying together its production, processing and marketing functions has pioneered an evolution that may encompaSfi other segments of agriculture in the future.
BULLETIN 571
CONTRACT BROILER GROWING IN MAINE RICHARD SAUNDERS'
EVELOPMENT and GROWTH of the BROILER INDUSTRY in MAINE
The Maine broiler industry had its beginning in the late 1920's and early 1930's. Live poultry buyers who later became processors were the originators of the industry and have played the leading role in its development. Previous to the advent of commercial broiler growing, the op~ra
tions of poultry dealers were confined to buying and selling fowl and cockerels from farm laying and replacement fio.:ks. Their operations were seasonal with the summer and early fall months being the important
ons. Until 1942 nearly all of the poultry moving out-of-state was 'pped live to the Boston and New York live poultry markets.
As World War II began to make itself felt in the industry by the of trucks, tires, and gasoline, the shipment of live poultry be
m asingly difficult. In 1942-43, several live poultry buyers estab~pou1try dressing plants in the state. By present standards the first
Pfl:X:C:ssi:~' plants were small, poorly equipped and required mu :::h hand ply of poultry was inadequate to operate the plants
th r round. years the demand for poultry meat increased sub-
Y Ili it of the few unrationed meat items. It was not re dressing p t operators could see the advantages that were
available t 1& ' ~ aioe. In this state an already well-established by ,chick: industry provided the foundation upon rc ,. ilcr industry could be built and grow. For years d Been producing la(ge numbers of hatching eggs t "of which were being shipped to other states '!JS
r ,1 ." flocks. Other important factors which con-, pan ion of a commercial broiler industry in Maine
c:;A,i1:'U;.u' ce of surplus labor in many rural areas, and the availub-marginal farms with large dairy barns which could
d over economically into large broiler units . As the broiler in. try; . panded it carried other segments of the industry with it. The
'dfor baby chicks has risen steadily, and this in turn has increased s~ f Maine's hatching egg market.
Agricultural Economist, Maine Agricultural Experiment Station. The author wishes to ~)(press his gratitude to Dr. C. H . Merchant, head of the De~~lent of Agncultural Economics, University of Maine, for his help in plannIng the stu~y and in reviewing the manuscript. Special acknowledgment is made to the Maine broiler growers and processors who provided the data for the dy.
8 MAINE AGRICULTURAL EXPERIMENT STATION BULLETIN 571
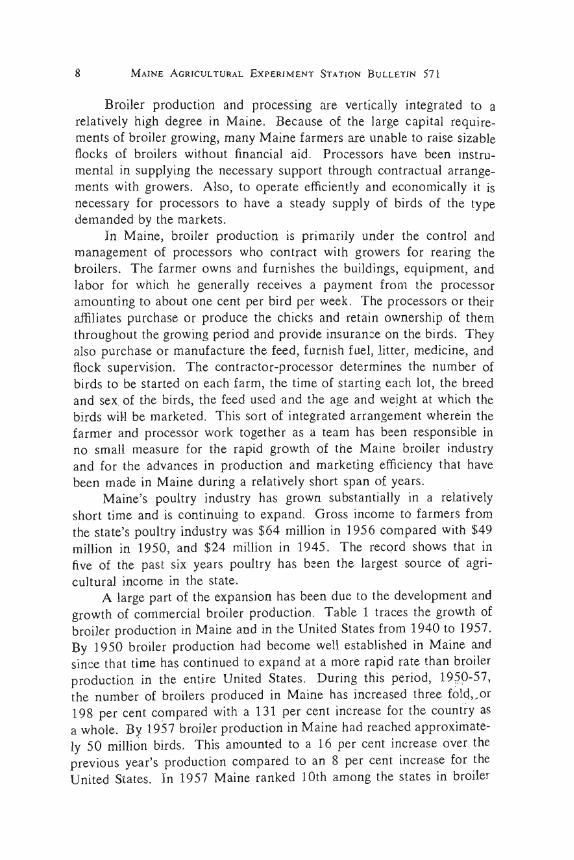
Broiler production and processing are vertically integrated to a relatively high degree in Maine. Because of the large capital requirements of broiler growing, many Maine farmers are unable to raise sizable flocks of broilers without financial 'aid. Processors have been instrumental in supplying the necessary support through contractual arrangements with growers. Also, to operate efficiently and economically it is necessary for processors to have a steady supply of birds of the type demanded by the markets.
In Maine, broiler production is primarily under the control and management of processors who contract with growers for rearing the broilers. The farmer owns and furnishes the buildings, equipment, and labor for which he generally receives a payment from the processor amounting to about one cent per bird per week . The processors or their affiliates purchase or produce the chicks and retain ownership of them throughout the growing period and provide insuran:::e on the birds. They also purchase or manufacture the feed, furnish fuel, litter, medicine, and flock supervision. The contractor-processor determines the number of birds to be started on each farm, the time of starting each lot, the breed and sex of the birds, the feed used and the age and weight at which the birds wilI be marketed. This sort of integrated arrangement wherein the farmer and processor work together as a team has been responsible in no small measure for the rapid growth of the Maine broiler industry and for the advances in production and marketing efficiency that have been made in Maine during a relatively short span of years.
Maine's poultry industry has grown substantially in a relatively short time and is continuing to expand. Gross income to farmers from the state's poultry industry was $64 million in 1956 compared with $49 million in 1950, and $24 million in 1945. The record shows that in five of the past six years poultry has been the largest source of agricultural income in the state.
A large part of the expansion has been due to the development and growth of commercial broiler production. Table 1 traces the growth of broiler production in Maine and in the United States from 1940 to 1957. By 1950 broiler production had become well established in Maine and since that time has continued to expand at a more rapid rate than broiler production in the entire United States. During this period, 19~0-57, the number of broilers produced in Maine has increased three fold"or 198 per cent compared with a 131 per cent increase for the country as a whole. By 1957 broiler production in Maine had reached approximately 50 million birds. This amounted to a 16 per cent increase over the previous year's production compared to an 8 per cent increase for the United States. In 1957 Maine ranked 10th among the states in broiler
TABLE l.
y r
1940 1945 1950 1957
1950 1951 1952 1953 1954 1955 1956 1957
CONTRACT BROILER GROWING IN MAINE 9
BROILER PRODUCTION IN MAINE AND THE UNITED STATES 1940-1957
~ production and produced 3.5 per cent of the broilers produced in the United States.
Equally impressive has been the increase in Maine's share of the New York market-the principal market for broilers produced in the East. Figure 1 shows the growth of Maine's broiler industry during recent years-both in production and in its share of the New York market. In 1950 Maine's share of the New York market was only 10 per cent. By 1956, Maine supplied 73.8 million pounds or 24 per cent of the processed poultry received at New York City, making Maine the city's largest single supplier of processed poultry. These figures become even more significant when one considers that Maine has been able to increase its share of the New York market and at the same time receive
BROILERS PRODUCED IN MAINE (1111.11 ions )
MAINE'S SHARE, N.Y. CITY PROCESSED POULTRY MARKET
24%
10 MAINE AGRICULTURAL EXPERIMENT STATION BULLETIN 571
a premium price for its broilers amounting to about 2 to 2Yz cents per pound above prices received for broilers produced in other sections of the country (table 2). Also, an in~reasing proportion of Maine's broiler production is finding its way into local markets within the state and in New England.
TABLE 2. UNER-BARRY PRICE QUOTATIONS, NEW YORK
Chickens : Eviscerated, 2 % lb., Maine and Other Sections, 1957
Month Maine Other sections Differential
cents per pound
January 32.7 31.0 1.7 February 34.3 32.3 2.0 March 35.0 32.5 2.5 April 34.0 31.8 2.2 May 34.6 32.1 2.5 June 37.0 34.4 2.6 July 38.2 36.0 2.2 August 37.2 34.4 2.8 September 33.2 31.0 2.2 October 31.3 29.0 2.3 November 31.2 28.2 3.0 December 30.8 27.1 3.7
Year average 34.1 31.7 2.4
The broiler area of Maine has experienced many significant changes in its -agriculture over the years, the most recent of which has been the change from a predominately dairy and general farming area to one of intense and specialized commercial broiler and hatching egg production. Broiler production in Maine is concentrated heavily in the south central part of the state (figure 2). Waldo county is considered the hub of the broiler industry. Surrounding counties of Kennebec, Penobscot, Somerset, Knox and Lincoln also contain a relatively heavy concentration of
TABLE 3 . LOCATION AND SIZE OF BROILER FARMS
790 Broiler Farms, Maine 1956
Average number Number Per cent County of birds per lot of farms of farms
12 MAINE AGRICULTURAL EXPERIMENT STATION BULLETIN 571
broiler farms. During recent years considerable expansion in broiler production has taken place in the southwestern part of the state in Androscoggin, Cumberland, York, and Oxford counties. The location and average size of some 790 broiler farms is shown in table 3. It is estimated there are somewhere in the vicinity of 1,100 broiler farms in Maine.
PROGRESS IN PRODUCTION EFFICIENCY
Along with the expansion that has taken place in the broiler industry, there have been substantial advances in production efficiency on Maine broiler farms. Broiler farm management and cost studies made in 1950, 1955 and again in, 1957 provide a basis for measuring the advances in production efficiency in commercial broiler growing operations. The series of charts in figure 3 show what has been happening on Maine broiler farms with regard to size of flock, number of lots raised per year, mortality, age and weight of birds when processed, feed conversion, point spread between weight and feed conversion, and production cost. The data shown in the charts are based on over 300 lots of broilers for each of the periods studied.
In the short span of seven years the average size of broiler flocks on Maine farms has increased from around 7,500 birds per lot in 1950 to about 12,000 in 1957. Along with the increase in size of flock, there has been a substantial increase in the number of lots raised per year. In 1950 an average of 2.5 lots were raised per year, while in 1957 an average of 4.0 lots were raised. At the same time production efficiency has shown marked improvement. For example, in 1950 it took nearly 14 weeks to grow a bird that weighed 3.9 pounds at market age with a 4.2 feed conversion. In 1957 broiler growers were raising a 3.6 pound bird in slightly over 10 weeks with an average feed conversion of 2.79. During this period mortality has been reduced nearly one-half, from 6.0 to 3.2 per cent. These improvements in efficiency have resulted in lower production costs per pound of meat in spite of rising costs of labor,
. buildings, equipment and supplies. In 1950 total production costs including labor and overhead averaged 26 cents per pound, whereas in 1957 the average cost of producing a pound of broiler was 20.4 cents. Recent developments in feeding, breeding, disease control and improved management practices occurring in the past few months (late 1957 and early 1958) make even these latter figures obsolete.
THE MAINE BROILER GROWER
With the exception of a very few independent broiler operations, broiler production in Maine is largely sponsored and supervised by
14 . MAINE AGRICULTURAL EXP ERIMENT STATION B ULLETIN 571
processor-contractors who retain ownership of the chicks throughout the growing period, pay for all production expenses, and make the management decisions. Although processing -and production are vertically integrated to a fairly high degree, the basic broiler production unit is the so called "family-type farm." The grower, generally, owns the buildings and equipment and furnishes the labor in carrying out the growing program under the supervision of the processor-contractor. Generally, the grower is paid either a flat-fee amounting to one cent per week per bird delivered or one-half cent per week per bird delivered and a share in the profits.
In 1955 personal interviews were held with some 88 Maine broiler growers, 58 of which were contract broiler growers and 30 independent broiler growers. Data were obtained concerning the growers' occupational status both past and present, age, methods of financing broiler buildings and equipment, capital invested in buildings and equipment, and labor and overhead costs for growing broilers . A financial statement was obtained from each grower. An attempt also was made to get an accurate impression of the grower's feelings and of his attitude toward his particular growing arrangement.
OCCUPATION
Seventy-nine per cent of the groNers included in the survey were full-time broiler producers. Another 10 per cent of the growers combined broiler raising with an off-the-farm job. Five per cent were combination broiler-dairy farmers and another 6 per cent combined broiler growing with other farm enterprises.
AGE
The average age of the broiler gtowers induded in the survey was 46 years. Twenty-seven per cent of the growers were under 40, 59 per cent were between 40 and 60, 'and 14 per cent were 60 or older.
PREVIOUS OCCUPATION
Nearly one-half (43 per cent) of the broiler growers in the survey 'were engaged in some type of non-farm work before going into broiler raising (table 4) . Many of them were factory workers, some had their own private businesses, some were "white collar" workers employed as
. clerks, bookkeepers and the like. The other 57 per cent were farmers of one kind or another previous to becoming broiler growers. Dairymen and egg producers make up ,a large share of this group.'
CONTRACT BROILER GROWING IN MAINE
TABLE 4. PREVIOUS OCCUPATIONS OF BROILER GROWERS
88 Growers, Maine, 1955
Buildings
Occupation before broilers
Dairy farmer Egg producer Crop a nd general farmer
Total farm background Factory worker Proprietor non-farm business Clerica l worker Miscellaneous non-farm jobs
Total non-farm work
Total
Per cent of growers
28 23 6
57 17 13 7 6
43
100
FINANCING BUILDINGS AND EQUIPMENT
15
Forty-three per cent of the 88 broiler growers started by remodeling a dairy barn. About an equal number (42 per cent) built a new broiler house, while 15 per cent of the growers obtained their first broiler house by purchasing a farm that had one on it.
In order to pay for the remodeling, construction, or purchase of their first broiler buildings, 46 per cent of the growers paid cash for the entire amount from their own savings. An equal number (46 per cent) supplemented their own funds with direct loans from various types of lenders. The remaining 8 per cent of the growers financed the remodeling or construction of their first broiler buildings through dealer credit, mostly lumber and hardware dealers. In general, those who built a new broiler house borrowed money, while those who remodeled more frequently paid cash.
Banks were the leading source of loans for construction or re-
TABLE 5. FINANCING CONSTRUCTION OR REMODELING OF BROILER HOUSES BY DIRECT BORROWING
39 Growers, Maine, 1955
Lender Number Average
of loans Cost of Amount Growers Loan Interest construction loaned equity' period [ate
. Farmers Home Adm. 4 7,000 2,250 4,750 15 4.5 Federal Land Bank 2 14,250 11,250 3,000 15 4.5
k & individual 3 15,167 7,667 7,500 6 5.8 Proc: rmers Home Adm. & bank 3 4,800 4,800 0 6 4.8 ,-' essor 2 4,350 3,700 650 4 6.0 ber Company 1 1,800 1,800 0 3 0
'fotal or average 39 $ 8,892 $5,785 $3,107 9 5.1 : ' . Grower' . , s eqUlty--cash down payment made by borrower.
16 MAINE AGRICULTURAL EXPERIMENT STATION BULLETIN 571
modeling of the first broiler houses (table 5). Indi viduals were the second most important source of borrowed funds . Other sources of loans were Farmers Home Administration, Federal Land Banks, poultry processors and lumber companies.
The average cost of construction or remodeling of first broiler houses for those growers who borrowed money was $8,892 (table 5). The average amount borrowed was $5 ,785 with the grower making up the difference of $3,107 from his own savings. The average loan period was 9 years and the interest rate ·averaged 5.1 per cent. The details of loans made by the various types of lenders can also be seen in table 5.
A mortgage on the farm or residence was given as security for loans by 58 per cent of growers who borrowed money in obtaining their first broiler bUildings. Other types of security given less frequently included mortgages on non-farm property, mortgages on the broiler houses and chattel mortgages on cattle. Some 14 per cent of the growers who borrowed money did not give any security at all.
Equipment
Sixty-five per cent of the growers financed the purchase of their original broiler equipment (feeders, waterers, brooders, etc.) by obtaining a cash loan. Another 23 per cent obtained dealer credit while 12 per cent of the growers paid cash for their equipment when they first started raising broilers.
Banks again were the most common source of loans for those growers who borrowed money to purchase their original equipment (table 6). Farmers Home Administration, individuals, and equipment dealers were other sources of equipment loans.
TABLE 6. FINANCING PURCHASE OF EQUIPMENT BY BORROWING
18 Growers, Maine, 1955
Lender Number Cost of Amount Growers Loan Interest of loans equipment loaned equity' period rate
Equipment dealer 2 2,750 Bank & individual 3 4,633 Farmers Home Adm. & bank 2 1,800 1,750 50 5 5.5
Total or average 18 $3,122 $2,394 $ 728 4 4.3 ----
* Grower'.g equity-cash down payment made by borrower.
The average cost of 'equipment for those growers who borrowed money to purchase their first equipment was $ 3,122 (table 6) . The average amount borrowed was $2,394 with the grower making up the difference of $728 from his own savings. The average loan period was 4
CONTRACT BROILER GROWING IN MAINE 17
years with the most common loan period being between 3 and 5 years. The average rate of interest charged was 4.3 per cent, although interest rates of between 5 and 6 per cent were most common.
A mortgage on the broiler house was given as security for equipment loans by 50 percent of the growers, and another 22 per cent gave both the broiler house and the equipment as security. Other types of security given for equipment loans included mortgages on non-farm property, mortgages on farms, and chattel mortgages on cattle. Four per cent of the growers who obtained equipment loans gave no security
at all. Dealer credit was also an important source of credit used by broiler
growers to finance the purchase of their first equipment. The most common sources of credit for purchase of equipment were retailers and wholesalers of poultry equipment. Forty-two per cent of the growers who used dealer credit obtained credit from these equipment men. Poultry processors for whom the growers were raising birds under contract extended credit to another 25 per cent. Feed dealers and lumber companies were other sources of dealer credit.
The amount of credit extended by dealers for equipment purchases was under $1,000 in 60 per cent of the cases. The credit period was indefinite in 50 per cent of the cases where equipment was purchased on dealer credit. Terms of between 6 and 9 months were commonly given as were terms of 3 to 5 months. In most instances there was no interest rate as such on credit advanced by equipment dealers. Rather the interest charge was included in the purchase price of the equipment. Where an interest charge was specified it was commonly 5 per cent.
Financing Expansion
Eighty-one per cent of the 88 broiler growers in the study stated they had expanded or improved their operations and facilities since tarting to raise broilers. The remaining 19 per cent had made no
changes. Nearly one-half (49 per cent) of the growers who had expanded or
improved their facilities did so by paying cash. Forty-one per cent borrowed money, mostly from banks, individuals and Farmers Home Administration, while 10 per cent financed their expansion by obtaining cuedit from lumber and equipment dealers, and processors.
The average cost of expansion was $5,126 and ranged from $300 up. to $25,000. Four-fifths of the growers had expansion costs that amounted to less than $5,000.
- Only 15 per cent of the growers indicated they had been refused a loan by a lending agency for financing the construction or purchase of a
18 MAINE AGRICULTURAL EXPERIMENT STATION BULLETIN 571
broiler house or the purchase of equipment. The loan refusals were equally distributed among the major lenders, and were largely made because of insufficient equity on the part of the grower.
CAPITAL INVESTED IN BUILDINGS AND EQUIPMENT
Capital invested in broiler buildings and equipment amounted to an average of $14,074 per farm or $1.20 per bird capacity (table 7). Broiler houses, the largest capital item, accounted for 71 per cent of the total investment in broiler buildings and equipment. The second largest capital item was brooding equipment which amounted to an average of 14 cents per bird. The average investment in feeders and waterers amounted to 11 cents per bird, while miscellaneous equipment used in connection with the broiler enterprise required an investment of 10 cents per bird.
TABLE 7. CAPITAL INVESTED IN BROILER BUILDINGS AND EQUIPMENT
88 Broiler Farms, Maine, 1955
Item
Broiler houses Heating system Feeders Waterers Other broiler equipment'
Total
Per farm
9,969 1,642
938 352
1,173
14,074
Investment
Per bird
Dollars
.85
.14
.08
.03
.10
1.20
* Includes feed bins, carriers, elevators and broiler share of auto, trucks, tractor, small tools, etc.
Table 8 compares the investment in remodeled barns with the investment in new type broiler ho~ses. The average investment in broiler buildings for those farms having remodeled barns was 78 cents per bird compared to 96 cents per bird for farms with broiler houses designed
TABLE 8. CAPITAL INVESTED IN BROILER HOUSES BY TYPE OF HOUSE
88 Broiler Farms, Maine, 1955
Average investment Type of house Number
of farms Per farm Per bird
Dollars
New construction 37 12, 740 .96 Remodeled barn 51 9,463 .78
Total or average 88 9,%9 .85
CONTRACT BROILER GROWING IN MAINE 19
and constructed specifically for raising broilers- a difference of 18 cents
per bird. Table 9 shows the average investment for various types of brooding
~y, terns. The 28 f~rms whi~h had ~entral hot water systems. had the largest investment m broodmg eqUlpment-20 cen~s per ?lfd . . For farms with individual brooder stoves-gas, coal, and oIl-the mvestment was considerably less, averaging between 7 and 9 cents per bird.
TABLE 9. CAPITAL INVESTED IN HEATING SYSTEMS
80 Broiler Farms, Maine, 1955
Average investment Type of Number
heating system of farms Per farm Per bird
Dollars
Central hot water 28 3,484 .20 Gas brooders 17 888 .08 Coal brooders 16 642 .07 Oil brooders 11 913 .09 Electric brooders 1 670 .11 Central hot air 1 2,000 .13 Combinations of above 6 1,847 .12
Total or average 80 1,698 .14
Capital invested in feeders for farms using various types of feeders is shown in table 10. Investment for farms using hanging-tube feeders was 7 cents per bird. Farms using trough feeders had the lowest investment-2 cents per bird; while farms with automatic feeders had an average investment in the units amounting to 17 cents per bird.
The contract grower's total cost of producing broilers in the period 1954-55 averaged 10.3 cents per bird delivered, or 2.9 cents .per pound fo r the items furnished by the grower, namely 1abor, buildings and equipme nt (table 11).
l!;abor costs (including the value of the operator's time as ' determined by the grower himself) accounted for 55 per cent of the contract
20 MAINE AGRICULTURAL EXPERIMENT STATION BULLETIN 571
TABLE 11. CONTRACT GROWERS' COSTS AND RETURNS IN PRODUCING BROILERS
Profits Total returns to labor Returns per hour of labor
1,326
62 761
$1.28
• Average size flock was 12,175 birds delivered per lot.
10.9
.6 6.3
3.0
.1 1.7
100
grower's total cost of producing broilers. The average cost of labor was 5.7 cents per bird delivered or 1.6 cents per pound. The average labor requirement was 47 hours per 1,000 birds delivered.
Building and equipment costs accounted for the remaining 45 per cent of the contract grower's total cost of producing broilers. Building and equipment costs averaged 4.6 cents per bird delivered or 1.3 cents per pound.
The average gross return to contract growers during the 1954-55 period was 10.9 cents per bird delivered or 3.0 cents per pound (table 11). Contract growers' gross returns in the form of payments from the processor-contractor during this period were generally at the rate of one cent per week per bird delivered.
The profits to contract growers during 1954-55 were $62 per lot, 0.6 cent per bird delivered, or 0.1 cent per pound (table 11). The total returns for labor averaged $761 per lot. The contract growers' returns per hour of labor averaged $1.28.
Contract broiler growers' overhead costs of producing broilers are itemized in table 12. Overhead costs are those costs associated with buildings and equipment furnished by the grower and include depreciation, interest on investment, repairs, taxes 'and insurance. In total these costs amounted to 4.6 cents per bird or 1.3 cents per pound.
One of the most important factors affecting contract . growers' costs of producing broilers is size of flock (table 13). The total contract growers' cost per pound for labor, buildings and equipment in raising the 12 smallest lots (averaging 3,117 birds) was 6.2 cents while the corresponding figure for the 29 largest lots (averaging 22,307 birds) was 2.9 cents, or a difference of 3.3 cents per pound of broilers delivered. The greatest reduction in costs occurred in lots larger than 10,000 birds.
CONTRACT BROILER GROWING IN MAINE 21
d 15 000 bird size there was little difference in labor and overhead Beyon , costs.
TABLE 12. CONTRACT GROWERS' OVERHEAD COSTS OF PRODUCING BROILERS
48 Farms, Maine, 1954-55
Item
Depreciation (buildings) (equipment)
Interest on investment @ 5%
Repairs (buildings) (equipment)
Taxes Insurance (buildings & equipment)
Total costs (per year) (per lot) (per bird) (per pound)
Annual cost
$ 464 493
704
199 164
211
155
$2,390 $ 598
4.6 cents 1.3 cents
TABLE 13. RELATIONSHIP OF SIZE OF LOT TO LABOR AND OVERHEAD COSTS
291 Lots of Broilers, Maine, 1954-55
Number started
Item Under 5,000- 10,000- 15,000- 20,000 5,000 9,999 14,999 19,999 and over
Number of lots 12 96 87 67 29 Number started per lot 3,117 6,988 12,107 16,933 22,307 Hours of labor per 1,000 birds 73 60 47 39 37
During recent years grower payment plans in Maine have undergone some major revisions. In general, the change has been from the fiat-rate payment of one cent a bird per week to a minimum guarantee of one-half cent per bird per week and a share in the profits. This change was an attempt to provide more incentive to the grower to reduce production costs, give the grower a chance to benefit from favorable market prices and at the same time guarantee him against a severe financial loss.
A more recent study of contract broiler growing in Maine involving 317 lots of broilers marketed during the 12-month period from July 1, 1956 to June 30, 1957 shows that contract growers received a gross r~turn which averaged 0.9 cent per week per bird delivered (table 14) . Twenty-eight per cent of the lots brought an average return of .51 cent
22 MAINE AGRICULTURAL EXPERIMENT STATION BULLETIN 571
per bird per week while 13 per cent of the lots brought average returns of 1.21 cents per bird per week. The most frequent amount paid growers was between the relatively narrow range of 0.9 to 1.0 cent per bird per week. The farm price of broilers during this 1956-57 period averaged 19 cents per pound and ranged from 16 to 22 cents per pound.
TABLE 14. CONTRACT GROWERS' GROSS RETURNS
317 Lots of Broilers, Maine, 1956-57
Gross return (cents per bird per week) Number sold Per cent
per lot of lots Range Average
.5-.6 .51 13,090 26
.7-.8 .85 11,711 8
.9-1.0 1.00 10,549 53 1.1 and Over 1.21 11,091 13
All lots .90 11 ,564 100
FINANCIAL CONDITION OF GROWERS
A financial statement was obtained from 54 contract broiler growers included in the survey. In August 1955 the average net worth of contract growers was $21,692 (table 15). Total assets of contract growers averaged $26,679 and total liabilities amounted to an average of $4,987.
TABLE 15. FINANCIAL STATEMENT
54 Contract Broiler Growers, Maine, 1955
Assets Liabilities
Land and buildings other Real estate mortgages than broiler houses $ 8,806 Notes, chattels, open
Broiler houses 9,85 1 accounts, etc . Broiler equipment 2,787 Farm machinery and equipment 2,512 TOTAL LIABILITIES Broilers 0 Livestock 697 Proprietorship Crops and supplies 297 Non-farm property' 1,729 Net worth
---TOTAL ASSETS $26,679 TOTAL
$ 4,045
942
$ 4,987
$21,692
$26,679
* Non-farm property includes other real estate, notes and accounts receivable, cash, bank deposits, bonds, etc.
There was a wide range in net worths among the broiler growers included in the study (table 16). Thirteen per cent of the growers had net worths that averaged $5,513 while 7 per cent of the growers had net worths averaging $55,042. Forty-five per cent of the growers had net worths within the relatively narrow range of $10,000 to $20,000. As would be expected, there was a direct relationship between net worth and size of lot raised, with the larger size growers having the more favorable net worth positions.
CONTRACT BROILER GROWING IN MAINE
TABLE 16. NET WORTH
54 Contract Broiler Growers, Maine, 1955
Net worth (dollars) Number of
Range Average birds per lot
Under 10,000 5,513 9,229 10,000 - 19,999 14,971 11,296 20,000 - 29,999 25,341 14,092 30,000 - 39,999 36,163 17,943 40,000 and over 55,042 16,950
All growers 21,692 12,930
Per cent of lots
13 45 22 13 7
100
GROWER'S SATISFACTION WITH GROWING ARRANGEMENT
23
Growers were generally satisfied with their arrangements for growing broilers and their particular payment plans (table 17). Of the 33 contract growers who were raising broilers under a flat-fee payment plan, 94 percent expressed satisfaction with the arrangement. A few sad , however, that they would like to receive larger guarantee payments. Ninety-one per cent of the growers who were raising broilers under incentive or profit sharing plans with a minimum guarantee said they were satisfied with this arrangement. A few expressed dissatisfaction, however, in the method used to determine profits .under this arrangement and felt they would be better off with a flat-fee payment. All of the independent growers indicated satisfaction with their production and marketing arrangements.
TABLE 17. EXTENT OF SATISFACTION WITH PRESENT GROWING ARRANGEMENT
88 Broiler Growers, Maine, 1955
Contract sys tem
Minimum guarantee Independent Flat-fee payment with share in protits system
(33 growers) (25 growers) (30 growers)
Per cent of growers
Satistied 94 91 100 Not satistied 6 9
Total 100 100 100
Contract growers were asked if they would like to raise broilers on an independent basis if they could obtain the financing. Most of the growers indicated they would not (table 18). It should be pointed out that this question was asked in 1955 when broiler prices were higher than they are now (1957-58) making it more profitable at that time to be an
24 MAINE AGRICULTURAL EXPERIMENT STATION BULLETIN 571
independent grower. At current levels of broiler prices very few, if any, contract growers would prefer to grow broilers independently.2
TABLE 18. WOULD YOU LIKE TO BECOME AN INDEPENDENT BROILER GROWER IF YOU
COULD OBTAIN THE FINANCING?
58 Contract Growers, Maine, 1955
Response Flat-fee
payment Minimum guarantee with share in profits
Yes No
Total
20 80
100
Per cent of growers
36 64
100
The reasons given by contract growers as to why they would rather not produce broilers on an independent basis are shown in table 19. Practically all of their reasons in one way or another relate to the element of risk involved in producing broilers independently. Broiler growers in Maine apparently are willing to relinquish some of their freedom of decision in order to enjoy the income security -afforded them by their arrangements with processors.
TABLE 19. REASONS WHY CONTRACT BROILER GROWERS WOULD RATHER NOT PRODUCE BROILERS
ON INDEPENDENT BASIS
42 Contract Growers, Maine, 1955
Reasons
Too risky due to fluctuation in broiler 'prices Too risky for small operator with limited capital Too risky for man my age Investment and costs high in relation to returns Have no money to gamble with Other reasons
Total
Per cent of reasons
43 32
8 8 5 4
100
The few independent broiler growers in Maine usually have very little difficulty in finding a market for their birds (table 20). In fact, the contractor-processors in Maine generally like to buy independent lots and are competitive in bidding for the better lots for which they commonly pay 5 to 6 cents under the New York dressed quotation. The few independent growers who had experienced difficulty in finding a buyer for their birds indicated it was during the Thanksgiving and Christmas holiday season when the demand for broilers was weak.
2 Social and Economic Implications of Vertical Integration in the Broiler Industry, Maine Agricultural Experiment Station, Unpublished data, L. A. Ploch and R. F . Saunders.
CONTRACT BROILER GROWING IN MAINE
TABLE 20, HAVE YOU, AS AN INDEPENDENT GROWER, EVER EXPERIENCED ANY DIFFICULTY IN FINDING
A MARKET FOR YOUR BIRDS?
30 Independent Growers, Maine, 1955
Response
Yes No
Total
Per cent of growers
17 83
100
MANAGEMENT PRACTICES
25
In Maine, most of the management decisions regarding broiler production practices are made by contractor-processors who employ flock supervisors to see that prescribed management practices are carried out by the grower, The contractor-processor determines the number of birds to be started on each farm, the time of starting each lot, the breed and sex of birds, the feed used, the feeding and disease control programs, and the age and weight at which the birds will be marketed.
During the summer of 1957 production data were obtained on some 300 contract lots of broilers marketed during the period July 1, 1956 to June ' 3~, 1957. Information was secured on the number of broilers raised. month started, mortality, feed conversion, age and weight when processed, labOr efficiency and total production costs.
SIZE OF BROILER FARMS
The average capacity of 614 Maine contr'act broiler farms in 1956 was 11,060 birds (table 21). Fifteen per cent of the farms had a capacity of less than 5,000 birds. Another 34 per cent had capacity for between 5;000 and 10,000 broilers, while 29 ,per cent were between 10,000 and
26 MAINE AGRICULTURAL EXPERIMENT STATION BULLETIN 571
15,000 bird size. Twelve per cent of the farms had space for between 15,000 and 20,000 broilers and 10 per cent were over 20,000 bird size.
MONTH STARTED
Of 317 lots of broilers started during the 1956-57 period studied 38 lots, or 12 per cent of the total, were started in May (table 22) . The second most important month was April. -.Eight per cent of the 317 lots were started in each of the other months, with the exception of September and October when 7 per cent and 6 per cent of the lots were started, respectively.
The proportion of the lots started in each season of the year was as follows: 31 per cent were started in the spring, 24 per cent were started in the winter, 24 per cent were started in the summer, and 21 per cent were started in the fall.
TABLE 22. MONTH STARTED
317 Lots of Broilers, Maine, 1956-57
Month Number Per cent of Month Number Per cent of started of lots all lots started of lots all lots
January 26 8 August 24 8 February 25 8 September 22 7 M arch 25 8 October 21 6 April 34 II November 25 8 May 38 12 December 26 8 June 26 8 July 25 8 All lots 317 100
MORTALITY
The average rate of mortality was 3.2 per cent (table 23). The lots having the lowest rate of mortality averaged 0.4 per cent while those with the highest rate of mortality averaged 10.3 per cent.
The most frequent causes of mortality according to the survey were the respiratory diseases. Forty-seven per cent of the lots had experienced trouble with respiratory diseases (table 24). The respiratory diseases referred to in the survey included chronic respiratory disease, bronchitis, air-sac infection and Newcastle disease.
TABLE 24. CAUSES OF MORTALITY
303 Lots of Broilers, Maine, 1956-57
Causes of mortality
Respiratory diseases· Coccidiosis Weak chicks Over heating or chilling Other·· Unknown
Number of lots
141 38 34 31 65 45
Per <:ent of all lots
47 13 11 10 21 14
• Includes respiratory, bronchitis, Newcastle, air-sac infection . •• Includes leukosis, tremors, enteritis, debeaking, capetting and
vaccination complex.
Coccidiosis was a cause of mortality in 13 per cent of all lots, weak chicks were a cause of mortality in 11 per cent of all lots, and over-
• heating or chilling were a cause of mortality in 10 per cent of all lots. Growers ~Ld not give any specific cause for mortality in 14 per cent of all lots. '
FEED CONVERSION
1be average feed conversion was 2.79 pounds of feed per pound of t (table 25). The 5 per cent of the lots which had the best feed conversion averaged 2.27 . The 7 per cent having the poorest feed conversio averaged 3.5 3. Fifty-two per cent of the lots had feed conversioDs i the relati,vely Darrow range between 2.6 and 2.9.
28 MAINE AGRICULTURAL EXPERIMENT STATION BULLETIN 571
AGE WHEN PROCESSED
The average age of the broilers when delivered to the processing plant was 10.6 weeks (table 26). The youngest lots were marketed at an average of 8.6 weeks while the oldest lots were marketed at an average of 12.6 weeks of age. The I!lost common age at which the birds were marketed was 10 to 11 weeks.
TABLE 26. AGE WHEN PROCESSED
317 Lots of Broilers, Maine, 1956-57
Age when sold (weeks)
Range
Under 9.0 9.0 - 9.9
10.0 - 10.9 11.0 - 11.9 12.0 and over
Average Number sold
per lot
8.6 13,807 9.6 11,769
10.3 10,964 11.1 12,668 12.6 9,198
----------------------------All lots 10.6 11 ,564
WEIGHT WHEN PROCESSED
Per cent of lots
1 18 48 23 10
100
The average weight per bird sold or delivered was 3.62 pounds (table 27). Four per cent of the lots were marketed at an average weight of 2.87 pounds per bird, while 7 per cent were marketed at an average weight of 4.75 pounds per bird. The most common weight at which birds were marketed was 3.50 to 3.75 pounds.
TABLE 27 . WEIGHT WHEN PROCESSED
317 Lots ' of Broilers, Maine, 1956-57
Weight per bird sold (pounds) Number sold Per cent
The average point spread (average weight per bird minus feed conversion) was 83 points (table 28). Three per cent of the lots had an average point spread of -36 points while six per cent had an average point spread of 157 points. The most common point spreads were between 80 and 100 points.
100 - 119 108 1l,816 120 - 139 127 12,009 140 and over 157 9,816
All lots 83 1t ,564
LABOR EFFICIENCY
Per cent of lots
3 3 6
II 21 27 17 6 6
100
29
An average of 48 man hours of labor per 1,000 birds was required to raise a lot of broilers (table 29). This includes time spent by the operator, family and hired help in doing all the jobs that are necessary in raising a lot of broilers-cleaning and preparing the house between lots, feeding, tending brooder stoves, cleaning waterers, stirring feed and litter, adjusting windows, feeders and waterers, routine checking on the birds, repairing and maintaining buildings and equipment, ordering supplies and keeping records. The most efficient lots in terms of labor required an average of only 25 hours of labor per 1,000 birds while the lots having the least efficient use of labor needed 79 hours per 1,000 birds. As would be expected, there was a direct relationship between man hours of labor required per 1,000 birds and size of lot raised, with the larger growers making more efficient use of labor. With more Maine growers installing facilities for handling bulk feed, the labor requirements for raising broilers are being further reduced.
One hundred lots raised in remodeled barns were selected for comparison with 100 lots of comparable size raised in buildings designed and constructed primarily for broilers. The total' labor requirement in
30 MAINE AGRICULTURAL EXPERIMENT STATION BULLETIN 571
terms of hours per 1,000 birds was 53 hours for lots raised in remodeled barns, and 48 hours for lots raised in houses constructed specifically for raising broilers (table 30).
TABLE 30. RELATIONSHIP BETWEEN TYPE OF HOUSE AND LABOR EFFICIENCY
200 Lots of Broilers, Approximately Matched for Size of Flock Maine, 1956-57
Item
Number of lots Number sold per lot Hours of labor per 1,000 birds
Type of house
Remodeled barn
100 11 ,929
53
Broiler house
100 11,934
48
Fifty lots grown with automatic feeders were selected for comparison with 50 lots of comparable size having hanging feeders and with 50 lots on trough feeders. The total labor requirement in terms of hours per 1,000 birds was 42 hours for the lots having automatic feeders, 44 hours for lots having hanging feeders and 46 hours for lots having trough feeders (table 31).
TABLE 31. RELATIONSHIP BETWEEN TYPE OF FEEDERS USED AND LABOR EFFICIENCY
150 Lots of Broilers, Approximately Matched for Size of Flock Maine, 1956-57
Item
Number of lots Number sold per lot Hours of labor per 1,000 birds
Trough
50 13,044
46
Type of feeder used
Hanging
50 13,109
44
Automatic
50 13,182
42
PRODUCTION COSTS
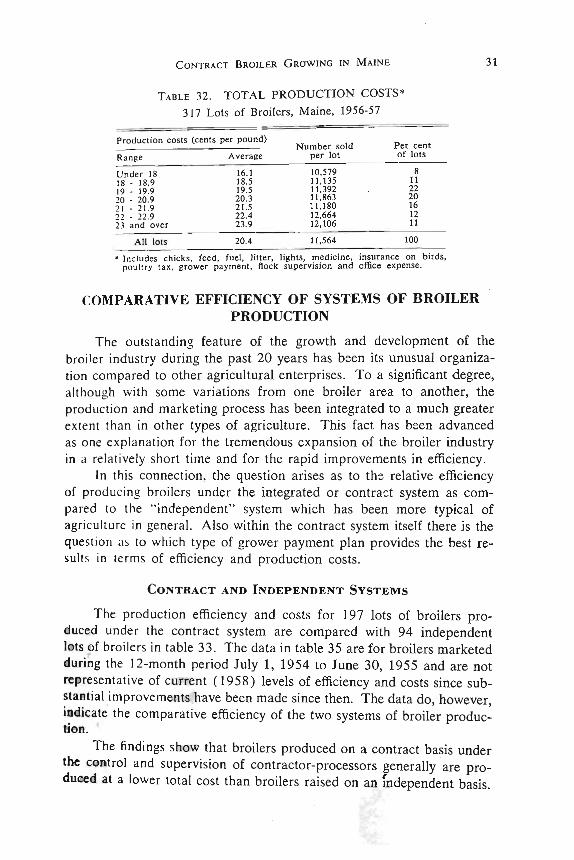
The average total cost of producing broilers for 317 lots studied in 1956-57 was 20.4 cents per pound (table 32). The 8 per cent of the lots having the lowest production cost averaged 16.1 cents per pound of broiler delivered. The 11 per cent having the highest cost ·averaged 23.9 cents per pound of broiler delivered. Forty-two per cent of the lots had production costs in the range between 19 and 21 cents per pound.
CONTRACT BROILER GROWING IN MAINE
TABLE 32. TOTAL PRODUCTION COSTS*
317 Lots of Broilers, Maine, 1956-57
Production costs (cents per pound) Number sold Per cent
• Includes chicks, feed , fuel , litter, lights, medicine, insurance on birds, pou ltry tax , grower payment, flock supervision and office expense.
COMPARATIVE EFFICIENCY OF SYSTEMS OF BROILER PRODUCTION
31
The outstanding feature of the growth and development of the broi ler industry during the past 20 years has been its unusual organization compared to other agricultural enterprises. To a significant degree, although with some variations from one broiler area to another, the production and marketing process has been integrated to a much greater extent than in other types of agriculture. This fact has been advanced as one explanation for the tremendous expansion of the broiler industry in a relati vely short time and for the rapid improvements in efficiency.
In this connection, the question arises as to the relative efficiency - of producing broilers under the integrated or contrast system as com".pared to the " independent" system which has been more typical of
'!gr,icultu re in general. Also within the contract system itself there is the question as to which type of grower payment plan provides the best results in terms of efficiency and production costs.
CONTRACT AND INDEPENDENT SYSTEMS
The production efficiency and costs for 197 lots of broilers produced under the contract system are compared with 94 independent lots of broilers in table 33. The data in table 35 are for broilers marketed durihg the 12-month period July 1, 1954 to June 30, 1955 and are not repre'sentative of current (1958) levels of efficiency and costs since substantial improvements have been made since then. The data do however indicate' the comparative efficiency of the two systems of broil;r produc~ lion. <
The findings show that broilers produced on a contract basis under the control and supervision of contractor-processors generally are produced at a lower total cost than broilers raised on an fndependent basis.
32 MAINE AGRICULTURAL EXPERIMENT STATION BULLETIN 571
TABLE 33 . COMPARATIVE EFFICIENCY OF TWO SYSTEMS OF BROILER GROWING
Maine, 1955
System Item
Contract Independent
Number of farms 58 30 Number of lots 197 94 Number started per lot 12,651 11,181 Per cent mortality 3.7 3.9 Age at sale, weeks 10.9 10.9 Weight at sale, pounds 3.61 3.38 Feed conversion, Ibs. feed / lb. meat 2.97 3.02 Point spread 64 36 Hours of labor per 1,000 birds 47 49 Investment (bldgs. & equip.), dollars per bird 1.12 1.36 --------------------~--------------
Cents per pound of broiler
Production costs: Feed 14.7 15.2 Chicks 3.5 4.2 Labor 3.0' 2.1 Buildings & equipment 1.6 Flock supervision .6 Fuel & electricity .7 .7 Litter .3 .2 Medicine •• .2 All other .1 .2
Total costs 22.9 24.4
• Grower paymen., commonly one cent per week per bird delivered . •• Less than .05 cent.
Moreover, contract broiler lots generally are more uniform in size and quality than are independent lots. Total cost of production including the grower payment and supervision for the contract lots averaged 22.9 cents per pound compared to a 24.4 cents per pound average for independent lots, a difference of 1.5 cents per pound.
Several factors may account for this difference. The more favorable weights and feed conversions in contract lots are probably the result of superior technical knowledge, management and supervision employed by the relatively large vertically integrated broiler operations. Also there are certain economies associated with large volume purchasing of feed, chicks and supplies that the larger integrated operations may be able to take advantage of more readily than smaller independent growers.
One of the alleged weaknesses of the contract system has been that it provides little incentive for the grower to do a good job in caring for the birds. This weakness has evidently been overcome to a considerable extent in Maine through the application of good management and close supervision on the part of contractor-processors, incentive and profit sharing arrangements, and the likelihood of being ~ropped if satisfactory performance is not attained.
CONTRACT BROILER GROWING IN MAINE 33
FLAT-FEE AND PROFIT SHARING PLANS
Within the contract system there is the question as to which type of grower payment plan provides the best results in terms of efficiency and production costs, In table 34, 125 contract lots of broilers marketed during the period July 1, 1956 to June 30, 1957, for which the grower .received a flat-rate payment amounting to approximately one cent per bird per week, are compared with 101 contract broiler lots marketed during the same 12-month period for which the grower received a mini\Il1um guarantee of 1/2 cent per bird per week plus a share in the profits.
The findings show that broilers grown under profit sharing or incentive plans with minimum guarantees are generally produced at a lower cost than broilers grown under flat-fee grower payment plans. There was a difference of 1.4 cents per pound in the total production cost of birds raised under the flat-fee plan and under an incentive plan. Lots of the former averaged 21.4 cents per pound and lots raised under incentive or profit sharing arrangements averaged 20.1 cents a pound. In both cases the payment made to the grower by the contractor was included.
TABLE 34. COMPARATIVE EFFICIENCY OF TWO TYPES OF GROWER PAYMENT PLANS
226 Contract Lots of Broilers, Maine, 1956-57
Item
Number of lots Number of birds per lot Per cent mortality Age, weeks Weight, pounds Feed conversion, lbs. feed / lb. meat Point spread Total production costs, cents/ lb. Grower pa yment:
Cents per pound Cents per bird per week
Flat-fee
125 11,292
3.2 10.7 3.67 2.88
79 21.4
2.7 .94
Grower payment plan
Minimum guarantee with share in profits or bonus
101 12,515
3.4 10.4 3.65 2.71
94 20.1
2.3 .82
Part of the difference in production costs is due to the difference 10 the amount of the grower payment which averaged 2.7 cents per pound for flat-fee lots and 2.3 cents per pound for profit sharing lots, a difference of .4 cents per pound. The remaining difference of about one cent is due largely to the better average feed efficiency of profit sharing lots. It would appear then that profit sharing plans with minimum guarantees do provide more incentive to contract growers to reduce production costs than do plans that offer growers a flat-rate payment per bird.
34 MAINE AGRICULTURAL EXPERIMENT STATION BULLETIN 571
FACTORS AFFECTING PRODUCTION COSTS
The factors primarily affecting costs are size of lot, feed conversion, labor efficiency, and rate of mortality.
The averages of the production factors for 291 lots of broilers marketed during the period July 1, 1954 to June 30, 1955, are summarized in table 35 and may be referred to when interpreting the production factors of the various groupings shown in the t'ables throughout the remainder of the report. It should be understood that since 1955 production costs have been redu-ced substantially, therefore the data in the following tables do not reflect current levels of efficiency and costs. The analysis does, however, serve to show the effect of various production factors on costs of producing broilers.
TABLE 35. SELECTED PRODUCTION FACTORS
291 Lots of Broilers, Maine, 1954-55
Number of farms Number of lots Number started per lot Per cent mortality Age when processed, weeks Weight when processed, pounds Pounds of feed per pound of meat Hours of labor per 1,000 birds
SIZE OF LOT
88 291
12,176 3.8
10.6 3.54 2.99
48
One of the most important factors affecting costs and profits in the broiler enterprise is the number of birds started (table 36).
TABLE 36. RELATIONSHIP OF THE NUMBER OF BROILERS STARTED TO COST PER POUND OF BROILER DELIVERED
291 Lots of Broilers, Maine, 1954-55
Number started
Item Under 5,000- 10,000- 15,000- 20,000 5,000 9,999 14,999 19,999 and over
Number of lots 12 96 87 67 29 Number started per lot 3,117 6,988 12,107 16,933 22,307 Per cent mortality 3.8 3.6 3.7 4.2 3.6 Age when processed, weeks 11.1 11.0 11.0 10,9 10.6 Weight when processed, pounds 3.5 3.6 3.6 3.5 3.4 Pounds of feed per pound of meat 2.97 2.99 3.02 2.97 2.92 Hours of labor per 1,000 birds 73 60 47 39 37
The total cost per pound of broiler delivered for the 12 smallest lots (averaging 3,117 birds) was 26.8 cents while the corresponding fioure for the 29 largest lots (averaging 22,307 birds) was 21.7 cents, or
t:> a difference of 5.1 cents per pound. Most of this difference in costs can be accounted for by the reduction in costs of labor and buildings as the size of the lot increased. The cost of labor decreased from 2.7 cents per pound of broiler sold for the 12 small lots to 1.5 cents per pound for the 29 large lots, a difference in costs of labor of 1.2 cents per pound The costs of buildings and equipment decreased from 3.5 cents per pound for the small lots to 1.4 cents per pound for the large lots. Approximately 65 per cent of the 5.1 cents difference in total costs in favor of the large lots can be attributed to savings in labor, building and equipment costs.
FEED CONVERSION
The conversion of feed into meat is one of the important production factors as far as the broiler producer is concerned. Since the cost of feed amounted to over 60 per cent of the total cost of producing a pound of broiler meat, costs vary directly with this production factor.
The age when processed, weight wht:m processed and rate of mortality are closely associated with feed efficiency and must be taken into account when considering the effects of feed efficiency on costs. As feed efficiency decreased, the age and weight when processed and rate of mortality increased.
The difference in total costs between lots having the most efficient
TABLE 37. RELATIONSHIP OF POUNDS OF FEED USED PER POUND OF MEAT TO COSTS PER POUND OF BROILER DELIVERED
291 Lots of Broilers, Maine, 1954-55
Pounds of feed used per pound of meat
Item Under 2.7- 3.0- 3.3 and 2.7 2.9 3.2 over
N umber of lots 23 134 83 49 N umber started per lot 10,483 12,457 12,802 11,431 Per cent mortality 2.7 2.5 4.5' 6.4 Age when processed, weeks 9.9 10.3 11.3 12.4 Weight when processed, pounds 3.3 3.4 3.5 4.0 Pounds of feed per pound of meat 2.58 2.81 3.09 3.48 Hours of labor per 1,000 birds 48 47 46 55
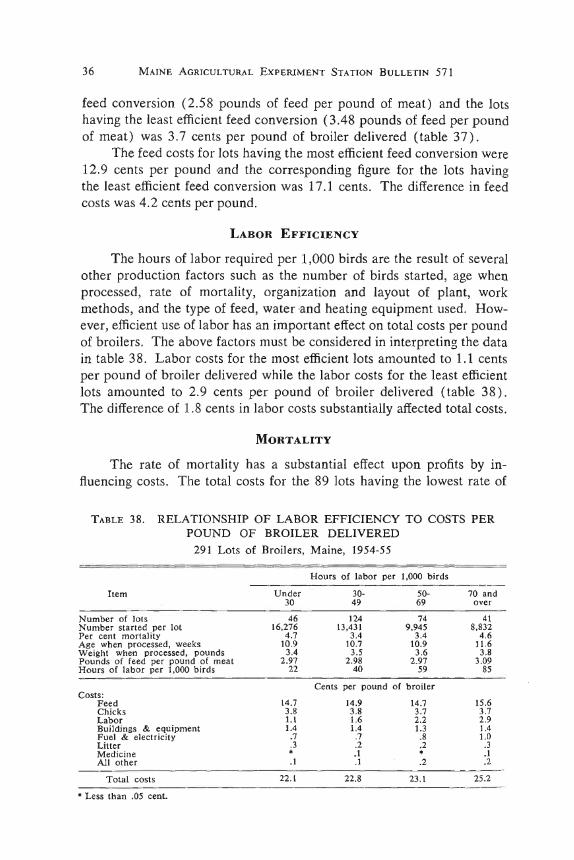
36 MAINE AGRICULTURAL EXPERIMENT STATION BULLETIN 571
feed conversion (2.58 pounds of feed per pound of meat) and the lots having the least efficient feed conversion (3.48 pounds of feed per pound of meat) was 3.7 cents per pound of broiler delivered (table 37).
The feed costs for lots having the most efficient feed conversion were 12.9 cents per pound 'and the corresponding figure for the lots having the least efficient feed conversion was 17.1 cents. The difference in feed costs was 4.2 cents per pound.
LABOR EFFICIENCY
The hours of labor required per 1,000 birds are the result of several other production factors such as the number of birds started, age when processed, rate of mortality, organization and layout of plant, work methods, and the type of feed, water ·and heating equipment used. However, efficient use of labor has an important effect on total costs per pound of broilers. The above factors must be considered in interpreting the data in table 38. Labor costs for the most efficient lots amounted to 1.1 cents per pound of broiler delivered while the labor costs for the least efficient lots amounted to 2.9 cents per pound of broiler delivered (table 38). The difference of 1.8 cents in labor costs substantially affected total costs.
MORTALITY
The rate of mortality has a substantial effect upon profits by influencing costs. The total costs for the 89 lots having the lowest rate of
TABLE 38. RELATIONSHIP OF LABOR EFFICIENCY TO COSTS PER POUND OF BROILER DELIVERED
291 Lots of Broilers, Maine, 1954-55
Hours of labor per 1,000 birds
Item Under 30- 50-30 49 69
Number of lots 46 124 74 Number started per lot 16,276 13.431 9,945 Per cent mortality 4.7 3.4 3.4 Age when processed, weeks 10.9 10.7 10.9 Weight when processed, pounds 3.4 3.5 3.6 Pounds of feed per pound of meat 2.97 2.98 2.97 Hours of labor per 1,000 birds 22 40 59
1· 22 2 cents per pound of broiler delivered compared to morta Ity were . . ( bl 39) f th 53 lots having the highest rate of mortahty ta e . 24 5 cents or e '.
Tb~ higher total costs for the lots having the hIghest rate of mort.~hty d . '1 by the increased feed costs due to less efficIent were cause pnman y
fee<l conversion.
TABLE 39. RELATIONSHIP OF PER CENT MORTALITY TO COSTS PER POUND OF BROILER DELIVERED
291 Lots of Broilers, Maine, 1954-55
I tem
Number of lots . 'Number statted per lot .Per cenl mortaJily A Ie when processed, weeks Weidlt wben /rocessed, pounds Pounds of f.~ per pound of meat Hours of labor Per 1,000 birds - '-'-.
Coso : :' F~d · Chicb
L iibor Bu ildin!!, '" equipment Fud .t e le<:lrid ty LiI1 ~ r Medi c in e--A ll OIbe r ._
T OIa l cOots
• t... Ill u . O~ ceot.
Under 2
89 11,334
1.1 10.4 3.4
2.86 49
14.3 3.8 1.9 1.4 .6 .2 .
22 .2
Per cent mortality
2.0-2.9
4.0-5.9
. 92 55 12,542 12,404
2.8 4.7 10.9 11.0 3.5 3.5
2.93 3.04 49 46
Cents per pound of broiler
14.7 15.2 3.7 3.8 1.9 1.9 1.5 1.4
.6 .8
.2 .2 .1 .1 .2 .1
22.9 23 .5
COMBINATION OF FACTORS
6 .and over
53 12,987
9.0 11.6 3.7
3.24 48
15.9 3.7 1.8 1.4 1.1 .2 .1 .3
24.5
It has been showt;J that the number of chicks started, rate of mor-tality, t efficiency and labor efficiency have a substantial effect upon
Dcing bro ilers.
Total ts decreased from 25 .0 ~ents per pound of broiler delivered f r the lots that were-above average fn none of these factors to 21 .2 cents , . per und for the lo!S that were above average In all four bctors (table 40) . This is a difference of 3.8 cents per pound in total costs.
Feed costs d<:c reased from 16.3 cents per pound for lots that were above average in :·none of these faotors to 14.0 cents per pound for the lots that were above average in ·all four factors. This is a difference of 2.3 cents per pound in feed costs.
There was .-also a 1.1 cents per pound difference in labor costs in favor of tbe lots above average in all four factors .
38 MAINE AGRICULTURAL EXPERIMENT STATION BULLETIN 571
TABLE 40. RELATIONSHIP OF NUMBER OF FACTORS ABOVE AVERAGE TO COST PER POUND OF BROILER DELIVERED
291 Lots of Broilers, Maine, 1954-55
Number of factors above average Item ._--
None One Two Three Four
Number of lots 27 52 106 64 40 Factors considered
Number started per lot 7,819 10,087 11,424 13,606 17,920 Per cent mortality 7.0 5.1 3.8 2.4 2.0 Pounds of feed per pound
of meat 3.39 3.07 3.00 2.86 2.78 Hours of labor per 1,000 birds 73 59 45 44 32
Other factors Age when processed, weeks 12.1 11.3 10.9 10.4 10.4 Weight when processed, pounds 4.1 3.6 3.5 3.4 3.4