BAB 5: PENGUKURAN, KESAHAN DAN KEBOLEHPERCAYAAN ” Dr. Ferlis Bin Bullare @ Bahari Head (Senior Lecturer) Psychology and Social Health Research Unit Faculty of Psychology and Education Tel : 016 520 2070 E-mel : [email protected]; [email protected]Facebook : Ferlis Bahari Research Method in Education (TT60104)
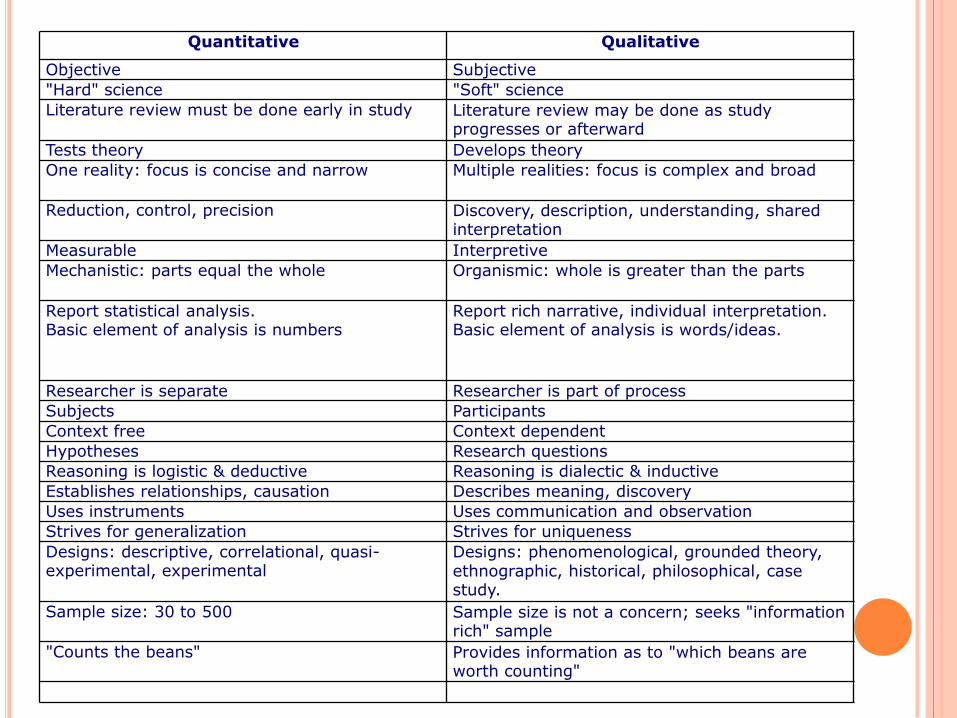
Designs: phenomenological, grounded theory, ethnographic, historical, philosophical, case study.
Sample size: 30 to 500 Sample size is not a concern; seeks "information rich" sample
"Counts the beans" Provides information as to "which beans are worth counting"
FACTOR ANALYSIS
The purpose of using factor analysis is to 1)
summarize patterns of correlations among observed
variables, 2) to reduce a large number of observed
variables to a smaller numbers of factors, and to 3)
provide an operational definition (a regression
equation) for an underlying process by using observed
variables, or 4) to test a theory about the nature of
underlying processes (Tabachnick & Fidell, 2007, p. 608).
Factor analysis can also be used to reduce a large
number of related variables to a more manageable
number, prior to using them in other analyses such as
multiple regression or multivariate analysis of
variance (Pallant, 2005).
EXPLORATORY VS. CONFIRMATORY
FACTOR ANALYSIS
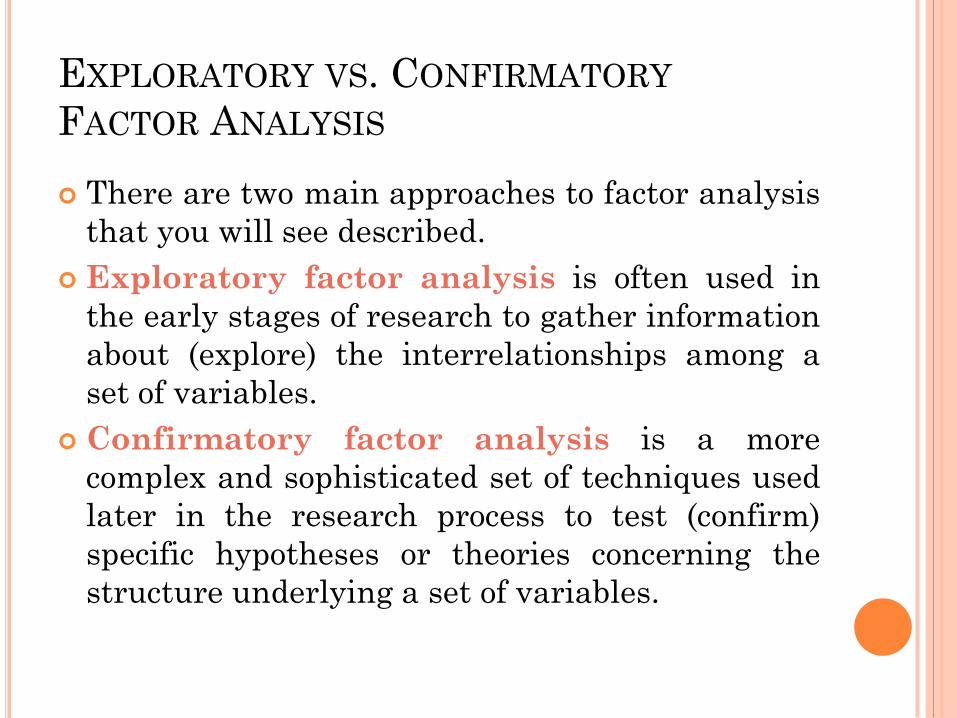
There are two main approaches to factor analysis
that you will see described.
Exploratory factor analysis is often used in
the early stages of research to gather information
about (explore) the interrelationships among a
set of variables.
Confirmatory factor analysis is a more
complex and sophisticated set of techniques used
later in the research process to test (confirm)
specific hypotheses or theories concerning the
structure underlying a set of variables.
APPROPRIATENESS OF FACTOR ANALYSIS
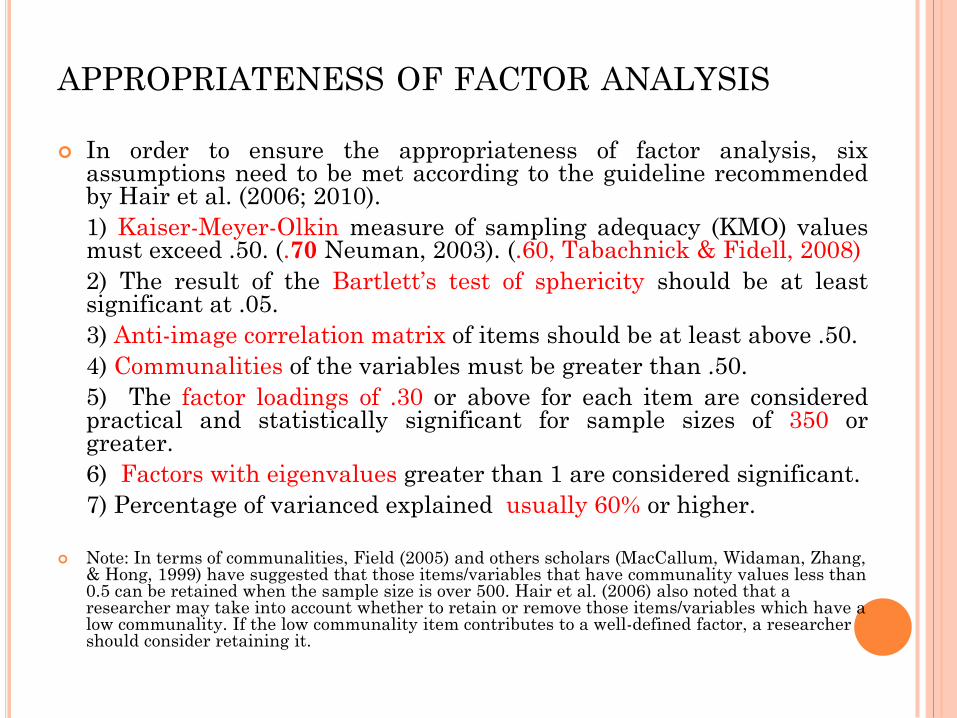
In order to ensure the appropriateness of factor analysis, sixassumptions need to be met according to the guideline recommendedby Hair et al. (2006; 2010).
2) The result of the Bartlett’s test of sphericity should be at leastsignificant at .05.
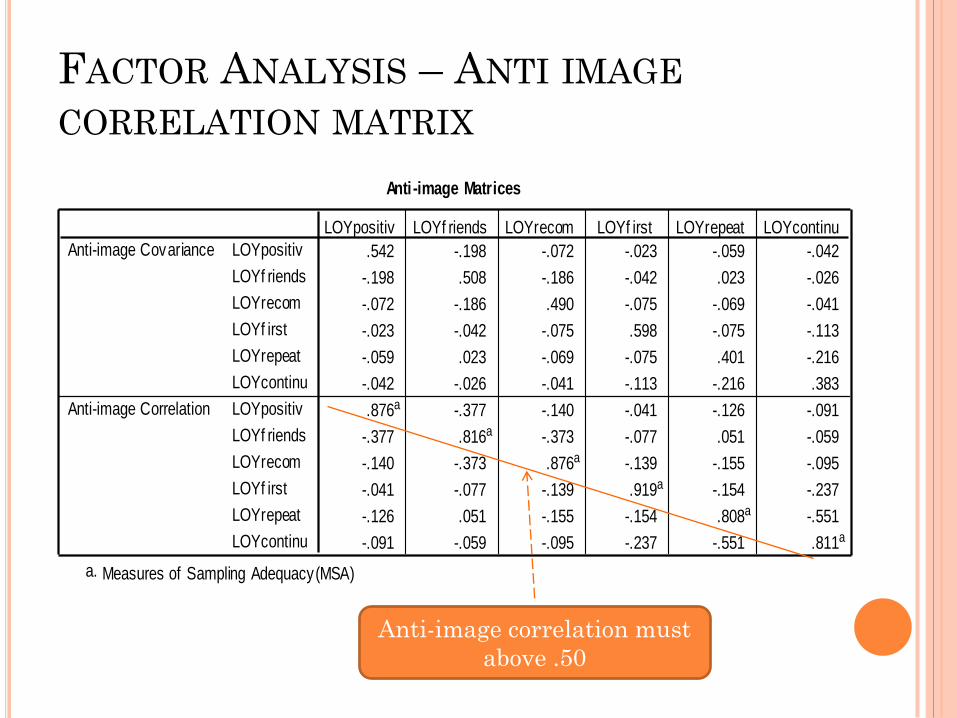
3) Anti-image correlation matrix of items should be at least above .50.
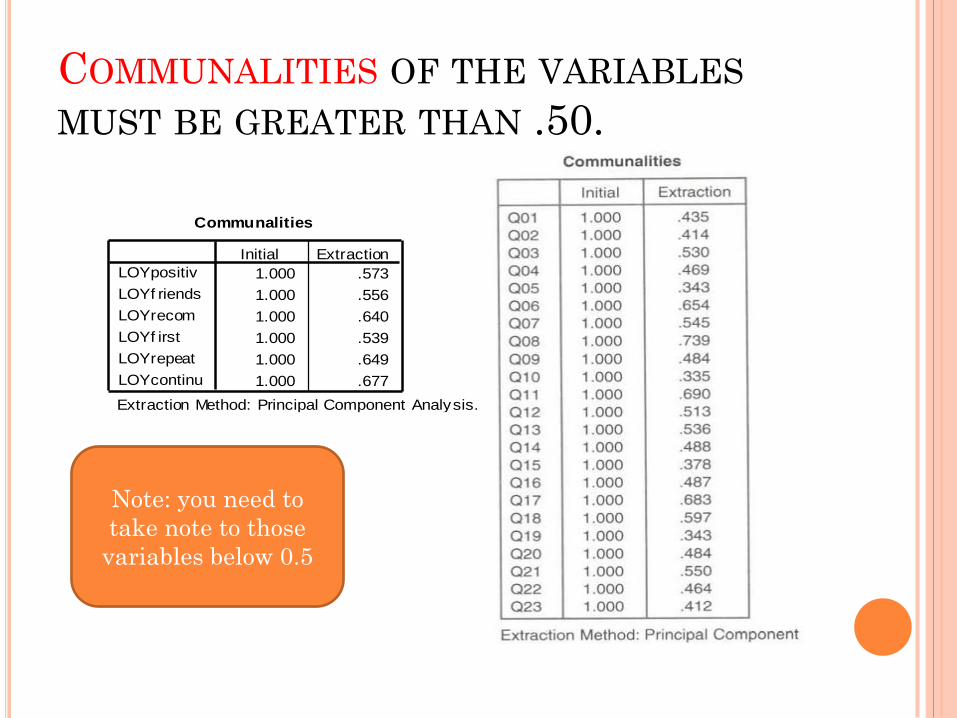
4) Communalities of the variables must be greater than .50.
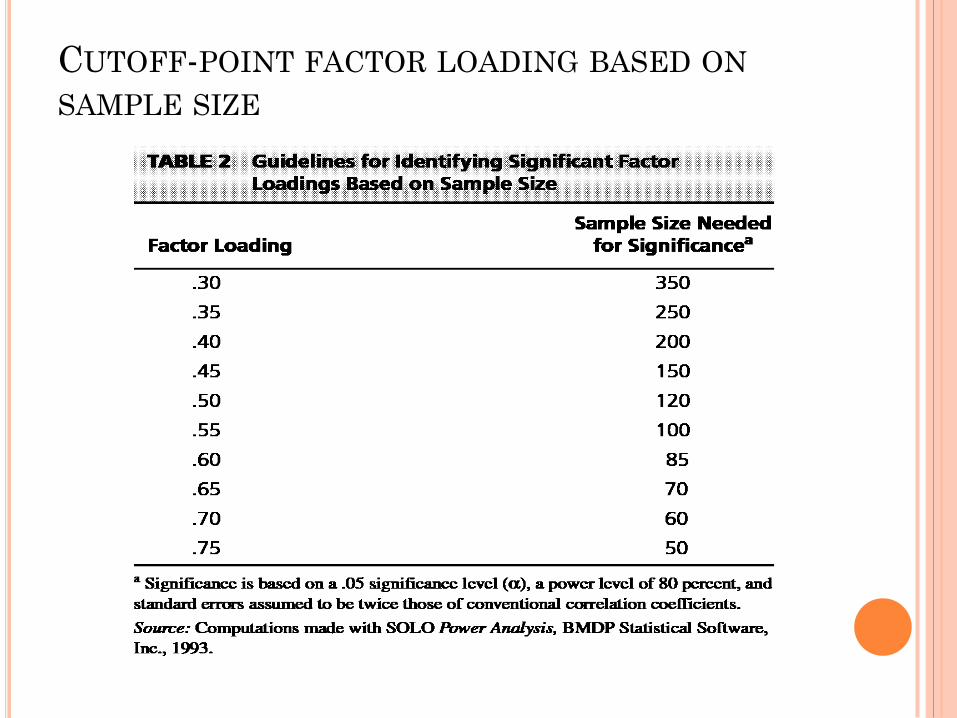
5) The factor loadings of .30 or above for each item are consideredpractical and statistically significant for sample sizes of 350 orgreater.
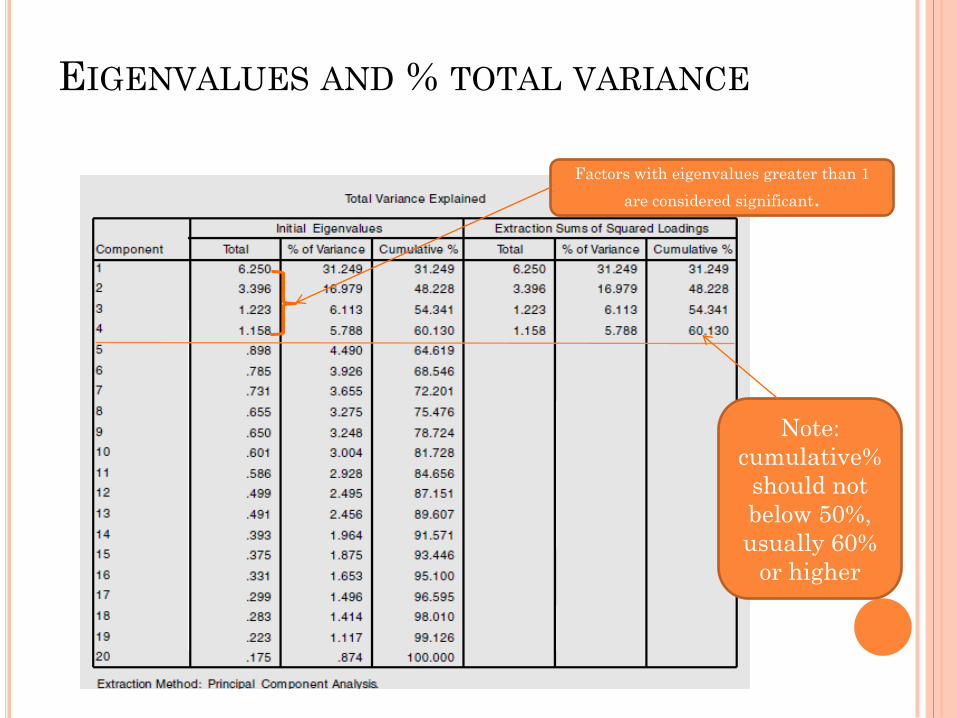
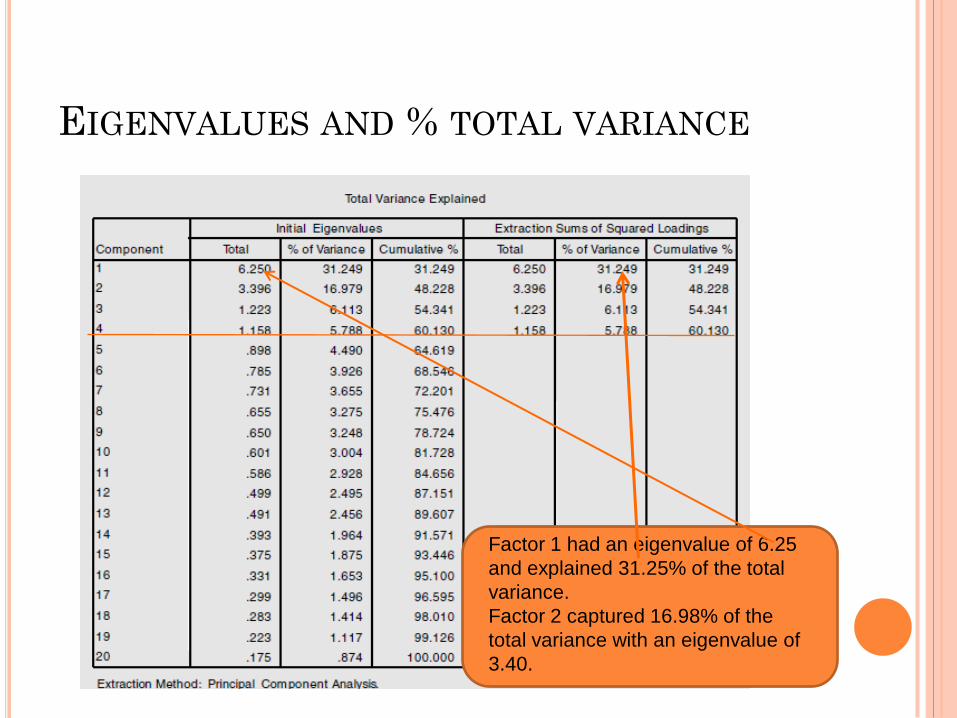
6) Factors with eigenvalues greater than 1 are considered significant.
7) Percentage of varianced explained usually 60% or higher.
Note: In terms of communalities, Field (2005) and others scholars (MacCallum, Widaman, Zhang, & Hong, 1999) have suggested that those items/variables that have communality values less than 0.5 can be retained when the sample size is over 500. Hair et al. (2006) also noted that a researcher may take into account whether to retain or remove those items/variables which have a low communality. If the low communality item contributes to a well-defined factor, a researcher should consider retaining it.
CUTOFF-POINT FACTOR LOADING BASED ON
SAMPLE SIZE
FACTOR ANALYSIS
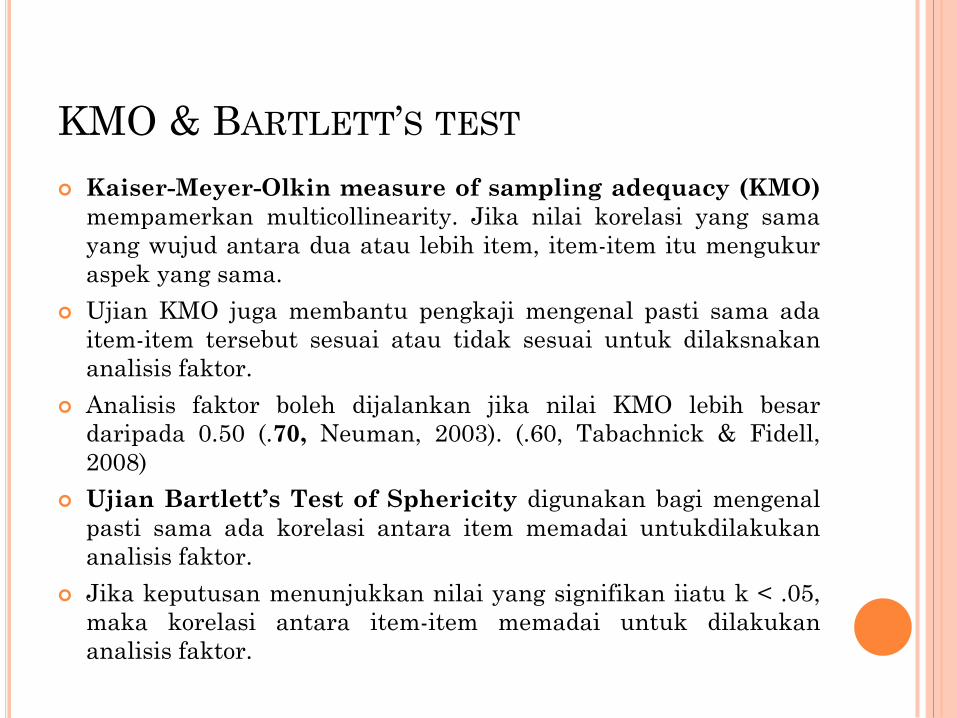
Kaiser-Meyer-Olkin measure of sampling adequacy (KMO) values must
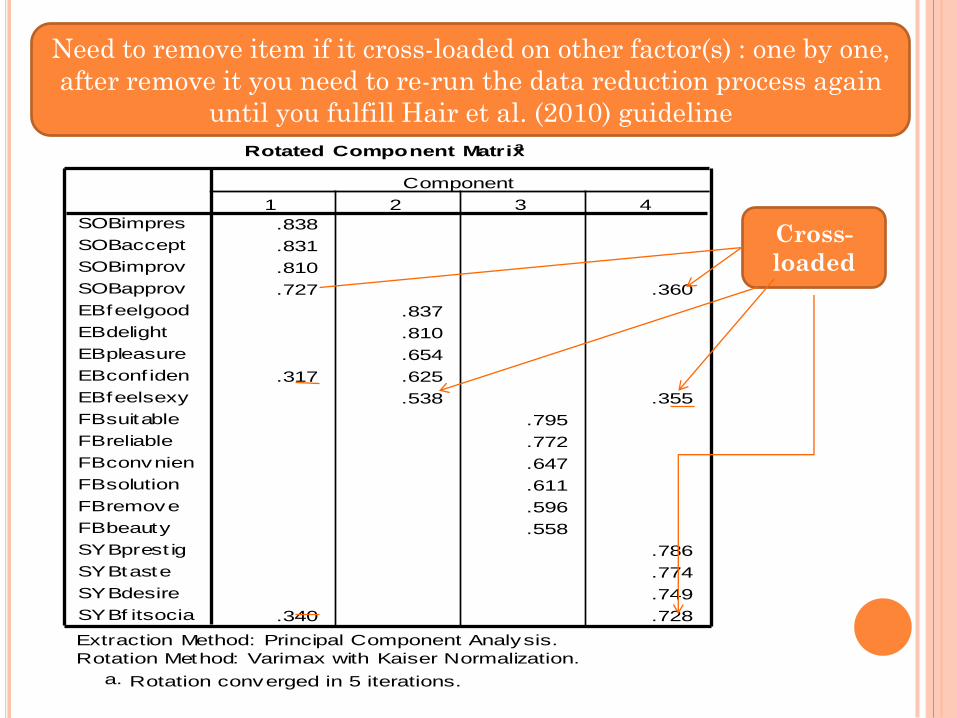
Rotation Method: Varimax with Kaiser Normalization.
Rotation converged in 5 iterations.a.
Need to remove item if it cross-loaded on other factor(s) : one by one,
after remove it you need to re-run the data reduction process again
until you fulfill Hair et al. (2010) guideline
Cross-
loaded
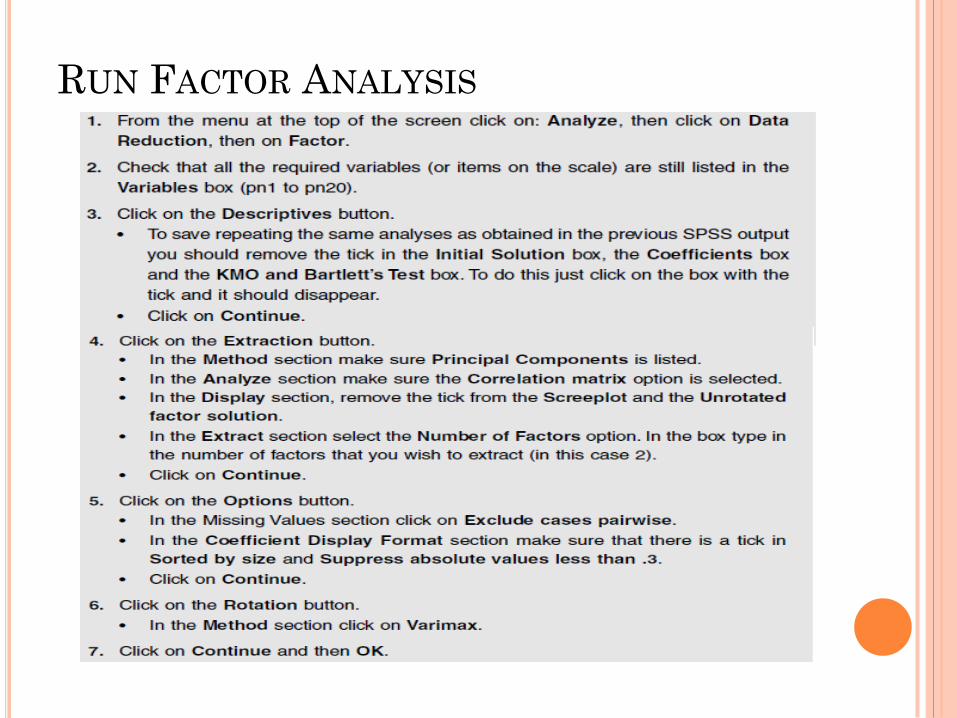
RUN FACTOR ANALYSIS
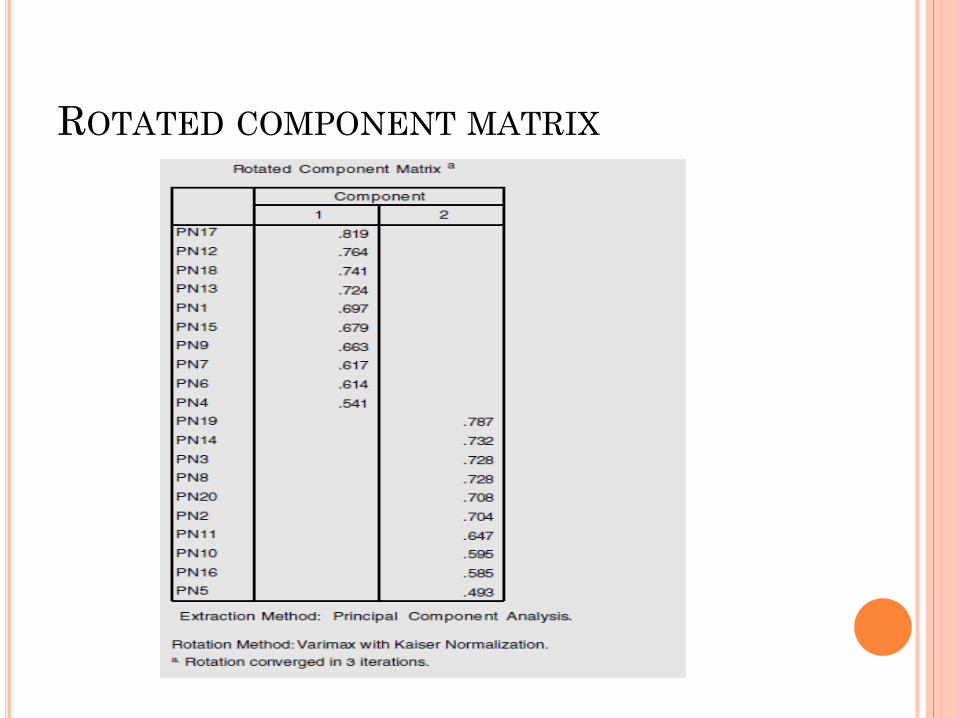
ROTATED COMPONENT MATRIX
LATIHAN 1: ANALISIS FAKTOR
SKALA IKSOKU-F
RELIABILITY TEST
Reliability analysis was performed in order todetermine whether a group of items (i.e. itemsmeasuring a construct generated from factor analysis)consistently reflected the construct it is measuring(Field, 2005).
The most common measure of reliability is internalconsistency of the scale (Hair et al., 2006). Cronbach’salpha was calculated in order to examine the internalconsistency of the scales used in this study.
Cronbach’s alpha coefficient can range from 0.0 to 1.0.A Cronbach’s alpha close to 1.0 indicates that theitem is considered to have a high internal consistencyreliability, above 0.8 is considered good, 0.7 isconsidered acceptable and less than 0.6 is consideredto be poor (Sekaran, 2003).
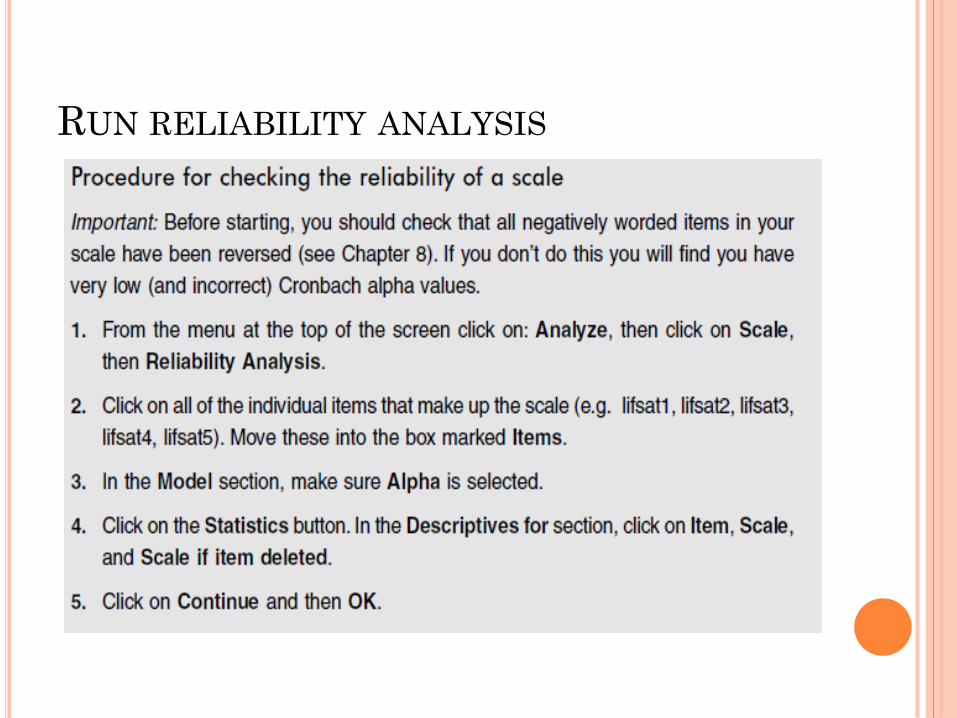
RUN RELIABILITY ANALYSIS
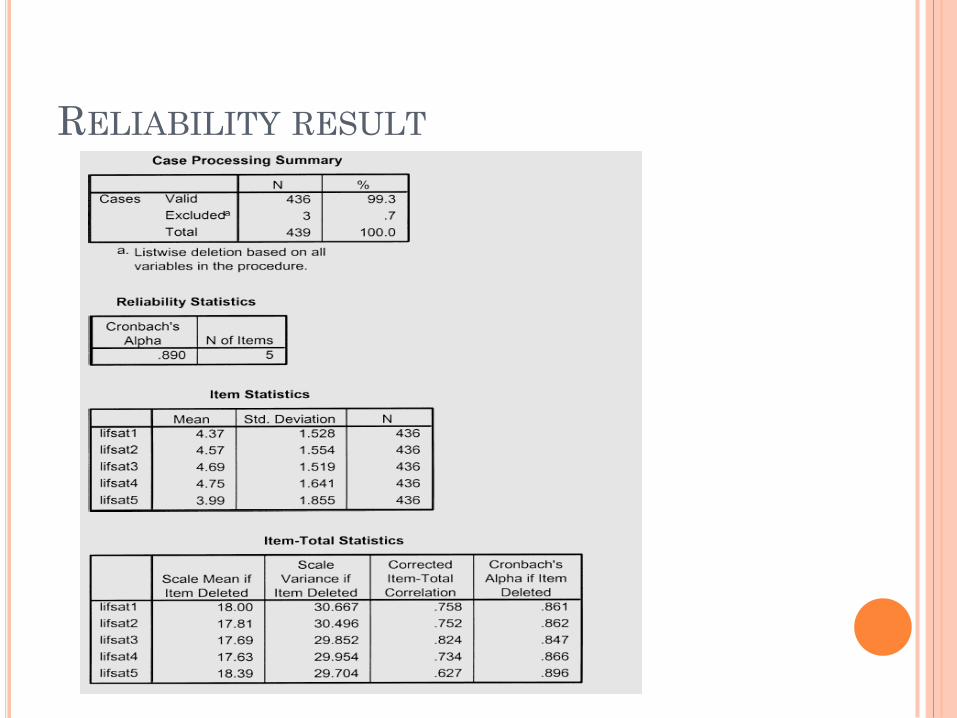
RELIABILITY RESULT
AFTER CHECKING RELIABILITY ANALYSIS
when you are satisfied with reliability analysis of
each of the dimensions and/or constructs that
was generated from the factor analysis
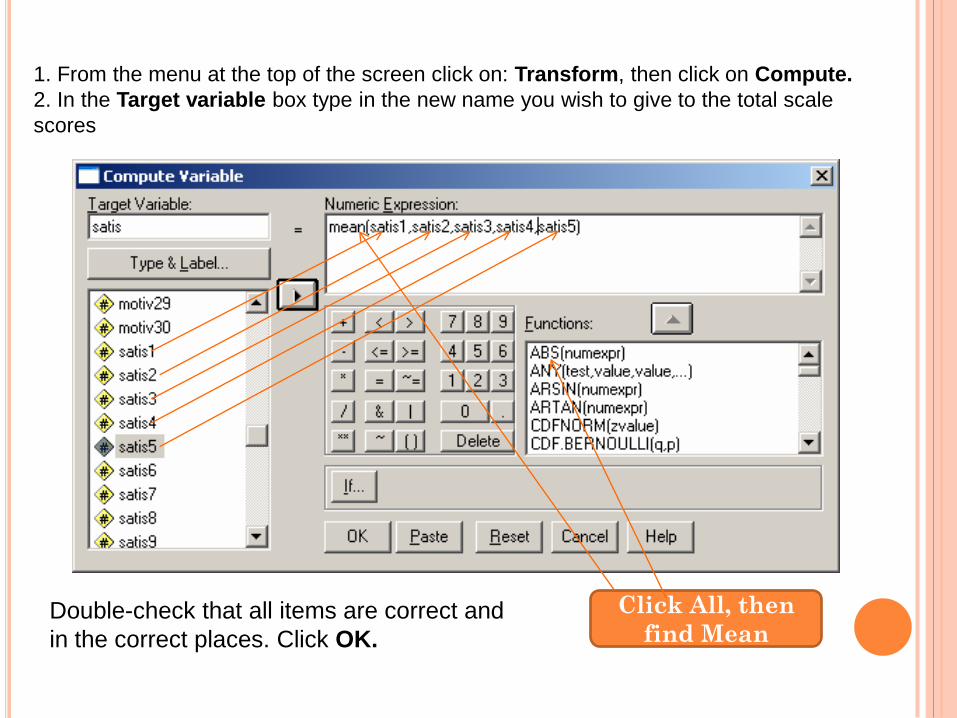
You need to compute the mean scores for each of
the dimensions and/or construct(s).
1. From the menu at the top of the screen click on: Transform, then click on Compute.
2. In the Target variable box type in the new name you wish to give to the total scale
scores
Click All, then
find MeanDouble-check that all items are correct and