Babcock International Group PLC full year results for the year ended 31 March 2021 Babcock International Group PLC full year results for the year ended 31 March 2021 1 30 July 2021 Detailed reviews completed and turnaround underway Statutory results 31 March 2021 31 March 2020 Restated Revenue £4,183m £4,429m Operating loss £(1,643.0)m £(75.6)m Basic loss per share (337.0)p (23.3)p Cash generated from operations £470.8m £445.3m Underlying results 31 March 2021 31 March 2020 Restated Contract backlog (note ii) £8.7bn £9.5bn Revenue (note iii) £4,183m £4,429m Operating (loss) / profit (note iv) £(27.6)m £377.6m of which one-off contract profitability and balance sheet (‘CPBS’) adjustments (note v) £(250.0)m Operating profit excluding one-off CPBS adjustments £222.4m Basic (loss) / earnings per share (note vi) (23.8)p 58.4p Free cash flow (note vii) £169.5m £55.5m Net debt £1,354m £1,705m Net debt excluding operating leases (note viii) £772m £1,055m Net debt/EBITDA (covenant basis) (note ix) 2.5x 2.3x The results for FY20 have been restated for prior period errors and a change in accounting policy, see note (i). The Group has also changed its definitions of underlying results. See notes on page 3 and a reconciliation on page 9. Strategy update Following extensive reviews, we now have a turnaround plan to restore Babcock to strength without the need for new equity Babcock will focus on being an international aerospace, defence and security company Five strategic actions: o Aligning our portfolio, targeting at least £400 million of disposal proceeds over the next twelve months o Implementing our new operating model, delivering annualised savings of approx. £40 million (c.£20 million benefit in FY22) o Rolling out a new people strategy focused on sharing capability, talent, innovation and best practice across the Group o Developing a new ESG strategy, including a commitment to net zero for our estate, assets and operations by 2040 o Exploring growth opportunities, including opportunities in international markets and through our range of products Our strategy aims to significantly improve the Group’s profitability, and most importantly its cash generation, over the medium term Presentational changes to our reporting for improved transparency (see page 3) Revenue and underlying operating profit no longer include a contribution from joint ventures (JVs) and associates A clearer definition of underlying operating profit and Specific Adjusting Items Free cash flow now includes cash flows related to exceptional items Free cash flow now includes the capital element of lease payment cash flows, rather than net new lease commitments Contract profitability and balance sheet review (‘CPBS’) completed (see page 11) Total impairments and charges of £2 billion, consisting of impairment of goodwill and acquired intangibles (£1,349 million), other FY21 impacts, the vast majority of which are estimate changes (£464 million), the cumulative correction of prior period errors (£171 million) and a change in accounting policy (£60 million) Vast majority of the impacts of the CPBS are one-off and do not change future cash flows Recurring CPBS adjustment to underlying operating profit of around £25 million per annum Financial results in line with early indications set out in our April 2021 business update Revenue down 3% excluding foreign exchange and disposals, with business growth offset by the impact of COVID-19 on trading and the de-recognition of pass-through revenue from the Phoenix contract in Land - see page 15 for a revenue bridge from FY20 to FY21 Underlying operating profit excl. one-off CPBS adjustments was £222.4 million. This differs from the unaudited figure we indicated in April of £307 million for two reasons: our definition now excludes joint ventures and IFRIC 12 income (£62 million) and has been reduced by the recurring impacts of the CPBS (£24.7 million) - see page 16 for an underlying operating profit bridge from FY20 to FY21 On this basis, underlying operating profit (excluding FX and disposals) was down 40%, reflecting the impact of COVID-19 (£46 million) and significant credits that benefited FY20 (£47 million) Underlying free cash flow of £170 million benefited from VAT timing benefit (£56 million) and corporation tax repayments (£67 million) Underlying basic EPS of (23.8)p. Excluding the one-off CPBS adjustments, underlying basic EPS was 28.9p
Transcript
Babcock International Group PLC full year results for the year ended 31 March 2021
Babcock International Group PLC full year results for the year ended 31 March 2021 1
30 July 2021
Detailed reviews completed and turnaround underway
Basic (loss) / earnings per share (note vi) (23.8)p 58.4p
Free cash flow (note vii) £169.5m £55.5m
Net debt £1,354m £1,705m
Net debt excluding operating leases (note viii) £772m £1,055m
Net debt/EBITDA (covenant basis) (note ix) 2.5x 2.3x The results for FY20 have been restated for prior period errors and a change in accounting policy, see note (i). The Group has also changed its definitions of underlying results. See notes on page 3 and a reconciliation on page 9.
Strategy update Following extensive reviews, we now have a turnaround plan to restore Babcock to strength without the need for new equity Babcock will focus on being an international aerospace, defence and security company Five strategic actions:
o Aligning our portfolio, targeting at least £400 million of disposal proceeds over the next twelve months o Implementing our new operating model, delivering annualised savings of approx. £40 million (c.£20 million benefit in FY22) o Rolling out a new people strategy focused on sharing capability, talent, innovation and best practice across the Group o Developing a new ESG strategy, including a commitment to net zero for our estate, assets and operations by 2040 o Exploring growth opportunities, including opportunities in international markets and through our range of products
Our strategy aims to significantly improve the Group’s profitability, and most importantly its cash generation, over the medium term
Presentational changes to our reporting for improved transparency (see page 3)
Revenue and underlying operating profit no longer include a contribution from joint ventures (JVs) and associates
A clearer definition of underlying operating profit and Specific Adjusting Items
Free cash flow now includes cash flows related to exceptional items
Free cash flow now includes the capital element of lease payment cash flows, rather than net new lease commitments
Contract profitability and balance sheet review (‘CPBS’) completed (see page 11) Total impairments and charges of £2 billion, consisting of impairment of goodwill and acquired intangibles (£1,349 million), other FY21
impacts, the vast majority of which are estimate changes (£464 million), the cumulative correction of prior period errors (£171 million) and a change in accounting policy (£60 million)
Vast majority of the impacts of the CPBS are one-off and do not change future cash flows Recurring CPBS adjustment to underlying operating profit of around £25 million per annum
Financial results in line with early indications set out in our April 2021 business update Revenue down 3% excluding foreign exchange and disposals, with business growth offset by the impact of COVID-19 on trading and
the de-recognition of pass-through revenue from the Phoenix contract in Land - see page 15 for a revenue bridge from FY20 to FY21 Underlying operating profit excl. one-off CPBS adjustments was £222.4 million. This differs from the unaudited figure we indicated in
April of £307 million for two reasons: our definition now excludes joint ventures and IFRIC 12 income (£62 million) and has been reduced by the recurring impacts of the CPBS (£24.7 million) - see page 16 for an underlying operating profit bridge from FY20 to FY21
On this basis, underlying operating profit (excluding FX and disposals) was down 40%, reflecting the impact of COVID-19 (£46 million) and significant credits that benefited FY20 (£47 million)
Underlying free cash flow of £170 million benefited from VAT timing benefit (£56 million) and corporation tax repayments (£67 million) Underlying basic EPS of (23.8)p. Excluding the one-off CPBS adjustments, underlying basic EPS was 28.9p
2 Babcock International Group PLC full year results for the full ended 31 March 2021
Net debt at 31 March 2021 (excluding operating leases) of £772 million, down from £1,055 million last year (note both now include supply chain financing balances, £25 million at March 2021 and £93 million at March 2020). Average net debt during the year was around £1.3 billion
Balance sheet
New banking agreements in place to prudently protect against potential downside scenarios: o New £300 million revolving credit facility expiring May 2024, in addition to existing £775 million facility o Clarification on treatment of underlying results and exclusion of CPBS one-off adjustment from covenant ratios o Temporary amendment of net debt to EBITDA ratio covenant to 4.5x until 31 March 2022
Portfolio alignment aims to generate at least £400 million of proceeds in the next twelve months Net debt to EBITDA (covenant basis) 2.5 x at 31 March 2021, with liquidity headroom of £1.2 billion The near term priority is to reduce net debt to EBITDA below 2x
Recent business development
Contract backlog at 31 March 2021 was £8.7 billion. This is a simpler measurement of our committed contract cover and no longer includes work as part of framework agreements, nor our share of the contract backlogs in JVs and associates (see note ii for details)
Future Maritime Support Programme (FMSP) expected to be finalised this summer, interim agreement currently in place. Our contract backlog is expected to increase significantly once this contract is signed
In the first quarter of FY22: o Memorandum of Implementation with UK and Ukraine to be the prime contractor on programme of naval defence projects o Awarded new c.€500 million contract for defence aviation training activities in France o Won c.£150 million logistic support contract, part of the UK’s next generation tactical communications & information systems
Working on various Type 31 export opportunities including Greece, Indonesia and Poland
Outlook
While FY22 will benefit from operating model savings (c.£20 million), it will be a year of transition and, as such, we remain cautious The impact of COVID-19 on performance in FY22 is uncertain. While activity levels have broadly recovered, the additional costs from
operating in a COVID-secure way remain. These costs, combined with the uncertainty over business interruption from increased cases and potential new variants, mean that we do not currently expect a material boost in profitability from COVID-19 restrictions easing
Free cash flow will be impacted by the material cash outflows previously communicated, particularly additional pension contributions (c.£130 million in excess of the income statement) and exceptional cash costs (c.£50 million restructuring and c.£20 million Italy fine). In addition, we are still investing in facility and IT upgrades and we will be unwinding over time the historical management of working capital around period ends. As such, free cash flow (before disposal proceeds) in FY22 is expected to be significantly negative (see page 19 for further details)
We are confident about our prospects for the markets we serve. We believe that with our improved strategic focus and operational delivery, and with efficiencies generated by the new operating model, we can significantly improve the Group’s profitability, and most importantly its cash generation, over the medium term but this will take time to deliver
David Lockwood, Chief Executive Officer, said: “We have now completed the series of reviews announced in January. These have reinforced our confidence in the underlying strength of the Babcock business and at the same time helped identify the necessary strategic changes to improve our performance. We have a plan in place to strengthen the Group without the need for an equity issue. The full year 2021 performance reflects both the new financial baseline for the business and the impact of COVID-19 on our operations and markets. I’d like to thank all our people who have been working tirelessly throughout the pandemic to deliver the vital services on which our customers depend. Looking forward, Babcock will be a simplified and more focussed group with a renewed emphasis on the exceptional engineering skills of its people. We will be well placed to take advantage of the many opportunities we see in both UK and international markets, leading to improved cash generation and profitability in the medium term.”
Results presentation: A virtual meeting for investors and analysts will be held on 30 July 2021 at 9:00 am (UK time). The presentation will be webcast live at www.babcockinternational.com/investors and subsequently will be available on demand at www.babcockinternational.com/investors/results-and-presentations. A transcript of the presentation and Q&A will also be made available on our website.
For further information: Simon McGough, Director of Investor Relations +44 (0)7850 978 741 Kate Hill, Group Director of Communications +44 (0)20 7355 5312 Tulchan Communications +44 (0)20 7353 4200
Babcock International Group PLC full year results for the year ended 31 March 2021 3
Changes to the presentation of underlying results We have made a series of changes to our underlying measures this year to improve transparency and provide a simpler set of accounts and financial commentary. These changes are:
The results of joint ventures and associates are now included as one line in the income statement relating to Babcock’s share of joint ventures’ and associates’ profit after tax. The Group no longer includes a share of joint venture and associates revenue. This aligns revenue with the statutory IFRS measure. IFRIC 12 income has now been taken out of underlying operating profit and included as investment income
A clearer definition of underlying operating profit and Specific Adjusting Items (see note iv below)
Updating our definition of free cash flow to include the capital element of lease payment cash flows (rather than net new lease commitments which are reflected as a debt movement) and to include cash flows related to exceptional items
See page 8 for the impacts of the above in restating the FY20 underlying results.
Adjustments between statutory and underlying information The Group uses various alternative performance measures, including underlying operating profit, to enable users to better understand the performance and earnings trends of the Group. The Directors believe the alternative performance measures provide a consistent measure of business performance year to year and they are used by management to measure operating performance and as a basis for forecasting and decision-making. The Group believes they are also used by investors in analysing business performance. These alternative performance measures are not defined by IFRS and therefore there is a level of judgement involved in identifying the adjustments required to calculate the underlying results. As the alternative performance measures used are not defined under IFRS, they may not be comparable to similar measures used by other companies. They are not intended to be a substitute for, or superior to, measures defined under IFRS. For the most useful comparison to last year, and as a better measure to compare to future periods, this Report focuses on underlying operating profit excluding the one-off CPBS adjustment (see page 11) as we believe this to be the most helpful measure.
Notes to statutory and underlying results on page 1 Note (i): Results for FY20 have been restated to correct for prior year errors and to reflect changes in accounting policies. See page 8 for details. Note (ii): We now report a contract backlog, which represents amounts of future revenue under contract, rather than an order book reported previously. This new measure does not include £6.0 billion of work expected to be done by Babcock as part of framework agreements (2020: £5.3 billion) and, to align with the change in presentation of revenue (see above), does not include orders of £2.0 billion within our joint ventures and associates (2020: £2.7 billion). Note (iii): Revenue is as defined under IFRS with no adjustments between statutory and underlying. Historically, the Group reported underlying revenue which included the Group’s share of joint ventures’ and associates’ revenue. Note (iv): Underlying operating profit is defined as IFRS statutory operating profit adjusted for Specific Adjusting Items. See page 9 for a reconciliation. The Specific Adjusting Items are:
Amortisation of acquired intangibles
Business acquisition, merger and divestment related items (being acquisitions and gains or losses on disposal of assets or businesses)
Gains, losses and costs directly arising from the Group’s withdrawal from a specific market or geography, including closure costs, severance costs, the sale of assets and termination of leases
The costs of large restructuring programmes which significantly exceed the minor restructuring which occurs every year as part of the normal day to day business. Where restructuring costs are incurred as a result of the ongoing execution of day to day business, they are included in operating costs and are not excluded from underlying operating profit
Profit or loss from amendment, curtailment, settlement or equalisation of Group pension schemes
Exceptional items that are significant, non-recurring and outside of the normal operating practice. These items are described as exceptional in order to appropriately represent the Group’s underlying business performance
Note (v): The Group’s contract profitability and balance sheet review (‘CPBS’) has resulted in various adjustments, including in-year estimate changes, reversing prior year errors and a change in accounting policy - see page 11 for details. Reference is made throughout this document to the CPBS and its impact. Commentary in this document often discusses performance before the one-off CPBS adjustments to better reflect the year on year differences in performance across the Group. Note (vi): Underlying basic earnings per share (‘EPS’) is based on the Group’s underlying operating profit (see note iv). It includes the Group’s post-tax share of results of joint ventures and associates. This measure now includes the amortisation of acquired intangibles within joint ventures. Note (vii): Underlying free cash flow now includes cash flows from exceptional items and the capital element of lease payment cash flows (rather than net new lease commitments which are reflected as a debt movement). Note (viii): This measure excludes operating leases as defined by IAS 17. This accounting standard has since been superseded by IFRS 16 but was the relevant standard at the inception of the banking facility. This net debt figure now also includes finance lease (as defined by IAS 17) receivables and payables and continues to include loans from the Group to joint ventures. Supply chain financing balances have been reclassified to debt in both periods (March 2021: £25 million, March 2020: £93 million). Note (ix): Net debt / EBITDA as measured in our banking covenants, which make a series of adjustments to both Group net debt and Group EBITDA. See page 21 for a reconciliation.
4 Babcock International Group PLC full year results for the full ended 31 March 2021
CEO STATEMENT
Our new approach We announced a series of reviews in January 2021 of our strategy, portfolio and operating model, alongside a deep dive into the profitability of our contracts and balance sheet position to establish a financial baseline. These reviews have now been concluded, and the results make a compelling argument for the significant change needed in order to unlock the Group’s potential. The reviews showed that Babcock was being run as a federation rather than a unified Group, an approach which may have served us in the past but does not meet the needs of today’s market. The last few years have seen a move to in-source civil nuclear work in the UK, increased customer demands on each new programme, the need for a more agile supply chain and the requirement for more innovative solutions to the evolving threats in international defence. We did not adapt to the changing world around us quickly enough. We also have to accept that the expectations we had for the Avincis acquisition in 2014 have not played out. Growth in the markets Avincis served has not been as expected, most notably in oil and gas, and the profitability of those businesses has been under pressure for some years. Many of these pressures are highlighted in our contract profitability and balance sheet review (‘CPBS’) with just over half of adjustments by value relating to businesses that came from this acquisition. Most importantly, we have already started to implement a plan to fix this: removing costs and taking a different approach to contract bids. We are disposing of our oil and gas business and are further reviewing the aerial emergency services businesses. As a Group, it seems that we sometimes have been optimistic in setting objectives. This led to a pattern of underperformance which we are determined to address. We are doing just that, and have instituted a number of changes to enable us to be fit to take advantage of the significant opportunities we can see ahead. We now have a more appropriate baseline for the financial performance of the Group. We have set a new strategy as outlined below, with a greater focus on maximising our fundamental strengths in the UK and internationally, both in our target countries and through exports like the new Type 31 frigate and High Frequency communications. I’m pleased to say that the international defence market is responding positively. And we are undergoing a wide-ranging refresh of our culture – not just in terms of the new ways of working captured in the changes to the operating model, but in the rolling-out of a new people strategy and a new emphasis on ESG throughout the Group.
Strengths of the Group Our business is based on some key fundamental strengths across the Group, including:
Deep technical expertise and highly skilled people across critical and complex engineering Ownership of key sites and infrastructure including the Devonport and Rosyth dockyards Strong relationships with our customers, including a deep understanding of their challenges Strong niche positions in Canada, Australasia and South Africa, with a developing position in France A range of platforms, systems and products that are highly competitive in international markets
Our strategy We are an international aerospace, defence and security company with a leading naval business, and we provide value-add services across the UK, France, Canada, Australasia and South Africa. We are focused on five strategic actions:
1. Aligning our portfolio 2. Implementing our new operating model 3. Rolling out our new people strategy 4. Developing our new ESG strategy 5. Exploring growth opportunities
Together this should lead to returns for our shareholders, improved delivery for customers and a better place to work for our employees.
1) Aligning our portfolio Our strategy review defined the markets we wish to serve and therefore the best portfolio to hold. With this in mind, we considered which businesses we are the best owner of and on which we could earn a sufficient return on capital and this has led to us identifying businesses that may be divested. This portfolio alignment will reduce complexity, increase focus and increase the effective use of the Group’s capital by disposing of the businesses that are outside the perimeter of our strategy. We are targeting proceeds of at least £400 million over the next 12 months from these divestments. Some of these processes are underway and we will update the market when material progress is made. As announced in March 2021, we have agreed the conditional sale of our oil and gas aviation business. This deal is expected to complete over the summer subject to the satisfaction of the relevant third-party conditions.
2) Implementing our new operating model We are creating a business that is more efficient and effective. We are reducing layers of management within the business to form a flatter structure that will simplify how we operate, improve line of sight, shorten communication lines and therefore increase business flexibility and our responsiveness to market conditions. Sadly, these changes will result in approximately 1,000 employees leaving the Group over the 2022 financial year with an estimated restructuring cost of £40 million.
Babcock International Group PLC full year results for the year ended 31 March 2021 5
These changes will also reduce our operating cost base. Some of the savings will be recognised across long-term projects, for example where they form part of existing contract efficiency assumptions, and some savings will benefit our customers via the contract structure. As such, the expected realisable annualised savings are approximately £40 million. The benefit in FY22 will be roughly half this due to timing. These changes will also create a leaner organisation and should help our decision-making – giving more power to the teams closer to the customer. The changes also aim to improve our internal and financial controls, see further details in our Financial Review on page 25.
3) Rolling out our new people strategy We are developing an organisation that shares capability, talent, innovation and best practice across the Group and removes complexity. The new operating model is a key pillar of our new people strategy. On top of this, we will create an agile and inclusive workplace, improve our diversity, create a new approach to talent management and we will harmonise our people policies and processes. All of these will combine to make Babcock a better place to work for our employees. Delivering our new operating model and new people strategy requires us to embrace a new culture to unlock the potential that exists within the business – one which continues our tradition of focus on the customer, but which enables more innovation and collaboration. We have begun that process with the articulation of our new purpose: creating a safe and secure world, together. It’s a recognition of the positive role we can and should take in creating a safe and secure world, as a responsible member of society, and of the fact that almost everything we do is collaborative – whether it is working together across the different parts of the Group, working with our customers, or working with our partners and suppliers. We have started to transform our culture and that work will continue throughout the coming financial year.
4) Developing our new ESG strategy We have continued to make great progress on developing our ESG strategy in a year of many challenges. We have a plan to reduce harmful emissions and integrate sustainability into programme design and have set a new target for the Group: to achieve net zero carbon emissions for our estate, assets and operations by 2040. We want to make a positive difference to our communities, including providing high-quality jobs that support local economies, and we are focused on being a collaborative, trusted partner across the supply chain. We have reaffirmed our commitment to championing inclusion and diversity across the Group, including setting a new target to ensure that 30% of our senior leadership roles are filled by women by 2025. Additionally we are actively working on meeting the recommendations of the Parker Review as we support increasing the representation of ethnicity on UK boards. 5) Exploring growth opportunities While our immediate focus has been on completing our reviews and getting a more appropriate baseline in place, we are also exploring the growth opportunities ahead of us. The markets we address offer favourable medium-term growth and we will focus on opportunities for defence and value-add services in the UK, France, Canada, Australasia and South Africa. Work on key programmes critical to the national security of the UK is the core of what Babcock does. Given our strong market position today, growth in the UK will mainly be dependent on market growth. There are areas where we will also look to increase our share, for example secure defence communications. Growth in international markets can come from market growth and an increase in market share. We aim to develop our international presence in our target markets of France, Canada, Australasia and South Africa. We are bidding for contracts that, if won, would offer significant growth, for example pilot training in Canada. Our range of products have further opportunities for growth including in our equipment and systems exports and international demand for the Type 31 platform. We aim to export a lot more in the future from the UK, embracing the aims of the UK Government and its strategy.
Recent business development The Group continued to win work across all markets and sectors in the year and, as of 31 March 2021, our contract backlog was £8.7 billion. We now report a contract backlog rather than an order book as in previous years. Our new measure does not include around £6.0 billion of work expected to be done by Babcock as part of framework agreements and, to align with the change in presentation of revenue, does not include a contribution of joint ventures and associates of around £2.0 billion. In June 2021, we signed a tripartite Memorandum of Implementation with the UK’s MOD and Ukraine’s MOD to be the prime contractor on a major programme of naval defence projects. The programme includes the enhancement of capabilities on existing naval platforms, the delivery of new platforms, including fast attack missile craft, a modern frigate capability, shipborne armaments and the training of naval personnel. It also involves working together to regenerate Ukrainian shipyards by developing, implementing and completing a Shipyard Regeneration Plan. Also in June 2021, we were awarded a contract with the French MOD for an expansion of our existing defence aviation training activities. This 5-year contract is worth around €500 million and started in June 2021. We also won a logistic support contract worth £150 million as part of the UK MOD’s £3.2 billion Battlefield and Tactical Communication Information Systems (BATCIS) programme of opportunities to deliver the next generation tactical communications and information systems. We are currently in active discussions regarding Type 31 export opportunities with a number of countries, including Greece, Indonesia and Poland.
6 Babcock International Group PLC full year results for the full ended 31 March 2021
Summary of financial performance in FY21 Our financial performance in the year was in line with the early indications we gave in April 2021, though this now includes presentational changes as covered in the Financial review. Organic revenue decline was 3% with demand for most of our work holding up well despite the pressures of the COVID-19 pandemic. We made a statutory operating loss of £1,643 million in the year, mainly as a result of charges taken in our CPBS including the impairment of goodwill (see page 11). On an underlying basis, our operating loss was £27.6 million, again mainly due to CPBS charges. For the most useful comparison to last year, and as a better measure for future periods, we focus in this report on the Group’s underlying operating profit excluding the one-off CPBS adjustment. On this basis, we had an underlying operating profit of £222.4 million in the year compared to £377.6 million last year (restated), both of which now exclude our share results of joint ventures and associates. This decline in profit reflects disposals and lost business as well as a significant impact from COVID-19. The year-on-year decline is exacerbated by significant credits that benefited the results of the previous financial year. These are covered in more detail in our Financial review. The COVID-19 pandemic had a material impact in the year and continues to cause uncertainty across our markets. The impacts in the year were most severe for our non-defence businesses (e.g. civil aviation and civil training) where activity in some cases stopped. The defence businesses saw some interruption and increased costs initially. Subsequently, most defence programmes and sites were reopened, albeit with social distancing restrictions and higher levels of employees working from home. This led to less efficient delivery, hence profitability was affected proportionately more than revenue.
Health and safety performance in the year While our total injuries rate was lower this year, at 1.01 reported injuries for every 100,000 hours worked (2020: 1.24), we saw an increase of 36% in the more serious ‘Babcock RIDDOR’ injury rate. Tragically, in August 2020, during a firefighting mission an aircraft crash-landed in Spain near the Portuguese border causing the immediate fatality of the co-pilot. The pilot, who had suffered major injuries, subsequently passed away. The incident is currently under investigation by the appropriate authorities. This incident and the increase in serious injuries underlines how crucial it is we continue to focus on improving our health and safety performance.
Trading in the first quarter for FY22 Trading in the quarter ended 30 June 2021 was in line with our expectations across all four sectors. Net debt (excluding operating leases) was £1,140 million, higher than at 31 March 2021 but lower than the average net debt for FY21.
Outlook We are confident that we have established a clear strategic path to return Babcock to strength, but the extent of the transformation we are undergoing means that FY22 will be a year of transition. The impact of COVID-19 on performance in FY22 is uncertain. While activity levels have broadly recovered, the additional costs from operating in a COVID-secure way remain. These costs, combined with the uncertainty over business interruption from increased cases and potential new variants, mean that we do not currently expect a material boost in profitability from COVID-19 restrictions easing. As such, we remain cautious about the progress we will be able to make on profitability. Free cash flow will be impacted by the material cash outflows previously communicated, particularly additional pension contributions and exceptional cash costs, both restructuring costs and the Italy fine. In addition, we are still investing in facilities and IT upgrades and we will be unwinding the historical management of working capital around period ends. As such, free cash flow (before disposal proceeds) in the 2022 financial year is expected to be significantly negative. We are confident about our prospects for the markets we serve. We believe that with our improved strategic focus and operational delivery, and with efficiencies generated by the new operating model, we can significantly improve the Group’s profitability, and most importantly its cash generation, over the medium term but this will take time to deliver.
Delivering for all our stakeholders Over the medium and long term we are focused on delivering value for all of our stakeholders, including:
Returns for our shareholders: a return to growth with improving margins and better cash conversion Improved delivery for our customers: consistent delivery and partnering with customers to solve their challenges A better place to work for our employees: an open, collaborative and diverse workplace that engages our employees
Our direction is set, and we are ensuring that we have all the elements in place to take advantage of the many opportunities which lie before us. We look forward to sharing updates on our progress as we move forward. David Lockwood OBE Chief Executive Officer
Babcock International Group PLC full year results for the year ended 31 March 2021 7
OTHER INFORMATION Dividend No ordinary dividends have been paid or declared for the financial year ended 31 March 2021.
AGM We will be holding our Annual General Meeting on 22 September 2021.
Board changes During the year, we welcomed new members to our Board:
Russ Houlden joined as Non-Executive Director in April 2020 and became the Chair of the Audit Committee in August 2020 Carl-Peter Forster joined as Non-Executive Director in June 2020 and became the Senior Independent Director in August 2020 David Lockwood joined as CEO in September 2020 David Mellors joined as CFO in November 2020 Lord Parker joined the Board as Non-Executive Director in November 2020
During the year, some members of the Board retired:
Ian Duncan and Jeff Randall retired from the Board in August 2020 Sir David Omand retired in March 2021 Archie Bethel retired as CEO in September 2020 Franco Martinelli retired as CFO in November 2020
Our 2021 AGM will see the retirement from the Board of Myles Lee and Victoire de Margerie as Non-Executive Directors after six years and five years of service respectively.
8 Babcock International Group PLC full year results for the full ended 31 March 2021
FINANCIAL REVIEW
Introduction This Financial review covers:
The changes we have made to the presentation of underlying reporting this year, with restatements to FY20
A summary of the contract profitability and balance sheet review (‘CPBS’)
Our financial performance in FY21, both statutory and underlying, including a reconciliation between the two
Improvements we intend to make to risk management and internal controls
Changes to the presentation of underlying reporting The Group provides alternative performance measures, including underlying measures, to enable users to better understand the performance and earnings trends of the Group. These measures are considered to provide a consistent measure of business performance from year to year. They are used by management to assess operating performance and as a basis for forecasting and decision making and the Group believes are helpful for investors to analyse business performance. We have made a series of changes to our underlying measures this year to improve transparency and provide a simpler set of accounts and financial commentary for the future. There are four main changes to the presentation of our underlying results as outlined below.
1) Joint ventures and associates Previously the Group incorporated its share of the results of joint ventures and associates into each of the main captions of the income statement. Babcock’s share of joint ventures and associates profit after tax is now included as one line in the income statement. The Group used to include a share of joint ventures and associates revenue within its revenue line – which was then defined as underlying revenue. This definition is therefore no longer needed. This aligns revenue with the statutory IFRS measure and reduces the number of reconciling items between statutory and underlying income statement captions.
2) IFRIC12 Investment Income The group previously included IFRIC 12 investment income within underlying operating profit. This is now included within investment income to align with IFRS. The restated underlying income statement compared to that presented in the prior year financial statements is shown below. Note that the correction of prior year errors is covered on page 11.
Share of results from joint ventures and associates - 58.6 - - 58.6
Investment income - - 1.1 - 1.1
Finance costs (95.8) 22.8 - - (73.0)
Underlying profit before tax 428.4 (24.3) - (39.8) 364.3
Tax (77.1) 17.9 1.2 (9.4) (67.4)
Underlying profit after tax 351.3 (6.4) 1.2 (49.2) 296.9
Underlying basic EPS 69.1p 58.4p
*includes £1.2 million deferred tax movement as a result of changes in statutory tax rates
3) A clearer definition of underlying operating profit and Specific Adjusting Items
Underlying operating profit is now defined as IFRS statutory operating profit adjusted for Specific Adjusting Items. Items such as these may occur regularly, may be lumpy and may be profits or losses. As such they distort the reporting of underlying business performance measures if not adjusted for. The Specific Adjusting Items are:
Amortisation of acquired intangibles
Business acquisition, merger and divestment related items (being acquisitions and gains or losses on disposal of assets or businesses)
Gains, losses and costs directly arising from the Group’s withdrawal from a specific market or geography, including closure costs, severance costs, the sale of assets and termination of leases
The costs of large restructuring programmes which significantly exceed the minor restructuring which occurs every year as part of the normal day to day business. Where restructuring costs are incurred as a result of the on-going execution of day to day business, they are included in operating costs and are not excluded from underlying operating profit
Profit or loss from amendment, curtailment, settlement or equalisation of Group pension schemes
Exceptional items that are significant, non-recurring and outside of the normal operating practice. These items are described as exceptional in order to appropriately represent the Group’s underlying business performance
Babcock International Group PLC full year results for the year ended 31 March 2021 9
The income statement can now be shown in a ‘three column’ format with Underlying results, Specific Adjusting Items and Statutory results in separate columns as shown below:
Share of results of joint ventures and associates (13.1) – (13.1) 58.6 – 58.6
Investment income 0.9 – 0.9 1.1 – 1.1
Finance costs (62.1) – (62.1) (73.0) – (73.0)
(Loss)/profit before tax (101.9) (1,615.4) (1,717.3) 364.3 (453.2) (88.9)
Income tax benefit/(expense) (18.4) 33.7 15.3 (67.4) 40.5 (26.9)
(Loss)/profit after tax for the year (120.3) (1,581.7) (1,702.0) 296.9 (412.7) (115.8)
Basic EPS (23.8)p (337.0)p 58.4p (23.3)p
Diluted EPS (23.8)p (337.0)p 58.3p (23.3)p
Note: the performance review on page 14 considers these results in more detail, they are shown here for presentational purposes.
4) Presentational changes to the underlying cash flow statement The Group has historically presented an underlying cash flow statement with free cash flow as an important measure. Previously cash flows relating to exceptional items were excluded from free cash flow. This has now been changed to more clearly present the cash generated from the Group’s operations. Also, following the introduction of IFRS16 (Leases), the Group previously deducted new lease commitments in entirety from operating cash flow. We have now amended this to show the capital element of leases as an operating cash flow (akin to capital expenditure) and the interest element of leases within the interest line. The lease commitment is now shown as a change in net debt when signed, not an operating cash flow. The restated FY20 underlying cash flow is shown below.
10 Babcock International Group PLC full year results for the full ended 31 March 2021
Restatement of FY20 underlying cash flow
Underlying FY20
previously
reported
Prior year restatements
Changes to cash flow
presentation
Underlying
FY20
restated
£m £m £m £m
Operating profit 417.4 (39.8) - 377.6
Depreciation & amortisation 95.7 (4.7) - 91.0
ROU asset depreciation 129.4 (6.1) - 123.3
Non-cash items 5.4 (2.9) (1.1) 1.4
Working capital (26.8) 16.0 - (10.8)
Provisions (19.4) 9.4 - (10.0)
Net capital expenditure (147.5) 39.0 - (108.5)
IFRS 16 new lease commitments (109.8) - 109.8 -
Capital element of lease payments - - (175.0) (175.0)
Operating cash flow 344.4 10.9 (66.3) 289.0
Cash conversion % 83% - - 77%
Pension contributions in excess of income statement (70.2) - - (70.2)
Interest paid (71.4) - 1.1 (70.3)
Tax paid (62.6) - - (62.6)
Dividends from joint ventures 52.0 - - 52.0
Exceptional items - - (82.4) (82.4)
Free cash flow 192.2 10.9 (147.6) 55.5
Acquisitions and disposals net of cash acquired (0.8) - 105.5 104.7
Exceptional cash flow 23.1 - (23.1) -
Capital element of lease payments - - 175.0 175.0
IFRS 16 additions - (7.3) (109.8) (117.1)
Investments in joint ventures (0.3) - - (0.3)
Own shares (2.9) - - (2.9)
Dividends paid (153.9) - - (153.9)
Net cash outflow 57.4 3.6 - 61.0
Opening net debt (previously reported) (957.7) - - (957.7)
Opening net debt (restated) (957.7) (113.5) - (1,071.2)
IFRS 16 transition (640.8) - - (640.8)
Exchange movements (53.8) - - (53.8)
Movement in net debt 57.4 3.6 - 61.0
Closing net debt (1,594.9) (109.9) - (1,704.8)
Note: the two main items in the correction of prior year errors impacting net debt are the movement of supply chain finance balances from trade creditors to debt (£113.5 million at 1 April 2019, £93.2 million at 31 March 2020) and the inclusion of certain lease liabilities (31 March 2020: £16.7 million).
Babcock International Group PLC full year results for the year ended 31 March 2021 11
Contract profitability and balance sheet review As announced in January 2021, the Group performed a review of the profitability of its contract portfolio, and the carrying values of assets and liabilities on the balance sheet. The review was carried out by management using the expertise and resource of an independent accounting firm. The initial year end financial close occurred in early April before completion of the CPBS. On 13 April 2021, the Group announced the initial headline unaudited results for FY21 before the impact of CPBS, along with an early estimate of the CPBS findings. The annual goodwill impairment test, required by IAS 36, was included within the scope of the CPBS review.
The CPBS scope covered over 100 contracts, representing c.£2.7 billion of annual revenues. The selected contracts received differing levels of review depending upon their perceived risk. Those contracts deemed high risk had a full review of their status, underpinning assumptions and risks and dependencies. Those deemed medium risk had a specific scope review with work targeted at any specific areas of concern, and those deemed low risk had a review with the project manager to gain an understanding of the contract and assess whether any specific scope work should be performed. The balance sheet reviews covered all main balance sheet captions for all sectors, again prioritising balances on a risk basis. As the reviews progressed, more work was performed on contracts where findings raised issues that had not been considered in the initial scoping reviews. More than 140 accounting adjustments totalling £2.0 billion (post-tax effect on retained earnings) resulted from the CPBS consisting of:
Cumulative restatement at 1 April 2019 of £308.1 million - being £45.3 million relating to a change in accounting policy and correction of prior year errors of £262.8 million)
Cumulative restatement at 1 April 2020 of £230.7 million - being £59.8 million relating to a change in accounting policy and correction of prior year errors of £170.9 million)
Changes recorded within the current financial year of £1,813.7 million - the vast majority of which are change in estimates, including the impairment of goodwill
Of the adjustments recorded in the current year income statement (see table below), £274.7 million were charged within underlying operating profit and the vast majority of these amounts related to changes in estimates. Their inclusion within underlying operating profit reflects the fact that the occurrence of such transactions, when taken individually, are part of the ordinary course of business. However, the number and magnitude of the adjustments as a result of the CPBS far exceed what would normally be expected in the Group in any one period, hence the additional disclosure. In order to assist the users of the financial statements to better understand the effect of the transactions resulting from the CPBS on FY21 underlying operating profit performance, we have analysed them into ‘one-off CPBS adjustments’ and ‘recurring CPBS adjustments’. It is accepted that these terms are not defined in IFRS and are simplistic. For this purpose, we consider ‘one-off CPBS adjustments’ to be those that adjust the level of profit recognised either as a result of a one-off event or in previous periods, while ‘recurring CPBS adjustments’ are those that impact the amount of current period (and potentially future) profit before completion of the CPBS review. A single adjustment arising from the CPBS review might have both ‘one-off’ and ‘recurring’ elements. By way of illustration, the write-off of a long overdue debtor can be thought of as a ‘one off CPBS adjustment’ as – with today’s facts and circumstances – it would be a single transaction that would not otherwise impact the current or future year’s profitability. However, a long term contract that has had its profit margin reduced creates an adjustment that has the effect of reducing the cumulative profit recognised over the life of the contract from the old profit margin estimate to the new. An element of this adjustment can be seen to in effect reverse the profit on these contracts that had been recognised in FY21 (before completion of CPBS review). This element is included within ‘recurring CPBS adjustments’ whereas the remainder of the adjustment, simplistically relating to the profit previously recognised before FY21, is included within ‘one-off CPBS adjustments’. The total of the ‘recurring CPBS adjustments’ within FY21 underlying operating profit is £24.7 million, and £250.0 million ‘one-off CPBS adjustments’ make up the total of £274.7 million included within underlying operating profit.
Prior year restatements There are a number of prior year errors that have been recognised which are detailed in note 4 in the financial statements. Adjustments are denoted as errors, rather than changes in estimates, when it has been identified that assumptions or methodologies were used which the Group should have known at the time were incorrect. One accounting policy has also been changed to better represent certain maintenance arrangements in the Aviation sector, and the errors and the policy change result in prior year restatements – see note 4 in the financial statements for details. Prior year restatements were recorded in the 1 April 2019 opening balance sheet in these financial statements, unless they resulted from an error during FY20 in which case they were recorded in the FY20 income statement. The accounting policy change and some of the prior year errors have a consequential impact on financial results for future periods (e.g. the decision to expense certain aircraft maintenance charges rather than capitalise them will have a recurring impact). Where this is the case, those recurring impacts are included in the relevant years in the table below for completeness – and are also included in the ‘recurring CPBS adjustments’ figure above.
12 Babcock International Group PLC full year results for the full ended 31 March 2021
The impacts of the CPBS adjustments on the income statement, including the results of the annual goodwill impairment test, are summarised as follows:
2021 2020
Underlying
£m
Specific
Adjusting
Items
£m
Statutory
£m
Underlying
£m
Specific
Adjusting
Items
£m
Statutory
£m
Revenue impacts (207.4) – (207.4) (21.0) – (21.0)
Operating profit/(loss) impacts
Impairment/disposal of goodwill and acquired intangible assets – (1,349.4) (1,349.4) – 130.5 130.5
Impairment of non-current assets (5.8) (32.7) (38.5) 0.7 – 0.7
Impairment/reversal of property, plant and equipment and right of use assets – (156.9) (156.9) (21.6) (1.4) (23.0)
Impairment/write down of current assets (142.6) (0.8) (143.4) (19.5) – (19.5)
Introduction of/increase to liabilities (126.3) (1.0) (127.3) 0.6 – 0.6
Share of income from JVs and associates (37.1) – (37.1) – – –
Profit/(loss) before tax impacts (311.8) (1,540.8) (1,852.6) (39.8) 129.1 89.3
Tax adjustments (7.5) - (7.5) (12.4) – (12.4)
Tax effect 29.3 17.1 46.4 3.0 (2.5) 0.5
Loss after tax impacts (290.0) (1,523.7) (1,813.7) (49.2) 126.6 77.4
Summarised cumulative adjustments to retained earnings, including the results of the annual goodwill impairment test, are as set out below:
£m
Restatement as at 1 April 2019 (308.1)
Adjustments recognised in the year ended 31 March 2020 77.4
Total restatement at 31 March 2020 (230.7)
Adjustments recognised in the year ended 31 March 2021 (1,813.7)
Total adjustments recognised at 31 March 2021 (2,044.4)
The summary of the adjustments in the table above is set out below: Revenue: These adjustments have two components within them. Firstly is a correction of an error where revenue had been recognised on the Phoenix contract after the terms had been varied in February 2020. The effect of the contract change is that Babcock is deemed an agent of the customer, not a principal, and therefore the revenue should not be recognised. As a result of identifying this error, £71.8 million of revenue initially recognised in FY21 was reversed together with £11.6 million of revenue in relation to FY20. The second component of revenue adjustments reflects reassessments of the progress and profitability of a number of contracts across the Group. Impairment of goodwill and acquired intangible assets: In the current year, goodwill was impaired by £1,243.2 million and acquired intangible assets were impaired by £56.4 million. As detailed in note 10 of the financial statements, the impairments of the Land and Aviation sectors’ goodwill of £425.8 million and £817.4 million respectively were largely as a result of reduced forecasts of future cash flows and an increase in the discount rate used to discount them. CPBS adjustments of £64.8 million were also recorded to allocate the goodwill that should have been allocated to the Holdfast disposal (June 2020) and to correct the allocation of goodwill to the Conbras disposal (October 2020 and provided in the first half of the financial year). As detailed in note 10 of the financial statements, £56.4 million was impaired in relation to the DSG contract acquired intangible as its carrying value could no longer be justified following the reassessment of the contract profitability. Partially offsetting this is the reversal of amortisation of £15.0 million in relation to the Oil and Gas business acquired intangible reflecting management’s judgement to derecognise this intangible at 1 April 2019 as a prior period error, as a result of a reassessment of its useful economic life. Previously a goodwill impairment of £395.0 million was recorded in FY20 against the Aviation sector goodwill. The credit of £130.5 million within FY20 shown above is a reduction to that impairment and is the result of three prior year errors. Firstly, credits of £239.2 million and £5.1 million reflect the cumulative amount of prior year errors to the capital employed in the Aviation and Land operating segments respectively – and therefore reduce the amount that should have been impaired in FY20. Secondly, a calculation error in the FY20 impairment test of Land goodwill creates a charge of £127.7 million and, thirdly, the reduced intangible amortisation in relation to the Oil and Gas business was a credit of £13.9 million.
Babcock International Group PLC full year results for the year ended 31 March 2021 13
Impairment of other non-current assets: The FY21 adjustment within underlying operating profit largely relates to the write off of a loan to one of our joint ventures which is no longer deemed recoverable. The £32.7 million within FY21 Specific Adjusting Items is largely due to the impairment of internally generated intangibles, mainly computer software. Impairment of property, plant and equipment and right of use assets: As detailed in notes 12 and 13 of our financial statements, impairments of £156.9 million largely relate to fleet values in the Aviation sector where aircraft carrying values are no longer expected to be recovered through use or sale. Also included are impairments of leasehold property (£12 million) and plant and equipment of £11 million. The prior year error of £21.6 million within underlying profit is all from the Aviation sector and relates to the expensing of previously capitalised maintenance and the reversal of aircraft vendor credit notes previously recognised. See note 4 of our financial statements for details on prior year errors. Impairment / write down of current assets: This covers the reassessment of several contract profitability margins and the recoverability of many trade and other receivables (including contract assets and accrued income) as well as an increase in obsolescence provisions for inventory. This is the summation of many contract reassessments across the Group with £62.0 million in Aviation, £36.6 million in Land, £21.8 million in Marine and £20.6 million in Nuclear. The prior year error of £19.5 million relates to Aviation and corrects the capitalisation of mobilisation and other costs as well as revenue milestones incorrectly recognised for aircraft deliveries. Introduction of / increase to liabilities: These increases reflect reassessment of several contract profitability margins, onerous contract provisions, aircraft maintenance accruals, and other provisions. £72.6 million are in the Aviation sector, £35.5 million in Land and £11.4 million in Marine. Around £60 million of the liabilities are expected to outflow beyond one year. Share of income from joint ventures and associates Historically the Group adjusted the results of the joint ventures and associates before equity accounting the relevant share in the income statement. The Group has now decided such results should be incorporated without adjustment by the Group – unless required to align with IFRS. In the prior periods the Group’s share of joint venture and associates results have been adjusted by £23.1 million cumulatively, and a charge of this amount is booked as a change in estimate in FY21 to reverse these amounts. In addition, following the termination of the Group’s Dounreay decommissioning contract on 31 March 2021, as a consequence of the NDA’s decision to take contract delivery in-house, the Group booked an adjustment of £10.9 million to reflect the estimated contract settlement with the NDA. Contract settlements remain outstanding in relation to works carried out some years ago by the Land sector’s ABC joint venture and, following developments during the year, a further adjustment of £3.1million was recorded and represents an updated assessment of the contract outcomes. Tax adjustments: The underlying FY21 impact of £7.5 million consists of the write off of deferred tax assets in Spain now considered not recoverable within the Group’s forecasting horizon, together with a £21.6 million credit, being the recognition of tax deductibility on the DSG contract intangible amortisation now confirmed with HMRC. The prior year error of £12.4 million is the write off of a deferred tax asset incorrectly calculated in the prior year. Change in accounting policy: During the year management amended the Group’s accounting policy regarding Power By the Hour agreements. At 31 March 2021 this change in policy reduces property, plant and equipment by £65.6 million and trade and other receivables by £3.1 million and increases trade and other payables by £8.1 million.
Material balance sheet reclassifications All balance sheet reclassifications are shown in note 4 of the financial statements. The materials ones are covered below. Supply chain financing: The Group entered into certain Supply Chain Financing Facilities (‘SCF arrangements’) in the Aviation operating segment. Outstanding balances financed through those arrangements were previously classified within trade payables. The Group has reassessed this classification and has determined that these liabilities should be reclassified as bank and other borrowings. This has also resulted in an increase to property, plant and equipment, trade and other receivables, and other borrowings, as part of the Supply Chain Financing Facilities has been used for deposits on aircraft. At 1 April 2019, correction of this error results in an increase in property, plant and equipment of £54.7 million, an increase in trade and other receivables of £21.6 million, an increase in bank and other borrowings of £113.5 million and a reduction in trade and other payables of £37.2 million. At 31 March 2020, correction of this error results in an increase in bank and other borrowings of £93.3 million, an increase in property plant and equipment of £32.9 million and a reduction in trade and other payables of £60.4 million. This adjustment also impacts on the cash flow statement, resulting in an increase in cash flows from financing activities and reduction in cash flows from operating activities. Cash pool arrangement: An error has been identified in relation to the accounting for the Group’s notional cash pool arrangement. Cash and cash equivalents and bank and other borrowings should have been presented on a gross rather than net basis, in line with the requirements of IAS 32 Financial Instruments: Presentation (‘IAS 32’). The correction of this error results in increases in cash and cash equivalents and bank other borrowings of £569.5 million at 1 April 2019 and £494.5 million at 31 March 2020. There is no impact on the income statement.
14 Babcock International Group PLC full year results for the full ended 31 March 2021
FY21 performance In order to simplify the presentation of underlying and statutory financial performance, the Group has adopted a three-column approach to the income statement. The first column below shows the underlying results with the second column showing the Specific Adjusting Items. The third column shows the statutory results. Details of the Specific Adjusting Items are included in note 2 of the financial statements.
Share of results of joint ventures and associates (13.1) – (13.1) 58.6 – 58.6
Investment income 0.9 – 0.9 1.1 – 1.1
Net finance costs (62.1) – (62.1) (73.0) – (73.0)
(Loss)/profit before tax (101.9) (1,615.4) (1,717.3) 364.3 (453.2) (88.9)
Income tax benefit/(expense) (18.4) 33.7 15.3 (67.4) 40.5 (26.9)
(Loss)/profit after tax for the year (120.3) (1,581.7) (1,702.0) 296.9 (412.7) (115.8)
Basic EPS (23.8)p (337.0)p 58.4p (23.3)p
Diluted EPS (23.8)p (337.0)p 58.3p (23.3)p
Statutory performance Revenue is now the same on a statutory and underlying basis as set out on page 8. Revenue of £4,182.7 million was 6% lower than last year including foreign exchange movements and disposals. Excluding these, revenue was down 3% organically with reductions due to COVID-19 and the CPBS adjustments only partly offset by other trading growth. The statutory operating loss was £1,643.0 million in the year (2020: £75.6 million loss), mainly as a result of charges taken in our CPBS and our annual review of goodwill impairment as discussed in detail on page 11. Compared to the prior year, this was exacerbated by the impact of COVID-19 and significant credits that benefited the results in FY20. These items are discussed in more detail on page 16. The share of results of joint ventures and associates was much lower than the prior year due to the termination and disposal of certain investments and the CPBS impact outlined on page 11. Net finance costs reduced from the prior year due to the lower level of debt. Our statutory loss before tax was £1,717.3 million (2020: £88.9 million loss), again reflecting the CPBS charges. Basic earnings per share, as defined by IAS 33, was (337.0) pence (2020: (23.3) pence) per share. Exceptional items Details of exceptional items recognised in FY21 within the Specific Adjusting Items column in the year are shown in note 2 of the financial statements. For the 2022 financial year we expect exceptional charges of around £50 million relating to the operating model restructuring charge (c.£40 million) and previously announced restructuring programmes (c.£10 million). We intend to restrict the use of exceptional items in future periods following a tightening of definition this year.
Babcock International Group PLC full year results for the year ended 31 March 2021 15
Underlying results For the most useful comparison to last year, and as a better measure for future periods, we focus on the Group’s underlying operating profit excluding the one-off CPBS adjustments. This is believed to the most helpful measure for stakeholders to judge our performance this year.
Land 1,522.5 (50.8) (30.5) (118.5) (140.9) (71.7) 1.110.1
Aviation 845.5 11.8 - (44.6) (19.0) 60.7 854.4
Total 4,428.5 (41.9) (59.4) (145.3) (207.4) 208.2 4,182.7
Revenue for the year was £4,182.7 million, down 6% compared to last year but down 3% organically (i.e. excluding FX and disposals). The table above shows the main comparison variances of revenue performance against last year.
Specifically on each main variance:
FX impact – this primarily relates to FX translation on the results of the South African business.
Disposals of businesses – this is the lower revenue from Context (sold in March 2020), Conbras (sold in October 2020) and the civil nuclear manufacturing business (sold in September 2020).
Impact of COVID-19 – this reflects the impact of the COVID-19 pandemic across the Group, with the most significant impact being in many of our Land businesses including South Africa, airports and civil training. Lower flying hours in the early stages of the pandemic also impacted the Aviation sector. Conversely, COVID-19 led to slightly more revenue in Marine and Nuclear as activity levels were increased, for example for the design and manufacture of ventilators. This COVID-19 impact has been estimated across our sectors and based on an analysis of direct and indirect impacts, which include a significant degree of judgement.
FY21 CPBS impacts – the most significant item is the de-recognition of revenue from the Phoenix contract in Land following a contract change in February 2020 which resulted in our contract relationship changing from principal to agent. The remaining revenue decreases are a result of the reassessment of progress and profitability on many of the Group’s contracts.
Other trading – this relates to revenue movements excluding all the items above. Revenue grew across three of the sectors, with the strongest growth coming in Marine which was driven by increased activity on our Type 31 frigate programme. Growth in Nuclear was due to higher activity, especially in infrastructure projects, while growth in Aviation came from new contracts. The decline in revenue in Land includes the impact of the loss of our Heathrow airport baggage handling contract, which ended half way through the year.
Revenue of £4,183 million differs from the unaudited draft figure of £4,690 million given in our April 2021 business update as this figure included £290 million share of revenue from joint ventures and associates and excluded the £207 million adjustment to revenue from our CPBS as shown in the table above. Further analysis of our revenue performance is included in each sector’s operating review on pages 26 to 30.
16 Babcock International Group PLC full year results for the full ended 31 March 2021
Underlying operating profit performance The underlying operating loss in the year was £27.6 million. This differs from the unaudited draft figure of £307 million given in our April 2021 update as this figure included £62 million from joint ventures and associates and IFRIC 12 income and did not include the impacts of the CPBS. This performance compares to £377.6 million underlying operating profit last year, as restated on page 8 for the change in presentation of joint ventures and associates and the correction of prior year errors and a change in accounting policy. Excluding the one-off CPBS adjustments, FY21 underlying operating profit was £222.4 million. This measure is deemed to be the most useful measure to compare to last year, and a better measure to compare with future periods. Underlying operating profit bridge from FY20 to FY21 (before one-off CPBS adjustments):
Total 377.6 (5.4) (3.7) (46.7) (45.6) (24.7) (29.1) 222.4
The main variances year-on-year are:
FX impact – this primarily relates to FX translation on the results of our South African business.
Disposals of businesses – this is the lower profit contribution from Context (sold in March 2020) and Conbras (sold in October 2020) partly offset by the lack of an operating loss in the civil nuclear manufacturing business disposed of in the year.
Significant credits in FY20 – these relate to significant credits that benefited underlying operating profit in FY20. These credits included a higher level of R&D tax credits due to a catch up on previous years’ claims. The majority of other FY20 credits were in the civil aviation business, and include multi-year indexation claims on contracts and accrual and provision releases. The FY20 credits in Marine and Land were mostly accrual releases.
Impact of COVID-19 – this reflects a range of direct and indirect costs from working through the COVID-19 pandemic. Direct costs included the purchase of personal protective equipment (PPE) and testing equipment. Indirect costs include site closures, lower activity and reduced efficiency due to social distancing. This COVID-19 impact has been estimated across our sectors and at Group based on an analysis of direct and indirect impacts, which include a significant degree of judgement. The estimated lower expenses, e.g. travel, have also been considered in this analysis.
FY21 recurring CPBS adjustment – these relate to the recurring impacts of the CPBS on underlying operating profit. The largest two items included within this are a more cautious view on the recognition of profit on the Type 31 frigate programme in Marine and a lower margin recognised on the DSG contract in Land.
Other trading – this relates to the movement in underlying operating profit after all of the above. Included within this movement was an increase in overheads and corporate costs in the year of around £10 million, with a less favourable allocation to Marine than in the previous year, partly explaining the sector’s decline in trading. Marine’s weaker trading also reflects lower profitability than last year on certain contracts and a charge from the loss of a legal case. The lower profit in Nuclear partly reflects the lower margin in the transition year of MSDF while the lower profit in Land reflects the loss of the Heathrow contract and operating gearing impact of the lower revenue. Aviation saw a small increase in underlying operating profit, after adjusting for the items above, as the benefits of the cost saving programme initiated last year were mostly offset by weaker trading.
Further analysis of our underlying operating profit performance is included in each sector’s operating review on pages 26 to 30. Share of results of joint ventures and associates The Group’s share of results in joint ventures (JVs) and associates was a loss of £13.1 million in the year, or a profit of £18.4 million excluding one-off CPBS adjustments. The reduction on last year of £40.2 million reflects the absence of Magnox (£2.2 million impact), a JV that ended in the 2020 financial year, a loss on the Dounreay JV (£9.5 million impact), the disposal of the Holdfast JV (£14.8 million impact) and lower recognised profit in our Aviation JVs and associates. The Group’s main joint ventures and associates at 31 March 2021 were:
Naval Ship Management (NSM) in our Marine sector, which maintains part of Australia’s naval fleet
ALC in our Land sector, which manages the UK Army’s construction vehicle fleet. This contract ended in May 2021
Ascent in our Aviation sector, which trains RAF pilots in the UK under the UK Military Flying Training System (UKMFTS) air training contract
AirTanker in our Aviation sector, which is responsible for the UK’s air-to-air refuelling capability and air transport operations. We increased our stake in this associate to around 15% in November 2020
Work in the Dounreay JV in our Nuclear sector ended on 31 March 2021 after the Nuclear Decommissioning Authority (NDA) announced the contract’s early termination in line with their “One NDA” strategy to move work in-house. The Group recognised a loss on the Dounreay contract in the year of £15.9 million (£5 million loss excluding one-off CPBS adjustments) reflecting the updated assumptions around contract milestone profit achievability in the reduced timeframe.
Babcock International Group PLC full year results for the year ended 31 March 2021 17
Finance costs Total net finance costs decreased to £61.2 million (2020: £71.9 million). Tax charge The tax charge on underlying profits / losses was £18.4 million (2020: £67.4 million), representing a notional rate of -20.7% (2020: 22.0%). The Group’s underlying effective rate of tax is calculated on underlying profit before tax excluding the share of income from joint ventures and associates (which is a post-tax number). Before the one off CPBS adjustments, the underlying effective rate of tax for the year was 21%. The Group’s effective rate of tax for FY22, as calculated on this basis, will be dependent on country profit mix and is currently expected to be around 23%. In the medium term, we expect our effective tax rate to increase in conjunction with UK corporation tax rate increases. Exchange rates The translation impact of foreign currency movements resulted in a decrease in underlying revenue of £42 million and a £5.4 million decrease in underlying operating profit excluding one-off CPBS adjustments. The main currencies that have impacted our results are the South African Rand and the Euro. The currencies with the greatest potential to impact our results are the Euro, the South African Rand and the Canadian Dollar:
A 10% movement in the Euro against Sterling would affect underlying revenue by around £40 million and underlying operating profit by around £2 million per annum
A 10% movement in the South African Rand against Sterling would affect underlying revenue by around £25 million and underlying operating profit by around £2.5 million per annum
A 10% movement in the Canadian Dollar against Sterling would affect underlying revenue by around £15 million and underlying operating profit by around £1 million per annum
Earnings per share Underlying earnings per share for the year was (23.8) pence (2020: 58.4 pence), reflecting the underlying operating loss. Disposal programme Our plan for disposals has been assessed and does not meet the criteria for any assets to be classed as held for sale under IFRS 5.
18 Babcock International Group PLC full year results for the full ended 31 March 2021
Cash flow and net debt
Our underlying cash flows are used by management to measure operating performance as they provide a more consistent measure of business performance year to year.
Closing net debt excluding operating leases (771.5) (1,055.4)
* see restatements summary on page 10.
Babcock International Group PLC full year results for the year ended 31 March 2021 19
Cash performance Changes in reporting As set out on page 9, we have updated our cash flow reporting to better reflect cash movements, with the cash payments relating to the capital element of leases included in underlying operating cash flow rather than net new lease commitments, which is reflected as a debt movement. We have also changed our definition of underlying free cash flow to include cash flows related to exceptional items. Underlying operating cash flow Underlying operating cash flow in the period after capital expenditure was £299.1 million compared to £289.0 million last year. This represented operating cash conversion of 134% on the underlying operating profit excluding one-off CPBS adjustments. The increase in cash generation year-on-year despite the significant fall in operating profit came from a large working capital inflow. Movements in working capital The movement in working capital for the period was a £128.0 million inflow compared to a £10.8 million outflow last year. FY21 benefited from the deferral of £56 million of VAT payments that will unwind in the next financial year. Cash flow in FY21 improved through advanced customer receipts across some of the Group’s businesses. As in previous years, working capital benefited from creditor payment phasing around period end, which we will now move away from over time. Working capital also continued to benefit from period end receivables factoring in Southern Europe, which was £102 million at 31 March 2021 (31 March 2020: £98 million). Capital expenditure Net capital expenditure of £171.1 million in the year was significantly higher than last year (2020: £108.5 million), reflecting the start of our investment in a new facility to build Type 31 frigates in Rosyth and increased net capital expenditure in Aviation, partly reflecting lower disposal proceeds given fewer aircraft disposals. It is expected that net capital expenditure will continue to be high in FY22 as we continue the Type 31 investment and increase investment in other areas of the business, including upgrading facilities and IT equipment. Cash interest paid Net Group cash interest paid, excluding that paid by joint ventures and associates, was £66.6 million (2020: £70.3 million). Taxation Cash tax in the year was an inflow of £18.4 million, helped by a receipt of £67 million of corporation tax repayments in the final quarter. We currently expect a cash tax outflow of around £30 million in FY22. Pensions Pension cash outflow in excess of the income statement charge (excluding exceptional charges for curtailment losses) was £73.5 million (2020: £70.2 million). For FY22, the cash outflow in excess of the income statement charge is expected to be around £130 million. This includes a £50 million additional payment into the Rosyth scheme made in April 2021 and an additional £10 million payment into the BIG scheme. An additional £50 million payment into the Rosyth scheme, and a further £10 million contribution to the BIG scheme have been agreed to be made in April 2022. Dividends from joint ventures and associates
During the period the Group received £36.8 million in dividends from its joint ventures and associates (2020: £52.0 million). We expect dividends from joint ventures and associates to be around £30 million in the next financial year. Exceptional cash flows Cash outflows related to exceptional items were £44.7 million compared to £82.4 million last year. These costs included exits and restructuring costs. In FY22, we anticipate exceptional cash outflows of around £70 million, including around £50 million of reorganisation costs related to implementing our new operating model (c.£40 million) and completing the existing restructuring programme in Aviation (c.£10 million). In addition to this, there may be cash settlements for the Italy antitrust fine, see page 24. Underlying free cash flow Underlying free cash flow of £169.5 million was significantly higher than last year’s £55.5 million and partly reflects the working capital timing benefits and corporation tax repayments. Acquisitions and disposals The net cash inflow from acquisitions and disposals was £90.6 million, including net disposal proceeds from the sale of Holdfast (£85.0 million) and Conbras (£6.6 million). In addition, the Group increased its stake in the AirTanker associate. We aim to generate at least £400 million of disposal proceeds in the next 12 months.
20 Babcock International Group PLC full year results for the full ended 31 March 2021
New lease arrangements In addition to net capital expenditure, and not included in free cash flow, £82.3 million (FY20: £117.1 million) of additional leases were entered into in the period. These represent new lease obligations and so are included in our main net debt figure but do not involve any cash outflows at inception. Net debt The Group’s net debt at 31 March 2021 was £1,353.6 million, or £771.5 million excluding operating leases (broadly in line with the early indication of £750 million reported in our April 2021 business update). Net debt excluding lease obligations was £283.9 million lower than last year and reflects the free cash flow and net divestments discussed above. As in previous periods, average net debt during FY21 was higher than the closing balance at 31 March 2021, partly reflecting the phasing of creditor payments around period end. Average net debt over the 2021 financial year was around £1.3 billion, compared to around £1.6 billion last year, with this calculation being based on each month end balance. Our net debt now includes balances related to the use of supply chain financing in the Group with extended credit terms. At 31 March 2021 the amount included was £25 million (31 March 2020: £93 million). We are phasing out the use of supply chain financing across the Group. Funding and liquidity As announced on 13 April 2021, the Group has been in discussions with its lending banks to prudently secure protection to the potential downside risks in our scenario planning. This includes ensuring sufficient headroom under severe but plausible scenarios. In May 2021, the Group:
Signed a new three-year revolving credit facility (‘RCF’) of £300 million that expires in May 2024. This is in addition to the £775 million RCF that expires in August 2025
Clarified the definition of underlying results used in covenant calculations to ensure that any one-off impacts from the Group’s contract profitability and balance sheet review (‘CPBS’) do not impact the calculation
Agreed a temporary amendment to the net debt to EBITDA ratio covenant from 3.5 times to 4.5 times for the measurement periods ending 30 September 2021 and 31 March 2022
At 31 March 2021, the Group’s net cash balance was £531 million. This combined with the undrawn element of our RCF gave us liquidity headroom of around £1.2 billion. We repaid the US Private Placement of $500 million, which was hedged at £307 million, in March 2021. This was funded from existing Group cash resources. As of July 2021, the Group had access to a total of £2.4 billion of borrowings and facilities of mostly long-term maturities. These comprised:
€550 million bond maturing 6 October 2022 (in April 2021 this was hedged at £482 million)
New £300 million 3-year RCF maturing 20 May 2024 (signed on 20th May 2021)
£775 million revolving credit facility (RCF) maturing 28 August 2025
£300 million bond maturing 5 October 2026
€550 million bond, hedged at £493 million, maturing 13 September 2027
Committed overdraft facility of £50 million Capital structure An important part of the transformation of Babcock is the strengthening of the balance sheet. Whilst there are several facets to balance sheet strength, the primary measurement relevant to Babcock is the net debt / EBITDA gearing ratio within our debt covenants, which was 2.5x at 31 March 2021. The covenant level is 3.5 times, increased to 4.5 times until March 2022. Our near-term priority is to reduce the gearing ratio to below 2x. There are some short-term headwinds to reducing the gearing. Free cash flow is expected to be negative in FY22 and HY23 as certain material cash outflows – particularly additional pension contributions and restructuring - have already been committed. Additionally, we intend to gradually unwind the gap between period end and average net debt. The planned disposal proceeds of at least £400 million over the next twelve months will provide the funds to support strengthening the balance sheet. Despite the clear priority to delever the balance sheet, the Group will continue to invest organically in the business as this will be key to driving value in the medium term. As we announced in April 2021, we aim to return to strength without the need for an equity issue. In the next 12-18 months, once the disposal programme is complete, we will reassess the appropriate capital structure for the future of the Group.
Babcock International Group PLC full year results for the year ended 31 March 2021 21
Net debt to EBITDA (covenant basis) This is the measure used in the covenant in our revolving credit facilities (RCF) and makes a number of adjustments from reported net debt and EBITDA. The covenant level is 3.5 times - amended to 4.5 times until 31 March 2022. Our net debt to EBITDA increased to 2.5 times at 31 March 2021 as the reduction in net debt, reflecting free cash flow generation and disposal proceeds, was more than offset by the decrease in EBITDA.
EBITDA + JV and associates dividends (covenant basis) 355.4 503.6
Net debt (771.5) (1,055.4)
Covenant adjustments** (103.6) (94.9)
Net debt (covenant basis) (875.1) (1,150.3)
Net debt / EBITDA 2.5x 2.3x
* various adjustments made to EBITDA to reflect accounting standards at the time of inception of the original RCF agreement. The main adjustments are to
the treatment of leases within operating profit and pension costs
** removing loans to JVs, finance lease receivables and adjusting for an average FX rate for the previous 12 months
Interest cover (covenant basis) This measure is also used in the covenant in our revolving credit facility (RCF), with a covenant level of 4.0 times.
31 March 2021 £m
31 March 2020
Restated £m
EBITDA (covenant basis) + JV and associate dividends 355.4 503.6
Finance costs (55.6) (61.2)
Finance income 11.7 13.0
Covenant adjustments (0.2) 0.2
Net Group finance costs (43.7) (48.0)
Interest cover 8.1x 10.5x
Return on invested capital, pre-tax (ROIC) This measure is one of the Group’s key performance indicators (KPIs).
31 March 2021 £m
31 March 2020
Restated £m
Underlying operating profit (27.6) 377.6 Share of JV PAT (13.1) 58.6
Underlying operating profit plus share of JV PAT (40.7) 436.2
Underlying operating profit excl. one off CPBS impacts 222.4 377.6
Share of JV PAT excl. one-off CPBS impacts 18.4 58.6
Underlying OP plus share of JV PAT excl. one off CPBS adjustments 240.8 436.2
Net debt excluding operating leases 771.5 1,055.4
Operating leases 582.1 649.4
Shareholder funds 243.4 2,314.8
Retirement deficit / (surplus) 293.1 (145.2)
Invested capital 1,890.1 3,874.4
ROIC (pre-tax) (2.2)% 11.3%
ROIC excl. one off CPBS adjustments (pre-tax) 12.7% 11.3%
22 Babcock International Group PLC full year results for the full ended 31 March 2021
Pensions The Group has a number of defined benefit pension schemes. The principal defined benefit pension schemes in the UK are the Devonport Royal Dockyard Pension Scheme, the Babcock International Group Pension Scheme and the Rosyth Royal Dockyard Pension Scheme. The nature of these schemes is that the employees contribute to the schemes with the employer paying the balance of the cost required. The contributions required and the assessment of the assets and the liabilities that have accrued to members and any deficit recovery payments required are agreed by the Group with the trustees of each scheme who are advised by independent, qualified actuaries. The Group’s balance sheet includes the assets and liabilities of the pension schemes calculated on an IAS 19 basis. At 31 March 2021, the net position was a deficit of £293.1 million compared to a net surplus of £145.2 million at 31 March 2020. These valuations are based on discounting using corporate bond yields. Bond credit spreads were unusually high in March 2020 given the onset of the COVID-19 pandemic. They have now reverted to a more normal level causing a significant increase in benefit obligations. The fair value of the assets and the present value of the liabilities of the Group pension schemes at 31 March were as follows:
Total liabilities 4,344.0 369.6 364.4 5,078.0 3,790.8 297.5 177.8 4,266.1
Net assets / (liabilities) recognised in the statement of financial position (180.5) (104.0) (8.6) (293.1) 198.4 (56.1) 2.9 145.2
* The matching assets aim to hedge the liabilities and consist of gilts, repos, cash and swaps. They are shown net of repurchase obligations of £2,177 million (2020: £2,033 million).
Babcock International Group PLC full year results for the year ended 31 March 2021 23
Analysis of movement of pensions in the Group statement of financial position The movement in net deficits for the year ending 31 March 2021 is as a result of the movement in assets and liabilities shown below.
2021
2020
Principal schemes
£m
Railways scheme
£m
Other schemes
£m Total
£m
Principal schemes
£m
Railways scheme
£m
Other schemes
£m Total
£m
Fair value of plan assets (including reimbursement rights)
At 1 April 3,989.2 241.4 180.7 4,411.3 4,104.7 246.6 230.9 4,582.2
At 31 March 4,344.0 369.6 364.4 5,078.0 3,790.8 297.5 177.8 4,266.1
Net surplus/(deficit) at 31 March (180.5) (104.0) (8.6) (293.1) 198.4 (56.1) 2.9 145.2
* Settlement effect in Other schemes is a result of a transfer of assets and liabilities from the Babcock Naval Services Pension Scheme back into the Principal Civil Service Pension Scheme. As the Group is reimbursed by MOD for any contributions payable to this scheme, the settlement has an equal impact on both the value of the benefit obligations and the plan assets, hence it is neutral in terms of both the income statement and other comprehensive income,
An estimate of the technical provisions actuarial deficits as at 31 March 2021 for the principal schemes was around £270 million, predominantly reflecting discount rates based on UK gilts – which differs from the corporate bond approach of IAS 19. This technical provisions estimate is based on the assumptions used within the latest agreed valuation prior to 31 March 2021 for each of the three main schemes, and therefore does not fully allow for the impact of RPI reform which will be fully reflected in future technical provisions valuations. Discount rate: 2.0% (31 March 2020: 2.4%) Inflation rate (RPI): 3.2% (31 March 2020: 2.6%)
Cash contributions
FY22e
£m
FY21
£m
FY20 £m
Future service contributions 23.2 24.2 26.0
Deficit recovery 111.9 51.6 47.3
Longevity swap 16.8 16.3 15.3
Total cash contributions — employer 151.9 92.1 88.6
Cash contributions made by the Group into the defined benefit pension schemes, excluding expenses and salary sacrifice contributions, during the last financial year are set out in the table above. In FY22, the total cash contributions expected to be paid by the Group into the defined benefit pension schemes are £160.7 million including £8.8 million for salary sacrifice contributions. £23.2 million is in respect of the cost of future service accrual, £111.9 million is to recover deficits over periods of time agreed with the Trustee and an additional £16.8 million is in respect of the three longevity swaps transacted for each of the largest schemes during 2009/10 to mitigate the financial impact of increasing longevity.
24 Babcock International Group PLC full year results for the full ended 31 March 2021
Income statement charge The charge included within underlying operating profit in FY21 was £35 million, of which £28 million related to service costs and £7 million related to expenses. We expect charges of around £40 million in FY22, split between £33 million of service costs and £7 million of expenses. In addition to this, there was an interest credit of £4 million in FY21 and, for FY22, we expect an interest charge of £5 million on the deficit.
Subsequent events In April 2021, the Group announced a new operating model. The related restructuring will result in an exceptional charge of around £40 million being recognised in the 2022 financial year. In FY20, the Lazio Regional Administrative Court confirmed a €51 million fine issued by the Italian Competition Authority to our subsidiary, Babcock Mission Critical Services Italia SpA (BMCS Italia), for certain anti-trust violations. As a result, we recognised a provision for £46 million. During the year, BMCS Italia appealed the decision of the Court to the Italian Council of State. In July 2021, the Council, whilst upholding the decision of the Court on the facts, annulled the fine, though allowing the Authority leave to re-calculate it. We expect the Authority to decide on the recalculation of the fine over the next few months. Taking into account the guidance given by the Council to the Authority on the recalculation, we further expect the Authority to reduce the fine. As a result, we have reduced our best estimate of the provision from £46 million to £20 million, although we have not received any indication from the Authority as to how it will choose to interpret the Council’s guidance.
Babcock International Group PLC full year results for the year ended 31 March 2021 25
Improvements in risk management and internal control
During the second half of the year, the new Executive Directors made several changes to the risk management and internal control environment. These were initially designed to simplify and improve the oversight and governance of the Group. As the CPBS review progressed it became apparent that business processes and internal controls needed a more thorough revision. A programme of change has commenced which targets certain priority areas – a summary is set out below. The findings of the CPBS have been mapped against these areas to ensure that risks and issues that resulted in financial adjustments in the CPBS are in future either prevented, or at least detected at an early stage. The priority areas of improvement and key actions are as follows: Area Improvements and actions
Governance • Clear ‘tone from the top’ on Babcock values • Board and Exco documentation streamlined and focused • Formation of Disclosure Committee/Disclosure Panel to consider market
communications • New Risk Management process with Exco ownership • Enhanced Delegations of Authority document across the Group • Formal Letter of Representation covering policy compliance sign off from
management each six months
Financial control • Simplification of income statement and cash flow management reporting • Standardised management reporting across the Group • Development of detailed minimum standards of financial control • Updated and standardised Group accounting policies • Updated Treasury controls and policies • Monthly business reviews with sectors • Regular balance sheet reviews with sector sign off
Bids • Improved, standardised bid review process and documentation
Project management • New Group-wide approach to project management and project reviews
• Enhanced change control process
Safety • Revamped scrutiny of safety performance
• Nominated Exco Safety sponsor
Some of the above changes have been implemented already. Some require a more detailed approach and will take more time to embed. They will be implemented in the current fiscal year. In the meantime where this is the case, management reviews of projects and financial results will help mitigate against the risk of reoccurrence. Additionally, the new operating model has organised the functions of finance, HR, IT, procurement and supply chain as ‘centre-led’. This will ensure higher common standards across the Group and increase transparency and oversight of the business, as well as promote more collaboration.
26 Babcock International Group PLC full year results for the full ended 31 March 2021
Financial review Organic revenue grew by 9% in the year led by the ramp up of work on the Type 31 frigate programme and continued strength in our LGE business. Growth in these areas more than offset the impact of the disposal of Context and the £44 million year-on-year revenue impact from the end of the QEC programme last year. Increased work related to COVID-19 had a small positive impact on revenue with lower activity in warship support and in Oman offset by COVID-related orders for the ventilators in the UK. Underlying operating profit of £56.3 million includes a £28.9 million one-off adjustment from our CPBS (see page 11). Excluding this, underlying operating profit was £85.2 million. The table above shows the main variances year-on-year:
The estimated impacts of COVID-19 which included lower activity in high margin consultancy work and the shutdown of our Oman training site for most of the period with limited opportunities to mitigate costs
A recurring impact from the CPBS primarily related to a more cautious view on the recognition of profit on the Type 31 frigate programme, amongst other projects
Weaker trading which reflects lower profitability on certain programmes, a charge from the loss of a legal case relating to a previously exited business, and a less favourable allocation of corporate costs to Marine than in the previous year
The sector’s contract backlog was broadly flat year-on-year.
Operational review UK defence Performance across UK defence was mixed throughout the year with lower volumes across some key programmes, partly reflecting the pressures of COVID-19, being offset by increased activity on the Type 31 frigate programme. The Type 31 frigate programme has now completed both its preliminary and whole ship design reviews. This is a key indicator of the compliance, maturity and engineering risk in proceeding into production as we mature the design models of specific individual systems and equipment. The development and construction of a new state-of-the-art assembly hall at our Rosyth dockyard to support the build is due for completion towards the end of this summer with the steel on the first ship, HMS Venturer, to be cut in September 2021. The Type 23 frigate life-extension programme at our Devonport dockyard saw a temporary halt to work in the early stages of the COVID-19 pandemic but was soon back to a full work schedule, with four ships undergoing life extension in parallel. HMS Portland was returned to the Royal Navy in the year after receiving its life extension including a first-in-class engine removal and repair. HMS St Albans is currently undergoing the largest Type 23 support period yet. We also provided a large support package for HMS Richmond ahead of her joining the UK’s Carrier Strike Group. We continue to support the development of the next generation of UK submarines. We secured both weapons handling and launch system (WHLS) and defensive aids suite (DAS) contracts in the period in support of the UK Dreadnought programme. The US/UK Common Missile Compartment programme output increased significantly during the period and will continue to do so throughout the next year as the programme ramps up. In March 2021 we secured a five-year, £150 million logistic support contract with the MOD as part of the £3.2 billion Land Environment Tactical Communications and Information Systems (LE TacCIS) programme of opportunities to deliver the next-generation tactical communications and information systems. We have been down-selected for the next phase of the Skynet 6 Service Delivery Wrap contract supporting the next
Babcock International Group PLC full year results for the year ended 31 March 2021 27
generation of UK military satellite communications, with a final submission expected in October 2021. We also await the outcome of the Maritime Electronic Warfare Systems Integrated Capability (MEWSIC) bid, which is expected in the coming months. We were disappointed to be unsuccessful in our Project Selborne bid during the period. The delivery of FOAP training, which was included within the larger Project Selborne scope, finished on 31 March 2021. We continue to deliver training under the Astute Class Training contract at HMNB Clyde. International defence We support international defence markets from our UK operations and from our businesses in Canada, Australia, New Zealand, Oman and Korea. In Canada, our customer exercised two one-year contract extension options to the Victoria In-Service Support Contract (VISSC) to take the contract out to June 2023. VISSC is one of the largest naval in-service support contracts in Canada and includes refits and deep maintenance periods for Canada’s fleet of four submarines. In Australia, we secured a contract with Naval Group to commence the second stage design and build of the Weapon Discharge System (WDS) for the Australian Future Submarine Programme (AFSP). AFSP is Australia’s largest defence acquisition programme and will see 12 Attack Class submarines designed and built for the Royal Australian Navy, expected to enter service in the early 2030s. In Korea, we secured a WHLS order for the fourth boat of the Jangbogo-III Submarine programme. We continue to develop our Busan facility to expand our presence in Korea to provide the programme with through-life support, as well as future Republic of Korea Navy development programmes. Looking ahead we see several opportunities for export orders for our Arrowhead 140 frigate design chosen for the UK Type 31 programme and we are expanding our high frequency communications capability and capacity in Australasia, building on our work in the UK and New Zealand. Energy and Marine Our Energy and Marine business saw good revenue growth during the year, driven by increased commercial vessel work and continued strong demand for multiple liquefied gas handling and re-liquefaction system orders across the LPG, LNG and ethane markets. In the period we signed frame agreements with Hyundai Heavy Industries, Hyundai Samho Heavy Industries and Hyundai Mipo Dockyard confirming Babcock LGE as preferred supplier for the design and supply of LPG cargo handling systems for very large gas carriers and midsize gas carriers.
28 Babcock International Group PLC full year results for the full ended 31 March 2021
Financial review Organic revenue was 9% higher this year led by strong growth in defence. This growth came from increased work on submarine support and a further ramp up of infrastructure work. This revenue growth however was at a lower margin. The increase in revenue associated with COVID-19 relates to COVID-related costs recovered from the customer. The underlying operating profit of £63.9 million includes a £23.4 million one-off adjustment from our CPBS (see page 11). Excluding this, underlying operating profit was £87.3 million. The table above shows the main variances year-on-year, the largest of which is the impact of higher R&D tax credits in the last financial year due to a catch up on previous years’ claims. The small decline in profit reflected in the other trading movements reflect the lower margin earned this year across programmes. The sector’s contract backlog reduced slightly year on year, reflecting the lower time period of committed revenue from MSDF, and is expected to increase significantly once the FMSP contract is agreed, as discussed below.
Operational review Defence The defence business saw increased activity in the year despite COVID-19 working pressures as critical work continued. We continued to support the Continuous At Sea Deterrent and the high availability of Attack Submarines from our operations at HMNB Clyde despite the challenges of the pandemic. Work on large submarine infrastructure programmes ramped up in the year, including planning for the first deep maintenance period of the Astute Class at Devonport in the next few years. In Devonport, we continue to work on the Revalidation Assisted Maintenance Period (RAMP) programme for the Trafalgar Class and work has continued on the first life extension of the Vanguard Class. Our largest individual contract across the Group, the Maritime Support Delivery Framework (MSDF), operates across our Maritime and Nuclear sectors. The previous five year MSDF contract was due to expire on the 31 March 2020, however, MOD and Babcock agreed to exercise an option in the MSDF contract to extend the commercial arrangement by a year to 31 March 2021. This additional year included some scope increases but at a lower margin compared to the previous MSDF contract. This has been replaced by an Intention To Proceed (ITP) agreement which includes an output based requirement, covering the period 1 April 2021 to 31 July 2021. This transition period will allow MOD and Babcock to conclude negotiations on the four Future Maritime Support Programme (FMSP) single source contracts at HMNB Devonport and Clyde, replacing the current MSDF arrangements. We are working with our customer to finalise the four replacement contracts. All are identified as being ‘Qualifying Defence Contracts (QDC)’ and fall under Single Source Contract Regulations (SSCR). Negotiations have not yet concluded, but we expect to finalise all elements of the four FMSP contracts over this summer.
Civil Revenue across civil was lower in the year reflecting major long-term projects with the NDA and AWE coming to a close and lower volumes on work with EDF partly as a result of challenges with the Advance Gas Reactor station fleet. New build construction continues to be delayed at Hinkley Point C (HPC) resulting in a knock-on impact to the MEH Alliance. The alliance, launched in August 2019 with three other operators, aims to deliver all of the main Mechanical, Electrical and Heating (venting and air conditioning) (MEH) activity at HPC. The civil nuclear decommissioning and new build market remains challenging in the short term and we made good progress in the year in reducing our overheads and simplifying our structure to adapt to these challenges. There are, however, significant opportunities in the medium term across the UK and potential opportunities in Canada and Japan, two markets where we already have a small presence.
Babcock International Group PLC full year results for the year ended 31 March 2021 29
Financial review On an organic basis, revenue was 22% lower in the year. This includes a significant impact from the CPBS, with an in-year reduction relating to lower revenue on our DSG contract and the de-recognition of revenue on our Phoenix contract as, from February 2020, the contractual terms changed from Babcock acting as principal to acting as agent. Revenue was also impacted by a significant COVID-19 impact of around £120 million across many parts of the sector as well as the lost contract for Heathrow in our Airports business and lower defence volumes. The underlying operating loss of £17.4 million includes a £69.3 million one-off adjustment from our CPBS (see page 11). Excluding this, underlying operating profit was £51.9 million. The table above shows the main variances year-on-year:
Estimated impacts from COVID-19 as a result of lower activity and site closures in civil training, education, airports and in South Africa
Recurring impacts from the CPBS primarily relating to a significantly lower margin recognised on our DSG contract
Other trading reflects the loss of the Heathrow contract, increased operating costs and lower profitability on some contracts The sector’s contract backlog decreased by £0.5 billion in the year, reflecting the utilisation of multi-year backlog on long-term contracts, predominantly DSG, and also the reduction of backlog in Airports.
Operational review Defence Trading across our most of our defence businesses held up well during the year despite COVID-19. Activity slowed in some areas however, including training and short-cycle inventory work at DSG while our work supporting the British Army in Germany reduced in scope. We continue to engage with the customer as they develop their Collective Training Transformation Programme and won the opportunity to participate in the British Army’s 2021 Army Warfighting Experiment where we will be demonstrating a range of capabilities. During the year we secured an extension to our Training Maintenance and Support Services (TMASS) contract out to 2023 and we are in negotiations to extend the Defence College of Technical Training for the provision of training design and delivery (EMTC II) for a further three years, plus one option year. Activity levels remained high across our Defence Support Group (DSG) business though reduced efficiency reduced the pace of progress. Following a review of the DSG contract as part of the CPBS, and taking into account the changes announced by the MOD in the Integrated Review in the year, we now recognise a significantly lower margin on the DSG contract.
Emergency services Trading across our emergency services businesses was relatively flat in the year with lower volumes in firefighting training offset by the start of our new police training contract. Our fleet support contract for the Met Police performed well and we were awarded a two year contract extension worth around £60 million in the year. In January 2021, we launched the £300 million contract for the Met Police Education and Qualification Framework (PEQF). Our fleet support and training contracts for the London Fire Brigade continue to perform well. Other civil markets The impact of COVID-19 was most severe across many of our other markets in the Land sector, both in terms of revenue and operating profit. In our civil training business, the start of the COVID-19 pandemic saw customer facilities closed and no face-to-face training. The majority of our civil training workforce were initially placed on the UK Government’s furlough scheme. Our airports businesses saw a dramatic reduction in volumes given the global decline in passenger numbers and our Heathrow airport baggage contract came to an end in October 2020. Work across our rail and power businesses held up well throughout the year. Our South Africa business had a very tough first half of the year, hit by national lockdowns, but saw a stronger second half as activity increased. In October 2020, we completed the sale of the Conbras business in Brazil for a net consideration of £7 million.
30 Babcock International Group PLC full year results for the full ended 31 March 2021
Financial review Organic revenue was flat this year as business growth and new contracts offset a COVID-19 impact of around £45 million from lower flying hours in the earlier stages of the pandemic. The underlying operating loss of £130.4 million includes a £128.4 million one-off adjustment from our CPBS (see page 11). Excluding this, underlying operating loss was £2.0 million. The table above shows the main variances year-on-year, being the estimated costs of COVID-19 and significant credits that benefited FY20. The estimated COVID-19 impact includes the direct impact from lower flying hours in the early stages of the pandemic and the additional costs across the business. These costs included PPE, the refitting and segregation modification of aircraft and the inefficiencies of flying in a COVID-secure way, for example flying at lower capacity. In many cases these additional costs were not recovered in our contract pricing. The recurring impacts to underlying operating profit from the CPBS of £6.4 million relate to the adjustment of some project margins coupled with the ongoing impacts of the prior year errors and change in accounting policy. As set out before, our civil aviation business has a cost structure too high for the revenue we generate under existing contracts. Our cost reduction programme started in the last financial year has begun to address this. In the prior year, reported performance benefited from various transactions that are not expected to repeat. These include multi-year indexation claims on contracts and accrual and provision releases. The positive impact of these in FY20 was around £17 million compared to nil in FY21. The small improvement in other trading reflects the benefits from the cost restructuring programme mostly offset by weaker trading. The sector’s contract backlog was broadly stable year-on-year with new work replacing contracts that ended.
Operational review Defence Activity across defence was broadly flat in the year with work continuing despite COVID-19. In the UK, support continued across both RAF station support and flying training. Additionally both our Hawk and Adour contracts, which underpin the delivery of critical UK fast-jet training to the RAF, were extended in year. Discussions continue on a longer-term Hawk support contract for the next decade. In France, we continued to deliver on our Fomedec pilot training contract and we started our H160 contract to provide search and rescue aircraft and services for the French Navy. In June 2021, we were awarded a contract by the French MOD for an expansion of our existing defence aviation training activities. This five-year contract is worth around €500 million and started in June 2021. In Canada, we have signed a letter of intent with Leonardo to bid together for the Future Aircrew Training programme (FACT). Aerial emergency services Revenue across our aerial emergency services businesses was slightly higher this year, helped by the start of new contracts and higher firefighting hours. Profitability was severely impacted by COVID-19 with the pressures of lower flying hours in much of the business and higher costs of delivery. Performance in aerial emergency medical services was the most severely hit by COVID-19 in the earlier parts of the financial year. We were successful in securing contract renewals in Italy, Spain and France in the year. Our firefighting operations across Europe and Canada saw higher activity levels compared to last year, particularly in Spain and Italy. We have increased our firefighting footprint with new contract wins in Spain and we deployed aircraft in Chile with a small counter-season contract.
Oil and gas Market conditions for our oil and gas business remained tough throughout the year. Flying hours were heavily reduced in the early part of the year in response to the COVID-19 pandemic but recovered as the year continued.
Babcock International Group PLC full year results for the year ended 31 March 2021 31
Going concern and viability statement Overview The Directors have undertaken reviews of the business financial forecasts, in order to assess whether the Group has adequate resources to continue in operational existence for the foreseeable future and as such can continue to adopt the going concern basis of accounting. The Directors have also looked further out to consider the viability of the business to test whether they have a reasonable expectation that the Group will continue in operation and meet its liabilities as they fall due. For assessing going concern, the Board considered the 12 month period from the date of signing the Group’s financial statements for the year end 31 March 2021. For viability, the Board looked at a three year view as this is the period over which the Group prepares its strategic plan forecasts. The annual budgets are compiled using a bottom-up process, aggregating the budgets for the individual business units into Sector budgets. The Sector budgets and the consolidated Group budget is then reviewed by the Board and used to monitor business performance. The impacts of the recent contract profitability and balance sheet review (‘CPBS’) and the planned restructuring as a result of the change in operating model have been incorporated into the budgets. The Board considered the budgets alongside the Group’s available finances, strategy, business model, market outlook and principal risks. The process for identifying and managing the principal risks of the Group is set out in our Annual report. The Board also considered the mitigation measures being put in place and potential for further mitigation. Available financing As at 31 March 2021, net debt excluding operating leases was £771.5 million and the Group therefore had liquidity headroom of £1.2 billion, including net cash and cash equivalents of £0.5 billion and undrawn facilities of £0.8 billion. As of July 2021, the Group’s committed facilities and bonds totalling £2.4 billion were as follows:
€550 million bond, hedged at £482 million, maturing 6 October 2022
New £300 million 3-year RCF maturing 20 May 2024 (signed on 20th May 2021)
£775 million revolving credit facility (RCF) maturing 28 August 2025
£300 million bond maturing 5 October 2026
€550 million bond, hedged at £493 million, maturing 13 September 2027
A committed overdraft facility of £50 million The RCFs are the only facilities with covenants attached. The key covenant ratios are (i) net debt to EBITDA (gearing ratio) (ii) and EBITDA to net interest (interest cover). These are measured twice per year – on 30 September and 31 March. The lending banks have agreed to raise the covenant limit for the gearing ratio from 3.5x to 4.5x for the measurement periods ending 30 September 2021 and 31 March 2022 in order to provide sufficient downside protection for the Group as the turnaround in performance takes place – and particularly as a key assumption in strengthening the Group’s balance sheet is the planned divestment programme which aims to generate a minimum of £400 million of proceeds within the next twelve months. For all subsequent periods, the gearing ratio covenant returns to 3.5x. The definition was clarified to specifically exclude the one-off impacts of the CPBS review from the covenant calculations. The RCF lenders are fully committed to advance funds under the RCF to the Group, provided that the Group has satisfied the usual ongoing undertakings, and the credit worthiness of the Group’s relationship banks is closely monitored. Based on their credit ratings we have no credit concerns with our relationship banks. Given the importance of the RCFs to the Group’s liquidity position, our assessments of going concern and viability have tested the Group’s gearing ratio, interest cover and liquidity headroom throughout the period under review.
COVID-19 impact The COVID-19 pandemic created increased uncertainty across our business during the financial year, particularly in the UK and European operations. The impacts were most severe for our non-defence businesses (e.g. civil aviation and civil training) where operations in some cases were stopped. The defence businesses incurred some interruption and increased cost initially with the heightened uncertainty. Subsequently most defence programmes and sites were re-opened, albeit with social distancing restrictions and higher levels of employees working from home where possible. In response to this, the Group took steps to mitigate the financial impact and improve the Group’s liquidity including:
Deferring non-essential operating and capital expenditure
Furloughing staff in a number of areas such as our airports and civil training businesses
Senior executive management taking a temporary 20% reduction in basic salary with their annual bonus and pay rise deferred
Non-Executive Board members taking a temporary 20% reduction in fees with no annual increase
Taking the decision not to pay an interim dividend for the 2020 financial year Subsequently the Group has been in discussion with certain customers regarding cost recovery and contract performance relief where appropriate.
32 Babcock International Group PLC full year results for the full ended 31 March 2021
As the year progressed, it became clear that there was a significant impact from COVID-19 and that the Group’s financial performance was tracking behind original expectations. Overall, the net financial impact of COVID-19 on the Group in the year was a reduction of operating profit of approximately £45 million as explained on page 16. As there are now vaccination programmes in most of the geographies in which the Group operates, it has been assumed that there will be a gradual removal of pandemic measures such as social distancing and that all our operations will eventually be able to work on sites as before. However, there remain the risks of new variants, potential future lockdowns and business interruptions so the Board has taken a cautious view as to how quickly the return to pre-pandemic ways of working will happen over the forecast period.
Base case scenario In addition to the trading assumptions outlined above, key assumptions in our base case budget include:
£400 million of cash proceeds from disposals during FY22
c.£50 million of restructuring costs in FY22 being c.£40 million relating to the operating model change and c.£10 million of previously announced restructuring (e.g. in Aviation)
£56 million of VAT deferred from FY21 to be paid in FY22
Additional pension deficit contributions previously agreed with trustees (over and above the normal levels) of £60 million in FY22 and £52 million in FY23
A gradual unwind of the historical year end working capital ‘push’ over the period, to close the gap between average monthly net debt and the much lower period end net debt
A continuation of debt factoring for certain Southern European contracts within Aviation at similar levels to FY21
Dividends not paid for FY21 or FY22 The base case budget shows significant levels of headroom against both financial covenants and liquidity headroom based on the current committed facilities outlined above (without assuming any refinancing of the €550 million bond in October 2022).
Reverse stress testing of the base case To assess the level of headroom within the available facilities, a reverse stress test was performed to see what level of performance deterioration against the base case budget (in both EBITDA and net debt) was required to challenge covenant levels. Of the remaining measurement points within the three year period, the lowest required reduction in forecast EBITDA to hit the covenant level was 36% and the lowest net debt increase was 56%. Given the mitigating actions that are available and within management’s control, such movements are not considered plausible.
Severe but plausible downside scenarios The Directors also considered a series of severe but plausible downside scenarios which are sensitivities run against the base case budget for the duration of the assessment period. These sensitivities include – separately - a reduction in bid pipeline closure (business winning), a reduction in the assumed restructuring savings, a deterioration in large programme performance across the Group, a deterioration in the Group’s working capital position and a regulator imposed cessation in flying two of the largest aircraft fleets in the Group. Furthermore a sensitivity was run which modelled the removal of all uncommitted working capital facilities available to the Group. As stated above, a key contributor to the strengthening of the balance sheet is the divestment programme which is expected to generate a minimum of £400 million of proceeds in FY22. For this reason a further sensitivity was run removing all planned divestments entirely and keeping the Group portfolio as it currently is throughout the forecast period. Unsurprisingly, removing the divestments entirely – however unlikely it may be to happen – left the gearing ratio with too little headroom against the financial covenants. Whilst all of these separate scenarios showed compliance with the financial covenants throughout the period, the measurement periods ending 30 September 2021 and 31 March 2022 had the highest covenant gearing ratios. This is a reflection of the significant cash out flows in this period (e.g. programme capital expenditure, restructuring costs and the extra pension deficit contributions) occurring before the proceeds from the planned divestments are received. It is for this reason that the Board approached and has agreed with our lending banks to increase the covenant level gearing ratio from the usual 3.5x to 4.5x for those two measurement periods. As with any company or group, it would be possible, however unlikely, to model individual risks or combinations of risks that would threaten the financial viability of the Group. The Board has not sought to model events where it considers the likelihood of such events not to be plausible. In preparing a combined severe but plausible (SBP) downside case, the Board considered the feed of individual risks from the sectors covering the above sensitivities. Overall there were c.80 profit and cash flow risks identified. A simple aggregation of all of these risks is not considered plausible as the Group operates businesses and contracts which run largely independently of each other, albeit with a relatively small number of customers within each geography. The majority of these identified risks were seen as ‘sector independent’ (i.e. there is no direct read across from one sector to another). A small number are deemed ‘non independent’ e.g. COVID-19, inflation, FX etc. The Board decided to include in its combined SBP downside all the ‘non independent’ risks without reduction, but reduced the aggregation of the ‘sector independent’ risks by 25% to reflect the implausibility of all such risks fully crystallising within the same period. The SBP scenario also deferred all disposal proceeds by 12 months, significantly reduced the financial benefits of the operating model restructuring and assumed a much reduced level of receivable factoring in the Aviation business. If such a severe downturn were to occur in the Group’s performance, the Board would take mitigation measures to protect the group in the short term. Such profit and cash mitigation measures that are deemed entirely within the control of the Group and identified as part of the sector budgeting exercise have been included in the SBP scenario (e.g. cancelling pay rises and bonus awards, curtailing uncommitted capital expenditure and operational spend including R&D and other investment). Despite the severity of the above combined SBP scenario, the Group maintained a sufficient amount of headroom against the financial covenants within its borrowing facilities, albeit that this is less after the gearing covenant level reverts to 3.5x in September 2022, and sufficient liquidity when compared against existing facilities.
Babcock International Group PLC full year results for the year ended 31 March 2021 33
Additional mitigation options While the new bank liquidity facility and the temporary relaxation of the covenant levels are deemed appropriate to cover the potential impacts of plausible risks, the Group has considered additional mitigation measures that could be undertaken should the need arise. These may include measures under the control of the Board as outlined above. Further measures which are not wholly under the control of the Board might include additional divestment plans; and in extremis seeking a further covenant amendment from our RCF lenders and/or utilising alternative financing sources, such as a hybrid bond or equity.
Going concern assessment and viability conclusion Based on our review, the Directors have a reasonable expectation that the Group has adequate resources to continue as a going concern for at least 12 months from the date of these financial statements. As such, these financial statements have been prepared on the going concern basis. The Directors do not believe there are any material uncertainties to disclose in relation to the Group’s ability to continue as a going concern. In concluding on the financial viability of the group, having considered the scenarios outlined above, the Directors have a reasonable expectation that the Company and the Group will be able to continue in operation and meet all its liabilities as they fall due up to March 2024.
34 Babcock International Group PLC full year results for the full ended 31 March 2021
Risks and uncertainties The principal risks and uncertainties affecting the Group are set out in the Company's Annual Report and Financial Statements 2021. They should be read in conjunction with this announcement when published. The full list will also be published in the Company’s Notice of Availability. However, below is a list of those risks and uncertainties. This list is not a substitute for reading the Company's Annual Report and Financial Statements 2021 in full. The Group’s principal risks and uncertainties are: Existing markets: we rely heavily on winning and retaining large contracts with a relatively limited number of major clients, whether in the UK, particularly the Ministry of Defence, or overseas, many of whom are (directly or indirectly) owned or controlled by government (national or local) and/or are (wholly or partly) publicly funded. Contract performance: we operate large contracts, which often requires us to price for the long term and for risk transfer. Our contracts can include fixed price. New markets: We seek new markets and contracts for our services both with existing and new customers, whether in territories where we are already established or in territories where we are not. Financial resilience: The Group is exposed to a number of financial risks, some of which are of a macroeconomic nature (for example, foreign currency, interest rates) and some of which are more specific to the Group (for example, liquidity and credit risks) Business interruption: Failure to withstand the impact of an event or a combination of events may significantly disrupt all or a substantial part of the Group’s business Operational resilience: We are undertaking multiple change programmes with the introduction of a new strategy, a new operating model to restructure the shape of the Group, and a new people strategy, as well as undertaking the rationalisation of both the business portfolio and our property portfolio Health, safety and environmental: Our operations entail the potential risk of significant harm to people, property or the environment, wherever we operate across the world Regulatory and compliance burden: Our businesses are subject to the laws, regulations and restrictions of the many jurisdictions in which they operate People: We operate in many specialised engineering and technical domains, which require appropriate skills and experience Pensions: The Group has significant defined benefit pension schemes in the UK, which provide for a specified level of pension funds to scheme members IT and security: Our ability to deliver secure IT and other information assurance systems to maintain the confidentiality of sensitive information is a key factor for our customers Acquisitions and disposals: We have built our core strengths organically and through acquisition. Decisions to acquire companies, as well as the process of their acquisition and integration, are complex, time-consuming and expensive. If we believe that a business is not “core” we may decide to sell that business The risks listed above, together with their potential impacts and mitigating actions we have taken in respect of them, are explained and described in more detail in the 2021 Annual Report, a copy of which will be available at www.babcockinternational.com.
Forward-looking statements Certain statements in this announcement are forward-looking statements. Such statements may relate to Babcock’s business, strategy and plans. Statements that are not historical facts, including statements about Babcock’s or its management’s beliefs and expectations, are forward-looking statements. Words such as ‘believe’, ‘anticipate’, ‘estimates’, ‘expects’, ‘intends’, ‘aims’, ‘potential’, ‘will’, ‘would’, ‘could’, ‘considered’, ‘likely’, and variations of these words and similar future or conditional expressions are intended to identify forward-looking statements but are not the exclusive means of doing so. By their nature, forward-looking statements involve a number of risks, uncertainties or assumptions, some known and some unknown, many of which are beyond Babcock’s control that could cause actual results or events to differ materially from those expressed or implied by the forward-looking statements. These risks, uncertainties or assumptions could adversely affect the outcome and financial effects of the plans and events described herein. Forward-looking statements contained in this announcement regarding past trends or activities should not be taken as a representation that such trends or activities will continue in the future. Nor are they indicative of future performance and Babcock’s actual results of operations and financial condition and the development of the industry and markets in which Babcock operates may differ materially from those made in or suggested by the forward-looking statements. You should not place undue reliance on forward-looking statements because such statements relate to events and depend on circumstances that may or may not occur in the future. Except as required by law, Babcock is under no obligation to update (and will not) or keep current the forward-looking statements contained herein or to correct any inaccuracies which may become apparent in such forward-looking statements. Forward-looking statements reflect Babcock’s judgement at the time of preparation of this announcement and are not intended to give any assurance as to future results.
Babcock International Group PLC full year results for the year ended 31 March 2021 35
For the year ended 31 March Note
2021
Total
£m
2020
(restated)
Total
£m
Revenue 2,5 4,182.7 4,428.5
Cost of revenue (4,156.6) (3,941.2)
Gross profit 26.1 487.3
Administration and distribution expenses (376.2) (359.2)
Goodwill impairment 10 (1,243.2) (278.4)
(Loss)/profit on divestments 24 (49.7) 74.7
Operating loss 2,5 (1,643.0) (75.6)
Share of results of joint ventures and associates 2,5,14 (13.1) 58.6
Finance income 6 16.6 14.1
Finance costs 6 (77.8) (86.0)
Loss before tax 2,5 (1,717.3) (88.9)
Income tax benefit/(expense) 7 15.3 (26.9)
Loss for the year (1,702.0) (115.8)
Attributable to:
Owners of the parent (1,702.0) (117.8)
Non-controlling interest – 2.0
(1,702.0) (115.8)
Loss per share 9
Basic (337.0)p (23.3)p
Diluted (337.0)p (23.3)p
Group statement of comprehensive income
For the year ended 31 March Note 2021
£m
2020
(restated)
£m
Loss for the year (1,702.0) (115.8)
Other comprehensive income
Items that may be subsequently reclassified to income statement
Currency translation differences 1.9 (29.5)
Reclassification of cumulative currency translation reserve on disposal 10.5 –
Fair value adjustment of interest rate and foreign exchange hedges 18.2 (25.4)
Tax on fair value adjustment of interest rate and foreign exchange hedges (4.5) 5.5
Hedging gains/(losses) reclassified to profit or loss 6.9 (3.1)
Fair value adjustment of joint ventures and associates derivatives 14 7.0 (9.4)
Tax, including rate change impact, on fair value adjustment of joint ventures and associates derivatives 14 (1.4) 2.3
Items that will not be reclassified to income statement
Remeasurement of retirement benefit obligations 21 (506.8) 99.9
Tax on remeasurement of retirement benefit obligations 96.3 (20.2)
Impact of change in UK tax rates – 0.9
Other comprehensive (loss)/income, net of tax (371.9) 21.0
Total comprehensive loss (2,073.9) (94.8)
Total comprehensive loss attributable to:
Owners of the parent (2,075.0) (94.7)
Non-controlling interest 1.1 (0.1)
Total comprehensive loss (2,073.9) (94.8)
In the year ended March 2021, the contract profitability and balance sheet review identified material errors which impact the prior period. The review also resulted in changes to an accounting policy. The errors were corrected and new policy applied by restating each of the affected financial statement line items for the prior period. See note 4.
Additionally, for the year ended 31 March 2021 the income statement has been simplified to exclude the reconciliation to underlying operating profit, as this is now shown in note 2.
Group statement of changes in equity
36 Babcock International Group PLC full year results for the full ended 31 March 2021
Share
capital
£m
Share
premium
£m
Other
reserve
£m
Capital
redemption
£m
Retained
earnings
£m
Hedging
reserve
£m
Translation
reserve
£m
Total equity
attributable
to owners
of the
Company
£m
Non-
controlling
interest
£m
Total
equity
£m
At 1 April 2019 as previously stated 303.4 873.0 768.8 30.6 975.8 (74.4) (32.1) 2,845.1 17.4 2,862.5
Net movement in equity – – – – (2,109.2) 26.2 11.3 (2,071.7) 0.3 (2,071.4)
At 31 March 2021 303.4 873.0 768.8 30.6 (1,629.1) (71.1) (48.2) 227.4 16.0 243.4
The other reserve relates to the rights issue of new ordinary shares on 7 May 2014 and the capital redemption reserve relates to the issue and redemption of redeemable ‘B’ preference shares in 2001.
Group statement of financial position
Babcock International Group PLC full year results for the year ended 31 March 2021 37
As at Note
31 March
2021
£m
31 March
2020
(restated)
£m
1 April
2019
(restated)
£m
Assets
Non-current assets
Goodwill 10 956.3 2,287.9 2,584.2
Other intangible assets 11 202.0 334.7 389.0
Property, plant and equipment 12 731.5 840.9 873.7
Right of use assets 13 521.2 609.0 623.5
Investment in joint ventures and associates 14 73.5 161.9 162.1
Loan to joint ventures and associates 14 42.1 48.6 42.5
Retirement benefits surpluses 21 40.8 325.3 226.9
IFRIC 12 financial assets 11.2 12.8 15.5
Other financial assets 17.2 21.5 93.8
Deferred tax asset 15 141.3 60.5 54.7
2,737.1 4,703.1 5,065.9
Current assets
Inventories 162.4 191.6 194.7
Trade and other receivables 16 741.0 837.4 868.8
Income tax recoverable 48.4 57.2 40.5
Other financial assets 34.9 153.9 48.0
Cash and cash equivalents 23 904.8 1,845.9 844.7
1,891.5 3,086.0 1,996.7
Total assets 4,628.6 7,789.1 7,062.6
Equity and liabilities
Equity attributable to owners of the parent
Share capital 303.4 303.4 303.4
Share premium 873.0 873.0 873.0
Capital redemption and other reserves 680.1 642.6 700.1
Retained earnings (1,629.1) 480.1 667.7
227.4 2,299.1 2,544.2
Non-controlling interest 16.0 15.7 17.4
Total equity 243.4 2,314.8 2,561.6
Non-current liabilities
Bank and other borrowings 18 1,318.8 2,050.0 1,437.2
Lease liabilities 13, 18 486.2 548.5 533.7
Trade and other payables 17 1.9 2.1 2.0
Deferred tax liabilities 15 7.7 33.7 25.5
Other financial liabilities 51.1 35.6 9.3
Retirement benefit deficits 21 333.9 180.1 254.9
Provisions for other liabilities 20 73.7 32.7 33.8
2,273.3 2,882.7 2,296.4
Current liabilities
Bank and other borrowings 18 383.7 987.9 657.3
Lease liabilities 13, 18 126.1 140.9 107.1
Trade and other payables 17 1,506.7 1,301.2 1,348.8
Income tax payable 9.7 3.8 22.1
Other financial liabilities 13.9 27.7 10.9
Provisions for other liabilities 20 71.8 130.1 58.4
2,111.9 2,591.6 2,204.6
Total liabilities 4,385.2 5,474.3 4,501.0
Total equity and liabilities 4,628.6 7,789.1 7,062.6
In March 2021, the contract profitability and balance sheet review identified material errors which impact prior periods. The review also resulted in changes to an accounting policy. The correction of the errors and application of the new policy resulted in a reduction of net assets amounting to £235.2 million at 31 March 2020 and £300.9 million at 1 April 2019. Each of the affected financial statement line items was restated for the prior periods. See note 4. This also impacts the Group cash flow statement.
38 Babcock International Group PLC full year results for the full ended 31 March 2021
Group cash flow statement
For the year ended 31 March Note 2021
£m
2020 (restated)
£m
Cash flows from operating activities
Loss for the year (1,702.0) (115.8)
Share of results of joint ventures and associates 14 13.1 (58.6)
Income tax (benefit)/expense 7 (15.3) 26.9
Finance income 6 (16.6) (14.1)
Finance costs 6 77.8 86.0
Depreciation and impairment of property, plant and equipment 199.9 91.3
Depreciation and impairment of right of use assets 179.8 137.5
Amortisation and impairment of intangible assets 148.2 81.9
Goodwill impairment 1,243.2 278.4
Equity share-based payments 3.2 2.9
Impairment of joint venture loans 14 7.0 –
Net derivative fair value movement through profit or loss 6.9 (3.1)
Loss/(profit) on disposal of subsidiaries, businesses and joint ventures and associates 24 49.7 (74.7)
Loss on disposal of property, plant and equipment 26.4 3.9
Loss on disposal of intangible assets – 0.1
Cash generated from operations before movement in working capital and retirement benefit payments 221.3 442.6
Decrease/(increase) in inventories 32.9 (10.9)
Decrease in receivables 86.8 40.0
Increase/(decrease) in payables 212.5 (24.7)
(Decrease)/increase in provisions (14.6) 71.8
Cash outflow from non-hedging derivatives (3.6) –
Retirement benefit contributions in excess of income statement (64.5) (73.5)
Cash generated from operations 470.8 445.3
Income tax received/(paid) 19.4 (72.4)
Interest paid (79.4) (84.9)
Interest received 12.0 13.3
Net cash flows from operating activities 422.8 301.3
Cash flows from investing activities
Disposal of subsidiaries and joint ventures and associates, net of cash disposed 24 90.6 101.6
Dividends received from joint ventures and associates 14 36.8 52.0
Proceeds on disposal of property, plant and equipment 32.2 76.5
Purchases of property, plant and equipment (170.8) (191.3)
Purchases of intangible assets (19.6) (29.0)
Lease assets repaid 24 14.9 49.9
Investment in joint ventures 14 (8.8) (0.3)
Loans repaid by joint ventures and associates 4.2 0.7
Increase in loans to joint ventures and associates (3.9) (5.5)
Net cash flows from investing activities (24.4) 54.6
Cash flows from financing activities
Dividends paid 8 – (152.1)
Proceeds above market value on sale and leaseback of property, plant and equipment 1.0 8.3
Lease principal payments 23 (140.6) (175.0)
Cash inflow from settlement of derivatives 52.6 –
Bank loans repaid 23 (1,154.4) (253.5)
Loans raised and facilities drawn down 23 25.1 1,304.7
Dividends paid to non-controlling interest (0.8) (1.8)
Repurchase of own shares (2.2) (2.9)
Net cash flows from financing activities (1,219.3) 727.7
Net (decrease)/increase in cash, cash equivalents and bank overdrafts (820.9) 1,083.6
Cash, cash equivalents and bank overdrafts at beginning of year 23 1,348.7 275.2
Effects of exchange rate fluctuations 23 3.1 (10.1)
Cash, cash equivalents and bank overdrafts at end of year 23 530.9 1,348.7
Babcock International Group PLC full year results for the year ended 31 March 2021 39
1. Basis of preparation and significant accounting policies The financial information has been extracted from the Annual Report, including the audited financial statements for the year ended 31 March 2021. They should be read in conjunction with the Annual Report for the year ended 31 March 2020, which was prepared in accordance with international accounting standards in conformity with the Companies Act 2006 and applicable to companies using International Financial Reporting Standards (IFRS), adopted pursuant to Regulation (EC) No 1606/2002 as it applies in the European Union. The accounting policies used and presentation of these consolidated financial statements are consistent with those in the Annual Report for the year ended 31 March 2020, except as noted below and to comply with amendments to IFRS.
Management has implemented one change in accounting policy during the year ended 31 March 2021. See note 4 for further details.
New and amended standards adopted by the Group
The Group applied the following standards and amendments for the first time for the year beginning on 1 April 2020: The following standards and amendments to IFRSs became effective for the annual reporting period beginning on 1 April 2020 and did not have a material impact on the consolidated financial statements:
IAS 1, ‘Presentation of Financial Statements’ and IAS 8, ‘Accounting policies, changes in accounting estimates and errors’. The amendment is effective for annual reporting periods beginning on or after 1 January 2020 and relates to the definition of material.
IFRS 3, ‘Business Combinations’, amendment is effective for annual reporting periods beginning on or after 1 January 2020 and relates to the definition of a business.
The following standards and amendments to IFRSs become effective for the annual reporting period beginning on 1 April 2020, but were early adopted by the Group for the annual reporting period beginning on 1 April 2019:
IFRS 9 and IFRS 7, ‘Financial Instruments’ and ‘Financial Instruments: Disclosures’, amended effective for periods beginning on or after 1 January 2020 with early adoption allowed. Amendments to IFRS 7 and IFRS 9 have been issued which modify specific hedge accounting requirements and allow it to be assumed that the interest rate benchmark is not altered as a result of the uncertainties of LIBOR reform when performing hedge effectiveness testing. There is no impact on the Group’s fair value hedge accounting or cash flow hedge accounting as a result of adopting the amendments.
New IFRS accounting standards, amendments and interpretations not yet adopted The Group has not early adopted any other amendment, standard or interpretation that has been issued but is not yet effective. It is expected that these standards and amendments will be adopted on the applicable effective date. The following new or amended IFRS accounting standards, amendments and interpretations not yet adopted are not expected to have a significant impact on the Group:
IAS 1, ‘Presentation of Financial Statements’ and IAS 8, ‘Accounting policies, changes in accounting estimates and errors’. Amendment effective for annual reporting periods commencing on or after 1 January 2022. The amendment relates to the classification of liabilities as current or non-current.
IAS 37, ‘Provisions, contingent liabilities and contingent assets’. Amendment effective for periods commencing on or after 1 January 2022. The amendment relates to the clarification of costs that an entity should include as the cost of fulfilling a contract when assessing whether a contract is onerous. Management’s project to determine the impact of this amendment is ongoing, however this is not expected to have a material impact.
IFRS 3, ‘Business Combinations’, amendment effective for periods commencing on or after 1 January 2022. The amendment relates to the identification of liabilities assumed and contingent assets acquired in a business combination.
IFRS 9 and IFRS 7, ‘Financial Instruments’ and ‘Financial Instruments: Disclosures’. These amendments are effective for periods commencing after 1 January 2022 and relate to Phase 2 of Interest Rate Benchmark Reform.
IFRS 16, ‘Leases’, amendment effective 1 June 2020. The amendment provides an optional practical expedient for lessees from assessing whether a rent concession related to COVID-19 is a lease modification.
IFRS 17, ‘Insurance Contracts’, amendment effective 1 January 2023. This has been deferred from the initial effective date of 1 January 2021.
Impact of COVID-19 During the year ended 31 March 2021 the Group’s operations were significantly impacted by COVID-19. Management considered the potential impact of COVID-19 on the Group’s future performance as part of the budgeting and business planning process and concluded that COVID-19 is not expected to materially impact the Group in the medium or long term. The Group’s budget for FY22 includes contingency to address remaining uncertainty.
2. Adjustments between statutory and underlying information
Definition of underlying measures and exceptional items The Group provides alternative performance measures, including underlying operating profit, to enable users to better understand the performance and earnings trends of the Group. These measures are considered to provide a consistent measure of business performance from year to year. They are used by management to assess operating performance and as a basis for forecasting and decision-making and are understood to be used by investors in analysing business performance.
The Group’s alternative performance measures are not defined by IFRS and are therefore considered to be non-GAAP measures. The measures may not be comparable to similar measures used by other companies and they are not intended to be a substitute for, or superior to, measures defined under IFRS.
The Group revised its definition of underlying performance measures in the year, as detailed in this note.
40 Babcock International Group PLC full year results for the full ended 31 March 2021
Underlying operating profit Underlying operating profit excludes certain Specific Adjusting Items. Transactions such as these may happen regularly and could be lumpy and may be profits or losses. As such they may distort the reporting of underlying business performance measures if they are not adjusted for. Specific Adjusting Items include:
Amortisation of acquired intangibles;
Business acquisition, merger and divestment related items (being acquisitions and gains or losses on disposal of assets or businesses);
Gains, losses and costs directly arising from the Group’s withdrawal from a specific market or geography, including closure costs, severance costs, the disposal of assets and termination of leases;
The costs of large restructuring programmes that significantly exceed the minor restructuring which occurs in most years as part of normal operations. Restructuring costs incurred as a result of normal operations are included in operating costs and are not excluded from underlying operating profit;
Profit or loss from amendment, curtailment, settlement or equalisation of Group pension schemes; and
Exceptional items that are significant, non-recurring and outside of the normal operating practice. These items are described as exceptional in order to appropriately represent the Group’s underlying business performance. Exceptional items are set out in the Exceptional items section below.
Share of results of joint ventures and associates (13.1) – (13.1) 58.6 – 58.6
Investment income 6 0.9 – 0.9 1.1 – 1.1
Net finance costs 6 (62.1) – (62.1) (73.0) – (73.0)
(Loss)/profit before tax (101.9) (1,615.4) (1,717.3) 364.3 (453.2) (88.9)
Income tax benefit/(expense) 7 (18.4) 33.7 15.3 (67.4) 40.5 (26.9)
(Loss)/profit after tax for the year (120.3) (1,581.7) (1,702.0) 296.9 (412.7) (115.8)
Included in the Specific Adjusting Items column of the table above is £1,502.1 million relating to the contract profitability and balance sheet review. Further details are included in note 3.
Earnings per share including underlying measures
2021 2020 (restated)
Underlying
£m
Adjusting items
£m
Statutory
£m
Underlying
£m
Adjusting items
£m
Statutory
£m
(Loss)/profit after tax for the year (120.3) (1,581.7) (1,702.0) 296.9 (412.7) (115.8)
Amount attributable to owners of the parent (120.3) (1,581.7) (1,702.0) 294.9 (412.7) (117.8)
Amount attributable to non-controlling interests – – – 2.0 2.0
Weighted average number of shares (m) 505.0 505.0 505.3 505.3
Effect of dilutive securities (m) 4.0 4.0 0.9 0.9
Diluted weighted average number of shares (m) 509.0 509.0 506.2 506.2
Basic EPS (23.8)p (337.0)p 58.4p (23.3)p
Diluted EPS (23.8)p (337.0)p 58.3p (23.3)p
Babcock International Group PLC full year results for the year ended 31 March 2021 41
Details of Specific Adjusting Items The impact of Specific Adjusting Items is set out below:
2021
£m
2020
£m
Amortisation of acquired intangibles (40.2) (67.6)
Business acquisition, merger and divestment related items (49.7) 74.7
Gains, losses and costs directly arising from withdrawal from a specific market or geography (11.1) (20.5)
Profit or loss from amendment, curtailment, settlement or equalisation of Group pension schemes (8.9) –
Restructuring (8.4) (50.9)
Exceptional items (1,497.1) (388.9)
(1,615.4) (453.2)
Income tax benefit
Amortisation of acquired intangibles 8.2 14.5
Gains, losses and costs directly arising from withdrawal from a specific market or geography 1.0 –
Profit or loss from amendment, curtailment, settlement or equalisation of group pension schemes 1.7 –
Restructuring 0.5 9.7
Exceptional tax items and tax on exceptional items 22.3 16.3
33.7 40.5
Explanation of Specific Adjusting Items
Amortisation of acquired intangibles Underlying operating profit excludes the amortisation of acquired intangibles. This item is excluded from underlying results as it arises as a result of purchase price allocations on business combinations, and is a non-cash item which does not change each year dependent on the performance of the business. It is therefore not considered to represent the underlying activity of the Group. Intangible assets arising as a result of the purchase price allocation on business combinations include customer lists, technology-based assets, order book and trade names. Amortisation of internally generated intangible assets is included within underlying operating profit.
Business acquisition, merger and divestment related items Transaction related costs and gains or losses on acquisitions, mergers and divestments of businesses are excluded from underlying operating profit as business combinations and divestments are not considered to result from underlying business performance.
The total net loss relating to business acquisition, merger and divestment related items was £49.7 million, consisting of a £38.2 million loss on disposal of the Group’s share in the Holdfast joint venture and losses arising on disposal of subsidiary undertakings of £0.6 million for Cavendish Nuclear Manufacturing Limited and £10.9 million for Conbras Servicos Tecnicos Supporte Ltda. The prior year included a total net gain of £61.3 million, consisting of a £74.7 million gain on the disposal of Context Information Security Limited partially offset by additional costs from exits in the previous financial year and the costs of disposing of areas of the Group’s nuclear manufacturing business.
Gains, losses and costs directly arising from the Group’s withdrawal from a specific market or geography The Group ceased its Airport baggage handling contract in the year, incurring costs of £4.2 million. Further costs were incurred in relation to exits in the previous financial year from the oil and gas business in Congo (£3.6 million), the overseas Powerlines business (£1.4 million) and certain Rail related contracts (£1.9 million).
In the prior year the Group incurred costs of £7.1 million in relation to the exits of its oil and gas businesses in Ghana and Congo, £3.4 million in relation to the overseas Powerlines business and £3.0 million in relation to the exit of its nuclear manufacturing business.
Restructuring The Group continued to simplify the structure of the Aviation business and incurred a restructuring charge of £9.3 million (2020: £26.5 million). This was offset by the release of £0.9 million of unused provision from prior year restructuring costs in the Nuclear and Land sectors.
Other restructuring in the prior year of £24.4 million relates to the Group’s Civil Nuclear and Rail businesses and includes substantial redundancy costs. £16.5 million was incurred in reducing the cost base in Civil Nuclear following the end of the Magnox contract and in response to the ongoing trading environment in the UK.
Profit or loss from amendment, curtailment, settlement or equalisation of Group pension schemes. The Group incurred a curtailment charge of £7.5 million in relation to the closure of the Rosyth defined benefit pension scheme to future accrual. A charge of £1.4 million was incurred following a court ruling in November 2020 regarding equalisation of pension rights.
Exceptional items See exceptional items section for further detail.
In the prior year, business acquisition and divestment related items and restructuring charges were included as exceptional items (previously referred to as ‘Exits and disposals’). These remain as Specific Adjusting Items but are no longer included as exceptional items in order to provide greater clarity and consistency to the users of the financial statements.
Amendments to underlying definitions for the year ended 31 March 2021 For the year ended 31 March 2021 management has revised the Group’s definition of underlying revenue and underlying operating profit as follows.
42 Babcock International Group PLC full year results for the full ended 31 March 2021
In prior years an underlying revenue measure was provided which included the Group’s share of revenue from investments in equity accounted joint ventures and associates. This measure is no longer provided as the approach adopted by management in reviewing the operating performance of the business is more closely aligned with the statutory measure of revenue.
The Group’s definition of underlying operating profit no longer includes the Group’s share of results from equity accounted joint ventures and associates. This more closely aligns with the approach adopted by management in reviewing the operational performance of the business.
Reconciliation to prior year measures
Underlying income statement measures for the year ended 31 March 2021 that would have been presented under the previous underlying measures definition.
Babcock International Group PLC full year results for the year ended 31 March 2021 43
Underlying income statement measures for the year ended 31 March 2020 (restated) that would have been presented under the previous underlying measures definition
The results for the year ended 31 March 2020 have been restated due to errors identified and a change in accounting policy. Further details are set out in note 4.
Exceptional items Exceptional items are those items which are significant, non-recurring and outside the normal operating practice of the Group.
Note 2021
£m
2020
(restated)
£m
Operating costs
Impairment of goodwill 10 1,243.2 278.4
Impairment of acquired intangibles 11 56.4 –
Impairment of internally generated intangible assets 11 32.7 –
Impairment of property, plant and equipment and aircraft fleet rationalisation 12 142.6 23.5
Impairment of right of use assets 13 46.4 14.2
Onerous contracts – 17.0
Italy fine and related costs (24.2) 48.5
Other – 7.3
Exceptional items – Group 1,497.1 388.9
Exceptional tax items and tax on exceptional items (22.3) (16.3)
Exceptional items – net of tax 1,474.8 372.6
Explanation of exceptional items Exceptional items include the results of the annual goodwill impairment test and other adjustments arising out of the contract profitability and balance sheet review. The contract profitability and balance sheet review includes the results of a major aircraft fleet rationalisation programme which resulted in asset impairments and crystallisation of losses on disposal of surplus aircraft.
Impairment of goodwill The current year impairment test results in an impairment of the Land operating segment goodwill of £425.8 million, the Aviation operating segment goodwill of £808.5 million and the goodwill of £8.9 million allocated to the Aviation oil and gas business CGU. These impairments reflect significant changes in estimates, informed by consideration during the second half of the year ended 31 March 2021, of actual business performance of the Group during the current year and related assessments of future performance of the businesses. Future business performance was informed by the strategy and contract profitability and balance sheet reviews instigated by the Group’s new executive management and the Group’s budget addressing the years ending 31 March 2022, 31 March 2023 and 31 March 2024.
44 Babcock International Group PLC full year results for the full ended 31 March 2021
The Group combines the Africa and Land operating segments into a single Land reportable segment and, in the prior year, the goodwill impairment test was carried out at the reportable segment level rather than at the operating segment level as required by IAS 36. This error was compounded by an administrative error in the calculation of the value-in-use of the Land operating segment and the impact of both errors was an overstatement of Land value-in-use by £886 million.
In addition, the correction of a number of prior period errors in the year ended 31 March 2020, in relation to other financial statement areas, reduced the capital employed used to complete the March 2020 goodwill impairment test. A reduction in capital employed of £239.2 million, in relation to the Aviation operating segment, resulted in the restatement of the Aviation operating segment impairment charge for the year ended 31 March 2020 from £395.0 million, which reflected deterioration in the oil and gas market conditions, to £155.8 million. A reduction in capital employed of £5.1 million, in relation to the Land operating segment and the impact of the overstatement of value-in-use by £886 million noted above, resulted in a Land operating segment impairment charge of £122.6 million in the year ended 31 March 2020.
Impairment of acquired intangibles The Land operating segment previously recognised an acquired intangible in relation to the DSG contract acquisition in 2015. Following publication of the Integrated Spending Review and reassessment of variable revenues under the contract, an impairment assessment under IAS 36, resulted in the impairment of this asset.
Impairment of internally generated intangible assets Impairment charges of £32.7 million were recorded on mainly software assets. Further details are set out in note 11.
Impairment of property, plant and equipment and aircraft fleet rationalisation An impairment charge of £113.3 million was recorded on property, plant and equipment. This charge included the results of a major aircraft fleet rationalisation programme which resulted in a refreshed fleet strategy and the identification of surplus aircraft. Impairments were recorded on surplus aircraft and as the result of value-in-use tests. Losses on disposal were incurred on aircraft disposed of during the year. The prior year charge related to impairments of property, plant and equipment used in the Group’s Aviation oil and gas business and reflected the prevailing market conditions. Further details are set out in note 12.
Impairment of right of use assets Following a review of carrying amounts, a total impairment charge of £46.4 million was recorded in relation to the Group’s right of use assets. This included impairments of aircraft supporting oil and gas and emergency services contracts and the impairment of assets directly attributable to the Group’s DSG contract. The impairment in the prior year related to aircraft supporting oil and gas market contracts. Further details are set out in note 13
Onerous contracts The prior year charge relates to onerous contracts supporting the Aviation oil and gas market. As disclosed in note 4, the Group identified onerous contracts during the year ended 31 March 2021. However, the onerous contracts identified are not considered to meet the criteria for exceptional items (being items that are significant, non-recurring and outside the normal operating practice of the Group) and are therefore not considered further here. We have assessed that onerous contracts identified in the year ended 31 March 2020 meet the criteria for classification as exceptional under the policy in place for the current year.
Italy fine In the year ended 31 March 2020, the Lazio Regional Administrative Court confirmed a €51 million fine issued by the Italian Competition Authority to our subsidiary, Babcock Mission Critical Services Italia SpA (BMCS Italia), for certain anti-trust violations. As a result, the Group recognised a provision of £46.4 million. During the year, BMCS Italia appealed the decision of the Court to the Italian Council of State. In July 2021, the Council, whilst upholding the decision of the Court on the facts, annulled the fine, though allowing the Authority leave to re-calculate it. We expect the Authority to decide on the recalculation of the fine over the next few months. Taking into account the guidance given by the Council to the Authority on the recalculation, we further expect the Authority to reduce the fine. As a result, we have reduced the provision to £20 million, being management’s best estimate of the Group’s obligation based on an interpretation of the Council’s guidance. We have not received any indication from the Authority as to how it will choose to interpret the Council’s guidance.
Other Other charges in the prior year include costs arising from the Group’s Brexit-related restructure.
3. Contract and balance sheet review As announced in January 2021, the Group performed a review of the profitability of its contract portfolio, and the carrying values of assets and liabilities on the balance sheet. The review was carried out by management using the expertise and resource of an independent accounting firm. The initial year-end financial close occurred in early April before completion of the contract profitability and balance sheet review. On 13 April 2021 the Group announced the initial headline unaudited results for the year ended 31 March 2021 before the impact of contract profitability and balance sheet review, along with an early estimate of the findings. The annual goodwill impairment test, required by IAS 36, was included within the scope of the contract profitability and balance sheet review.
The contract profitability and balance sheet scope covered over 100 contracts, representing c.£2.7 billion of annual revenues. The selected contracts received differing levels of review depending upon their perceived risk. Those contracts deemed high risk had a full review of their status, underpinning assumptions and risks and dependencies. Those deemed medium risk had a specific scope review with work targeted at any specific areas of concern, and those deemed low risk had a review with the project manager to gain an understanding of the contract and assess whether any specific scope work should be performed. The balance sheet reviews covered all main balance sheet captions for all sectors, again prioritising balances on a risk basis. As the reviews progressed, more work was performed on contracts where findings raised issues that had not been considered in the initial scoping reviews.
Babcock International Group PLC full year results for the year ended 31 March 2021 45
More than 140 accounting adjustments totalling £2.0 billion (post-tax effect on retained earnings) resulted from the contract profitability and balance sheet review, consisting of:
Cumulative restatement at 1 April 2019 of £308.1 million (being £45.3 million relating to a change in accounting policy and correction of prior year errors of £262.8 million).
Cumulative restatement at 31 March 2020 of £230.7 million (being £59.8 million relating to a change in accounting policy and correction of prior year errors of £170.9 million).
Changes recorded within the current financial year of £1,813.7 million, the vast majority of which are change in estimates.
Of the adjustments recorded in the current year income statement (see table below), £274.7m were charged within underlying operating profit and the vast majority of these amounts related to changes in estimates. Their inclusion within underlying operating profit reflects the fact that the occurrence of such transactions, when taken individually, is part of the ordinary course of business. However, the number and magnitude of the adjustments as a result of the contract profitability and balance sheet review far exceeded what would normally be expected in the Group in any one period, hence the additional disclosure.
Prior year restatements There are a number of prior year errors that have been recognised. Adjustments were denoted as errors, rather than changes in estimates, when was identified that assumptions or methodologies were used which the Group should have known at the time were incorrect. One accounting policy has also been changed to better represent certain maintenance arrangements in the Aviation sector, and the errors and the policy change result in prior year restatements. Prior year restatements arising on or before 31 March 2019 were recorded in the 1 April 2019 opening balance sheet in these financial statements, with the continuing impact of these errors and other errors arising in the year ended 31 March 2020 being recorded in the income statement for the year ended 31 March 2020.
The impacts of the contract profitability and balance sheet review adjustments on the income statement, including the results of the annual goodwill impairment test, are summarised as follows:
2021 2020
Underlying
£m
Specific
Adjusting Items
£m
Statutory
£m
Underlying
£m
Specific
Adjusting Items
£m
Statutory
£m
Revenue impacts (207.4) – (207.4) (21.0) – (21.0)
Operating profit/(loss) impacts
Impairment/disposal of goodwill and acquired intangible assets – (1,349.4) (1,349.4) – 130.5 130.5
Impairment of non-current assets (5.8) (32.7) (38.5) 0.7 – 0.7
Impairment of property plant and equipment and right of use assets – (156.9) (156.9) (21.6) (1.4) (23.0)
Impairment/write down of current assets (142.6) (0.8) (143.4) (19.5) – (19.5)
Introduction of/increase to liabilities (126.3) (1.0) (127.3) 0.6 – 0.6
Share of income from JVs and associates (37.1) – (37.1) – – –
Profit/(loss) before tax impacts (311.8) (1,540.8) (1,852.6) (39.8) 129.1 89.3
Tax adjustments (7.5) – (7.5) (12.4) – (12.4)
Tax effect 29.3 17.1 46.4 3.0 (2.5) 0.5
Loss after tax for the year impacts (290.0) (1,523.7) (1,813.7) (49.2) 126.6 77.4
Summarised cumulative adjustments to retained earnings, including the results of the annual goodwill impairment test, are as set out below:
£m
Restatement as at 1 April 2019 (308.1)
Adjustments recognised in the year ended 31 March 2020 77.4
Total restatement at 31 March 2020 (230.7)
Adjustments recognised in the year ended 31 March 2021 (1,813.7)
Total adjustments recognised at 31 March 2021 (2,044.4)
The summary of the adjustments in the table above is set out below:
Revenue: These adjustments have two components within them. Firstly is a correction of an error where revenue had been recognised on a contract the terms of which had been varied in February 2020. The effect of the contract change is that the Group is deemed an agent of the customer, not a principal and therefore the revenue should not be recognised. As a result of identifying this error, £71.8 million of revenue initially recognised in the year ended 31 March 2021 was reversed together with £11.6 million of revenue in relation to the year ended 31 March 2020. The second component of revenue adjustments reflects reassessments of the progress and profitability of a number of contracts across the Group.
46 Babcock International Group PLC full year results for the full ended 31 March 2021
Impairment of goodwill and acquired intangible assets: In the current year, goodwill was impaired by £1,243.2 million and acquired intangible assets were impaired by £56.4 million. As detailed in note 13, the impairments of the Land and Aviation sectors’ goodwill of £425.8 million and £817.4 million respectively were largely as a result of reduced forecasts of future cash flows and an increase in the discount rate used to discount them.
Contract profitability and balance sheet review adjustments of £64.8 million were also recorded to allocate the goodwill that should have been allocated to the Holdfast disposal (June 2020) and to correct the allocation of goodwill to the Conbras disposal (October 2020 and provided in the first half of the financial year). Further, £56.4 million was impaired in relation to the DSG contract acquired intangible as its carrying value could no longer be justified following the reassessment of the contract profitability. Partially offsetting this is the reversal of amortisation of £15.0 million in relation to the oil and gas business acquired intangible reflecting management’s judgement to dispose of this intangible at 1 April 2019 as a result of a reassessment of its useful economic life. This has been classified as a prior year error.
Previously a goodwill impairment of £395.0 million was recorded in the year ended 31 March 2020 against the Aviation sector goodwill. The credit of £130.5 million in the year ended 31 March 2020 is a reduction to that impairment and is the result of three prior year errors. Firstly, credits of £239.2 million and £5.1 million reflect the cumulative amount of prior year errors in relation to the capital employed in the Aviation and Land operating segments respectively, and therefore reduce the amount that should have been impaired in the year ended 31 March 2020. Secondly, calculation errors in the impairment test of Land goodwill in the year ended 31 March 2020 result in a charge of £127.7 million and, thirdly, a credit of £13.9 million reflects reduced intangible amortisation in relation to the oil and gas business following the derecognition of the intangible asset at 1 April 2019.
Impairment of other non-current assets: The adjustments within underlying operating profit in the year ended 31 March 2021 largely relate to the write off of a loan to one of our joint ventures which is no longer deemed recoverable. The £32.7 million within the year ended 31 March 2021 Specific Adjusting Items is largely due to the impairment of internally generated intangibles, mainly computer software.
Impairment of property, plant and equipment and right of use assets: Impairments of £156.9 million largely relate to fleet values in the Aviation sector where aircraft carrying values are no longer expected to be recovered through use or sale. Also included are impairments of leasehold property of £12 million and plant and equipment of £11 million. The prior year error of £21.6 million within underlying profit is all from the Aviation sector and relates to the expensing of previously capitalised maintenance and the reversal of aircraft vendor credit notes previously recognised within profit. Further details are set out in note 5.
Impairment/write down of current assets: This covers the reassessment of several contract profitability margins and the recoverability of many trade and other receivables (including contract assets and accrued income) as well as an increase in obsolescence provisions for inventory. This is the summation of many contract reassessments across the group with £62.0 million in Aviation, £36.6 million in Land, £21.8 million in Marine and £20.6 million in Nuclear. The prior year error of £19.5 million relates to Aviation and corrects the capitalisation of mobilisation and other costs as well as revenue milestones recognised for an aircraft the Group did not take delivery of.
Introduction of/increase to liabilities: These increases reflect reassessment of several contract profitability margins, onerous contract provisions, aircraft maintenance accruals, and other provisions. £72.6 million are in the Aviation sector, £35.7 million in Land and £11.4 million in Marine. Around £70 million of the liabilities are expected to outflow beyond one year.
Share of income from joint ventures and associates: Historically the Group adjusted the results of the joint ventures and associates before equity accounting the relevant share in the income statement. The Group has decided such results should be incorporated without adjustment by the Group – unless required to align with IFRS. In the prior periods the Group’s share of joint venture and associates results were adjusted by £23.1 million cumulatively, and a charge of this amount is booked as a change in estimate in the year ended 31 March 2021 to reverse these amounts. In addition, following the termination of the Group’s Dounreay decommissioning contract on 31 March 2021, as a consequence of the NDA’s decision to take contract delivery in-house, the Group booked an adjustment of £10.9 million to reflect the estimated contract settlement with the NDA. Contract settlements remain outstanding in relation to works carried out some years ago by the Land sector’s ABC joint venture and, following developments during the year, a further adjustment of £3.1 million was recorded and represents an updated assessment of the contract outcomes.
Tax adjustments: The underlying impact of £7.5 million in the year ended 31 March 2021 relates to the write off of deferred tax assets in Spain of £19.2 million now considered not recoverable within the Group’s forecasting horizon, together with a £21.6 million credit, being the recognition of tax deductibility on the DSG contract intangible amortisation now confirmed with HMRC. The prior year error of £12.4 million is the write off of a deferred tax asset incorrectly calculated in the prior year.
Change in accounting policy: During the year, management amended the Group’s accounting policy regarding Power By the Hour agreements. At 31 March 2021 this change in policy reduces property, plant and equipment by £65.6 million and trade and other receivables by £3.1 million and increases trade and other payables by £8.1 million. Further information is detailed at note 5.
Babcock International Group PLC full year results for the year ended 31 March 2021 47
4. Prior year restatements The following table summarises the impact of restatements arising from the change in accounting policy and correction of prior year errors on Group net assets and earnings per share.
31 March 2020 1 April 2019
Change in accounting
policy Prior period error
Change in accounting
policy Prior period error
Impact on non-current assets (£m) (48.7) (135.7) (37.2) (224.8)
Impact on current assets (£m) (2.8) 445.6 – 549.3
Impact on non-current liabilities (£m) – 79.2 – (1.9)
Impact on current liabilities (£m) (8.3) (564.5) (8.1) (578.2)
Total impact on equity (£m) (59.8) (175.4) (45.3) (255.6)
Impact on profit after tax (£m) (14.6) 92.0 N/A N/A
Impact on Group earnings per share (basic) (pence) (2.9) 18.6 N/A N/A
Impact on Group earnings per share (diluted) (pence) (2.9) 18.6 N/A N/A
Detail of prior period errors and change in accounting policy Through the contract profitability and balance sheet review a number of prior year errors have been identified, in addition to one area where there is a more appropriate alternative accounting policy. Prior year financial statements have been restated for these changes as indicated below.
1 April 2019 – Group statement of financial position (extract)
* The table above includes only those financial statement line items which have been restated. The total non-current assets, current assets, non-current liabilities, current liabilities and equity do not therefore represent the sum of the line items presented above.
48 Babcock International Group PLC full year results for the full ended 31 March 2021
31 March 2020 – Group statement of financial position (extract)
* The table above includes only those financial statement line items which have been restated. The total non-current assets, current assets, non-current liabilities, current liabilities and equity do not therefore represent the sum of the line items presented above.
Babcock International Group PLC full year results for the year ended 31 March 2021 49
31 March 2020 – Impact on the income statement for the year ended 31 March 2020
The total impact of prior year errors and change in accounting policy on the loss for the year ended 31 March 2020 period is £77.4 million.
31 March 2021 The impact of the change in accounting policies on the results for the year ended 31 March 2021 is as follows:
Change in
accounting policy
(i) Power By the Hour
maintenance
arrangements
Group statement of financial position (extract)
Assets
Non-current assets
Property, plant and equipment (54.5)
Current assets
Trade and other receivables (3.1)
Liabilities
Current assets
Trade and other payables (8.1)
Equity (65.6)
Retained earnings (65.6)
Group income statement (extract)
Cost of revenue (6.0)
(Loss) / Profit before tax (6.0)
Income tax 1.0
(Loss) / Profit for the period (5.0)
Impact on basic earnings per share (1.0)
Impact on diluted earnings per share (1.0)
Definitions Aircraft are considered in two key components for accounting purposes. ‘Rotables’ are major life limited parts, such as engines, gearboxes and rotor blades, where value is consumed on a flying hour basis. The ‘airframe’ represents the remainder of the aircraft, and includes the body and other structural, mechanical and electrical installations necessary for flight. These definitions exclude ‘equipment’ which is separable from the aircraft and mission specific, such as medical and firefighting installations.
50 Babcock International Group PLC full year results for the full ended 31 March 2021
Change in accounting policy
i. Power By the Hour (PBH) agreements The Group is party to a number of ‘Power By the Hour’ (‘PBH’) maintenance arrangements, under which the provider supplies rotable and airframe parts as required in exchange for a fixed price per flying hour. The provider therefore assumes the risk associated with the failure rate of parts.
Certain of these payments have previously been capitalised within property, plant and equipment, while the rotable parts which are subject to the arrangement have been depreciated as a separate component of the aircraft. Depreciation of the PBH payments has commenced as rotable and airframe parts are provided under the arrangement.
Following a review of the terms of these arrangements, a comparison to policies of peer companies (where publicly available) and considering the requirements and application of IAS 16 ‘Property, Plant and Equipment’ (‘IAS 16’), it was determined that a more reliable and relevant accounting policy would be to recognise PBH payments in the income statement as incurred, but not to separately depreciate the rotable parts covered by the arrangement. This is more relevant as it reflects the substance of the arrangements, which is to maintain the parts covered at their full potential. It is more reliable in recording an expense in the income statement as there is no depreciation charge, which requires the use of an accounting estimate. The policy is also more prudent as (a) the cost of rotable parts does not change over time with inflation and (b) the elements of the PBH cost which reimburse the risk assumed by the PBH provider and which cover ancillary benefits such as access to the supply chain of the provider are directly expensed rather than initially capitalised.
This change in policy reduces property, plant and equipment and trade and other receivables and increases trade and other payables, reducing retained earnings by £45.3 million at 1 April 2019, £59.8 million at 31 March 2020 and £65.6 million at 31 March 2021. Trade and other receivables and trade and other payables are impacted by this change in policy as amounts were recorded in trade and other receivables and trade and other payables under the previous policy, which was deemed to be inappropriate. The tables above set out the impact on each line item of the statement of financial position and income statement.
Correction of errors
ii. Maintenance of leased aircraft Leased aircraft are typically required to be returned to lessors with rotables in a similar condition to that which existed at the commencement of the lease. Betterment and detriment clauses set out the balancing payments required if these conditions are not met.
The cost of repair and replacement parts which extends the life of rotables has typically been capitalised as a leasehold improvement and depreciated over the term of the lease, resulting in an increasing cost of depreciation towards the end of the lease.
Following a review of lease return conditions and considering the requirements and application of IAS 16, it has been determined that the Group should record a leasehold improvement asset or dilapidation provision which represents the difference between the condition of the rotables at any given point in time and the return condition. This reflects the amount of leasehold improvement which will generate future benefits and the value of the liability to restore parts to the return condition, and results in a more consistent profile of cost recognition over the duration of the lease.
The correction of this error reduces the carrying value of property, plant and equipment by £26.5 million and increases trade and other payables and provisions by £2.9 million and £9.7 million, respectively, at 1 April 2019. There is an increase in operating costs of £8.2 million in the year ended 31 March 2020, resulting in a reduction in property, plant and equipment of £30.5 million and an increase in trade and other payables and provisions of £2.9 million and £13.7 million, respectively, at 31 March 2020.
iii Rotables – maintenance of owned aircraft Rotables are depreciated as a separate component of the aircraft on the basis of flying hours, as this most appropriately reflects the consumption of economic benefits.
Following a review of balances capitalised as rotables, it was identified that in certain cases the carrying value of parts replaced prior to completion of the expected number of flying hours had not been written off, depreciation rates had not been regularly updated to reflect the latest actual cost of replacement parts and the remaining number of flying hours used for accounting purposes had not been regularly checked for accuracy against contemporaneous technical records. It was also identified that certain parts capitalised related to the airframe rather than rotables and should have been expensed as these represented a replacement rather than enhancement to the aircraft. Detailed exercises were undertaken to assess the remaining life of rotables against technical records, determine the actual cost of parts capitalised and review balances for airframe parts which should not have been capitalised under IAS 16.
The correction of these errors reduces property, plant and equipment by £25.8 million at 1 April 2019. There is a charge to the income statement of £5.0 million for the year ended 31 March 2020, resulting in a reduction in property, plant and equipment of £30.8 million at 31 March 2020.
iv. Rotables – maintenance of customer aircraft The Group operates a number of aircraft which are provided by customers. The cost of repair and replacement parts which extends the life of rotables has been capitalised within property, plant and equipment and depreciated over the contract term in a manner similar to that applied for leased aircraft.
Following a review of the terms of these customer contracts, it has been determined that these costs should not have been capitalised as they represent the enhancement of a customer asset rather than an asset of the Group and therefore do not meet the recognition requirements of IAS 16.
The correction of this error reduces property, plant and equipment by £25.1 million at 1 April 2019. There is an increase in operating costs of £3.0 million for the year ended 31 March 2020, resulting in a reduction in property, plant and equipment of £28.1 million at 31 March 2020.
Babcock International Group PLC full year results for the year ended 31 March 2021 51
v. Mobilisation costs The Group incurs various costs in mobilising contracts and certain of these costs have been capitalised as contract fulfilment assets. Following a review of all such assets, it has been identified that certain costs did not meet the requirements of IFRS 15 to be capitalised as contract fulfilment assets as there was insufficient evidence that the costs generated or enhanced resources which the Group would use in performing the contract. The key areas related to lease costs, maintenance costs and personnel costs incurred prior to contract commencement or the achievement of full operating capability. A significant proportion of these costs was incurred in mobilising the Group’s Air Ambulance contract in Norway, which commenced in July 2019.
The correction of these errors reduces trade and other receivables by £18.6 million and property, plant and equipment by £0.8 million at 1 April 2019. There is an increase in operating costs of £11.5 million for the year ended 31 March 2020, resulting in reductions in trade and other receivables of £30.1 million and property, plant and equipment of £0.8 million at 31 March 2020.
vi. Credit notes The Group receives certain credit notes from aircraft manufacturers at the point of placing orders for aircraft, exercisable against the purchase of future parts and services. These credit notes have previously been recognised in the income statement on receipt and recorded within trade and other receivables until used to purchase parts or services, which is typically within a short period.
Following a review of the substance of these credit notes, it has been determined that these represent a discount on the purchase price of the aircraft. In the case of aircraft which are owned by the Group, credit notes should therefore be recognised as a reduction in the cost of aircraft acquired. The majority of aircraft ordered by the Group in recent years have been sold and leased back prior to delivery, typically at the gross purchase price excluding the credit note, resulting in a gain on disposal of the aircraft being recognised in the income statement. The accounting for these sale and leasebacks has been corrected, reversing the gain recognised on disposal and recalculating reduced right of use assets arising from the leasebacks with reference to the discounted purchase price of the aircraft.
In the case of aircraft acquired for customers under an aircraft supply contract, the credit notes should be recognised as a reduction in operating costs.
The correction of these errors results in reductions in right of use assets of £35.3 million and property, plant and equipment of £2.4 million at 1 April 2019. There is an increase in operating costs of £5.1 million for the year ended 31 March 2020, resulting in cumulative decreases in the carrying value of right of use assets of £39.7 million, property, plant and equipment of £2.4 million and trade and other receivables of £0.7 million at 31 March 2020.
vii. Deferred tax At 31 March 2020 a net deferred tax asset of £71.7 million was recognised in the Aviation operating segment in relation to the Group’s Spanish entities. The recognition of this asset was supported by forecasts which showed the Spanish tax group becoming profitable in FY23 with significant further growth beyond this date. However, this analysis did not appropriately take into account restrictions on the utilisation of various tax attributes within Spanish tax law which, when corrected, extend the duration over which the deferred tax asset is expected to be fully utilised to over 20 years. Although the relevant tax attributes can be carried forward indefinitely, it was determined that appropriately risk-weighted profit forecasts supported only a portion of the deferred tax asset, reducing the deferred tax asset by £25.5m at 1 April 2019 and £37.9m in total at 31 March 2020. This is partially offset by the tax benefit of other CPBS adjustments which are recognised to the extent it is appropriate to do so in the relevant jurisdiction.
The correction of this error (after the partial offset by the tax benefit of other adjustments) results in a reduction in deferred tax assets of £8.8 million at 1 April 2019 and £16.3 million at 31 March 2020.
As a result of the accelerated amortisation of the acquired intangible in the oil and gas operating segment, there has been a reduction in the deferred tax liability of £11.5 million at 1 April 2019 and £8.7 million at 31 March 2020. Further information is included at ‘x. Other errors’.
viii. Balance sheet reclassifications Supply chain financing
The Group entered into certain Supply Chain Financing Facilities (‘SCF arrangements’) in the Aviation operating segment. Outstanding balances financed through those arrangements were previously accounted for within trade and other payables. The Group has reassessed this classification and has determined that these liabilities should be reclassified as bank and other borrowings. This has also resulted in an increase to property, plant and equipment, trade and other receivables, and other borrowings, as part of the Supply Chain Financing Facilities has been used for deposits on aircraft.
At 1 April 2019, correction of this error results in an increase in property, plant and equipment of £54.7 million, an increase in trade and other receivables of £21.6 million, an increase in bank and other borrowings of £113.5 million and a reduction in trade and other payables of £37.2 million. At 31 March 2020, correction of this error results in an increase in bank and other borrowings of £93.3 million, an increase in property, plant and equipment of £32.9 million and a reduction in trade and other payables of £60.4 million. This adjustment also impacts on the cash flow statement, resulting in an increase in cash flows from financing activities and reduction in cash flows from operating activities.
Cash pool arrangement
An error has been identified in relation to the accounting for the Group’s notional cash pool arrangement. Cash and cash equivalents and bank and other borrowings should have been presented on a gross rather than net basis, in line with the requirements of IAS 32, ‘Financial Instruments: Presentation’ (‘IAS 32’). The correction of this error results in increases in cash and cash equivalents and bank other borrowings of £569.5 million at 1 April 2019 and £494.5 million at 31 March 2020. There is no impact on the income statement.
Norway mobilisation
The cost of acquiring an aircraft simulator and certain flight and medical equipment in mobilising the Norway Air Ambulance contract has been capitalised as a contract fulfilment cost. IFRS 15 requires that costs that are within the scope of another Standard shall be accounted for in accordance with those other Standards. These costs are within the scope of IAS 16 and should therefore have been capitalised as property, plant and equipment.
52 Babcock International Group PLC full year results for the full ended 31 March 2021
The correction of this error increases property, plant and equipment and reduces trade and other receivables by the same amount, being £12.1 million at 1 April 2019 and £12.7 million at 31 March 2020.
Reclassification of deferred tax asset to income tax receivable
The gross deferred tax asset included amounts that should have been classified as income tax receivable and a reduction in deferred tax liabilities. In addition, deferred tax assets and liabilities have been re-stated in strict accordance with the right-of-set-off rules whereby deferred tax assets and deferred tax liabilities in the same jurisdiction are offset where there is a legally enforceable right to offset corporation tax assets and corporation tax liabilities, and the deferred tax assets and deferred tax liabilities relate to income taxes levied by the same Taxation Authorities.
Correction of this error reduces the deferred tax asset by £92.4 million, increases income tax receivable by £26.2 million and decreases the deferred tax liability by £66.2 million at 1 April 2019. At 31 March 2020 correction of this error results in a decrease in the deferred tax asset of £113.8 million, an increase to income tax receivable of £41.0 million and a decrease in deferred tax liabilities of £72.8 million.
Reclassification of right of use assets to property, plant and equipment
On transition to IFRS 16, finance leases that were previously recorded as property, plant and equipment were transferred to right of use assets. However, as part of the procedures for the year ended 31 March 2021 it was identified that the reclassification was processed as a movement during the year ended 31 March 2020, as opposed to at 1 April 2019, and the amount reclassified was incorrect. Correction of this error results in a reclassification from property, plant and equipment to right of use assets of £66.1 million at 1 April 2019 and £6.7 million at 31 March 2020.
ix. Goodwill impairment As a result of the prior year adjustments recorded in the Aviation and Land operating segments, the capital employed used in the goodwill impairment assessment at 31 March 2020 reduced. This resulted in a reduction in the impairment charge of £239.2 million in the Aviation operating segment and a reduction in the impairment charge of £5.1 million in the Land operating segment.
In addition, following a review of the methodology applied in goodwill impairment testing, the Group identified that the assessment had been performed at the reportable segment rather than the operating segment level. The operating segment level is the highest level at which goodwill can be monitored in accordance with IAS 36. In addition, an administrative error was identified in the calculation of the Land operating segment value in use.
The impairment test was re-performed to correct the administrative error and with the cash flows of the Africa and Land operating segments assessed separately. This resulted in an impairment of goodwill allocated to the Land operating segment of £127.7 million at 31 March 2020. No impairment was required at 1 April 2019 as re-performance of impairment analysis at that date identified sufficient headroom between the recoverable amount and the carrying value of relevant assets. Further details are included in note 10.
x. Other errors A number of other errors have been identified as set out below.
Other intangible assets
Balances were identified relating to IT assets capitalised under IAS 38 – Intangible Assets which are no longer used by the business, and should therefore have been written off in previous years. The correction of this error reduces intangible assets by £2.0 million at 1 April 2019. There is a reduction in operating costs of £0.7 million for the year ended 31 March 2020, resulting in a reduction in intangible assets of £1.3 million at 31 March 2020.
Through the goodwill impairment analysis for the oil and gas operating segment it was identified that the carrying value of the operating segment was less than the recoverable value. Management reviewed the acquired intangible asset included in this operating segment and determined that the customer relationships included in the intangible asset were no longer part of the customer base, and were not part of the customer base at 1 April 2019. The useful expected life of the acquired intangible asset has therefore been revised and the intangible asset has been disposed of at 1 April 2019. This has resulted in an adjustment to acquired intangible assets of £57.9 million at 1 April 2019 and £43.5 million at 31 March 2020. The amortisation of the intangible asset for the year ended 31 March 2020 has been reversed, resulting in a reduction in operating costs of £13.9 million.
Property plant and equipment
Capitalised maintenance costs were identified in relation to aircraft which had been sold or returned to lessors, or where the underlying customer contract had been completed. The correction of this error reduces property, plant and equipment by £6.5 million at 1 April 2019. There is a reduction in operating costs of £0.8 million in the year ended 31 March 2020, resulting in a reduction in property, plant and equipment of £5.7 million at 31 March 2020.
A number of errors were identified where an inappropriate useful life was assigned to aircraft and capitalised maintenance, due to incorrect application of the Group’s depreciation policy. The correction of these errors reduces property, plant and equipment by £5.2 million at 1 April 2019. There is a £0.3 million reduction in operating costs in the year end 31 March 2020, resulting in a reduction in property, plant and equipment of £4.9 million at 31 March 2020.
It was identified that a number of aircraft impairments recorded in local statutory financial statements had not been reflected in the consolidated Group financial statements. The inconsistency in carrying values arising from the fair value exercise performed for the consolidated Group financial statements following a business combination was a contributory factor in the failure to reflect the changes in those financial statements. The correction of these errors reduces property, plant and equipment by £3.9 million at 1 April 2019. There is a £0.2 million reduction in operating costs in the year ended 31 March 2020, resulting in a reduction in property, plant and equipment of £3.7 million at 31 March 2020.
It was identified that the cost of constructing a customer hangar on land leased by the Group was being depreciated beyond the term of the customer contract and the fixed end date of the lease, both of which have passed. The correction of this error reduces property, plant and equipment by £1.3 million at 1 April 2019 and 31 March 2020.
A capitalised aircraft pre-delivery payment was found to have been utilised in the purchase of goods or services and should therefore have been be written off. The correction of this error reduces property, plant and equipment by £1.1 million at 1 April 2019 and 31 March 2020.
Babcock International Group PLC full year results for the year ended 31 March 2021 53
Management has also identified maintenance costs which should not have been capitalised, resulting in an adjustment to property, plant and equipment by £1.4 million at 1 April 2019 and 31 March 2020.
Additionally, it has been identified that certain elements capitalised under the PBH arrangements were not suitable for capitalisation under the previous accounting policy or the updated accounting policy. Correction of this error has resulted in a reduction of property, plant and equipment of £4.1 million at 1 April 2019 and 3.1 million at 31 March 2020.
Right of use assets and lease liabilities
Following a review of the lease population it was identified that right of use assets and lease liabilities were understated at 31 March 2020. This was in part due to a system generated error where previously added leases were deleted from the lease management system and in part due to replacement leases not being identified and communicated to finance teams. Correction of this error has resulted in an increase in right of use assets by £16.6 million, an increase in non-current lease liabilities by £13.7 million and an increase in current lease liabilities by £2.9 million at 31 March 2020.
Inventories
Following a review of the segregation of inventories into those owned by the Group and by customers, it was identified that certain items recognised within inventories were owned by customers of the Group and should not therefore be recorded under IAS 2, ‘Inventories’. The correction of this error results in a reduction to inventories of £1.8 million at 1 April 2019. There is an increase in operating costs of £0.1 million for the year ended 31 March 2020, resulting in a reduction in inventories of £1.9 million at 31 March 2020.
Trade and other receivables
Two instances were identified where reductions in lease costs in future periods were recognised in the income statement when agreed, with an asset recognised within trade and other receivables and subsequently amortised, rather than in the future periods to which the reductions related. The correction of these errors results in a reduction in trade and other receivables of £8.7 million at 1 April 2019. There is a decrease in operating costs of £2.9 million for the year ended 31 March 2020, resulting in a decrease in trade and other receivables of £5.8 million at 31 March 2020.
Following a review of the accounting for certain tax payments made by a Group entity on behalf of other Group entities, a number of inconsistencies were identified between inter-company receivables and payables. The correction of these errors decreases trade and other receivables and retained earnings by £11.5 million at 1 April 2019. There is a reduction in operating costs of £0.1 million for the year ended 31 March 2020, resulting in a reduction in trade and other receivables of £11.4 million at 31 March 2020.
It was identified that amounts due from customers for contract work were not recoverable, as the rates included in this balance were disputed by the customer. The correction of this error results in a reduction in trade and other receivables of £8.2 million at 1 April 2019. There is a reduction in revenue of £0.3 million for the year ended 31 March 2020, resulting in a reduction in trade and other receivables of £8.5 million at 31 March 2020.
An error has been identified relating to a pain/gain share agreement, in which a reduction in revenue was incorrectly recorded as an expense. The correction of this error results in a reduction in trade and other receivables of £1.8 million and trade and other payables of £1.0 million at 1 April 2019. Correction of this error at 31 March 2020 results in a reduction in trade and other receivables of £3.3 million and trade and other payables of £2.6 million. There is a reduction in revenue of £1.6 million and a reduction in operating costs of £1.6 million for the year ended 31 March 2020.
It was identified that the Group was not entitled to certain revenue recognised on the achievement of milestones relating to the provision of aircraft. The correction of this error decreases revenue by £8.3 million and operating costs by £7.3 million in the year ended 31 March 2020, resulting in reductions in amounts due from customer for contract work of £8.3 million and trade and other payables of £7.3 million at 31 March 2020.
It was identified that certain receivables should not have been considered to be recoverable. The correction of this error decreases trade and other receivables by £0.8 million at 1 April 2019. Further receivables which should not have been considered to be recoverable were identified in the year ended 31 March 2020, resulting in an increase in operating costs for that year and a reduction in trade and other receivables of £2.1 million at 31 March 2020.
A number of warranty claims from original equipment manufacturers were identified relating to 2015 which should have been provided for in accordance with the Group’s accounting policies. The correction of this error decreases trade and other receivables by £2.6 million at 1 April 2019 and 31 March 2020, with a corresponding decrease in income tax payable of £0.8 million.
Additionally, management has identified capitalised bid costs that do not meet the criteria for capitalisation under IFRS 15. Correction of this error results in a decrease in capitalised bid costs of £5.1 million at 1 April 2019 and 31 March 2020.
Trade and other payables
As mentioned under trade and other receivables above, correction of the error related to milestone revenue recognition decreases operating costs by £7.3 million for the year ended 31 March 2020 and trade and other payables by £7.3 million at 31 March 2020.
As mentioned under trade and other receivables above, correction of the error related to a pain/gain share agreement decreases trade and other payables by £1.0 million at 1 April 2019. There is a decrease in the operating costs by £1.6 million for the year ended 31 March 2020, decreasing trade and other payables by £2.6 million at 31 March 2020.
A number of inconsistencies were identified between inter-company receivables and payables. The correction of these errors decreases trade and other payables and increases retained earnings by £8.2 million at 1 April 2019 and 31 March 2020.
It was identified that a liability recorded during year ended 31 March 2020 was not supportable at the year end. The correction of this error decreases operating costs for the year ended 31 March 2020 by £1.1 million and decreases trade and other payables by the same amount at 31 March 2020.
54 Babcock International Group PLC full year results for the full ended 31 March 2021
It was identified that a customer had been mischarged by £3.3 million due to an incorrect margin being applied to the costs incurred by the Group. The correction of this error increases trade and other payables by £2.8 million at 1 April 2019. There is an increase in operating costs of £0.5 million for the year ended 31 March 2020, resulting in a reduction in trade and other payables of £3.3 million at 31 March 2020.
Provisions for other liabilities
In March 2020, significant damage was sustained to the main ballast tank on a vessel undergoing work by the Group. Although the Group maintains insurance against this type of damage, a proportion of the costs were not covered by this insurance. Correction of this error has resulted in an increase to non-current provisions of £2.3 million and current provisions of £3.2 million.
Taxation
The cumulative tax benefit of these other errors increases deferred tax assets, see vii "deferred tax", or increases income tax receivable/decreases income tax payable by £3.2m as at 1 April 2019 and £4.7m as at 31 March 2020. A tax benefit is not available for the full cumulative expense recorded in each year, as some items are not deductible for tax purposes or arise in territories in which additional deferred tax assets cannot be recognised.
Other financial assets and liabilities (hedging)
Following a review of the Group’s foreign currency hedging arrangements in relation to aircraft leases in Norway, it was identified that insufficient contemporaneous documentation was recorded in order to designate part of the arrangement as a hedge for accounting purposes. The correction of this error results in an increase in other financial liabilities of £6.0 million and a decrease in other reserves of £1.7 million at 1 April 2019. There is a decrease in operating costs for the year ended 31 March 2020 of £3.1 million, with a cumulative increase in other financial liabilities of £18.7 million and a decrease in other reserves of £15.8 million. There is a decrease in other comprehensive income of £13.5 million for the year ended 31 March 2020.
Investments in joint ventures and associates
The Group has an equity accounted investment in AirTanker Holdings Limited. It has been identified that this investment became a deficit during the year ended 31 March 2019 as a result of movements in the valuation of derivatives held by the company, and that the Group’s investment in joint ventures and associates balance at 1 April 2019 and 31 March 2020 included this negative balance. However, as the Group has not taken on any commitment to fund AirTanker Holdings Limited’s liabilities, in accordance with IAS 28 ‘Investments in Associates and Joint Ventures’ the Group should have ceased decreasing the related investment balance once it became negative.
The correction of this error results in an increase in investments in joint ventures and associates of £8.9 million and an increase in other reserves of the same amount at 1 April 2019. There is an increase in other comprehensive income of £5.0 million for the year ending 31 March 2020, relating to movement on the derivatives held by the investment, resulting in an increase in investments in joint ventures and associates of £13.9 million and an increase in other reserves of the same amount at 31 March 2020.
Revenue and cost of revenue items not impacting the statement of financial position
An overstatement of revenue and cost of revenue has been identified in relation to pass-through revenue on the Phoenix contract in the year ended 31 March 2020. The Group had previously concluded that it acted as principal in the arrangement. It was determined that a contract amendment in February 2020 represented a contract modification under IFRS 15, following which the Group has been acting as an agent. The correction of this error results in a decrease in revenue and cost of revenue of £11.6 million in the year ended 31 March 2020. There was no impact to reported profit as a result of this adjustment.
Babcock International Group PLC full year results for the year ended 31 March 2021 55
Impact of prior period restatements on the cash flow statement
The prior year restatements described above have had the following impact on the cash flow statement for the year ended 31 March 2020, due to restatement of the statement of financial position and income statement:
31 March
2020
(previously
published)
£m
Impact of
prior year
errors
£m
31 March
2020
(restated)
£m
Cash flows from operating activities
Loss for the year (193.2) 77.4 (115.8)
Income tax (credit)/expense 15.0 11.9 26.9
Depreciation and impairment of property, plant and equipment 94.2 (2.9) 91.3
Depreciation and impairment of right of use assets 143.6 (6.1) 137.5
Amortisation and impairment of intangible assets 96.5 (14.6) 81.9
Goodwill impairment 395.0 (116.6) 278.4
Investment income 1.1 (1.1) –
Net derivative fair value movement through profit or loss – (3.1) (3.1)
Loss on disposal of property, plant and equipment 3.3 0.6 3.9
Loss on disposal of intangible assets 0.2 (0.1) 0.1
Cash generated from operations before movement in working capital and retirement benefit payments* 497.2 (54.6) 442.6
Decrease in receivables (8.4) 48.4 40.0
Increase in payables 7.4 (32.1) (24.7)
Increase in provisions 62.4 9.4 71.8
Cash generated from operations* 474.2 (28.9) 445.3
Interest received 13.5 (0.2) 13.3
Net cash flows from operating activities* 330.4 (29.1) 301.3
Cash flows from investing activities
Proceeds on disposal of property, plant and equipment 30.1 46.4 76.5
Purchases of property, plant and equipment (145.5) (45.8) (191.3)
Purchases of intangible assets (29.1) 0.1 (29.0)
Lease assets repaid – 49.9 49.9
Investment in joint ventures – (0.3) (0.3)
Loan movements in joint ventures and associates (6.4) 1.6 (4.8)
Net cash flows from investing activities* 2.7 51.9 54.6
Cash flows from financing activities
Cash inflow on sales and leaseback transactions – 8.3 8.3
Lease assets issued and repaid 19.9 (19.9) –
Bank loans repaid (140.0) (113.5) (253.5)
Loans raised and facilities drawn down 1,202.4 102.3 1,304.7
Net cash flows from financing activities* 750.5 (22.8) 727.7
* The table above includes only those financial statement line items which have been restated. The total cash generated from operations, investing activities and financing activities do not therefore represent the sum of the line items presented above.
As part of the cash flow restatement the Group now presents Lease assets repaid in Investing activities (previously in Financing activities) and presents. Proceeds above market value on sale and leaseback of property, plant and equipment is presented in Financing activities (previously in Investing activities). Furthermore, Lease assets repaid and Purchases of property, plant and equipment have been restated as in the prior year the Group presented certain lessor activities on a net basis. These are now presented on a gross basis.
5. Segmental information The Group has four reportable segments, determined by reference to the goods and services they provide and the markets they serve.
Marine – design, build and through-life support of naval ships, equipment and marine infrastructure in the UK and internationally.
Nuclear – through-life support of submarines and complex engineering services in support of major decommissioning programmes and projects, training and operation support, new build programme management and design and installation in the UK and, increasingly, internationally.
Land – large-scale critical vehicle fleet management, equipment support and training for military and civil customers.
Aviation – critical engineering services to defence and civil customers worldwide, including pilot training, equipment support, airbase management and operation of aviation fleets delivering emergency and offshore services.
The Board, the chief operating decision maker as defined by IFRS 8, monitors the results of these reportable segments and makes decisions about the allocation of resources. The Group’s business in South Africa meets the definition of an operating segment, as defined by IFRS 8. However the business represents less than 10% of the Group’s revenues, profits and assets and, as permitted by IFRS 8, the Group includes the South African operating segment in the Land reportable segment on the basis that they have similar economic characteristics and that the nature of the services provided, the type of customer and the methods used to deliver services are similar.
56 Babcock International Group PLC full year results for the full ended 31 March 2021
The table below presents the underlying results for each reportable segment in accordance with the change in definition of underlying revenue and underlying operating profit, as set out in note 2, and reconciles the underlying profit/(loss) to the statutory profit/(loss) before tax.
Share of results of joint ventures and associates 3.1 (15.0) 5.1 (6.3) – (13.1)
Investment income – – 0.9 – – 0.9
Net finance costs – – – – (62.1) (62.1)
Profit/(loss) before tax 46.9 43.2 (600.5) (1,143.4) (63.5) (1,717.3)
The contract profitability and balance sheet review impacted the profit/(loss) before tax in Aviation by £1,190.3 million, Land by £770.2 million, Marine by £46.9 million, Nuclear by £35.5 million and unallocated by £84.6 million. Unallocated charges predominantly relate to deferred tax movements.
Note 3 sets out details of the contract profitability and balance sheet review.
The table below presents the underlying results for each reportable segment in accordance with the change in definition of underlying revenue and underlying operating profit, as set out in note 2, and reconciles the underlying profit/(loss) to the statutory profit/(loss) before tax.
Share of results of joint ventures and associates 1.7 7.6 24.7 24.6 – 58.6
Investment income 0.2 – 0.9 – – 1.1
Net finance costs – – – – (73.0) (73.0)
Profit/(loss) before tax 203.6 101.0 (48.9) (271.6) (73.0) (88.9)
* The results for 31 March 2020 have been restated due to correction of errors and a change in accounting policy. Further details are set out in note 4.
Revenues of £2.1 billion (2020: £2.1 billion) are derived from a single external customer. These revenues are attributable across all reportable segments.
The analysis of revenue for the years ended 31 March 2021 and 31 March 2020 is as follows:
2021 £m
2020
(restated*) £m
Sales of goods – transferred at a point in time 484.3 585.9
Sale of goods – transferred over time 175.7 105.5
Sale of goods 660.0 691.4
Provision of services – transferred over time 3,518.2 3,731.0
Rental income 4.5 6.1
Revenue 4,182.7 4,428.5
* The results for 31 March 2020 have been restated due to correction of errors and a change in accounting policy. Further details are set out in note 4.
The sale of goods at a point in time is mainly in the Land sector. This includes revenue subject to judgement as to whether the Group operates as principal or agent. The sale of goods over time is mainly in the Marine and Aviation sectors. Provision of services over time is across all sectors.
Babcock International Group PLC full year results for the year ended 31 March 2021 57
6. Net finance costs
2021
£m
2020
(restated*)
£m
Finance costs
Loans, overdrafts and associated interest rate hedges 50.0 48.6
Lease interest 23.5 28.2
Amortisation of issue costs of bank loan 1.4 2.1
Retirement benefit interest – 0.1
Other 2.9 7.0
Total finance costs 77.8 86.0
Finance income
Bank deposits, loans and leases 11.7 13.0
IFRIC 12 Investment income 0.9 1.1
Retirement benefit interest 4.0 –
Total finance income 16.6 14.1
Net finance costs 61.2 71.9
* The results for 31 March 2020 have been restated due to correction of errors and a change in accounting policy. Further details are set out in note 4.
7. Income tax expense
2021
£m
2020
(restated*)
£m
Analysis of tax (benefit)/charge in the year
Current tax
UK current year (benefit)/charge (8.9) 19.2
UK prior year (benefit) (6.4) –
Overseas current year charge 12.8 17.9
(2.5) 37.1
Deferred tax
UK current year benefit (41.3) 6.0
UK prior year charge 8.5 –
Overseas current year charge/(benefit) 20.2 (15.0)
Impact of changes in tax rates (0.2) (1.2)
(12.8) (10.2)
Total income tax (benefit)/expense (15.3) 26.9
* The results for 31 March 2020 have been restated due to correction of errors and a change in accounting policy. Further details are set out in note 4.
The tax for the year is higher (2020: higher) than the standard rate of corporation tax in the UK. The differences are explained below:
2021
£m
2020
(restated)
£m
Loss before tax (1,717.3) (88.9)
Loss on ordinary activities multiplied by rate of corporation tax in the UK of 19% (2020: 19%) (326.3) (16.9)
Effects of:
Expenses not deductible for tax purposes 3.2 0.9
Non-deductible write-off of goodwill 236.2 52.9
Re-measurement of deferred tax in respect of statutory rate changes (0.2) (1.2)
Difference in respect of share of results of joint ventures and associates’ results 2.5 (14.1)
Prior year adjustments 2.1 –
Differences in respect of foreign rates and UK consortium relief rates 2.2 (5.3)
Unrecognised deferred tax movements 83.4 15.6
Non-taxable profits on disposals and non-deductible losses on disposals 9.4 (14.2)
Adjustments as a result of concluded enquiries with tax authorities (21.6) –
Other (6.2) 9.2
Total income tax (benefit)/expense (15.3) 26.9
Further information on exceptional items and tax on exceptional items is detailed in note 2.
During the period, the Group has progressed discussions with the UK tax authorities (“HMRC”) regarding the deductibility of certain acquisition costs. Having reached agreement, a tax credit of £21.6m has been recognised in the current year (period ended 31 March 2020: £nil).
58 Babcock International Group PLC full year results for the full ended 31 March 2021
In the prior year, the decrease in the UK rate of corporation tax from 19% to 17% was cancelled, resulting in a tax credit of £1.2m. On 24 May 2021, the Finance Act 2021 was substantively enacted, increasing the main rate of UK corporation tax from 19% to 25% with effect from 1 April 2023. As the increase of the rate to 25% had not been substantively enacted at the Balance Sheet date, its effects are not included in these Financial Statements. However, it is likely that the overall effect of the change, had it been substantively enacted by the Balance Sheet date, would have been to increase deferred tax assets by approximately £20 million.
The European Commission decided in 2019 that certain aspects of the UK Finance Company Partial Exemption (“FCPE”) rules constituted partial State Aid. However, HMRC have confirmed that the Group did not benefit from those provisions and therefore faces no liability in respect of this judgement.
Disposals of subsidiaries, businesses and joint ventures are generally exempt from tax (whether the disposal is at a gain or at a loss) under local tax legislation (for example the UK’s Substantial Shareholding Exemption).
8. Dividends
2021
£m
2020
£m
Final dividend for the year ended 31 March 2020 of nil (2019: 22.9p) per 60p share – 115.7
Interim dividend for the year ended 31 March 2021 of nil (2020: 7.2p) per 60p share – 36.4
– 152.1
9. Loss per share Basic loss per share is calculated by dividing the loss attributable to ordinary shareholders by the weighted average number of ordinary shares outstanding during the year excluding those held in the Babcock Employee Share Trust. Where there is a loss arising the effect of potentially dilutive ordinary shares is anti-dilutive.
The calculation of the basic and diluted EPS is based on the following data:
Number of shares
2021
Number
2020
Number
Weighted average number of ordinary shares for the purpose of basic EPS 504,993,024 505,284,584
Effect of dilutive potential ordinary shares: share options 3,998,687 872,749
Weighted average number of ordinary shares for the purpose of diluted EPS 508,991,711 506,157,333
Earnings 2021 2020 (restated)
(Loss)/earnings
from continuing
operations
£m
Basic
per share
Pence
Diluted
per share
Pence
(Loss)/earnings
from
continuing
operations
£m
Basic
per share
Pence
Diluted
per share
Pence
Loss for the year (1,702.0) (337.0) (337.0) (117.8) (23.3) (23.3)
Add back:
Specific Adjusting Items, net of tax (note 2) 1,581.7 313.2 313.2 412.7 81.7 81.6
Earnings before Specific Adjusting Items (120.3) (23.8) (23.8) 294.9 58.4 58.3
10. Goodwill
2021
£m
2020
(restated)
£m
Cost
At 1 April 2,571.1 2,589.0
On disposal of subsidiaries (note 24) (72.6) (20.6)
Exchange adjustments (11.2) 2.7
At 31 March 2,487.3 2,571.1
Accumulated impairment
At 1 April 283.2 4.8
On disposal of subsidiaries (note 24) – –
Impairment 1,243.2 278.4
Exchange adjustments 4.6 –
At 31 March 1,531.0 283.2
Net book value at 31 March 956.3 2,287.9
Babcock International Group PLC full year results for the year ended 31 March 2021 59
Goodwill is allocated to the operating segments as set out in the table below:
2021
£m
2020
(restated)
£m
Marine 339.2 341.7
Nuclear 233.1 233.1
Land 262.7 762.5
Aviation 119.3 948.6
Africa 2.0 2.0
956.3 2,287.9
During the year, goodwill was tested for impairment in accordance with IAS 36. This impairment analysis is performed on an annual basis as outlined in the Group’s accounting policies. The Group monitors goodwill at operating segment level, other than in relation to the establishment of a separate CGU during the year for the Group’s Aviation oil and gas business, to which goodwill was allocated, reflecting the conditional sale and purchase agreement signed pre 31 March 2021 in relation to that business. The Group considered the potential disposal in the context of the held for sale criteria set out in IFRS 5 and assessed that the business should not be classified as held for sale.
The goodwill allocated to the Africa operating segment is immaterial and the Directors do not consider there to be any reasonably possible changes in estimates that would result in impairment of this goodwill. No further disclosures are provided in relation to the Africa operating segment.
Prior year errors The Group combines the Africa and Land operating segments into a single Land reportable segment and, in the prior year, the goodwill impairment test was carried out at the reportable segment level rather than at the operating segment level as required by IAS 36. This error was compounded by an administrative error in the calculation of the value-in-use of the Land operating segment and the impact of both errors was an overstatement of Land value-in-use by £886 million.
In addition, the correction of a number of prior period errors relating to the year ended 31 March 2020, in relation to other financial statement areas, reduced the capital employed used to complete the March 2020 goodwill impairment test. A reduction in capital employed of £239.2 million, in relation to the Aviation operating segment, resulted in the restatement of the Aviation operating segment impairment charge from £395.0 million to £155.8 million for the year ended 31 March 2020. A reduction in capital employed of £5.1 million, as a result of the correction of prior year errors discussed in Note 5 and the impact of the overstatement of value-in-use by £886 million noted above, resulted in a Land operating segment impairment charge of £122.6 million for the year ended 31 March 2020.
No impairment was required at 1 April 2019 as re-performance of impairment analysis at that date identified sufficient headroom between the recoverable amount and the capital employed.
Results of goodwill impairment test The current year impairment test results in an impairment of the Land operating segment goodwill of £425.8 million, the Aviation operating segment goodwill of £808.5 million and the goodwill of £8.9 million allocated to the Aviation oil and gas business CGU. These impairments reflect significant changes in estimates informed by consideration during H2 of actual business performance of the Group during the current year and related assessments of future performance of the businesses. Future business performance was informed by the strategy and contract profitability and balance sheet reviews instigated by the Group’s new executive management and completion of the Group’s budget addressing the years ending 31 March 2022, 31 March 2023 and 31 March 2024.
Value in use calculations The recoverable amount of the Group’s goodwill was assessed by reference to value-in-use calculations. The value-in-use calculations are derived from risk-adjusted cash flows from the Group’s three-year budget and nominal growth rates between 2.0% and 3.0% were used to establish cash flows for two further years. Terminal value assessments are included based on year five and an estimated long-term nominal growth rate of 2.0% (2020: 2.0%). The process by which the Group’s budget is prepared, reviewed and approved benefits from historical experience, visibility of long–term work programmes in relation to work undertaken for the UK Government, available government spending information (both UK and overseas), the Group’s contract backlog, bid pipeline and the Group’s tracking pipeline which monitors opportunities prior to release of tenders. The budget process includes consideration of risks and opportunities at contract and business level and considered matters such as COVID-19 and climate change. The value in use calculations do not include the anticipated benefits of the Group’s revised operating model or the implementation costs of this project reflecting that the Group was not committed to the project at 31 March 2021.
Key assumptions The Group updated the impairment test in the current year to incorporate changes to the model and discount rates following transition to IFRS 16. Pre-tax discount rates, derived from the Group’s post tax weighted average cost of capital in the range 7.4% to 8.4% (2020: 7.8% to 8.2%) and adjusted for the gearing impact of lease liabilities were used to discount the estimated risk-adjusted cash flows. In consideration of specific risk factors associated with the Aviation operating segment, the pre-tax discount rate includes a premium of 0.9% (2020: 0.9%), to determine the value-in-use of this CGU. The gearing impact of lease liabilities impacts the Aviation segment most significantly and aligns the Aviation operating segment discount rate, inclusive of the risk premium, with the discount rates of the other operating segments.
60 Babcock International Group PLC full year results for the full ended 31 March 2021
The long-term growth rates and discount rates for the Group’s operating segments are as follows:
2021 2020
Aviation Land Marine Nuclear Aviation Land Marine Nuclear
Expected future cash flows used in discounted cash flow models are inherently uncertain and could materially change over time. They are significantly affected by a number of factors, such as demand for the Group’s services, together with economic factors such as estimates of costs of revenue and future capital expenditure requirements. Where discounted cash flow models based on management’s assumptions are used, the resulting fair value measurements are considered to be at level 3 in the fair value hierarchy, as defined in IFRS 13, ‘Fair Value Measurement’, as they depend to a significant extent on unobservable valuation inputs.
Key assumptions in relation to future cash flows included in the value in use models are set out below:
Operating segment Key future cash flow assumption
Marine Continuing delivery of work programmes with the UK Ministry of Defence, including the design and build of Type 31 frigates. Retention, through successful rebid, of the Group’s long term submarine support role in Canada.
Nuclear Continuing delivery of naval nuclear services to the UK Ministry of Defence under long term contracts. Continuing delivery of opportunities in the UK civil nuclear decommissioning programme together with maintenance of ongoing spend in provision of nuclear engineering services to operational power stations.
Land Continuing demand for equipment support and training from both military and civil customers, noting that significant elements of equipment support and training are the subject of long-term contracts, not all of which have been assumed to renew. Maintenance of existing positions in Emergency Services, including successful rebid of one significant contract.
Aviation Continuing delivery of long–term contracts with the UK Ministry of Defence and maintenance of existing positions in aerial emergency services and firefighting worldwide where the Group has a number of leadership positions. Delivery of cost savings through an embedded performance improvement programme.
Sensitivity
The goodwill allocated to Marine and Nuclear results in both operating segments having significant headroom. It would require a long-term growth of nil combined with discount rates of 86.7% and 22.8%, respectively, to reduce the headroom in Marine and Nuclear to £nil. The Directors do not consider these to be plausible assumptions and, in addition, do not consider that any reasonably possible changes to the cash flow assumptions would reduce the recoverable amount to its carrying value.
The impairments of £817.4 million and £425.8 million in relation to the Aviation and Land operating segments respectively eliminate the headroom for these operating segments at 31 March 2021. Accordingly, reasonably possible changes in estimates could give rise to a material impairment in the following year. The Group carried out sensitivity analyses on the reasonably possible changes in the discount rate and long-term growth rate used in the value-in-use models for each of the operating segments. The increase in impairment that would result from a change in the discount rate and long-term growth rate are set out in the table below:
2021
£m Aviation Land
Pre-tax discount rate
Increase of 100bps 46.8 26.8
Long-term growth rate
Decrease of 50bps 16.8 9.8
The Directors consider that a key cash flow assumption in the calculation of the value in use of the Aviation operating segment is delivery of forecast cost savings. A reduction of £5 million in annual operating profits, as a result of failure to deliver forecast cost savings from the year ending 31 March 2023, is considered plausible and would result in a reduction of £51 million in Aviation operating segment value in use. Key assumptions in relation to the Land operating segment include the retention of existing business, not all of which have been assumed to renew. A reduction in annual operating profit of £5 million is considered to be plausible from the year ending 31 March 2025 and would result in a reduction in Land operating segment value in use of £43 million.
Babcock International Group PLC full year results for the year ended 31 March 2021 61
11. Other intangible assets
Acquired
intangibles –
relationships
£m
Acquired
intangibles –
brands
£m
Acquired
intangibles –
total
£m
Internally
generated
software
development
costs and
licences
£m
Internally
generated
development
costs and
other
£m
Total
£m
Cost
At 1 April 2020 1,042.9 – 1,042.9 187.1 26.8 1,256.8
On disposal of subsidiaries and joint ventures (note 24) (5.2) – (5.2) (0.1) – (5.3)
Additions – – – 11.0 7.0 18.0
Reclassification from property, plant and equipment – – – – 1.3 1.3
At 1 April 2019 restated 779.3 20.2 799.5 72.1 1.3 872.9
On disposal of subsidiaries (note 24) (5.8) (4.1) (9.9) (1.2) – (11.1)
Amortisation charge 66.5 1.1 67.6 13.5 0.8 81.9
Disposals – (17.4) (17.4) (4.4) – (21.8)
Exchange adjustments 0.3 0.2 0.5 (0.2) (0.1) 0.2
At 31 March 2020 840.3 – 840.3 79.8 2.0 922.1
Net book value at 31 March 2020 202.6 – 202.6 107.3 24.8 334.7
Acquired intangible amortisation charges for the year are recorded through cost of revenue. Details of the prior year restatement are provided in note 4.
The Group holds intangible software assets in respect of its SAP enterprise resource planning system. Management reassessed the implementation plan during the year ended 31 March 2021 and determined not to progress a number of previously planned implementations of the software. The Group determined that the recoverable amounts, based upon value in use of the software intangible asset relating to these business units is £nil and an impairment charge of £10.0 million was recognised in relation to these business units.
The Land operating segment recognises a software asset relating to user interfaces for vehicle bookings that was developed for use on the Phoenix contract. Following changes in estimates of the Phoenix contract and the wider usage of the software; the recoverable amount has been determined to be £0.4 million based upon a value in use calculation resulting in an impairment charge of £4.9 million.
The Land operating segment also previously recognised an acquired intangible in relation to the purchase of the DSG relationship in 2015 and capitalised a software asset relating the implementation of the Group’s Global ERP system in DSG. Following reassessment of variable revenues under the contract following publication of the Integrated Spending Review, and removal of targeted future cost savings under the contract in line with an assessment under IAS 36, both of these assets were fully impaired with impairments of £56.4 million and £9.1 million respectively.
62 Babcock International Group PLC full year results for the full ended 31 March 2021
In the Aviation operating segment, costs were capitalised in relation to a partially funded contract to develop drone technology, which is nearing completion. An assessment based on the latest business plan resulted in an impairment of £7.2 million. An indefinite life technology-based intangible asset of £1.5 million has also been fully impaired following an assessment of latest business plans.
12. Property, plant and equipment
Freehold
property
£m
Leasehold
property
£m
Plant and
equipment
£m
Aircraft
fleet
£m
Assets in
course of
construction
£m
Total
£m
Cost
At 1 April 2020 as restated 125.2 32.0 605.7 533.8 88.5 1,385.2
On disposal of subsidiaries (note 24) – – (1.7) – – (1.7)
Transfer of leased assets to right of use assets – – (17.1) (7.6) – (24.7)
At 1 April 2019 restated 62.2 9.8 357.7 84.7 – 514.4
On disposal of subsidiaries (note 24) – – (2.2) – – (2.2)
Charge for the year 5.0 1.8 50.9 19.0 – 76.7
Impairment – – 0.2 14.4 – 14.6
Disposals (0.7) (2.1) (13.1) (37.8) – (53.7)
Exchange adjustments 0.1 – (2.8) (2.8) – (5.5)
At 31 March 2020 66.6 9.5 390.7 77.5 – 544.3
Net book value at 31 March 2020 58.6 22.5 215.0 456.3 88.5 840.9
A capitalisation rate of 4% (2020: 3%) was used to determine the amount of borrowing costs eligible for capitalisation.
Following changes in senior management, a comprehensive performance improvement and restructuring programme was implemented during the year ended 31 March 2021 across the Aviation operating segment. This included a rationalisation of aircraft types and review of fleet strategy, taking account of changes in market conditions including those resulting from COVID-19 and Brexit. A number of impairment indicators were
Babcock International Group PLC full year results for the year ended 31 March 2021 63
identified as a result, and impairment tests performed in accordance with IAS 36 have resulted in an impairment charge of £70.2 million across the UK and continental Europe, based on fair value less costs to dispose of £70.5 million. The fair value assessment was based on recent offers received, current market prices for assets and information received from brokers, representing Level 2 information in the fair value hierarchy.
In addition the Group recorded a £15.1 million impairment in Australia, reflecting its intention to dispose of 11 owned aircraft following completion of the associated customer contracts. The fair value less costs to dispose is assessed at £14.3 million in line with the approach set out above. There has also been an impairment of £11.7 million of the Group’s fleet of six AS332 L2 Super Puma helicopters, which follows a previous impairment related to the grounding of the aircraft following a number of accidents. Following investigations, the aircraft are no longer grounded but have been repurposed from passenger transportation to firefighting. The recoverable amount of £5.7 million was assessed on a value-in-use basis, reflecting rates achievable when repositioned for firefighting.
In the Land operating segment, £5.3 million of PPE was impaired following an assessment of this PPE as directly attributable to the Group’s DSG contract, the impairment indicator being reassessed DSG contract profitability. The impairment test reassessed variable revenues under the contract following publication of the Integrated Spending Review and removed targeted future cost savings in line with an assessment under IAS 36.
13. Leases
Group as a lessee Lease liabilities represent rentals payable by the Group for certain operational, distribution and office properties and other assets such as aircraft. The leases have varying terms, purchase options, escalation clauses and renewal rights.
Right of use assets
Leasehold
property
£m
Plant and
equipment
£m
Aircraft
fleet
£m
Total
£m
Cost
At 1 April 2020 as restated 148.2 70.6 549.4 768.2
Additions 18.2 8.0 65.5 91.7
Disposals (15.3) (6.5) (33.5) (55.3)
Exchange adjustments 1.8 – 7.6 9.4
At 31 March 2021 152.9 72.1 589.0 814.0
Accumulated depreciation
At 1 April 2020 as restated 26.4 30.1 102.7 159.2
Charge for the year 27.7 12.6 93.1 133.4
Impairment 7.3 4.4 34.7 46.4
Disposals (10.7) (4.8) (30.4) (45.9)
Exchange adjustments 0.4 (0.1) (0.6) (0.3)
At 31 March 2021 51.1 42.2 199.5 292.8
Net book value at 31 March 2021 101.8 29.9 389.5 521.2
64 Babcock International Group PLC full year results for the full ended 31 March 2021
Leasehold
property
£m
Plant and
equipment
£m
Aircraft
fleet
£m
Total
£m
Cost
On transition to IFRS 16 – 1 April 2019 as previously stated 111.3 15.4 466.0 592.7
Prior year adjustment – – (35.3) (35.3)
Reclassification from property, plant and equipment – 44.0 46.8 90.8
On transition to IFRS 16 restated 111.3 59.4 477.5 648.2
On disposal of subsidiaries (note 24) (2.3) – – (2.3)
Additions 42.4 11.2 81.8 135.4
Exchange adjustments (3.2) – (9.9) (13.1)
At 31 March 2020 148.2 70.6 549.4 768.2
Accumulated depreciation
Reclassification from property, plant and equipment – 17.1 7.6 24.7
Charge for the year 27.3 13.1 82.9 123.3
Impairment – – 14.2 14.2
Exchange adjustments (0.9) (0.1) (2.0) (3.0)
At 31 March 2020 26.4 30.1 102.7 159.2
Net book value at 31 March 2020 121.8 40.5 446.7 609.0
Net book value on transition to IFRS 16 – 1 April 2019 as previously stated 111.3 42.5 511.7 665.5
Net book value on transition to IFRS 16 – 1 April 2019 as restated 111.3 42.3 469.9 623.5
Prior to the adoption of IFRS 16, the Group determined the Jadestone contract, delivered by the Aviation operating segment, to be onerous in accordance with IAS 37, ‘Provisions, Contingent Liabilities and Contingent Assets’ (‘IAS 37’). On adoption of IFRS 16, an impairment test was performed on the right of use assets associated with the contract, which resulted in an impairment. Further impairment indicators were identified in the year ended 31 March 2021 through customer interactions and feedback on tender submissions, resulting in an additional impairment of £12.5 million in the value of the S-92 fleet.
During the year, a Helicopter Emergency Medical Services (HEMS) bid programme in France provided the Aviation operating segment with new information on the customer’s requirements. The change in expected use of the associated leased aircraft resulted in an impairment of £6.5 million. Cancellation of customer contracts resulted in the full impairment of right of use assets of £2.1 million in the UK and £2.0 million in Italy. In addition, a £11.9 million impairment followed re-assessment of the profitability of the Sasemar contract and a £1.9 million impairment followed re-assessment of the profitability of a UK HEMS contract.
In the Land operating segment, £9.1 million of ROU assets were impaired following an assessment of these assets as directly attributable to the DSG contract, the impairment indicator being reassessed DSG contract profitability. The impairment test reassessed variable revenues under the contract following publication of the Integrated Spending Review and removed targeted future cost savings in line with an assessment under IAS 36.
Babcock International Group PLC full year results for the year ended 31 March 2021 65
Lease liabilities The following tables show the discounted Group lease liabilities and a reconciliation of opening to closing lease liabilities:
Total
£m
Cost
At 1 April 2020 689.4
Additions 91.7
Disposals (9.4)
Exchange adjustments (18.8)
Lease interest 23.5
Lease repayments (164.1)
At 31 March 2021 612.3
Non-current lease liabilities 486.2
Current lease liabilities 126.1
At 31 March 2021 612.3
At 1 April 2019 65.8
On transition to IFRS 16 – 1 April 2019 640.8
Additions 144.7
Disposal of subsidiary undertaking (3.1)
Exchange adjustments 16.2
Lease interest 28.2
Lease repayments (203.2)
At 31 March 2020 689.4
Non-current lease liabilities 548.5
Current lease liabilities 140.9
At 31 March 2020 689.4
Group as a lessor The Group is the lessor in an arrangement for the lease of vehicles and sub-lease of leased properties. These are solely finance lease arrangements.
Finance lease payments receivable
2021
£m
2020
£m
Within one year 26.7 31.7
Greater than one year but less than two years 7.9 6.9
Greater than two years but less than three years 4.7 –
Greater than three years but less than four years 0.4 –
Greater than four years but less than five years – –
Greater than five years – –
Total undiscounted finance lease payments receivable 39.7 38.6
Impact of discounting (0.2) –
Finance lease receivable (net investment in the lease) 39.5 38.6
66 Babcock International Group PLC full year results for the full ended 31 March 2021
14. Investment in and loans to joint ventures and associates
Investment in joint ventures and associates
Loans to joint ventures and associates Total
2021
£m
2020
(restated)
£m
2021
£m
2020
£m
2021
£m
2020
(restated)
£m
At 1 April 161.9 153.2 48.6 42.5 210.5 195.7
Prior year adjustment – 8.9 – – – 8.9
At 1 April restated 161.9 162.1 48.6 42.5 210.5 204.6
Disposal of joint ventures and associates (note 24) (53.2) – – – (53.2) –
Loans repaid by joint ventures and associates – – (4.2) (0.7) (4.2) (0.7)
Increase in loans to joint ventures and associates – – 3.9 5.5 3.9 –
Impairment of JV loans – – (7.0) – (7.0) –
Investment in joint ventures and associates 8.8 0.3 – – 8.8 5.8
Share of profits/(losses) (13.1) 58.6 – – (13.1) 58.6
Interest accrued and capitalised – – 3.1 3.8 3.1 3.8
Interest received – – (2.3) (2.5) (2.3) (2.5)
Dividends received (36.8) (52.0) – – (36.8) (52.0)
Fair value adjustment of derivatives 7.0 (9.4) – – 7.0 (9.4)
Tax on fair value adjustment of derivatives (1.4) 2.3 – – (1.4) 2.3
Foreign exchange 0.3 – – – 0.3 –
At 31 March 73.5 161.9 42.1 48.6 115.6 210.5
The share of results of joint ventures and associates (loss) reported of £13.1 million is due to a £37.1 million reduction to share of results of joint ventures and associates identified through the contract profitability and balance sheet review in the year ended 31 March 2021.
Income from joint ventures and associates – AirTanker Ltd, AirTanker Services Ltd and Ascent Flight Training (Holdings) Ltd The Group holds a 15.4% (2020: 13.3%) share in AirTanker Limited (‘ATL’) and a 23.5% (2020: 22.3%) share in AirTanker Services Limited (‘ATSL’). The Group accounts for its interest in the joint ventures and associates based on financial information, and has previously made certain adjustments to this information to recognise revenue over time and reflect the Group’s view of certain cost assumptions, including the residual value of assets. The Group revised these estimates and assumptions during the year, resulting in a reduction in the share of results of joint ventures and associates and investment in joint ventures and associates (ATL: £5.0 million, ATSL: £15.1 million).
Ascent Flight Training (Holdings) Limited (‘Ascent’) is a 50.0% owned joint venture. During the year management revised certain previous assumptions over the contract outturn, resulting in a reduction in share of results of joint ventures and associates and investment in joint ventures and associates of £2.9 million.
Income from joint ventures and associates – Cavendish Dounreay Partnership Limited Cavendish Dounreay Partnership Limited (‘CDP’), is a 50.0% owned joint venture, within the Nuclear operating segment, which owned the site licence company Dounreay Site Restoration Limited (‘DSRL’). CDP operated under a parent body agreement (PBO) to the Nuclear Decommissioning Authority (‘NDA’). Following notification from the NDA of the proposed termination of the PBO, the controlling ‘A’ shareholding in DSRL was transferred to the NDA on 31 March 2021. CDP maintains a ‘B’ share, which entitles it to profit earned, but yet to be agreed and distributed, up until 31 March 2021.
The recoverability of the investment in CDP was reassessed following the change in ownership of DSRL. The amount of profit due to CDP is judgemental as it is reliant on DSRL reaching an agreed settlement with the NDA. A reduction in the share of results of joint ventures and associates and investment in joint ventures and associates of £10.9m was booked to reflect the Group’s latest assessment of the outcome of the settlement with the NDA.
Income from joint ventures and associates – ABC Electrification Ltd Babcock is a one-third shareholder, in the Land operating segment, in the ABC Electrification Ltd (‘ABC’) joint venture which performed services under contracts with Network Rail (‘NWR’). These contracts were completed several years ago and there is no further work being performed. Following developments during the year, the Group reassessed the range of possible outcomes on contracts subject to final agreement, and as a result reflected a reduction in the share of results of joint ventures and associates and investment in joint ventures and associates of £3.9 million to record the latest view of the contract outcomes. In addition, loans receivable from the JV of £7.0 million were impaired.
Babcock International Group PLC full year results for the year ended 31 March 2021 67
15. Deferred tax
2021
£m
2020 (restated)
£m
Deferred tax asset 141.3 60.5
Deferred tax liability (7.7) (33.7)
133.6 26.8
The movements in deferred tax assets and liabilities during the year are shown below. Deferred tax assets and deferred tax liabilities have been offset if, and only if, there is a legally enforceable right in that jurisdiction to set off corporation tax assets and corporation tax liabilities and the deferred tax assets and deferred tax liabilities relate to income taxes levied by the same Taxation Authorities:
Tangible assets
£m
Retirement
benefit
obligations
£m
Tax losses
£m
Other
£m
Total
£m
At 1 April 2020 1.9 (27.7) 71.6 (19.0) 26.8
Income statement credit/(debit) (13.5) (12.7) 31.5 7.3 12.6
Tax credit/(debit) to equity – 96.3 – (2.2) 94.1
Disposal of subsidiary – – – (0.1) (0.1)
Effect of changes in tax rates
Income statement – – 0.2 – 0.2
Exchange differences – – – – –
At 31 March 2021 (11.6) 55.9 103.3 (14.0) 133.6
At 1 April 2019 as previously stated 2.4 4.7 72.2 (26.6) 52.7
Prior year adjustment (Note 4) – – (8.8) (14.7) (23.5)
At 1 April 2019 restated 2.4 4.7 63.4 (41.3) 29.2
Income statement credit/(debit) (restated) – (12.8) 8.1 13.7 9.0
Tax credit/(debit) to equity – (20.2) – 7.6 (12.6)
Disposal of subsidiary – – – 0.6 0.6
Effect of changes in tax rates
Income statement (0.5) – 0.1 1.6 1.2
Equity – 0.6 – 0.3 0.9
Exchange differences – – – (1.5) (1.5)
At 31 March 2020 1.9 (27.7) 71.6 (19.0) 26.8
The deferred tax assets and liabilities at 31 March 2020 have been restated due to errors identified in prior periods. Further detail is included in note 5.
The net deferred tax assets of £133.6 million (2020: £26.8 million) include deferred tax assets of £32.9 million (2020: £60.5 million) and deferred tax liabilities of £7.7 million (2020: £18.0 million) in respect of the Group’s non-UK operations.
Deferred tax assets have been recognised in respect of tax losses and other temporary differences giving rise to deferred tax assets because the Directors believe that it is probable that these assets will be recovered. The recognition of deferred tax assets in respect of losses can be subjective. The Group’s approach to the recognition of deferred tax assets in respect of losses, including how the Group assesses future profitability for recognition purposes, is set out in detail in note 1 to the Accounts. Due to the CPBS review, substantially all territories for which deferred tax assets in respect of losses are recognised made an accounting loss in the current year. However, these costs are not expected to be recurring and their recovery is expected. The losses can be carried forward indefinitely and have no expiry date.
The deferred tax asset in respect of tax losses includes £nil (31 March 2020: £31.7m) in respect of financial expenses carried forward.
The net deferred tax liability in respect of “Other” includes a liability in respect of acquired intangible assets of £25.5m (31 March 2020: £46.7m), with the movement between periods having been posted to the income statement.
No deferred tax has been recognised in respect of temporary differences associated with investments in subsidiaries, branches, associates and interest in joint ventures and joint operations where the Group is in a position to control the timing of the reversal of the temporary differences and it is probable that such differences will not reverse in the foreseeable future. The aggregate amount of temporary differences associated with such investments in subsidiaries, branches, associates and interests in joint ventures and joint operations is represented by the contribution of those investments to the Group's retained earnings and amounted to £47.0 million (2020: £40.0 million).
At the statement of financial position date, deferred tax assets of £103.3 million (2020: £71.6 million) have been recognised in respect of unused tax losses available for carry forward. No deferred tax asset has been recognised in respect of further unutilised tax losses carried forward (excluding capital losses) of £754.1 million (2020: £383.7 million). These amounts include trading losses of £559.3 million (2020: £325.6 million) and financial expenses carried forward of £194.8 million (2020: £58.1 million). In addition to these amounts, UK capital losses of £92.0 million (2020: £92.0 million) are being carried forward, with no deferred tax asset having been recognised. Where a deferred tax asset has not been recognised in respect of these losses and financial expenses, this is because management considers that those jurisdictions are not likely to generate sufficient taxable income of the appropriate type in the foreseeable future (see note 1). The amounts shown can be carried forward indefinitely.
68 Babcock International Group PLC full year results for the full ended 31 March 2021
16. Trade and other receivables
2021
£m
2020
(restated)
£m
Current assets
Trade receivables 281.1 281.0
Less: provision for impairment of receivables (14.0) (8.1)
Trade receivables – net 267.1 272.9
Amounts due from customers for contract work 201.7 223.0
Accrued income 76.9 107.8
Capitalised contract costs 32.3 31.8
Contract assets 310.9 362.6
Retentions 8.0 8.1
Amounts due from related parties (note 27) 4.4 2.9
Other debtors 83.8 108.5
Prepayments 66.8 82.4
741.0 837.4
Trade and other receivables are stated at amortised cost.
The Group reassessed the forecast profit margins of a number of contracts included within the scope of the contract profitability and balance sheet review. The assessments were made based on the findings from detailed contract reviews, facilitated by an external accountancy firm. The reviews considered matters such as forecast costs to complete, including the achievability of forecast cost savings, and the recognition of contract modifications including the potential requirement to constrain variable revenue. This resulted in a reduction in margin and a reduction in amounts due from customers for contract work totalling £97.5 million. Of this amount, £27.8 million relates to the DSG contract, which resulted from the reassessment of variable revenues following publication of the Integrated Spending Review and reassessment of cost savings achievable under the contract reflecting delays in implementation of efficiency programmes as a result of COVID-19. The DSG reassessment also resulted in the impairment of £6.4 million of capitalised contract costs.
The Group recognises that there is an inherent element of estimation uncertainty and judgement involved in assessing contract profitability, as disclosed in note 1, and considers that it has taken a best estimate view of contract outcomes based on the information currently available.
This reassessment of contract margin has also resulted in the increase in contract liabilities and recognition of certain onerous contract provisions; see notes 17 and 20, respectively, for further detail.
The Group reviewed the recoverability of its trade and other receivables, resulting in a charge to the income statement of £51.7 million. A number of recoverability estimates have been reassessed and expected credit losses recorded following consideration of the latest facts and circumstances, resolution of certain disputed matters and an assessment of the merits of pursuing certain others, particularly in relation to less significant matters.
Babcock International Group PLC full year results for the year ended 31 March 2021 69
Significant changes in contract assets during the year are as follows:
Amounts
due from
customers for
contract work
£m
Accrued income
£m
Capitalised
contract costs
£m
Contract assets
£m
31 March 2020 223.0 107.8 31.8 362.6
Disposal of subsidiary undertaking (0.6) (3.4) – (4.0)
Transfers from contract assets recognised at the beginning of the year to receivables (204.5) (96.5) – (301.0)
Increase due to work done not transferred from contract assets 191.7 70.3 – 262.0
Amounts capitalised – – 25.6 25.6
Amortisation of contract assets – – (11.2) (11.2)
Write down of contract assets (6.9) – (15.5) (22.4)
Exchange adjustment (1.0) (1.3) 1.6 (0.7)
31 March 2021 201.7 76.9 32.3 310.9
31 March 2019 as previously stated 266.0 133.2 62.9 462.1
Prior year adjustment (note 4) (9.3) (0.9) (37.0) (47.2)
31 March 2019 restated 256.7 132.3 25.9 414.9
Transfers from contract assets recognised at the beginning of the year to receivables (240.1) (117.6) – (357.7)
Increase due to work done not transferred from contract assets 222.2 105.7 – 327.9
Amounts capitalised – – 39.4 39.4
Amortisation of contract assets – – (9.9) (9.9)
Write down of contract assets (14.2) (10.7) (15.4) (40.3)
Other – (2.2) (5.3) (7.5)
Exchange adjustment (1.6) 0.3 (2.9) (4.2)
31 March 2020 223.0 107.8 31.8 362.6
No material revenue was recognised in 2021 from performance obligations satisfied in previous years, arising from changes in stage of completion, or transaction price allocation (2020: No material revenue).
Within the Group’s contract backlog, £8.7 billion (2020: £9.6 billion) represents the transaction price allocated to unsatisfied or partially satisfied performance obligations. Management expects that 26.0% (2020: 26.0%) of the transaction price allocated to unsatisfied performance obligations as at 31 March 2021 will be recognised as revenue during the next reporting period. A further 47% (2020: 41%) of the transaction price allocated to unsatisfied performance obligations is expected to be recognised as revenue in years two to five after 31 March 2021. In addition there are £6.0 billion (2020: £5.4 billion) of orders where pricing is still to be finalised and £2.0 billion (2020: £2.7 billion) of orders within joint ventures and associates.
17. Trade and other payables
2021
£m
2020
(restated)
£m
Current liabilities
Amounts due to customers for contract work 333.1 210.4
Deferred income 63.4 32.8
Contract liabilities 396.5 243.2
Trade creditors 410.6 435.5
Amounts due to related parties (note 27) 0.4 0.7
Other creditors 37.4 37.8
Other taxes and social security 144.5 102.8
Accruals 517.3 481.2
1,506.7 1,301.2
Non-current liabilities
Other creditors 1.9 2.1
Included in creditors is £19.1 million (2020: £22.1 million) relating to capital expenditure which has therefore not been included in working capital movements within the cash flow statement.
As part of the contract profitability and balance sheet review, management has reassessed the liabilities of the Group, including the measurement of accruals. This assessment has been made based on the findings from the detailed, risk based review of the Group’s contracts and sector balance sheets and has resulted in an increase in liabilities and a charge to the income statement of £52.7 million.
Of this amount, £32.0 million relates to the DSG contract, which resulted from the reassessment of variable revenues following publication of the Integrated Spending Review and reassessment of cost savings achievable under the contract reflecting delays in implementation of efficiency programmes as a result of COVID-19.
70 Babcock International Group PLC full year results for the full ended 31 March 2021
Significant changes in contract liabilities during the year are as follows:
Amounts due to
customers for
contract work
£m
Deferred income
£m
Contract
liabilities
£m
31 March 2020 210.4 32.8 243.2
Revenue recognised that was included in the contract liability balance at the beginning of the year (135.0) (28.5) (163.5)
Increase due to cash received, excluding amounts recognised as revenue 259.0 59.1 318.1
Disposal of subsidiary undertaking (0.5) – (0.5)
Exchange adjustment (0.8) – (0.8)
31 March 2021 333.1 63.4 396.5
31 March 2019 195.3 40.0 235.3
Revenue recognised that was included in the contract liability balance at the beginning of the year (141.9) (38.5) (180.4)
Increase due to cash received, excluding amounts recognised as revenue 159.4 33.9 193.3
Disposal – (1.2) (1.2)
Exchange adjustment (2.4) (1.4) (3.8)
31 March 2020 210.4 32.8 243.2
18. Bank and other borrowings
2021
£m
2020
(restated)
£m
Current liabilities
Bank loans and overdrafts due within one year or on demand
Secured 0.2 0.3
Unsecured 383.5 987.6
383.7 987.9
Lease obligations* 126.1 140.9
509.8 1,128.8
Non-current liabilities
Bank and other borrowings
Secured 18.5 17.5
Unsecured 1,300.3 2,032.5
1,318.8 2,050.0
Lease obligations* 486.2 548.5
1,805.0 2,598.5
* Leases are secured against the assets to which they relate.
The Group has £3.9 million of secured debt in the Land operating segment that is secured against a property owned by the Group and £14.6 million of debt that is secured against contracts with customers, which will cede to the bank in the event of default.
The Group has entered into interest rate and currency swaps, details of which are included in note 19.
Babcock International Group PLC full year results for the year ended 31 March 2021 71
Repayment details The total borrowings of the Group at 31 March are repayable as follows:
2021
2020
Loans and
overdrafts
£m
Lease
obligations
£m
Loans and
overdrafts
£m
Lease
obligations
£m
Within one year 383.7 126.1 987.9 140.9
Between one and two years 476.4 120.1 0.4 117.3
Between two and three years 15.0 91.4 487.4 105.4
Between three and four years 0.3 96.6 13.1 106.8
Between four and five years 0.3 61.9 759.5 78.3
Greater than five years 826.8 116.2 789.6 140.7
1,702.5 612.3 3,037.9 689.4
Borrowing facilities The Group had the following undrawn committed borrowing facilities available at 31 March:
2021
£m
2020
£m
Expiring in less than one year 3.0 3.5
Expiring in more than one year but not more than five years 783.5 77.6
786.5 81.1
Bank loans include £25.1 million (2020: £93.2 million) that suppliers have chosen to early-fund under supplier financing arrangements, under which the suppliers can elect to receive a discounted early payment from the partner bank rather than being paid in line with the agreed payment terms. The total supplier financing facility available to the Group is £230 million at 31 March 2021. The typical factoring fee is 0.9% – 1.5% and the Group has payment terms with the partner banks of 120-360 days. If the option is taken the Group’s liability is assigned by the supplier to be due to the partner bank rather than the supplier. The value of the liability payable by the Group remains unchanged. The Group assesses the terms and conditions of the arrangement to determine whether the arrangement should be classified as trade payables or debt. Refer to accounting policies for further information.
Various inter-bank offer rates (IBOR) are expected to be replaced by alternative risk-free rates by the end of 2021 as part of the IBOR reform. The Group is managing the transition to alternative risk-free rates with respect to its hedging arrangements and any future transactions in the financial market.
19. Derivative financial instruments
The fair values of derivative financial instruments are as follows:
2021 2020
£m £m
Non-current assets
Other currency hedges – hedged 4.3 11.7
Other currency hedges – non-hedged – 2.9
Current assets
US private placement – derivative – 95.5
US private placement – interest rate swaps – 9.2
Other currency hedges - hedged 7.8 17.5
Other currency hedges – non-hedged 0.4 –
Non-current liabilities
8 year Eurobond September 2027 – derivative 25.2 6.1
8 year Eurobond September 2027 – interest rate swaps 14.1 17.0
Interest rate hedge 0.6 0.8
Other currency hedges - hedged 5.7 11.7
Other currency hedges – non-hedged 5.5 –
Current liabilities
Interest rate hedge 0.1 0.1
Other currency hedge 13.8 27.6
The Group enters into forward foreign currency contracts and cross currency interest rate swaps to hedge the currency exposures that arise on sales, purchases, deposits, borrowings and leasing arrangements denominated in foreign currencies as the transactions occur. There is no material ineffectiveness on any of the Group’s hedging activities. Where derivatives do not meet the hedge accounting criteria, they are accounted for at fair value through profit or loss.
72 Babcock International Group PLC full year results for the full ended 31 March 2021
Held for trading contracts are economic hedges and are not hedge accounted.
The fair values of derivative financial instruments are based on valuation techniques (level 2) using underlying market data and discounted cash flows.
20. Provisions for other liabilities
Insurance
provisions
(a)
£m
Contract/
warranty
(b)
£m
Employee
benefits and
business
reorganisation
costs
(c)
£m
Italian anti-trust
fine (d)
£m
Property
and other
(e)
£m
Expected credit
losses
£m
Total
provisions
£m
At 31 March 2020 as previously stated 0.6 17.3 60.9 47.3 17.1 0.4 143.6
Prior year adjustment – 17.2 – – 2.0 – 19.2
At 31 March 2020 restated 0.6 34.5 60.9 47.3 19.1 0.4 162.8
On disposal of subsidiaries (note 23) – – – – (2.5) – (2.5)
Transfer – – 0.7 – (0.7) – –
Net charge/(release) to income statement 0.1 43.4 15.2 (24.2) 9.0 – 43.5
Utilised in year – (10.1) (41.9) (1.5) (3.5) – (57.0)
Unwinding of discount – – – – – – –
Foreign exchange – (0.7) 0.9 (1.7) 0.1 – (1.3)
At 31 March 2021 0.7 67.1 35.8 20.0 21.5 0.4 145.5
(a) The insurance provisions arise in the Group’s captive insurance company, Chepstow Insurance Limited. They relate to specific claims assessed in accordance with the advice of independent actuaries.
(b) The contract/warranty provisions relate to onerous contracts and warranty obligations on completed contracts and disposals.
(c) The employee benefits and reorganisation costs arise mainly in relation to restructuring (see note 2), acquired businesses, personnel related costs and payroll taxes.
(d) For further details of the provision in relation to the possible Italian anti-trust fine see note 2.
(e) Property and other provisions primarily relate to dilapidation costs and contractual obligations in respect of infrastructure.
As part of the contract profitability and balance sheet review, onerous contract provisions were recognised, as well as a reduction in amounts due
from customers for contract work, see note 16. There is inherent estimation uncertainty and judgement in assessing profitability outcomes in the
future, with a potentially broad range of outcomes. Onerous contract provisions recognised include:
- £21.2 million in relation to three Helicopter Emergency Medical Services (HEMS) contracts secured during the year with minimum terms of up to
10 years. The pricing of these contracts had regard to future strategic considerations, with profitability dependent on future volumes. A further
£8.2 million provisions were made in HEMS contracts following reassessment of future costs.
- £4.1 million in relation to a military maintenance contract following a reassessment of assumptions relating to forecast flying hours and indexation.
Provisions have been analysed between current and non-current as follows:
2021
£m
2020
(restated)
£m
Current 71.8 130.1
Non-current 73.7 32.7
145.5 162.8
Included within provisions is £8 million (2020: £5 million) expected to be utilised over approximately 10 years. Other than these provisions the Group’s non-current provisions are expected to be utilised within two to five years.
Babcock International Group PLC full year results for the year ended 31 March 2021 73
21. Retirement benefits and liabilities The amounts recognised in the Group income statement are as follows:
2021
2020
Principal
schemes
£m
Railways
scheme
£m
Other
schemes
£m
Total
£m
Principal
schemes
£m
Railways
scheme
£m
Other
schemes
£m
Total
£m
Current service cost 24.1 2.0 2.0 28.1 29.5 2.5 1.7 33.7
Incurred expenses 6.4 0.7 0.2 7.3 3.4 0.2 0.1 3.7
Past service costs 1.4 – – 1.4 – – – –
Curtailment 7.5 – – 7.5 – – – –
Total included within operating profit 39.4 2.7 2.2 44.3 32.9 2.7 1.8 37.4
At 31 March 4,344.0 369.6 364.4 5,078.0 3,790.8 297.5 177.8 4,266.1
Net (deficit)/surplus at 31 March (180.5) (104.0) (8.6) (293.1) 198.4 (56.1) 2.9 145.2
* Settlement effect in Other schemes is a result of a transfer of assets and liabilities from the Babcock Naval Services Pension Scheme back into the Principal Civil Service Pension Scheme. As the Group is reimbursed by MOD for any contributions payable to this scheme, the settlement has an equal impact on both the value of the benefit obligations and the plan assets, hence it is neutral in terms of both the income statement and other comprehensive income,
The movement in net deficits for the year ending 31 March 2021 is as a result of the movement in assets and liabilities shown above.
As at 31 March 2021 the key assumptions used in valuing pension liabilities were:
Discount rate 2.0% (31 March 2020: 2.4%)
Inflation rate (RPI) 3.2% (31 March 2019: 2.6%)
74 Babcock International Group PLC full year results for the full ended 31 March 2021
22. Movement in net debt
2021
£m
2020
restated
£m
(Decrease)/increase in cash in the year (820.9) 1,083.6
Cash flow from the decrease/(increase) in debt 1,202.1 (912.3)
Change in net funds resulting from cash flows 381.2 171.3
Net debt at the beginning of the year (1,704.8) (1,071.1)
Net debt at the end of the year (1,353.6) (1,704.8)
23. Changes in net debt
31 March
2020 (restated)
£m
Cash flow
£m
Additional
leases
£m
Other non-cash
movement
£m
Exchange
movement
£m
31 March
2021
£m
Cash and bank balances 1,845.9 (944.4) – – 3.3 904.8
Bank overdrafts (497.2) 123.5 – – (0.2) (373.9)
Cash, cash equivalents and bank overdrafts 1,348.7 (820.9) – – 3.1 530.9
Debt (2,540.7) 1,129.3 – – 82.8 (1,328.6)
Leases – received (689.4) 140.6 (91.7) 9.4 18.8 (612.3)
Net debt derivative 89.4 (52.6) – – (62.0) (25.2)
Changes in liabilities from financing arrangements (3,140.7) 1,217.3 (91.7) 9.4 39.6 (1,966.1)
Leases – granted 38.6 (14.9) 13.9 – 1.9 39.5
Net debt before loans to joint ventures and associates (1,753.4) 381.5 (77.8) 9.4 44.6 (1,395.7)
Loans to joint ventures and associates 48.6 (0.3) – (6.2) – 42.1
Net debt (1,704.8) 381.2 (77.8) 3.2 44.6 (1,353.6)
Babcock International Group PLC full year results for the year ended 31 March 2021 75
24. Disposal of subsidiaries, businesses and joint ventures and associates In June 2020 the Group completed the sale of its 74% shareholding in Holdfast Training Services Limited for a cash consideration of £85.0 million which resulted in a loss on disposal of £38.2 million. This loss arose following goodwill allocation of £68.4 million to Holdfast Training Services Limited upon disposal (using the relative value method), as Holdfast Training Services Limited was integrated into the Land operating segment.
In September 2020, the Group disposed of Cavendish Nuclear Manufacturing Limited for no consideration which resulted in a loss on disposal of £0.6 million.
In October 2020, the Group completed the sale of Conbras Servicos Tecnicos de Suporte Ltda for a consideration of £9.7 million which resulted in a loss on disposal of £10.9 million.
During the previous year the Group disposed of Context Information Security Limited for £107.1 million, which resulted in a profit on disposal of £74.7 million. During the previous year the Group paid certain accrued costs on previously disposed of businesses of £0.8 million.
2021 2020
Holdfast
Training
Services
Limited
£m
Cavendish
Nuclear
Manufacturing
Limited
£m
Conbras
Servicos
Tecnicos de
Suporte Ltda
£m
Total
£m
Context
Information
Security
Limited
£m
Previously
disposed of
business
£m
Total
£m
Goodwill 68.4 – 4.2 72.6 20.6 – 20.6
Investment in joint ventures and associates 53.2 – – 53.2 – – –
(Loss)/profit on disposal (38.2) (0.6) (10.9) (49.7) 74.7 – 74.7
Sale proceeds 85.0 – 9.7 94.7 107.1 – 107.1
Sale proceeds less cash disposed of 85.0 (0.4) 6.6 91.2 105.3 – 105.3
Less costs paid in the year – – (0.6) (0.6) (2.9) (0.8) (3.7)
Net cash inflow/(outflow) 85.0 (0.4) 6.0 90.6 102.4 (0.8) 101.6
25. Contingent liabilities There are a number of contingent liabilities that arise in the normal course of business. The Group recognises provisions for liabilities when it is more likely than not that a settlement will be required and the value of such a payment can be reliably estimated.
(a) Pursuant to the Rosyth Dockyard privatisation agreement, the MOD will share in the net proceeds of sale or development of the dockyard following planning enhancement, on terms set out in the asset purchase agreement between Royal Rosyth Dockyard Limited and the MOD dated 30 January 1997. By way of security for the MOD’s rights to such share, the Royal Rosyth Dockyard Limited has granted a fixed charge (standard security) over the dockyard in favour of the Authority.
(b) The Group has given certain indemnities and warranties in the course of disposing of businesses and companies and in completing contracts. The Group believes that any liability in respect of these is unlikely to have a material effect on the Group’s financial position.
(c) As a large contracting organisation, the Group has a significant number of contracts with customers to deliver services and products, as well as with its supply chain, where the Group cannot deliver all those services and products itself. The Group is involved in disputes and litigation, which have arisen in the course of its normal trading in connection with these contracts. Whilst the Directors do not believe that the outcome of these matters will result in any material adverse change in the Group’s financial position, it is possible that, if any of these disputes come to court, the court may take a different view to the Group.
(d) As part of its role in the Submarine Enterprise Performance Programme, the Group has provided a £9 million financial guarantee for a supplier to ensure continuity of supply.
76 Babcock International Group PLC full year results for the full ended 31 March 2021
26. Capital and other financial commitments
2021
£m
2020
£m
Contracts placed for future capital expenditure not provided for in the financial statements 57.9 14.7
27. Related party transactions Related party transactions for the year to 31 March 2021 are: revenue from joint ventures and associates of £68.0 million (2020: £132.6 million) and purchases from joint ventures and associates of £0.4 million (2020: nil). The year-end receivables balance was £4.4 million (2020: £2.9 million) and the payable balance was £0.4 million (2020: £0.7 million).
28. Subsequent events In April 2021, the Group announced a new operating model. The related restructuring will result in an exceptional charge of around £40 million being recognised in the 2022 financial year.
In the year ended 31 March 2020, the Lazio Regional Administrative Court confirmed a €51 million fine issued by the Italian Competition Authority to our subsidiary, Babcock Mission Critical Services Italia SpA (BMCS Italia), for certain anti-trust violations. In July 2021, the Council annulled the fine, though allowing the Authority leave to recalculate it. As a result, we have reduced the provision to £20 million, being management’s best estimate. Further information is detailed in note 2.
29. Financial information The financial information in this full year results statement does not constitute statutory accounts within the meaning of Section 434 of the Companies Act 2006.
Statutory accounts for the year ending 31 March 2020 have been delivered to the Registrar of Companies and those for 2021 will be delivered following the Company’s Annual General Meeting.
The Annual Report for the year ending 31 March 2021 and this full year results statement were approved by the Board on 30 July 2021. The auditors have reported on the Annual Report for the years ended on 31 March 2021 and 2020 and neither report was qualified and neither contained a statement under Section 498(2) or (3) of the Companies Act 2006.
Babcock International Group PLC full year results for the year ended 31 March 2021 77
Annual General Meeting 2021 This year's Annual General Meeting will be held on 22 September 2021. Details of the resolutions to be proposed at that meeting will be included in the Notice of Annual General Meeting that will be published during mid-August 2021.
At our Annual General Meeting in 2007 our shareholders unanimously agreed to proposals to allow us to use electronic communications with them as allowed for under the Companies Act 2006. For shareholders who agreed, or who are treated as having agreed, to receive electronic communications, the Company website is now the main way for them to access shareholder information. These shareholders will be sent a ‘notice of availability’ notifying them when the Annual Report and Accounts is available on the Company website www.babcockinternational.com. Hard copies of the Annual Report and Accounts will be distributed to those shareholders who have requested or subsequently request them. Additional copies will be available from the Company’s registered office 33 Wigmore Street, London, W1U 1QX.
Forward-looking statements Certain statements in this announcement are forward-looking statements. Such statements may relate to Babcock’s business, strategy and plans. Statements that are not historical facts, including statements about Babcock’s or its management’s beliefs and expectations, are forward-looking statements. Words such as ‘believe’, ‘anticipate’, ‘estimates’, ‘expects’, ‘intends’, ‘aims’, ‘potential’, ‘will’, ‘would’, ‘could’, ‘considered’, ‘likely’, and variations of these words and similar future or conditional expressions are intended to identify forward-looking statements but are not the exclusive means of doing so. By their nature, forward-looking statements involve a number of risks, uncertainties or assumptions, some known and some unknown, many of which are beyond Babcock’s control that could cause actual results or events to differ materially from those expressed or implied by the forward-looking statements. These risks, uncertainties or assumptions could adversely affect the outcome and financial effects of the plans and events described herein. Forward-looking statements contained in this announcement regarding past trends or activities should not be taken as a representation that such trends or activities will continue in the future. Nor are they indicative of future performance and Babcock’s actual results of operations and financial condition and the development of the industry and markets in which Babcock operates may differ materially from those made in or suggested by the forward-looking statements. You should not place undue reliance on forward-looking statements because such statements relate to events and depend on circumstances that may or may not occur in the future. Except as required by law, Babcock is under no obligation to update (and will not) or keep current the forward-looking statements contained herein or to correct any inaccuracies which may become apparent in such forward-looking statements.
Forward-looking statements reflect Babcock’s judgement at the time of preparation of this announcement and are not intended to give any assurance as to future results.
The Group financial statements were approved by the Board of Directors on 30 July 2021 and are signed on its behalf by:


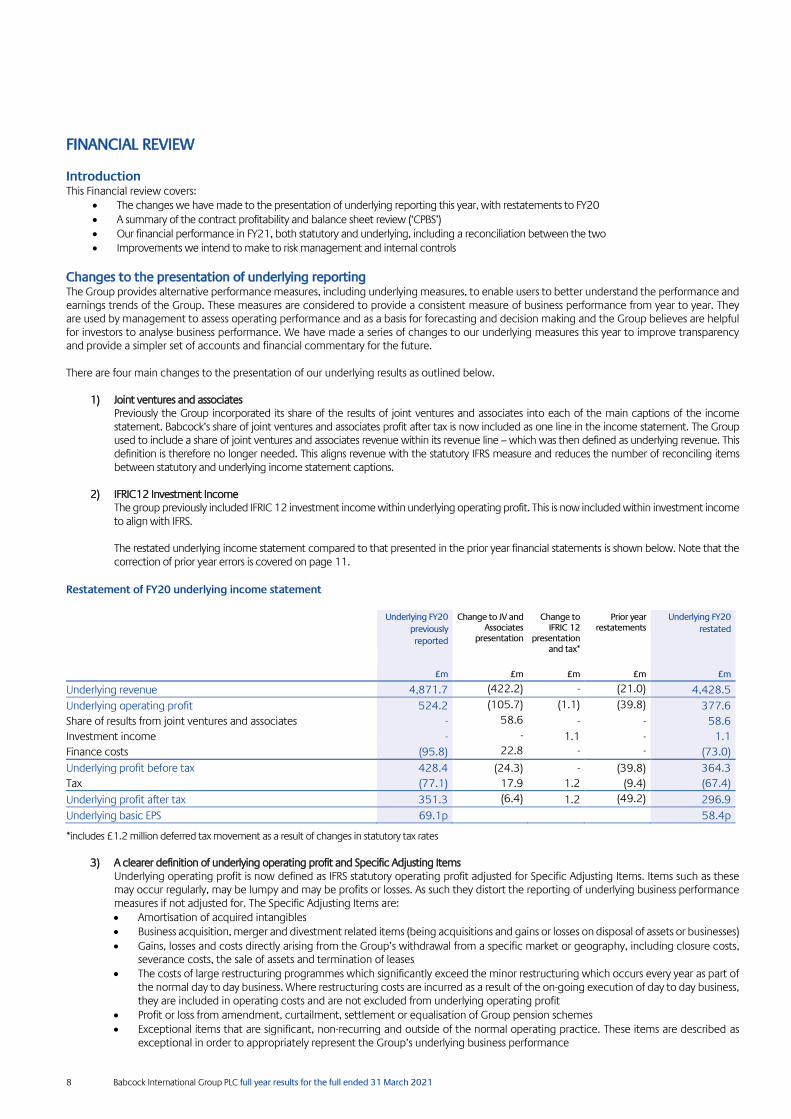


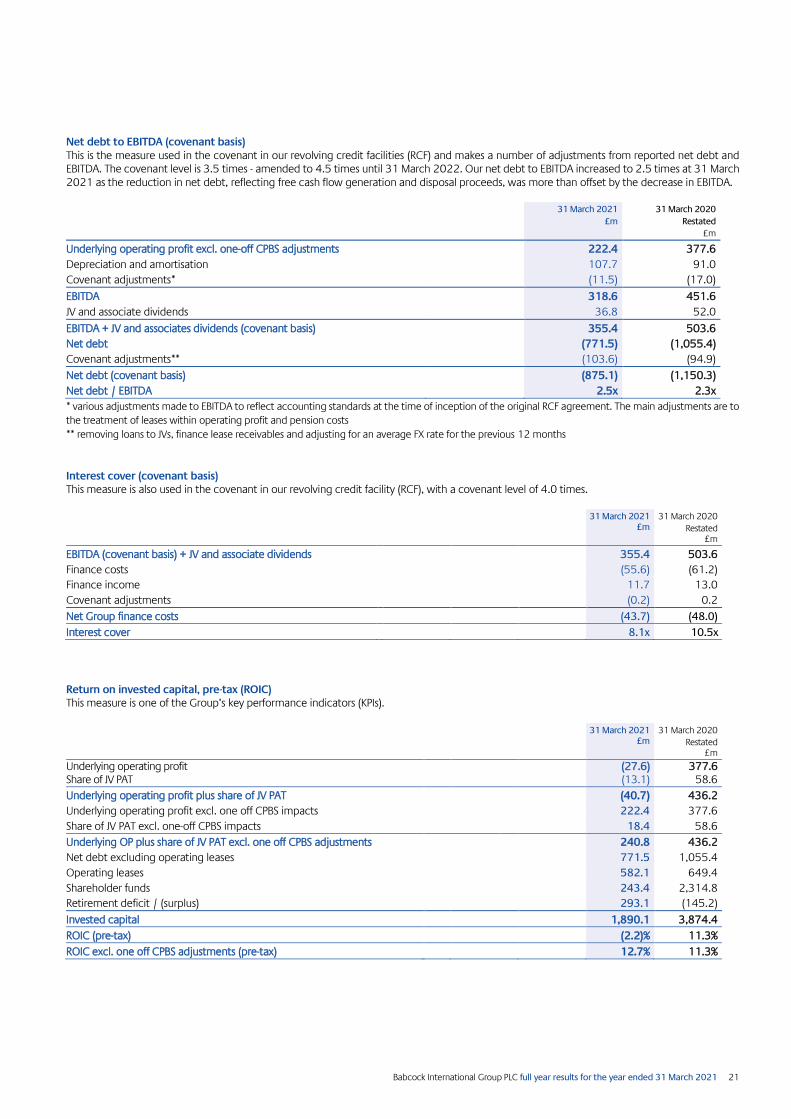

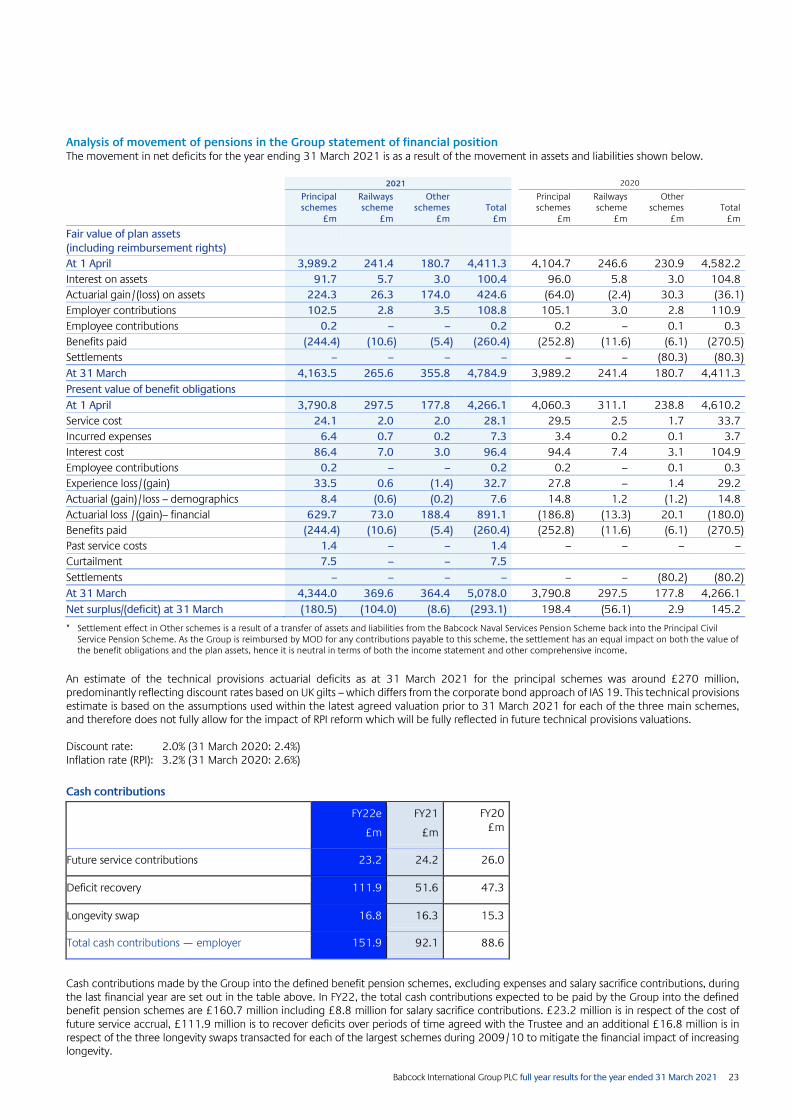


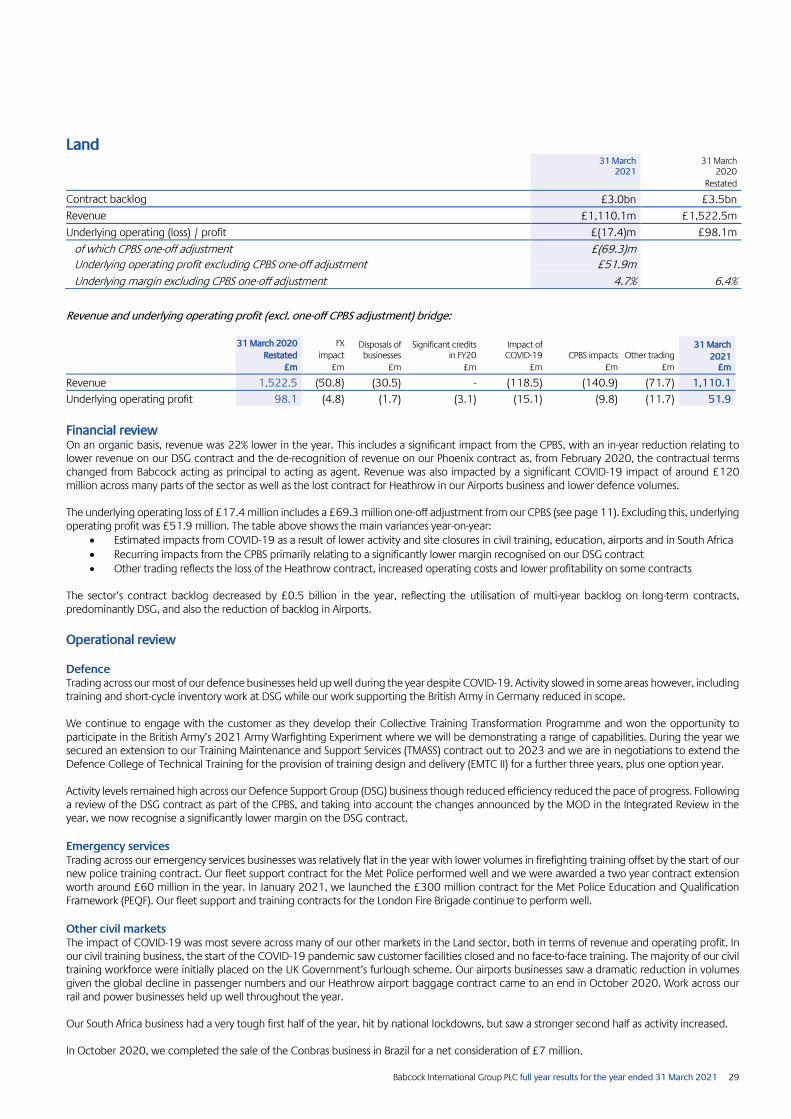


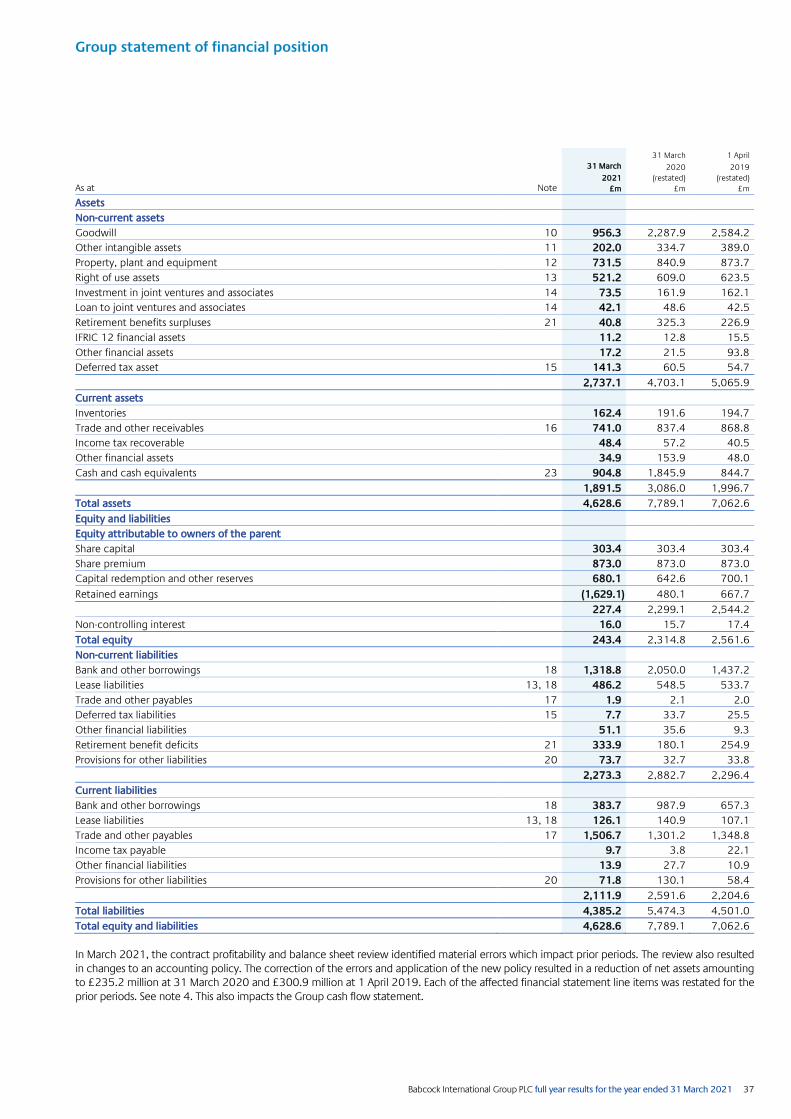
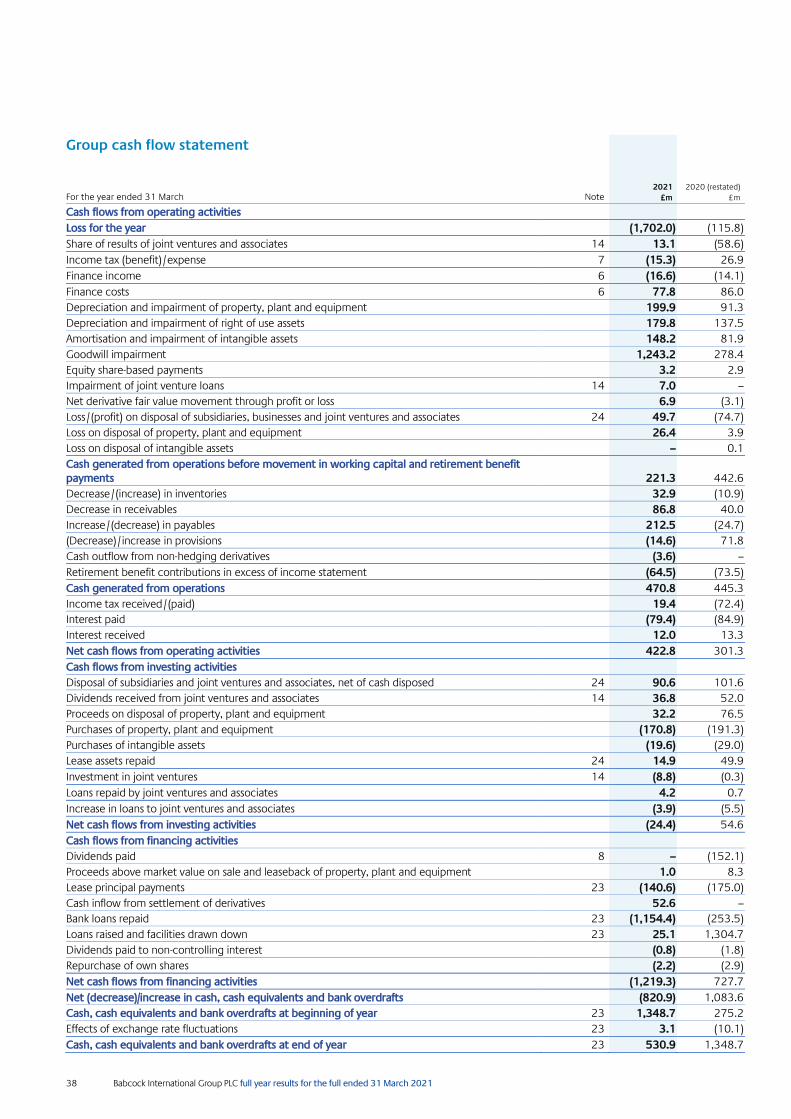


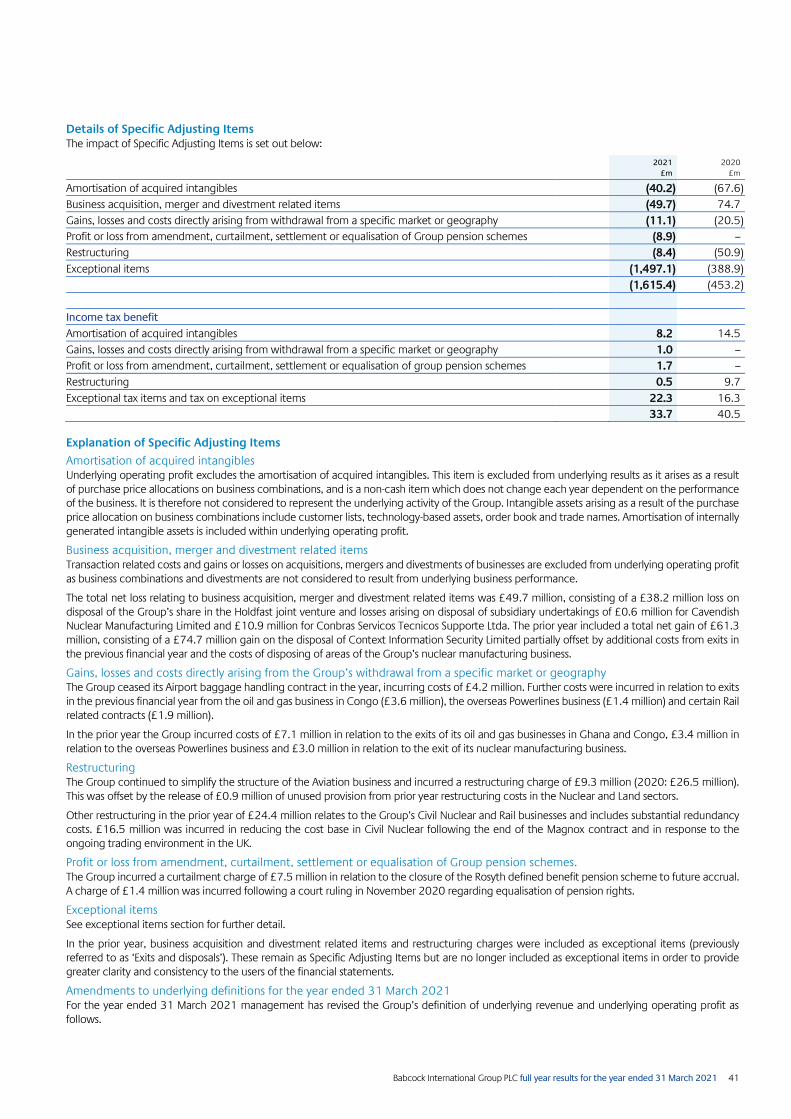
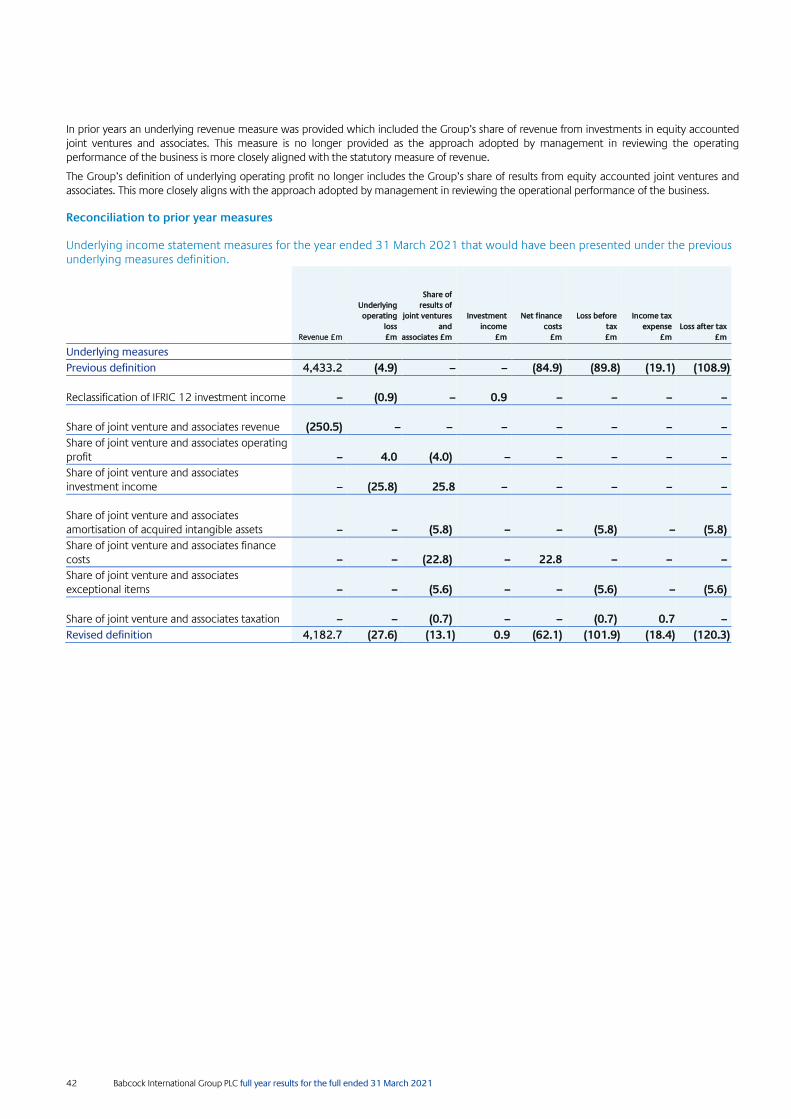


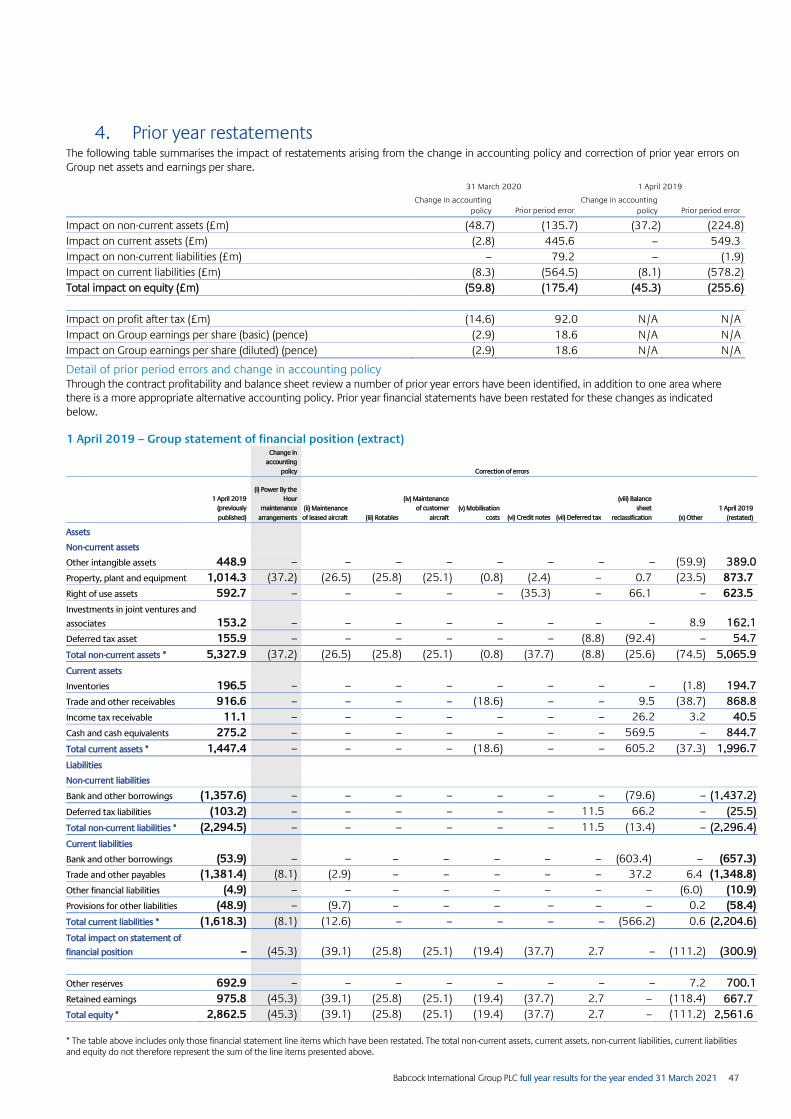


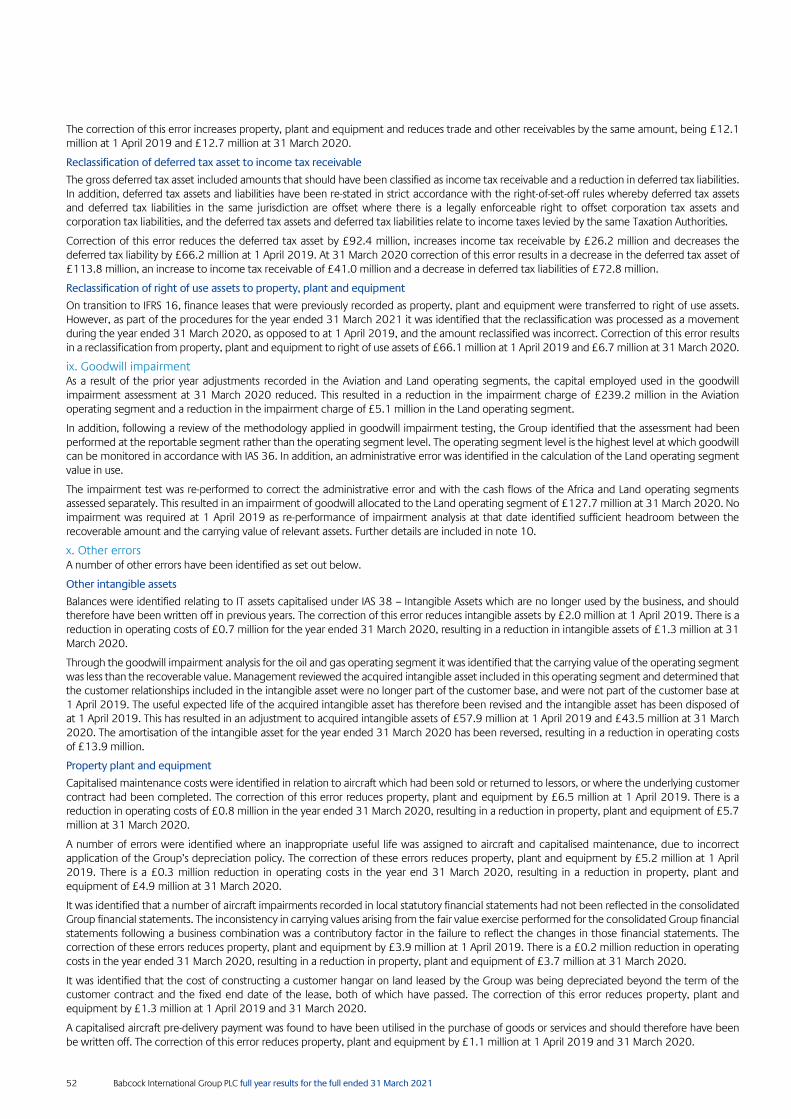


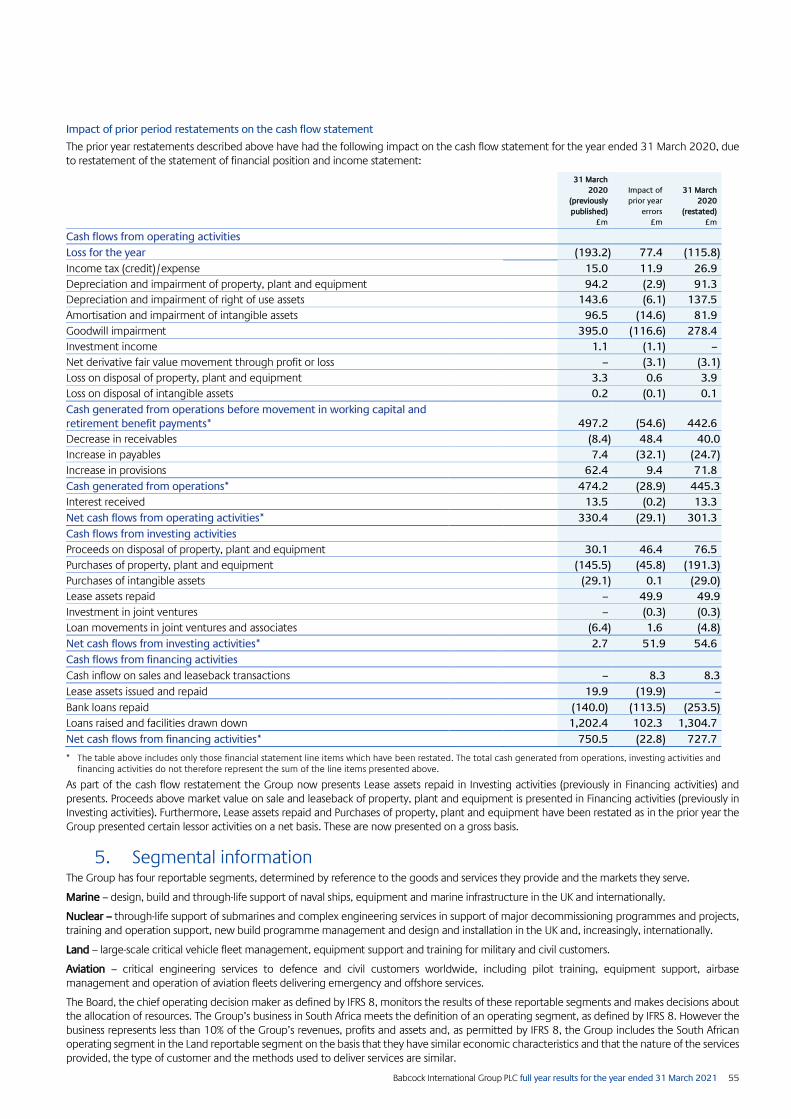

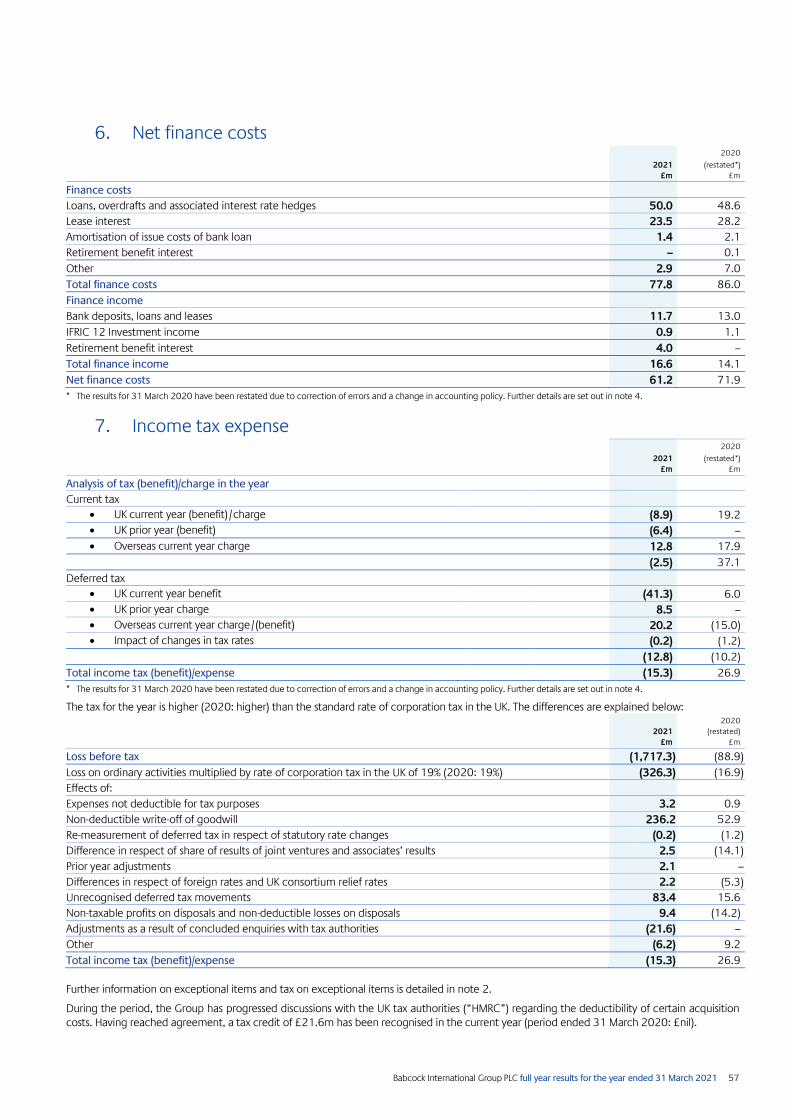
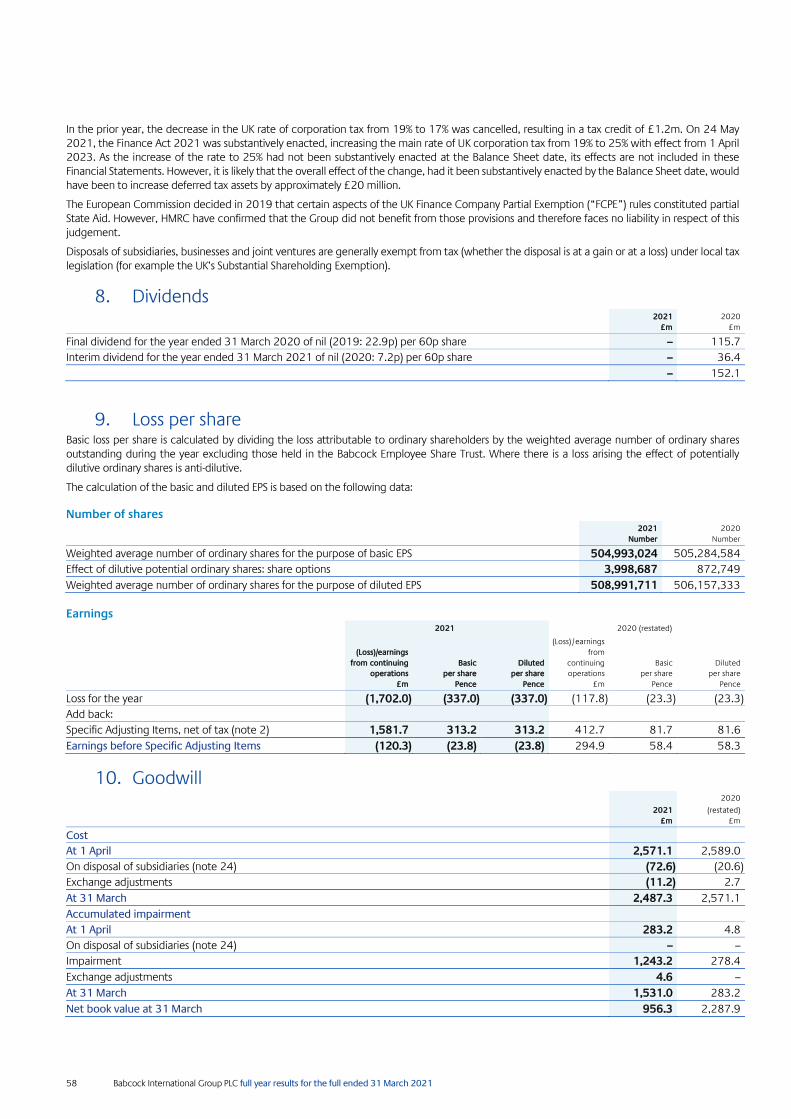
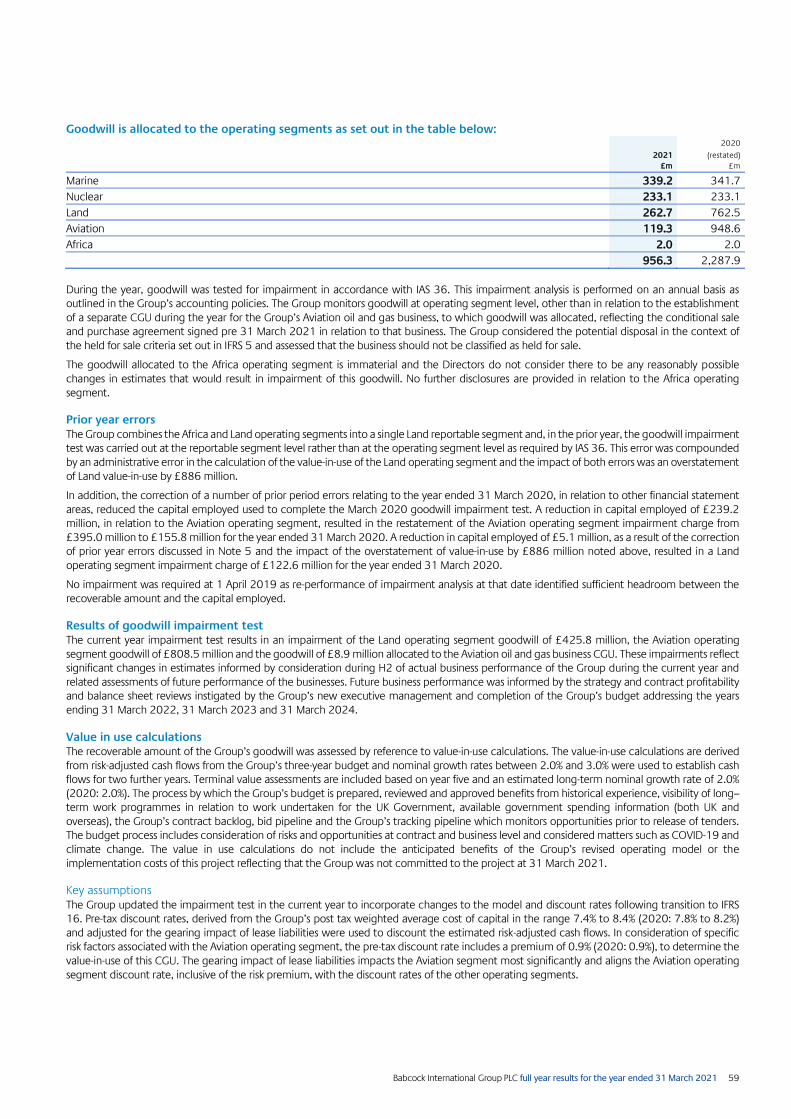


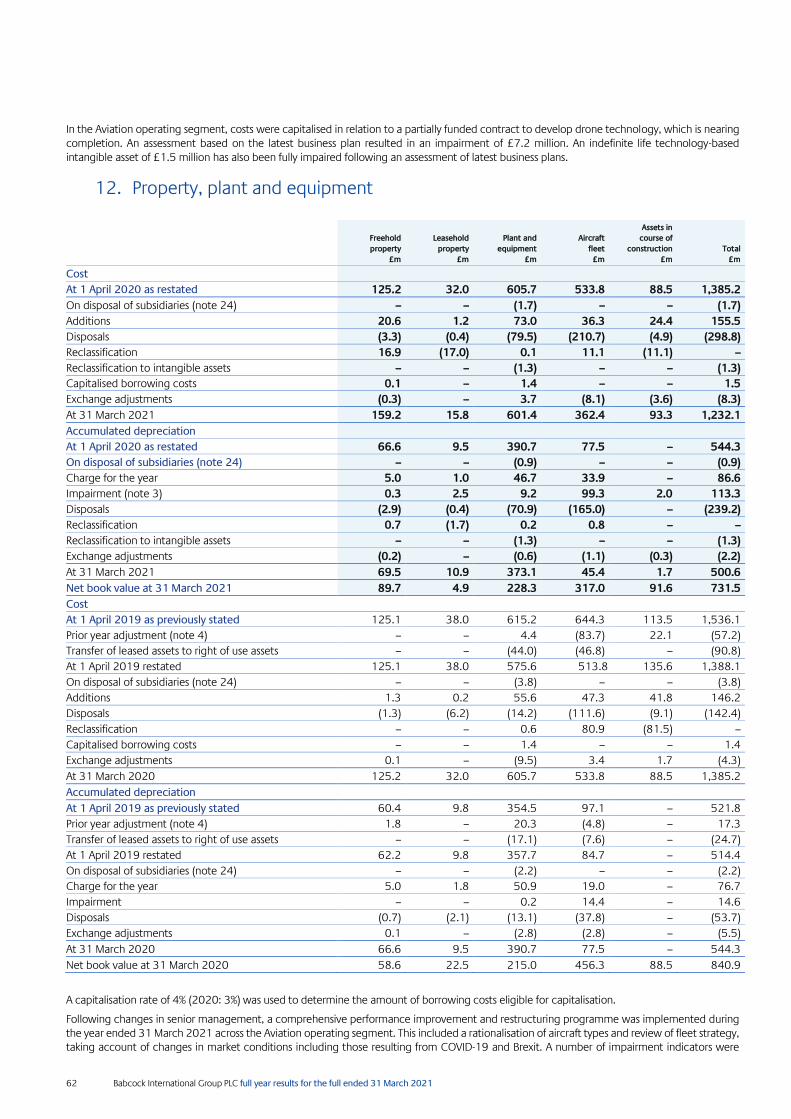


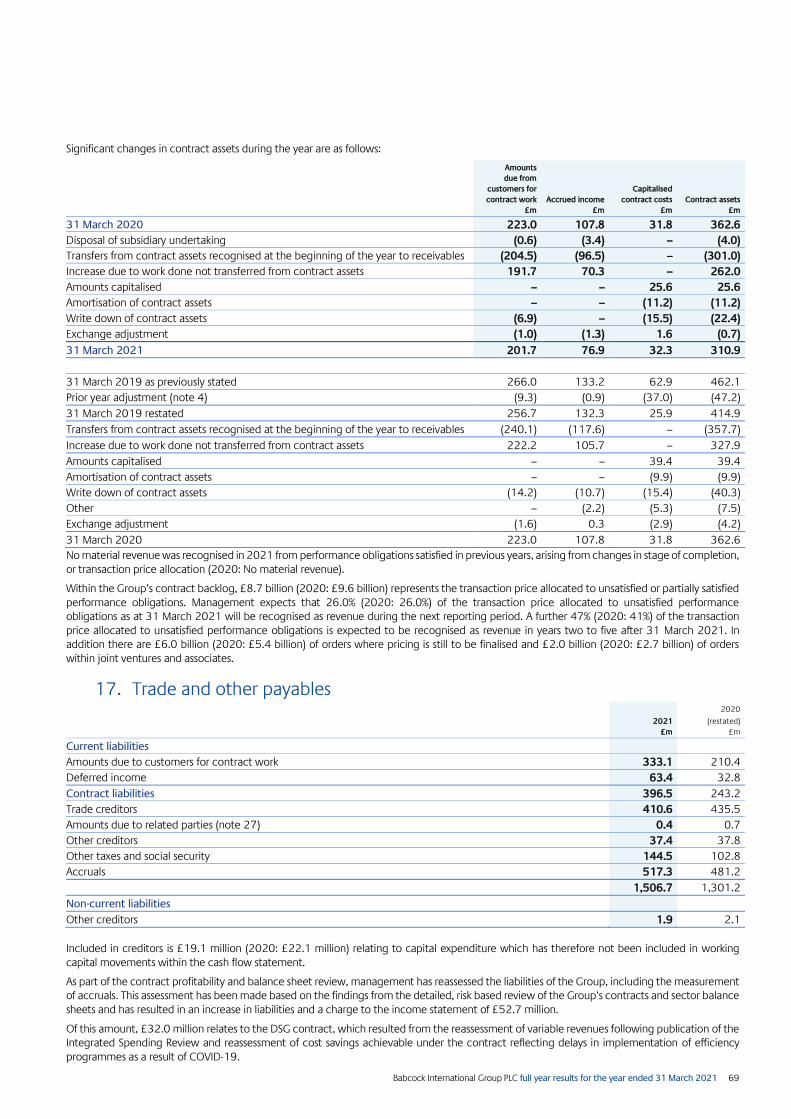


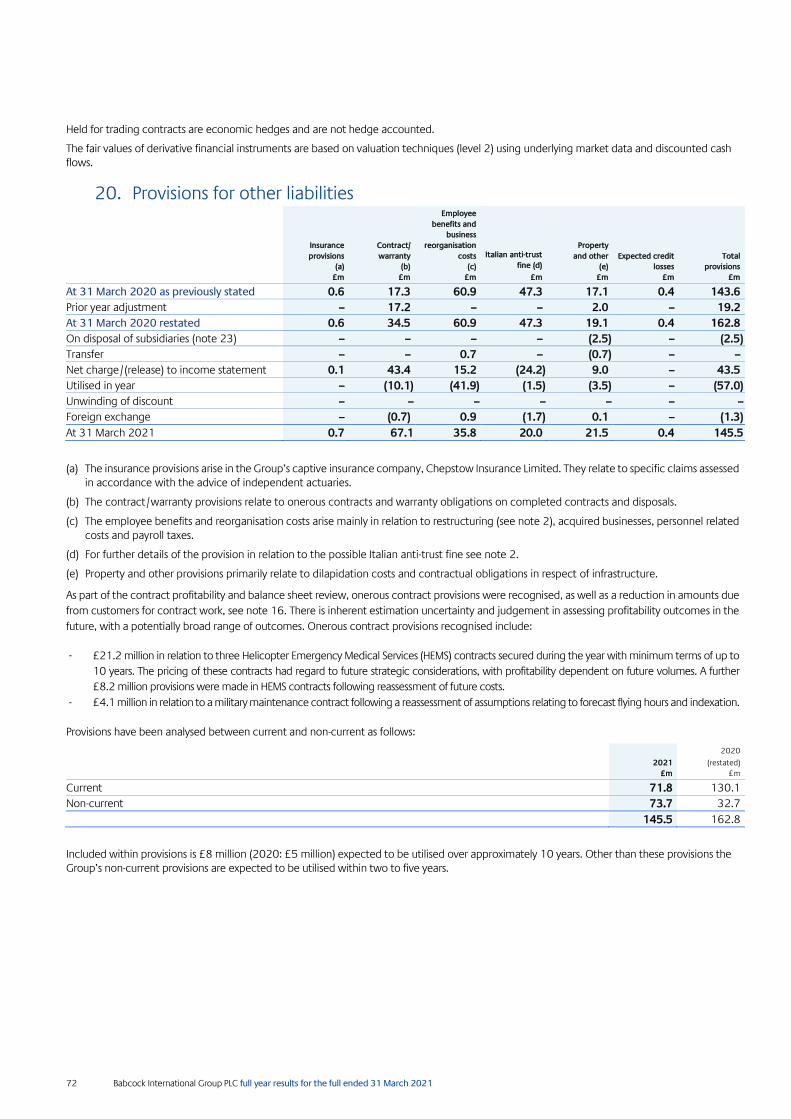
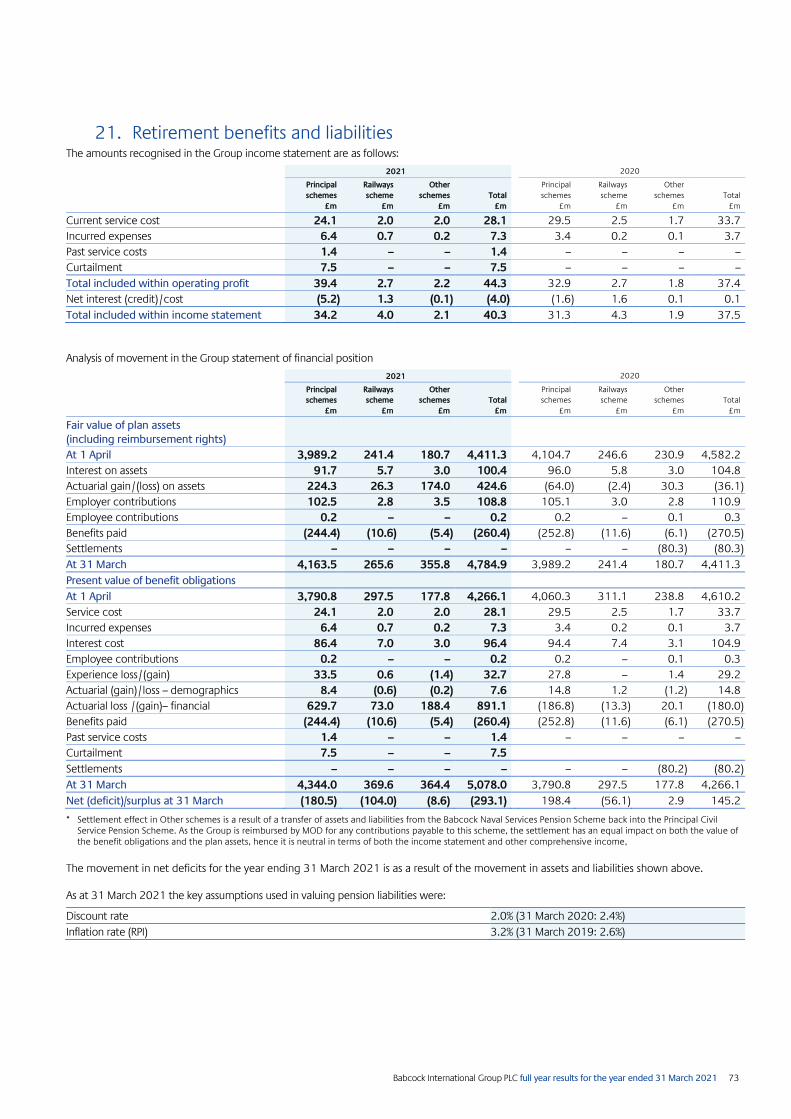
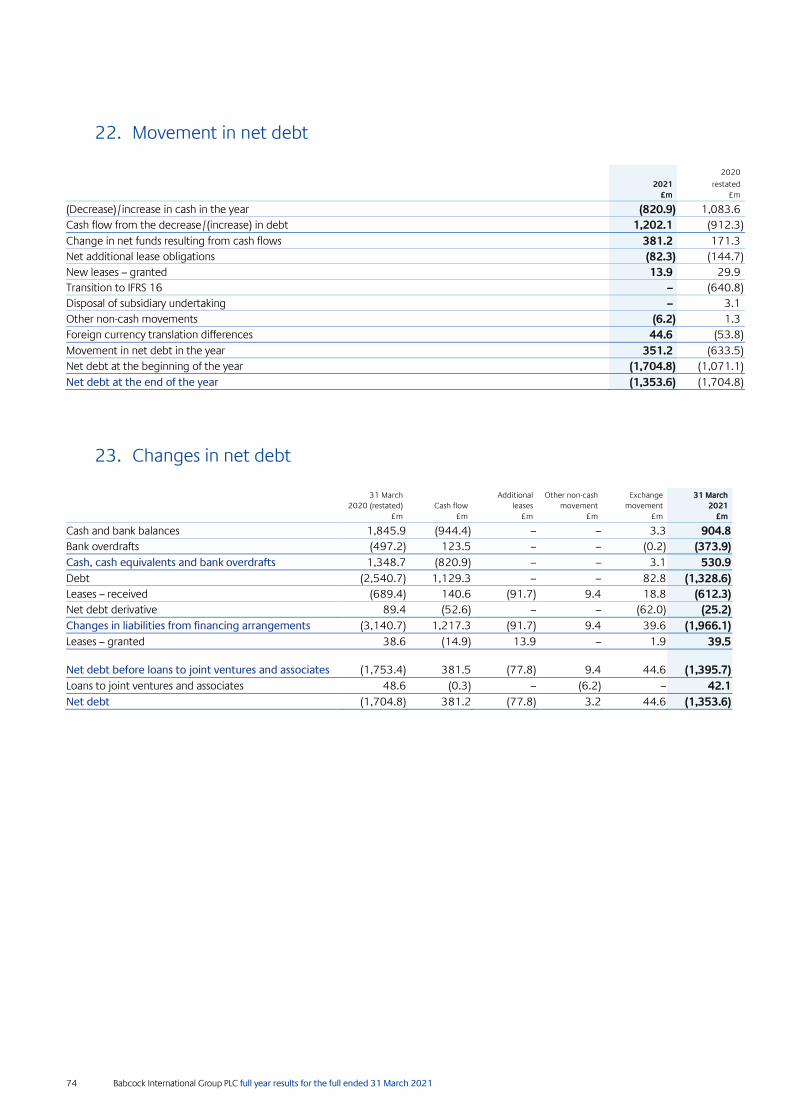
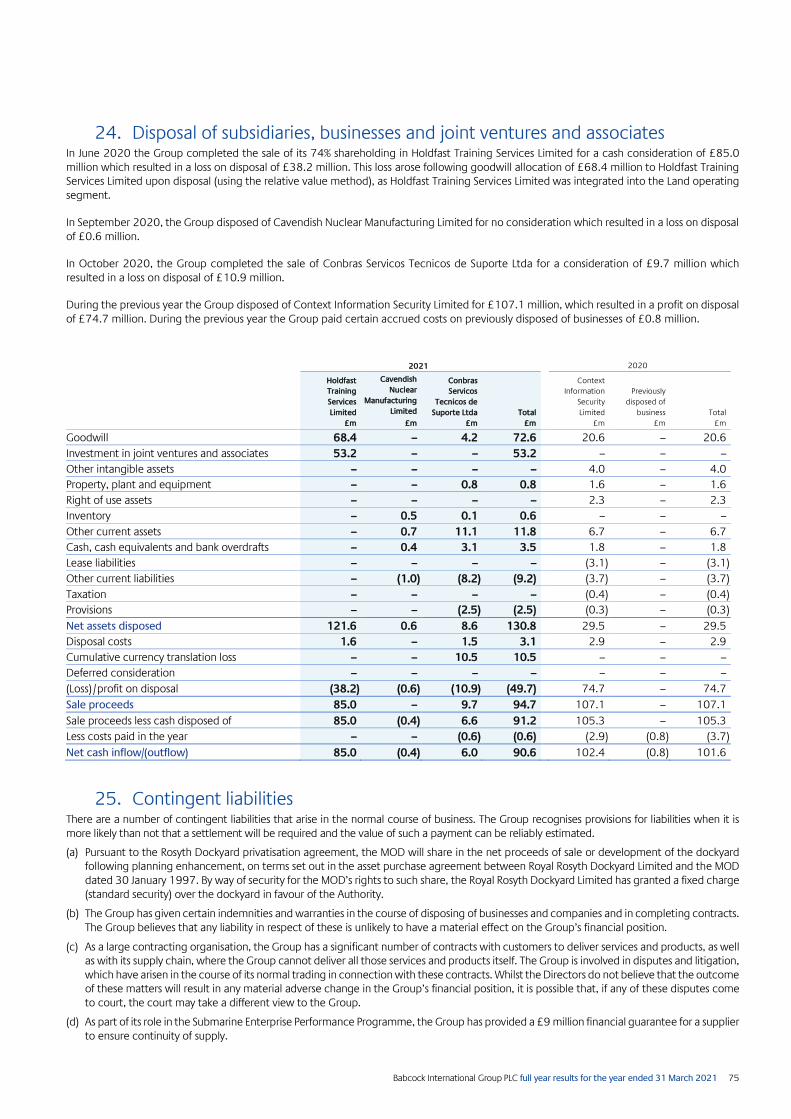


![Beginner’s Guide to PLC Programming [Neal Babcock] 2008](https://static.documents.pub/doc/80x56/577c774e1a28abe0548b8f4c/beginners-guide-to-plc-programming-neal-babcock-2008.jpg)


