55
Baby Boomers and 65+: The Impact of the Demographic Shift Bob Semro Policy Analyst February 2015 The Bell Policy Center Research • Advocacy • Opportunity
| Date post: | 16-Dec-2015 |
| Category: |
Documents |
| Upload: | mitchell-bridgeford |
| View: | 213 times |
| Download: | 0 times |
Baby Boomers and 65+: The Impact of the Demographic Shift
Bob SemroPolicy AnalystFebruary 2015
The Bell Policy CenterResearch • Advocacy • Opportunity

2
The Demographic ProblemIs Unprecedented in History

The United States – Today
Almost 48 million Americans are between the ages of 64 and 84 An additional 7 million Americans are over age 85
– By 2030 There will be 74 million Americans between the ages of 64 and 84 Another 9 million Americans will be over age 85
– By 2040 There will be 83 million Americans over the age of 65 Another 15 million Americans will be over age 85
– By 2050 There will be 88 million Americans over the age of 65 Almost 20 million Americans will be over age 85 (equivalent to the entire population of Florida in 2014)
Source: 2014 US Census Bureau Population Projections http://www.census.gov/population/projections/data/national/2014/summarytables.html
Aging in the United States Through 2050

In 1960 there were 5.6 working-age people per retiree. In 2010 there were 4.6 working-age people per retiree. In 2030 there will be 2.8 working-age people per retiree.
Ratio of Working Age Population to the Elderly
Source: http://www.naic.org/documents/committees_b_senior_issues_2012_fall_nm_ltc_hearing_presentations_melnyk.pdf

Colorado’s 65+ population is projected to increase by 123% between 2010 and 2030 By 2030, Colorado’s 65+ population will reach 1,242,000 people (compared to 550,000 in 2010) By 2040, Colorado’s 65+ population will reach 1, 475,000 people and will represent 19% of
Colorado’s total population The ratio of workers to non-workers in Colorado will be falling from 68% to 59% between 2010 and
2040
Source: Elisabeth Garner, State Demography Office, Department of Local Affairs: Presentation to House Health and Environment Committee, March 2012
Source: State Demographer’s website: Age and Gender query selected age grouping 65-99 - https://dola.colorado.gov/demog_webapps/pagParameters.jsf
Source: Colorado State Demographer 2014 presentation http://www.colorado.gov/cs/Satellite/DOLA-Main/CBON/1251593240528
Colorado 65+ Population through 2030 and 2040

The “Senior Tsunami” has already begun. In the last 4 years: well over 134,000 baby boomers (born 1946 – 1964) in Colorado turned age 65.
Today: – 684,000 Coloradans are over age 65–
In 15 years: – 1,270,000 Coloradans will be over age 65, an increase of 86 percent over today
In 25 years: – 1,475,000 Coloradans will be over age 65, an increase of 116 percent over today
Source: Colorado State Demographers Office: Population and Gender Calculation : https://dola.colorado.gov/demog_webapps/pagCategory.jsf https://dola.colorado.gov/demog_webapps/pagParameters.jsf
The Demographic Shift in ColoradoOver Age 65
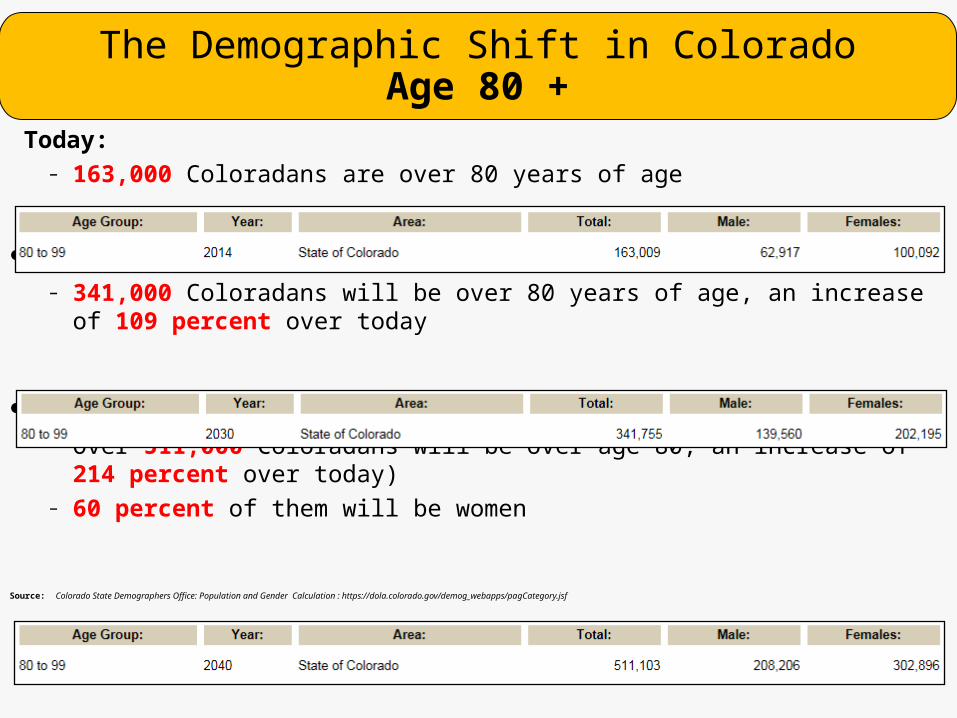
Today: – 163,000 Coloradans are over 80 years of age
In 15 years: – 341,000 Coloradans will be over 80 years of age, an increase of 109 percent over today
In 25 years: – Over 511,000 Coloradans will be over age 80, an increase of 214 percent over today) – 60 percent of them will be women
Source: Colorado State Demographers Office: Population and Gender Calculation : https://dola.colorado.gov/demog_webapps/pagCategory.jsf
The Demographic Shift in ColoradoAge 80 +
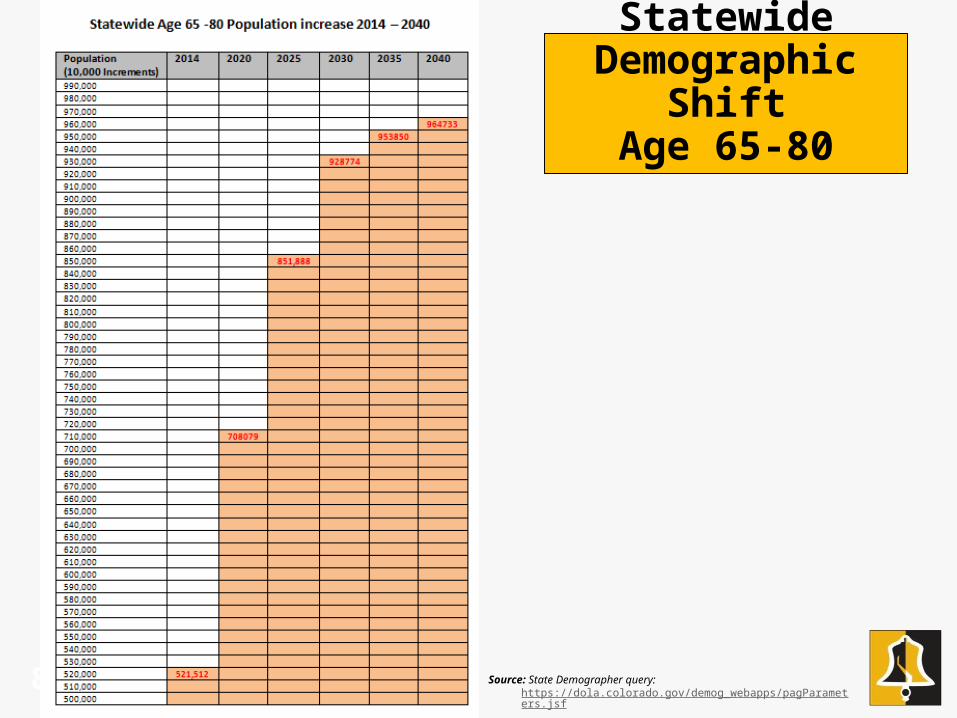
Colorado Statewide
Demographic Shift
Age 65-80
Source: State Demographer query: https://dola.colorado.gov/demog_webapps/pagParameters.jsf8

Colorado Statewide
Demographic Shift
Age 80+
9Source: State Demographer query:
https://dola.colorado.gov/demog_webapps/pagParameters.jsf

Colorado Statewide Demographic ShiftAge 80+ by Gender
10Source: State Demographer query: https://dola.colorado.gov/demog_webapps/pagParameters.jsf

Colorado: Growth in 65+ Population by CountyUrban
Source: State Demography Office, Aging in Colorado, July 2012

Colorado: Growth in 65+ Population by CountyRural
Source: State Demography Office, Aging in Colorado, July 2012

Colorado 65+ Population Characteristics
Source: AARP, Across the States - profiles Of Long-Term Services and Supports, 2012 http://www.aarp.org/content/dam/aarp/research/public_policy_institute/ltc/2012/across-the-states-2012-full-report-AARP-ppi-ltc.pdf
Source: Alzheimer’s Association, 2014 Alzheimer’s Disease, facts and Figures : http://www.alz.org/downloads/Facts_Figures_2014.pdf

Long Term Care Use In the United States and Colorado

15
“A more accessible and sustainable Medicaid is needed to assure its continued role in guaranteeing the availability of LTSS for individuals and families with few resources to provide for themselves”
Long Term Care Commission Report to Congress: September 18. 2013
National Long Term Care Usage 2010 - 2050
Source: Commission on Long Term Care : Report to Congress, September 30, 2013
125% growth rate
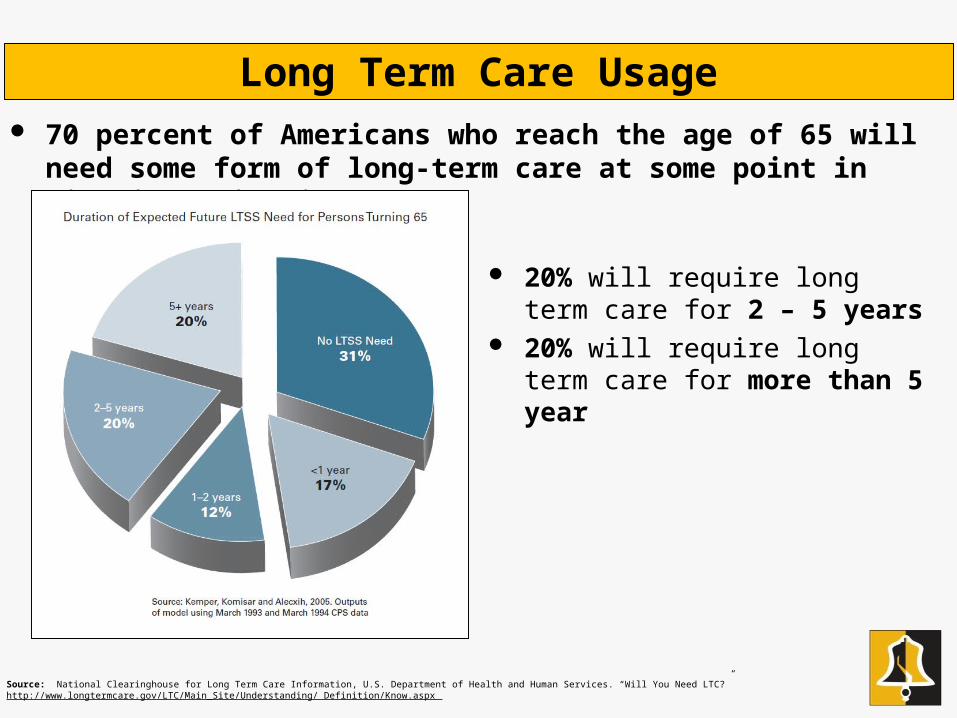
Long Term Care Usage 70 percent of Americans who reach the age of 65 will need some form of long-term
care at some point in time in their lives
Source: National Clearinghouse for Long Term Care Information, U.S. Department of Health and Human Services. “Will You Need LTC?” http://www.longtermcare.gov/LTC/Main_Site/Understanding/ Definition/Know.aspx
20% will require long term care for 2 – 5 years
20% will require long term care for more than 5 year

Long Term Care Usage
870,000 to 930,000 Coloradans will require long term care by 2030 or beyond The average time span for long term care is 3 years. Women will need care of a longer period of time, on average 3.7 years Men will need less care on average 2.2 years
Source: Colorado Health Institute, Long Term Services and Supports in Colorado Nov. 2011 http://www.coloradohealthinstitute.org/uploads/downloads/Long_Term_Services_and_Supports.pdf Source: http://longtermcare.gov/the-basics/how-much-care-will-you-need/

Nursing Home Usage and Duration of Care
Source: Center for Retirement Research Long-Term Care: How Big A Risk?, November 2014 http://crr.bc.edu/briefs/long-term-care-how-big-a-risk/
Two recent studies from 2014 project that 44% of men and 58 % of women will use a skilled nursing facility after age 65 The same studies indicate that nursing home stays average 11 months for the typical single man and 17 months for a single woman

What Medicare and Medicaid Pay For

Medicare and Medicaid Elligibility Medicare pays for:
– The first 20 days of nursing home care and a portion of the next 80 days following a hospitalization– Intermittent home health benefits if clients are: homebound, have skilled care needs, under a physician’s
care– 693,000 Coloradans are currently on Medicare 13.4% of the state’s population– 148,000 (21% of total) are below 150% of FPL
Medicaid pays for:– Institutional and community-based long term support services LTSS for individuals with limited incomes:
Up to 300 percent of the Supplemental Security Income (SSI) ($2,163 per month for an individual in 2014)
Limited assets ($2,000 for an individual or $4,000 for a couple) Require assistance with (ADLs) (IADLs).
Source: Colorado Health Institute: Long-Term Services and Supports in Colorado, November 2011 updated January 2012
21
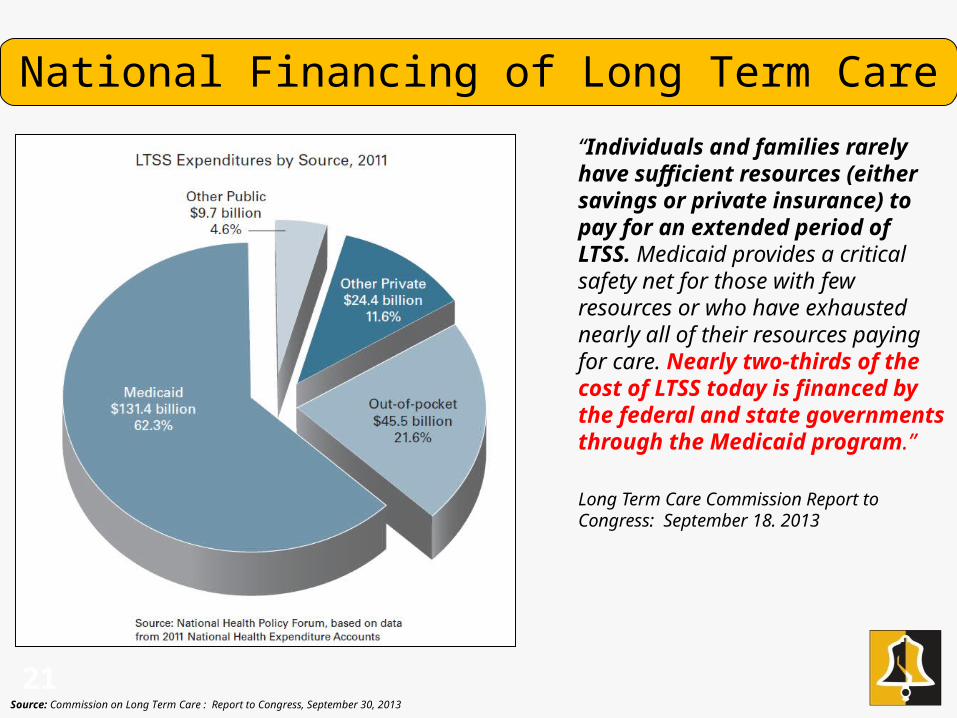
“Individuals and families rarely have sufficient resources (either savings or private insurance) to pay for an extended period of LTSS. Medicaid provides a critical safety net for those with few resources or who have exhausted nearly all of their resources paying for care. Nearly two-thirds of the cost of LTSS today is financed by the federal and state governments through the Medicaid program.”
Long Term Care Commission Report to Congress: September 18. 2013
National Financing of Long Term Care
Source: Commission on Long Term Care : Report to Congress, September 30, 2013

22
Financial Insecurity
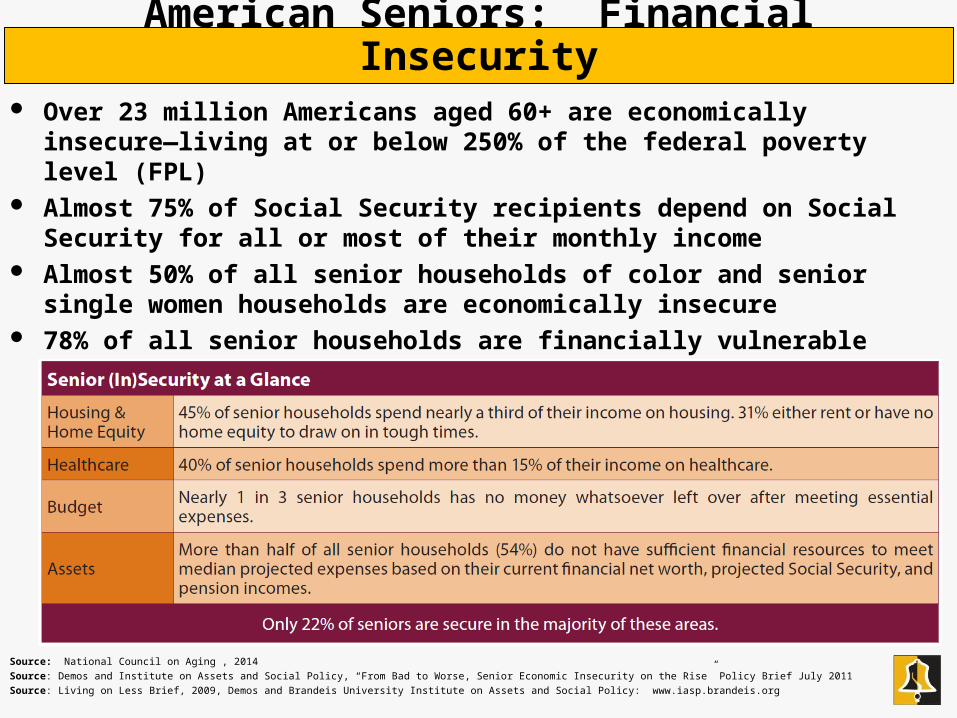
American Seniors: Financial Insecurity Over 23 million Americans aged 60+ are economically insecure—living at or below
250% of the federal poverty level (FPL) Almost 75% of Social Security recipients depend on Social Security for all or most
of their monthly income Almost 50% of all senior households of color and senior single women households
are economically insecure 78% of all senior households are financially vulnerable
Source: National Council on Aging , 2014Source: Demos and Institute on Assets and Social Policy, “From Bad to Worse, Senior Economic Insecurity on the Rise” Policy Brief July 2011Source: Living on Less Brief, 2009, Demos and Brandeis University Institute on Assets and Social Policy: www.iasp.brandeis.org
American Baby Boomers: Financial Insecurity 2011
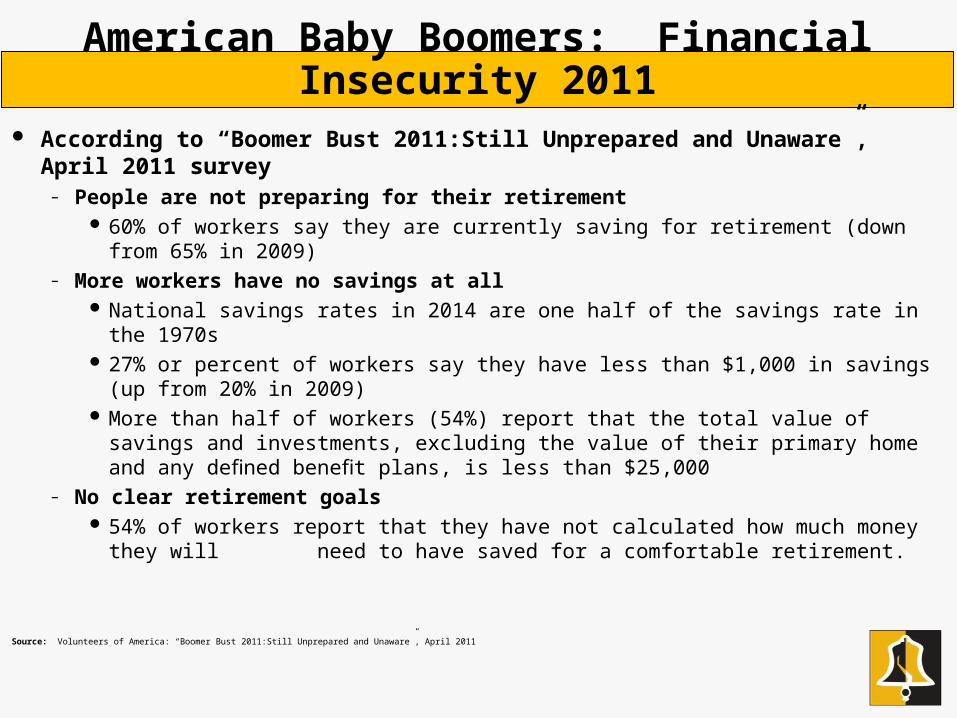
According to “Boomer Bust 2011:Still Unprepared and Unaware”, April 2011 survey– People are not preparing for their retirement
60% of workers say they are currently saving for retirement (down from 65% in 2009)– More workers have no savings at all
National savings rates in 2014 are one half of the savings rate in the 1970s 27% or percent of workers say they have less than $1,000 in savings (up from 20% in 2009) More than half of workers (54%) report that the total value of savings and investments,
excluding the value of their primary home and any defined benefit plans, is less than $25,000– No clear retirement goals
54% of workers report that they have not calculated how much money they will need to have saved for a comfortable retirement.
Source: Volunteers of America: “Boomer Bust 2011:Still Unprepared and Unaware”, April 2011

American Baby Boomers: Financial Insecurity 2011
– Expect to work longer 66% of workers expect that they will have to work after age 65
– Problems with the “working longer” strategy Current employment may not be available Salaries and job opportunities may decline with age for many Physical labor jobs may not be possible Training or skill sets for new jobs Working longer may not compensate for limited savings Caregiving for other family members may limit work opportunities
Source: Volunteers of America: “Boomer Bust 2011:Still Unprepared and Unaware”, April 2011

Baby Boomers: Financial Insecurity, ERBI Survey Data 2014
ERBI (Employee Benefits Research Institute) 2014 Retirement Confidence Survey Data
Workers– 16% of workers age 45 and older cite assets of $250,000 or more not including the value
of a primary residence or defined benefit plan– 48 % of workers age 45 and older report having total savings and investments of less
than $25,000 not including the value of a primary residence or defined benefit plan Retirees
– For retirees in 2014 with a retirement plan (IRA, DC or DB plan) 35% report having less than $25,000 in savings and investments excluding the value of a primary home.
– For retirees without a retirement plan 87% report having less than $25,000 in savings excluding a primary residence.

Baby Boomers: Financial Insecurity, ERBI Survey Data 2014
ERBI (Employee Benefits Research Institute) 2014 Retirement Confidence Survey Data

Baby Boomers: Reasons For Financial Insecurity
Personal responsibility Annual income growth has been relatively stagnant
– Inflation adjusted income for middle income boomers has changed very little since 1989
– For lower income boomers inflation adjusted incomes remained at roughly the level of the late 1970s
Work based pensions have been replaced with 401Ks and profit sharing– About 750,000 pensions were terminated b/w 2000 and 2009– About 60% of working Coloradans (1.7 million) do not have 401Ks or other defined
benefit plans 401Ks and other investments were hit hard by the latest recession
– A baby boomer in a targeted date 401K you could have lost as much as 25% to 32% of the value of that plan on average, depending on the plan.
– It may take from 2 to 9 years to recover those losses. Historically low interest rates on savings

Long Term Care Costs and Trends in Colorado

Long Term Care: National Misconceptions
About one quarter (24 to 30%) of people over the age of 40 accurately estimate nursing home, assisted living and home health aide costs.
58% underestimate the cost of a nursing home Over 30% underestimate the cost of assisted living 37% think Medicare pays for ongoing care in a nursing home 44% think Medicare pays for ongoing home care w/ home health aide
Source: SCAN Foundation and Associated Press NOCR Center for Public Affairs Research: 2013

Genworth Cost of Long Term Care for Colorado 2014
Colorado Home Care Services average hourly rates:– Average hourly rate: $21 per hour – US average $19 per hour– Annual median rate: $47,773 – US average $43,472– 5 year growth rate: -2% to 5%
Source: Genworth Financial: 2014 Cost of Care Survey

Genworth Cost of Long Term Care for Colorado 2014
Colorado Home Health Aide Services average hourly rates:– Average hourly rate: $22 per hour – US average $20 per hour– Annual median rate: $50,336 – US average $45,188– 5 year growth rate: -2% to 7%
Source: Genworth Financial: 2014 Cost of Care Survey

Genworth Cost of Long Term Care for Colorado 2014
Colorado Assisted Living average monthly rates:– Average monthly rate: $3,313 per month – US average $3,500 per month– Colorado daily rate: $110.43 per day – Annual median rate: $39,750 – US average $42,000– 5 year growth rate: -5% to 8%
Source: Genworth Financial: 2014 Cost of Care Survey

Genworth Cost of Long Term Care for Colorado 2014
Colorado Nursing Home Semi-Private average daily rates:– Average daily rate: $217 per day – US average $212 per day– Colorado monthly rate: $6,510 per month – Annual median rate: $79,205 – US average $77,380– 5 year growth rate: 2% to 5%
Source: Genworth Financial: 2014 Cost of Care Survey

Genworth Cost of Long Term Care for Colorado 2014
Colorado Nursing Home Private average daily rates:– Average daily rate: $252 per day – US average $240 per day– Colorado monthly rate: $6,510 per month – Annual median rate: $91,980 – US average $87,600– 5 year growth rate: 2% to 6%
Source: Genworth Financial: 2014 Cost of Care Survey

Private Pay Out of Pocket Costs Median annual private pay costs for home health services:
– Averages 88% of an older person’s annual income, nationally – This ranges from 55% to 125% across states
Nationally, median annual private pay costs for nursing home services:– Averages 241% of an older person’s annual income, nationally – This ranges from 166% to 444% across states
One in four people age 45 and over are not at all prepared financially should they suddenly require long-term care for an indefinite period
Source: Reinhard S, Kassner E, Houser A, Mollica R. Raising Expectations: A State Scorecard on LongTerm Services and Supports for Older Adults, People with Physical Disabilities, and Family Caregivers. 2011
Family Care Giving

Informal Caregiving and the Availability of Caregivers
Unpaid informal care provided by family and friends– In 2007, about 540,000 unpaid caregivers provided personal care and assistance for individual Coloradans– For every dollar spent on Medicaid, friends and families provided $6 of uncompensated care. The fifth highest in the country (2007)
A potential decline in the number of caregivers (2013 AARP Study) – In Colorado, the number of potential caregivers is projected to drop from 9 potential caregivers for every person in the high-risk years of 80-plus in 2010 to half of that
number for every person 80-plus in 2030. By 2050 there are projected to be 2.7 potential caregivers for every person over the age of 80.
Note: The “caregiver support ratio” is the number of potential caregivers aged 45–64 for each person aged 80 and older. The AARP report used this support ratio to estimate the availability of family caregivers during the next few decades
Source: Colorado Health Institute Long term Services and Supports in Colorado, November 2011, page 12 http://www.coloradohealthinstitute.org/uploads/downloads/Long_Term_Services_and_Supports.pdfSource: AARP Public Policy Institute, The Aging of the Baby Boom and the Growing Care Gap: A Look at Future Declines in the Availability of Family Caregivers http://www.aarp.org/content/dam/aarp/research/public_policy_institute/ltc/2013/baby-boom-and-the-growing-care-gap-insight-AARP-ppi-ltc.pdf

Long Term Care Financing : Private financing –
informal Caregivers 43% of caregivers indicated that their care giving lasted three or more years. Women provided the vast majority of unpaid caregiving. The cost to U.S. businesses from lost care-giver productivity (reduced hours, replacement
of employees, absenteeism, and other factors) was estimated at $34 billion dollars in 2004.
Source: Colorado Health Institute: Long-Term Services and Supports in Colorado, November 2011 updated January 2012

Long Term Care Insurance

Long Term Care Financing: LTC insurance
Long Term Care Insurance – From 2004 to 2012, LTCI insurance premiums increased by 29%– Poor market penetration - about 10% of Americans between 45 and 62 have purchased LTC
insurance. Only 7 out of 313 million Americans have long term care insurance– In the last 10 years sales to individuals have fallen by two-thirds to 233,000 policies a year– 10 out of the top 20 individual writers of long-term care insurance have since exited the market
over the last five years– According to LifePlans Inc. (consulting group) only a dozen or so companies still sell meaningful
numbers of policies, down from about 100 carriers a decade ago
Source: USA Today, Baby Boomers Struggle to Get Long-Term Care Insurance, March 30, 2012
Source: http://www.npr.org/2012/05/08/151970188/long-term-care-insurance-who-needs-it
Source: Morrissey , Janet : Preparing for Long Term Care Any Good Options?, Time Magazine , Feb. 8, 2011
Source: http://online.wsj.com/news/articles/SB10001424127887323475304578501820197828966

Impact on the State Budget and Economy
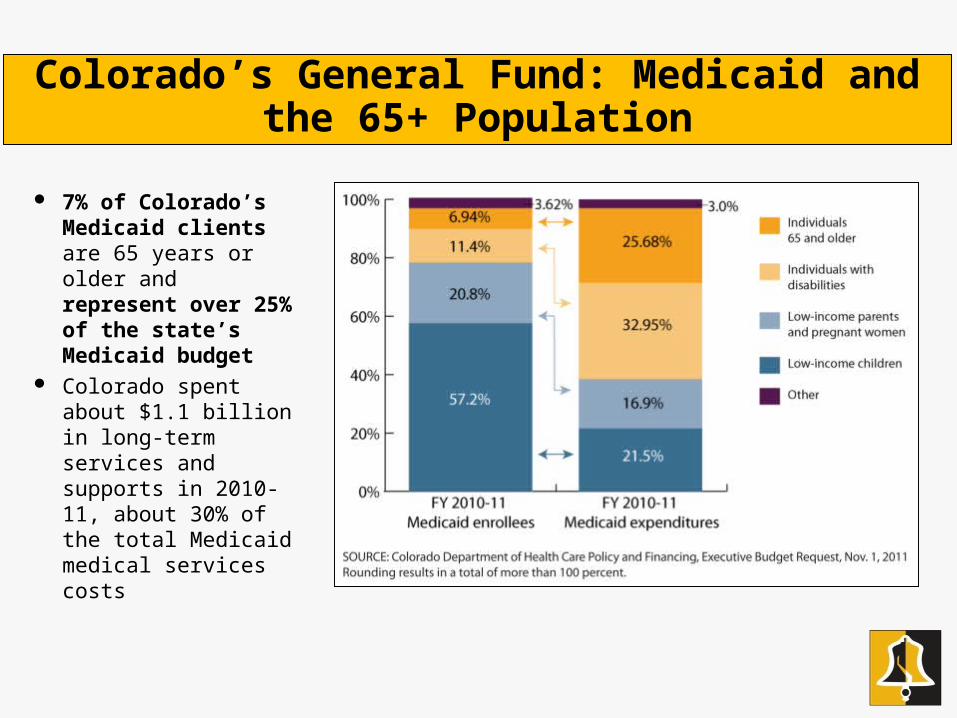
Colorado’s General Fund: Medicaid and the 65+ Population
7% of Colorado’s Medicaid clients are 65 years or older and represent over 25% of the state’s Medicaid budget
Colorado spent about $1.1 billion in long-term services and supports in 2010-11, about 30% of the total Medicaid medical services costs

Colorado: Medicaid Cost vs. General Fund
with ACA Medicaid Expansions
Source: Charlie Brown / Colorado State University, Financing Colorado’s Future 2014Source: http://www.cbo.gov/sites/default/files/cbofiles/attachments/March2012Baseline.pdf
Note: The Congressional Budget Office (CBO) estimates that federal Medicaid spending will increase from $275 billion in FY 2011 to $622 billion in FY 2022 (226% increase)

The aging demographic will impact the state economy– Boomers represented 37% of the labor force in 2010– Approximately 1,000,000 Colorado workers will be aging out of the work force
over the next 20 years The historic “Demographic Dividend” for state revenue provided by the Baby
Boomer generation will end as they exit the workforce– Past state revenue picture has benefited from boomers at the peak of their
earning potential in a strong economy Sales tax revenues will decrease because consumer buying patterns change
as the population ages
Impact on Revenue and the Colorado Economy
Source: State Demography Office, Colorado’s Aging Trends, Department of local Affairs March 2012,

Colorado: Consumption of More Services and Fewer Goods
Source: Charlie Brown / Colorado State University, Financing Colorado’s Future, 2014

Sales tax revenue drops by 1/3 per householder
Colorado Sales Taxes: Aging Affects Revenue

National Sales Tax Revenue Projections Through 2030
House Bill 15-1033

A Strategic Plan on Aging A state wide strategic plan on aging
– Provides greater issue visibility: Better educate Colorado’s boomer and senior populations Better inform state and local policy makers, business leaders and organizations about Colorado’s aging
challenges Better prepare state programs to address future state and federal funding challenges
– Must extend out at least 15 -20 years into the future where the greatest challenges are– Needs to be external to existing state departments – HCPF, CDPHE, or CDHS– Must incorporate and synthesize the results of previous commissions and study groups– Needs to make practical recommendations on solutions, public education and funding along with a
timeline for implementation– Must include public and private sector solutions– Must provide actionable recommendations to policy makers amd state departments– Review and incorporate national initiatives as well as strategic planning developed in other states– Must be updated as new data is made available

HB-1033 Strategic Planning Group
– 21 voting members (2 staff members) 4 members that represent consumers and consumer organizations affiliated with aging populations 5 members that represent private, public and community based health care and LTSS providers 1 representative representing county government 1 representative from the general business community 3 members who are experts on state and local budgets and fiscal policy 1 academic expert on aging 5 members representing state departments
– CDHS– HCPF– CDPHE– Colorado Commission on Aging– Representative of the Governor’s Office
– The planning group may establish special purpose subcommittees and technical advisory committees to meet any particular need
HB-1033 Strategic Planning Group
– The planning group can contract directly with data analysis, modeling and research organizations The Strategic Plan
– Must include economic, demographic, fiscal, and budget data through the year 2030 State wide and regional demographic analysis Analysis of impact of the demographic shift on the state economy and workforce Analysis of impact of the demographic shift on state and local revenue Analysis of state spending and shortfalls resulting from the demographic shift Analysis of the financial security of Colorado’s boomer population and the potential demand and
impact on state programs and services Analysis of federal entitlement reform options and resulting impact on federal funding to Colorado Analysis of the number of people who would benefit from additional community based services Economic impact of caregiving on families, businesses and the over-all economy

HB-1033 The Strategic Plan
– Must include actionable public and private sector recommendations (recommendations must include but are not limited to)
Options to address the long term impact of the demographic shift through 2030 Options to address disproportional regional impact of the demographic shift Options to improve financial security and retirement preparation Options to enhance services access Options to improve LTSS service quality and infrastructure in the face of future demand Options to reduce administrative and service costs Administrative and regulatory reforms Private sector LTSS options Options to improve aging in place strategies Options to improve the accessibility and sustainability of affordable housing and transportation Options to improve caregiver support Financial and economic impact of not implementing recommendations

HB-1033 The Strategic Plan
– Must include actionable public and private sector recommendations (recommendations must include but are not limited to)
Possible legislation and regulatory changes Options for comprehensive public education program Options to address health care and LTSS provider shortfalls Options to better address the compatible needs of aging and disabled populations Options to better reduce elder physical and financial abuse
– Must include a strategy for plan updating

The Bell Policy Center1905 Sherman St.
Suite 900Denver, CO 80203
Phone: (303) 297-0456
@BellPolicy
youtube.com/bellpolicy
facebook.com/bellpolicy
bellpolicy.org
Bob SemroPolicy Analyst
Bell Policy Center
Connect with Us Online


