Working Papers N°1 - January 2018 Ministry of Economy and Finance Department of the Treasury Back on Track? A micro-macro Narrative of Italian Exports Matteo Bugamelli, Silvia Fabiani, Stefano Federico, Alberto Felettigh, Claire Giordano and Andrea Linarello ISSN 1972-411X
Transcript
Working Papers
N°1 - January 2018
Ministry of Economy and Finance
Department of the Treasury
Back on Track?
A micro-macro Narrative of Italian Exports
Matteo Bugamelli, Silvia Fabiani, Stefano Federico, Alberto Felettigh, Claire Giordano and Andrea Linarello
ISSN 1972-411X
Working Papers
The working paper series promotes the dissemination of economic research produced in the Department of the Treasury (DT) of the Italian Ministry of Economy and Finance (MEF) or presented by external economists on the occasion of seminars organized by MEF on topics of institutional interest to the DT, with the aim of stimulating comments and suggestions. The views expressed in the working papers are those of the authors and do not necessarily reflect those of the MEF and the DT.
After the large swings among European currencies between 1992 and 1995 and the subsequent adjustments until the inception of the euro, the performance of Italy’s exports has been disappointing when compared to that of its main euro-area competitors (Fig. 1). A country need not depend on exports to prosper, as long as it can rely on positive productivity growth, favourable demographics and sound economic fundamentals. However, this is hardly the case for Italy at the current conjuncture. This motivates our interest in exports, in order to understand both why their unsatisfactory developments contributed to the sluggish growth of Italian GDP and whether they are the symptom of a weak productive structure.
Figure 1 – Exports of goods and services
(constant prices; indices 1999=100)
Figure 2 – Export propensity (current-price shares of goods and services on GDP)
Source: Eurostat, National Accounts.
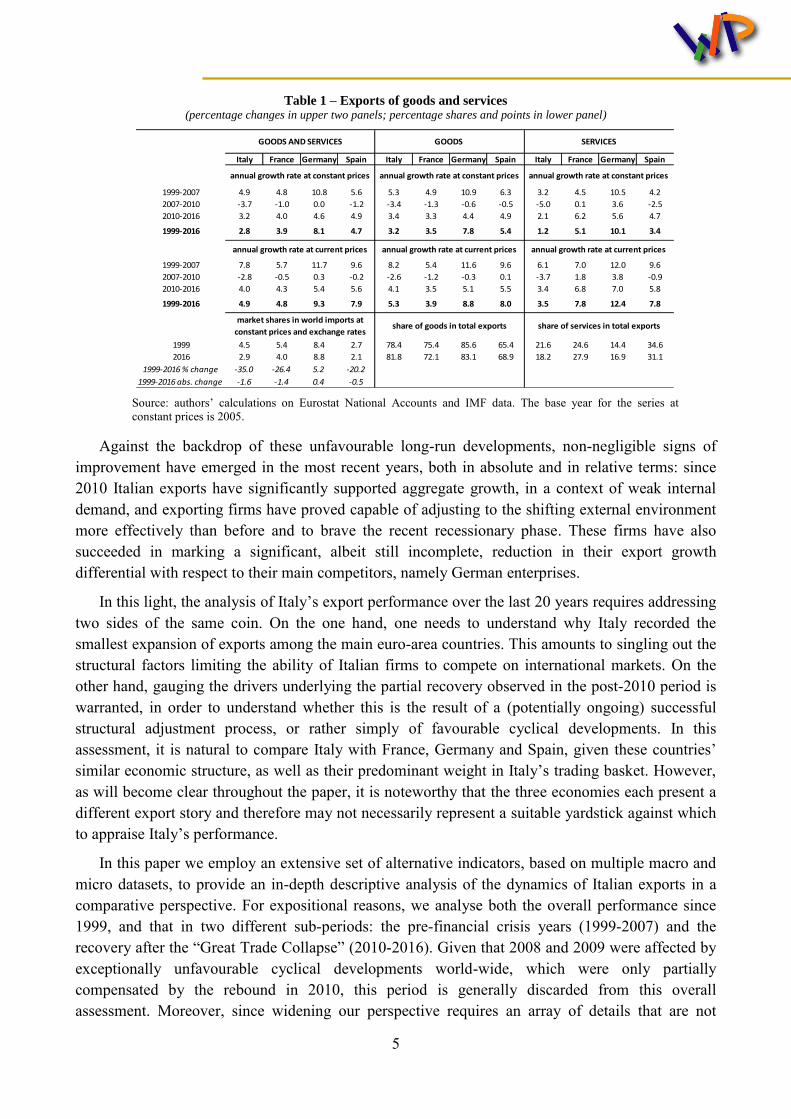
According to national accounts data, between 1999 and 2016 the volume of exports of goods and services in Italy grew at an annual average rate1 of 2.8 per cent (Tab. 1), at a significantly lower pace compared to France, Spain and especially Germany, whose foreign sales hiked at nearly triple the rate. As a result of these developments and starting from a similar level of around 25 per cent in all four countries in 1999, export shares in GDP rose to 30 per cent in Italy and France, to nearly 35 in Spain and to over 45 in Germany (Fig. 2). This translated into very different contributions of gross exports to cumulated GDP growth since 1999.2
Focusing on market shares in world imports of goods and services at constant prices – which is the standard synthetic indicator used by commentators and international institutions to appraise a country’s capability to compete on international markets – Italy recorded a decline from 4.5 per cent in 1999 to 2.9 in 2016 (Tab. 1, bottom left-hand panel). France registered a similar loss in absolute terms, albeit starting from higher levels, while Spain recorded a mild drop, although departing from very low values. Only Germany marked an increase in its world market share over the same period.
1 Throughout the paper, average (annual) growth rates are computed as the ratio between the cumulated growth rate
between the first and the final year and the number of years (excluding the initial one). 2 Around 10 percentage points for Italy, 15 for France, 19 for Spain and an exceptional 35 for Germany.
Table 1 – Exports of goods and services (percentage changes in upper two panels; percentage shares and points in lower panel)
Source: authors’ calculations on Eurostat National Accounts and IMF data. The base year for the series at constant prices is 2005.
Against the backdrop of these unfavourable long-run developments, non-negligible signs of improvement have emerged in the most recent years, both in absolute and in relative terms: since 2010 Italian exports have significantly supported aggregate growth, in a context of weak internal demand, and exporting firms have proved capable of adjusting to the shifting external environment more effectively than before and to brave the recent recessionary phase. These firms have also succeeded in marking a significant, albeit still incomplete, reduction in their export growth differential with respect to their main competitors, namely German enterprises.
In this light, the analysis of Italy’s export performance over the last 20 years requires addressing two sides of the same coin. On the one hand, one needs to understand why Italy recorded the smallest expansion of exports among the main euro-area countries. This amounts to singling out the structural factors limiting the ability of Italian firms to compete on international markets. On the other hand, gauging the drivers underlying the partial recovery observed in the post-2010 period is warranted, in order to understand whether this is the result of a (potentially ongoing) successful structural adjustment process, or rather simply of favourable cyclical developments. In this assessment, it is natural to compare Italy with France, Germany and Spain, given these countries’ similar economic structure, as well as their predominant weight in Italy’s trading basket. However, as will become clear throughout the paper, it is noteworthy that the three economies each present a different export story and therefore may not necessarily represent a suitable yardstick against which to appraise Italy’s performance.
In this paper we employ an extensive set of alternative indicators, based on multiple macro and micro datasets, to provide an in-depth descriptive analysis of the dynamics of Italian exports in a comparative perspective. For expositional reasons, we analyse both the overall performance since 1999, and that in two different sub-periods: the pre-financial crisis years (1999-2007) and the recovery after the “Great Trade Collapse” (2010-2016). Given that 2008 and 2009 were affected by exceptionally unfavourable cyclical developments world-wide, which were only partially compensated by the rebound in 2010, this period is generally discarded from this overall assessment. Moreover, since widening our perspective requires an array of details that are not
Italy France Germany Spain Italy France Germany Spain Italy France Germany Spain
available for services, we focus on merchandise exports, which in any case largely shape the overall exports’ dynamics in all four countries: as of 2016, goods accounted for over four-fifths of total exports in Italy and Germany, against 69 and 72 per cent in Spain and France, respectively (Tab. 1).
In Section 2 we begin by depicting the aggregate picture of Italy’s exports and gradually dig deeper into the geographical, sectoral and firm-level dimensions. While we mainly rely on data from national accounts and international merchandise trade statistics (IMTS), we also address meaningful statistical issues arising from the comparison of different data sources. Because of methodological issues related to the estimation of deflators, we conclude that it is preferable to assess export developments evaluated at current, rather than at constant, prices.
Using this measure, Italy’s exports of goods grew significantly less than those of Germany and Spain between 1999 and 2016, while over-performing with respect to those of France. These growth differentials are quantitatively large, although considerably smaller than when appraised at constant prices. The average annual growth rate of Italy’s merchandise exports at current prices was almost 3.5 percentage points lower than in Germany and 2.7 points lower than in Spain, but was almost 1.5 points higher than in France (Tab. 1). This pattern is broadly confirmed in each of the sub-periods considered, although the magnitude of the growth differentials changes: in particular, it significantly attenuates with respect to Germany after 2010.
In terms of export destinations, the large negative growth differential vis-à-vis Germany and Spain between 1999 and 2007 was largely due to sales within the EU and, in particular, the euro-area markets. After 2010, the narrowing of the gap with respect to Germany benefited from an improvement of Italy’s relative performance in the euro area as well as in some non-EU markets (most notably the United States), while Germany maintained its advantage in Central and Eastern Europe, presumably reflecting the strength of its regional supply chains.
Sector-wise, while before the crisis Italy’s exports expanded less than Germany’s in all main manufacturing branches, since 2010 they grew faster in many sectors. Motor vehicles and other transport equipment is a notable exception: net of these products, the growth rate of exports in the two countries over the last six years was broadly similar. The over-performance vis-à-vis France was broad-based, with the exception of few specific industries (wearing apparel, leather products and other transport equipment) which reflect the specialization of French companies in luxury products and in the aeronautical sector.
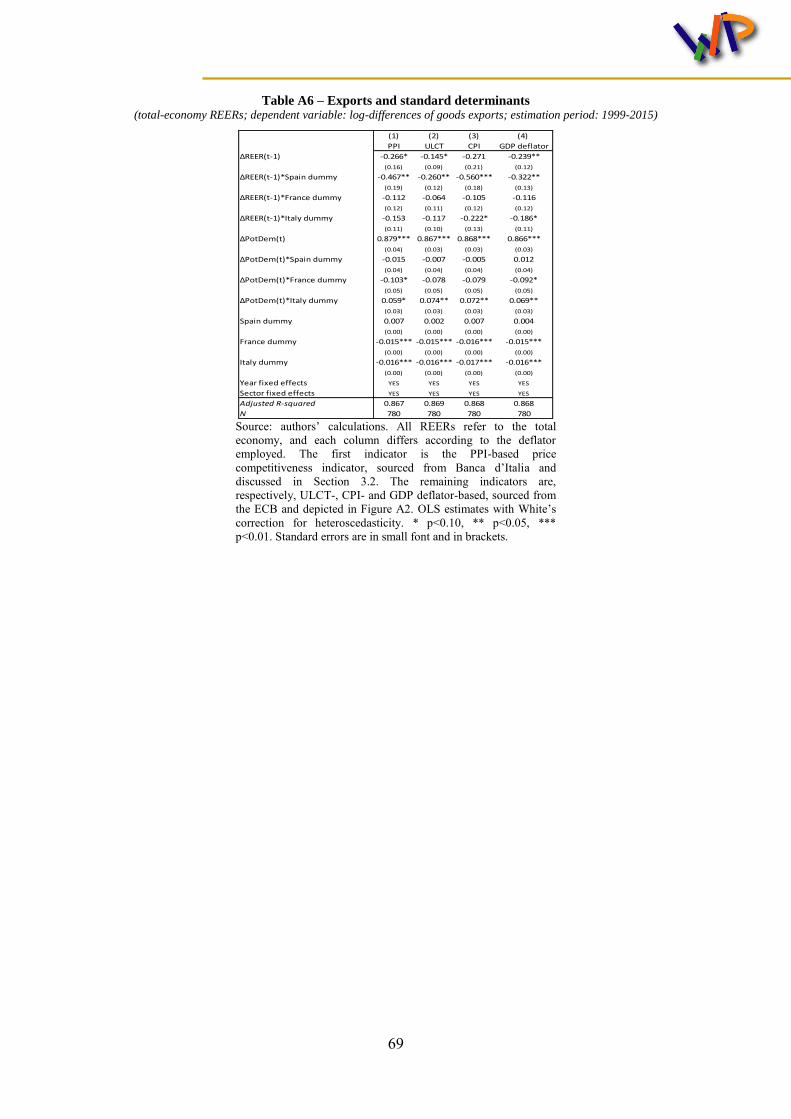
In the second part of the paper we assess the determinants of exports. In Section 3 we focus on “standard” factors, such as external demand, geographical and sectoral specialization, exchange rates and price competitiveness. We argue that price-competitiveness developments can partly explain Italy’s relative performance: they penalized it before 2007 and supported it to a certain extent in the post-2010 period, when relative price dynamics vis-à-vis euro-area competitors turned favourable in comparison with Germany. On the other hand, growth in external demand was broadly similar across the four countries, hence suggesting that sectoral and geographical specialization played only a minor role in explaining relative export trends.
However, sector specialization is also relevant in order to identify a country’s main competitors on world markets. In this respect it turned out to be relatively unfavourable for Italy, a point we
7
make in Section 4, which is devoted to the analysis of additional determinants of exports, in particular competition from China, product quality and domestic demand.
Indeed, given its sectoral specialization, Italy has undoubtedly been more exposed to the increased competitive pressures exerted by China since its entry into the World Trade Organization (WTO) in 2001: our rough estimates suggest that the “China shock” could explain at least one-tenth of the Italian under-performance on world markets relative to Germany and Spain. This lower bound disregards, in particular, the fact that smaller firms are more likely to have suffered increased competition from low-wage countries, with the distribution of Italian exporters by size being skewed to the left.
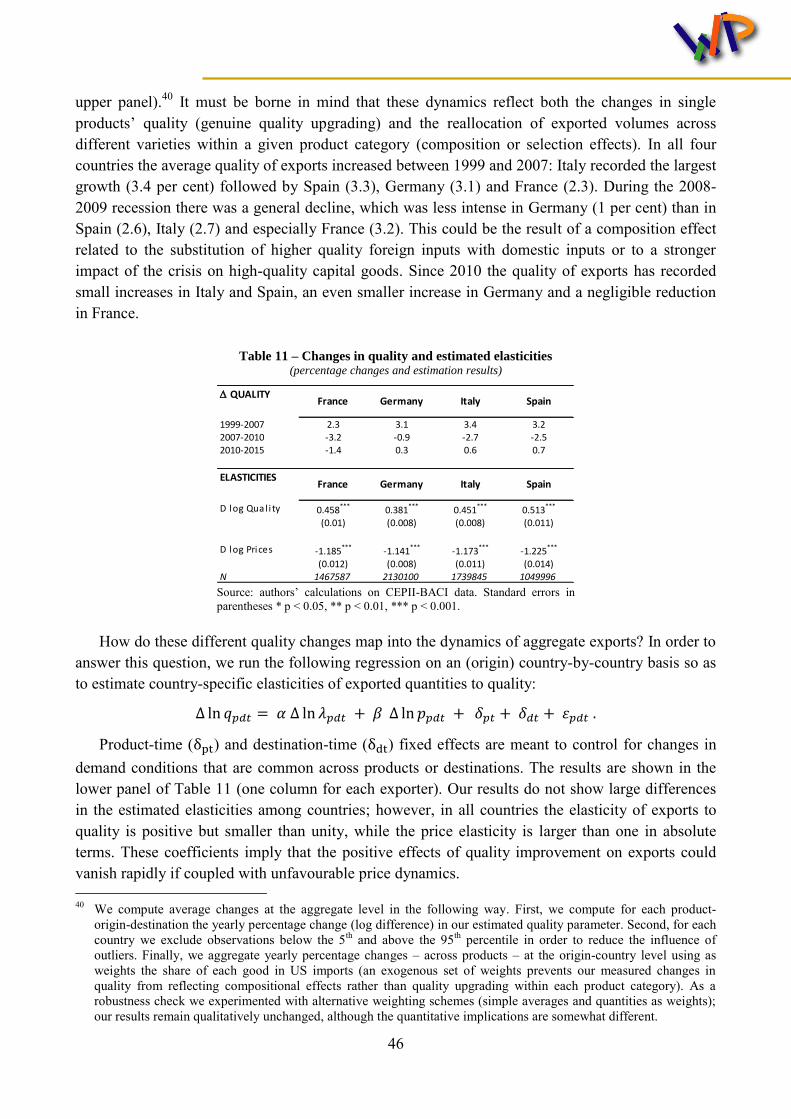
We find some evidence of quality upgrading of Italian exports, but the intensity of this process does not appear to be significantly more pronounced than that observed in the other main euro-area countries.
Finally, the evolution of domestic demand can particularly affect that of exports if firms are either capacity- or liquidity-constrained. A recent study based on firm-level survey data finds that for Italy the sign of this relationship changes over the cycle: a substitution, and therefore negative, relationship emerged before the 2008-2009 crisis when capacity constraints were generally binding in a context of increasing domestic demand, whereas domestic demand and exports became complements thereafter when liquidity and credit constraints kicked in.
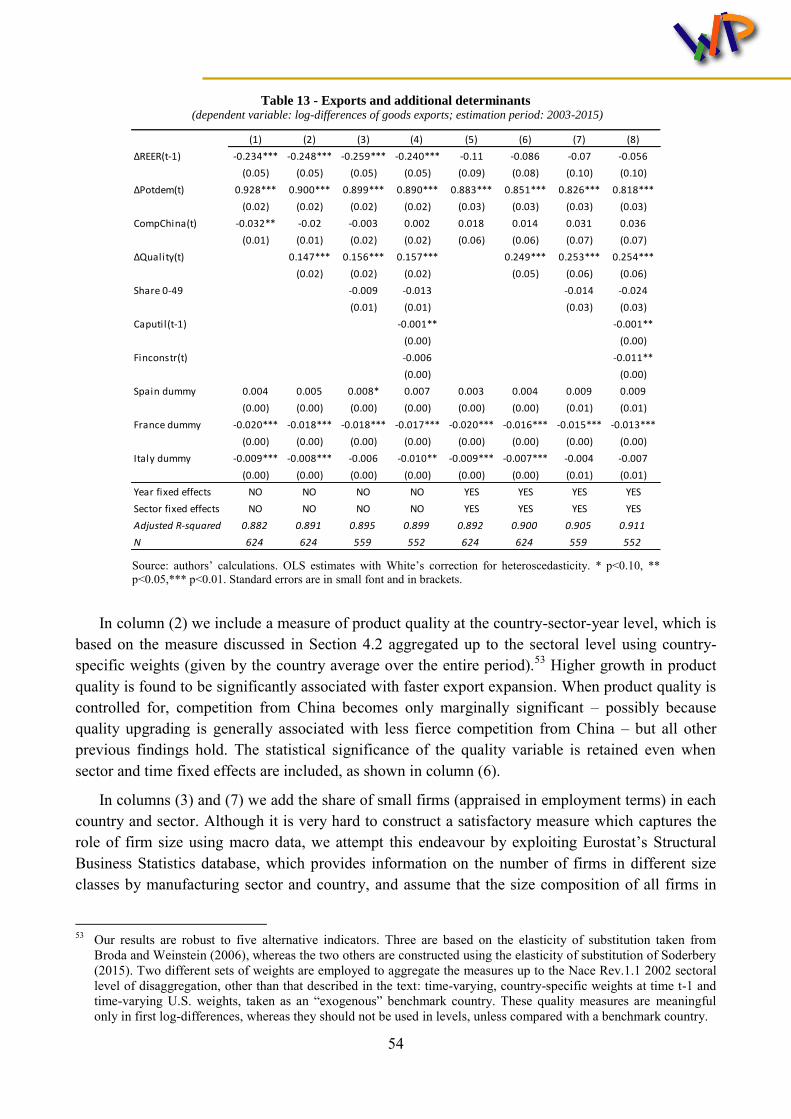
In Section 5 we provide a unified framework to evaluate the relative importance of all the aforementioned determinants, thus making an attempt at bridging the micro and the macro perspectives. We do this by running two sets of regressions. The first set is based on a country-sector panel referred to the four countries under study in the period 2003-2015. We find that, in addition to standard determinants (price competitiveness and demand stemming from destination markets), which have a varying degree of significance across the four economies, Chinese competition, size composition and changes in quality also affect goods export developments. Moreover, capacity utilization and financial constraints are found to be significantly linked to export dynamics. The second set of regressions uses detailed firm-level data on the universe of (only) Italian exporters for the period 2000-2014. While confirming that price competitiveness, foreign demand and the integration of China into world trade were all relevant for firm-level export dynamics in Italy, our regressions more starkly point to the fact that small exporters performed relatively worse. They were indeed less able to match the developments of external demand and at facing Chinese competitive pressures; their higher sensitivity to exchange rate movements can also explain their struggles prior to the global financial crisis.
The paper concludes with some implications of its main findings and several avenues for future research (Section 6).
Two caveats need to be mentioned at this stage. First, while in the paper we focus exclusively on goods, it is important to stress that Italy’s exports of services grew significantly less than in the other three countries throughout the 1999-2016 period (Tab. 1). Looking forward, this weakness may worsen Italy’s relative position on external markets, since trade in services is expanding rapidly worldwide, also in connection with ICT developments that have increased the tradability of many services.
8
The second issue concerns the extent to which gross export data actually reflect the ability of countries to compete on international markets. The diffusion of global value chains clearly weakens this conceptual link. Owing to the increasing internationalization of production processes, more refined indicators than gross exports, referring to the domestic value added embodied in a country’s foreign sales, need to be assessed in order to fully gauge a country’s international performance. Although we do provide an evaluation of external developments in terms of value added embodied in exports and discuss real effective exchange rates based on value-added weights, due to data limitations the results presented in the rest of paper are based on gross exports and might therefore be influenced by changes in the international fragmentation of production processes.
2. Goods exports since 1999: the facts
2.1 Aggregate developments
When comparing Italy’s exports with those of its main competitors, it is important to take into account a variety of methodological and statistical issues that may have a significant impact on the measurement of a country’s performance. Focusing on exports of goods, this section provides a detailed analysis of three issues in particular: a) export deflators, which may lead to a divergence between export values and volumes; b) merchanting (i.e. the purchase abroad and subsequent sale of a good to another foreign counterpart), which is unrelated to the production of goods for sales abroad despite being included in goods exports by national accounts; c) exports in value-added terms, which may differ from gross exports owing to the diffusion of global value chains.
Before moving to the details behind each of these issues, the main conclusions can be summarised as follows. First, exports at current prices are clearly preferable with respect to those at constant prices when conducting a cross-country comparison because of relevant methodological differences underlying the estimation of export deflators. Exports at current prices in Italy have grown significantly less than in Germany and Spain between 1999 and 2016, although the growth gap is considerably smaller than if measured at constant prices (by a third in the case of Germany, by about half in the case of Spain); they have instead expanded faster than in France, differently to what data in volumes would suggest. These general patterns broadly hold in each sub-period. Second, the impact of merchanting flows is generally negligible, with the exception of France, where they added about 0.5 percentage points to annual export growth between 2010 and 2016. Finally, considering exports in value-added instead of gross terms reduces Italy’s growth gap with respect to Germany (by 5 per cent since 1999) and especially Spain (by 20 per cent); in the latter case the differential would indeed vanish as of 2010, reflecting the increased use of intermediate inputs for export production in the Spanish economy. These figures should however be taken with great caution, given that up-to-date information on the input-output structure of the various economies (which is needed to quantify the value-added content of exports) is not readily available: our analysis on this point indeed ends in 2014.
9
…in volumes based on national accounts
Measured in volumes, Italy’s exports of goods fared significantly worse than those of Germany and Spain over the whole 1999-2016 period and in each of the three sub-periods (Tab. 1; Fig. 3a). Relative to France, Italy’s exports only mildly underperformed over the entire time span, and only due to their much sharper decrease during the “Great Trade Collapse”.
Since 2010 Italy’s relative position showed signs of improvement: the negative growth gap vis-
à-vis Germany decreased significantly when compared to the pre-crisis period (from 5.6 to 1 percentage point in absolute values), whereas vis-à-vis Spain it widened by only half a percentage point in absolute values (against 1 point for total exports of goods and services). In comparison with France, Italian goods exports grew at a modestly higher rate before the 2008-2009 crisis (+0.4 percentage points) and broadly in line thereafter.
Figure 3 – Goods exports (indices 1999=100)
a) constant prices
b) current prices
Source: Eurostat, National Accounts.
These developments are naturally mirrored by the evolution of export market shares, measured in this paragraph in a standard fashion as the share of goods exports on world imports, appraised at constant prices and exchange rates. Over the whole period Italy and France lost over a percentage point in absolute terms, against a negligible loss in Spain (whose share was, however, the lowest amongst the four countries) and a slight gain in Germany (Tab. 2, left hand-side panel). Italy’s loss was anyhow concentrated in the pre-2010 period, when it recorded a larger decline, both in absolute and in percentage terms, compared to its main competitors; thereafter it remained roughly stable, moving broadly in line with that of the other countries.
... at current prices based on national accounts
Italy’s relative performance on international markets is less gloomy if appraised at current prices: the overall development of goods exports appears significantly more favourable than that observed in France and the negative growth differential with respect to Germany narrows down considerably (Tab. 1; Fig. 3b); with respect to Spain, Italy’s gap instead slightly widens. The comparative assessment based on market shares also improves: between 1999 and 2016 the world
share of Italy’s exports evaluated at current prices fell by 1.2 percentage points in absolute terms (Tab. 2, right hand-side panel), only mildly more than the decline observed in Germany (0.7 points) and nearly one point less than that in France. Spain’s loss is confirmed to be negligible. Interestingly, whereas in Italy and Spain market shares computed either at constant or current prices exhibit comparable patterns between 1999 and 2016, in the case of Germany and France the former offers a significantly rosier picture than the latter over the overall period.
Table 2 – Goods exports market shares in world imports (percentage shares; percentage points in lower panel)
Source: authors’ calculations on Eurostat National Accounts and IMF-WEO data.
The evidence that Italy’s export patterns are somewhat less distant from those of the other euro-area partners if appraised at current, rather than at constant, prices points to higher relative dynamics of Italian export deflators. The extent to which this reflects a worrisome loss of competitiveness will be the focus of a dedicated paragraph in Section 3; however, it is important to remark at this stage that methodological issues related to deflators may significantly bias cross-country comparisons of real exports (see Box A).
Box A. Statistical issues related to the measurement of export deflators
The growth rate of exports in real terms, as published by national accounts (NA), relies on a correct measurement of export deflators, used to convert exports from current to constant prices. Methodological issues regarding the measurement of export deflators have had a significant impact on the growth rate of Italy’s export volumes in the recent past.
Deflators for Italian exports of goods were traditionally estimated by national accountants at the Italian statistical institute (Istat) using an approach based on “export unit values” (i.e. the ratio between export values and quantities, both taken from foreign trade statistics). According to various studies, this approach resulted in a very rapid growth rate of Italy’s export deflator compared to the other main euro-area countries, which was difficult to reconcile with economic explanations, thus suggesting a role for measurement error (Bugamelli, 2007; Brandolini et al., 2009). Following Eurostat’s recommendations and other countries’ statistical agencies, Istat started to collect export price data from industrial establishments, in the context of the surveys carried out for constructing producer price indices of goods sold on foreign markets (PPIX). Establishment-based price surveys are indeed known to be preferable to export unit value indices, being
considerably less subject to several sources of bias which typically affect the latter (Schott, 2004; Silver, 2007).1
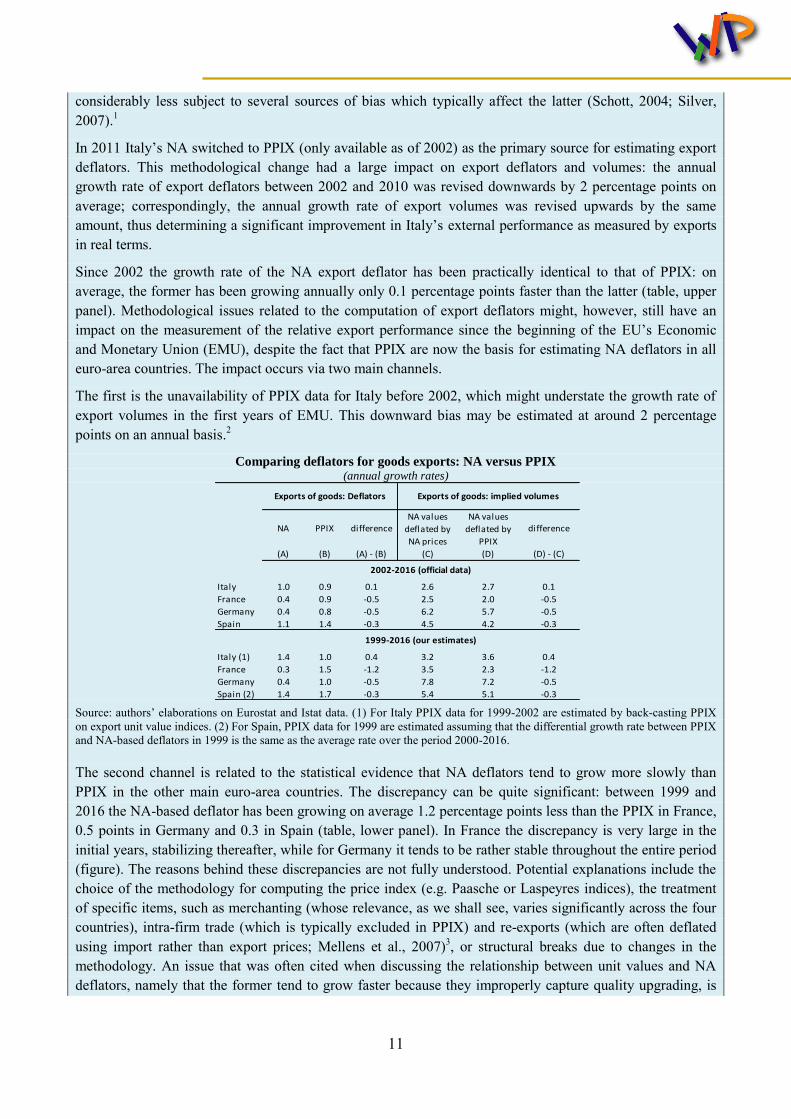
In 2011 Italy’s NA switched to PPIX (only available as of 2002) as the primary source for estimating export deflators. This methodological change had a large impact on export deflators and volumes: the annual growth rate of export deflators between 2002 and 2010 was revised downwards by 2 percentage points on average; correspondingly, the annual growth rate of export volumes was revised upwards by the same amount, thus determining a significant improvement in Italy’s external performance as measured by exports in real terms.
Since 2002 the growth rate of the NA export deflator has been practically identical to that of PPIX: on average, the former has been growing annually only 0.1 percentage points faster than the latter (table, upper panel). Methodological issues related to the computation of export deflators might, however, still have an impact on the measurement of the relative export performance since the beginning of the EU’s Economic and Monetary Union (EMU), despite the fact that PPIX are now the basis for estimating NA deflators in all euro-area countries. The impact occurs via two main channels.
The first is the unavailability of PPIX data for Italy before 2002, which might understate the growth rate of export volumes in the first years of EMU. This downward bias may be estimated at around 2 percentage points on an annual basis.2
Comparing deflators for goods exports: NA versus PPIX (annual growth rates)
Source: authors’ elaborations on Eurostat and Istat data. (1) For Italy PPIX data for 1999-2002 are estimated by back-casting PPIX on export unit value indices. (2) For Spain, PPIX data for 1999 are estimated assuming that the differential growth rate between PPIX and NA-based deflators in 1999 is the same as the average rate over the period 2000-2016. The second channel is related to the statistical evidence that NA deflators tend to grow more slowly than PPIX in the other main euro-area countries. The discrepancy can be quite significant: between 1999 and 2016 the NA-based deflator has been growing on average 1.2 percentage points less than the PPIX in France, 0.5 points in Germany and 0.3 in Spain (table, lower panel). In France the discrepancy is very large in the initial years, stabilizing thereafter, while for Germany it tends to be rather stable throughout the entire period (figure). The reasons behind these discrepancies are not fully understood. Potential explanations include the choice of the methodology for computing the price index (e.g. Paasche or Laspeyres indices), the treatment of specific items, such as merchanting (whose relevance, as we shall see, varies significantly across the four countries), intra-firm trade (which is typically excluded in PPIX) and re-exports (which are often deflated using import rather than export prices; Mellens et al., 2007)3, or structural breaks due to changes in the methodology. An issue that was often cited when discussing the relationship between unit values and NA deflators, namely that the former tend to grow faster because they improperly capture quality upgrading, is
NA PPIX differenceNA values
deflated by
NA prices
NA values
deflated by
PPIX
difference
(A) (B) (A) - (B) (C) (D) (D) - (C)
Italy 1.0 0.9 0.1 2.6 2.7 0.1
France 0.4 0.9 -0.5 2.5 2.0 -0.5
Germany 0.4 0.8 -0.5 6.2 5.7 -0.5
Spain 1.1 1.4 -0.3 4.5 4.2 -0.3
Italy (1) 1.4 1.0 0.4 3.2 3.6 0.4
France 0.3 1.5 -1.2 3.5 2.3 -1.2
Germany 0.4 1.0 -0.5 7.8 7.2 -0.5
Spain (2) 1.4 1.7 -0.3 5.4 5.1 -0.3
2002-2016 (official data)
Exports of goods: Deflators Exports of goods: implied volumes
1999-2016 (our estimates)
12
likely to be much less relevant for PPIX (which are actual price indices that track over time the price of a given bundle of goods), except when the rate of product innovation is very fast.
To what extent do these methodological issues regarding export deflators matter for the cross-country comparison of export performance in volumes, described in Section 2.1? If exports were deflated using PPIX instead of NA prices, Italy’s relative export performance would noticeably improve, although it would still remain overall less favourable compared to that of Germany and Spain. The annual growth rate of Italian exports between 1999 and 2016 would indeed rise from 3.2 to 3.6 per cent in real terms (table, lower panel), overtaking that of French exports and narrowing the gap with respect to that of German and Spanish exports, by about 20 and 30 per cent, respectively.
Difference between PPIX and NA deflators of goods exports (indices 1999=100)
Source: authors’ calculations on Eurostat and Istat data. Observations for Italy (1999-2001) and Spain (2000) that were missing in official data have been estimated as reported in the notes to the Table. In conclusion, methodological issues regarding export deflators may significantly understate Italy’s relative export performance in volume terms, especially in the early years of the period we consider. Specifically, they can explain between 20 and 30 percent of the slower growth of Italy’ exports at constant prices compared to that of Germany and Spain since 1999. This is the main reason why our preferred measure of exports in a cross-country comparison is that at current values.
(1) For instance, unit value indices vary owing to changes in prices, but also to changes in the mix of goods exported. Biases in unit value indices are also due to the poor quality of recorded data on quantities. (2) This figure is obtained by regressing PPIX on export unit values (monthly data) for the post-2002 years and then applying the coefficient to the pre-2002 years to obtain an estimate of PPIX for the latter period. (3) Re-exports, which are usually defined as exports of goods that have been imported and leave the country after no or negligible further processing, are especially relevant for Germany: according to the input-output tables released by Destatis, they accounted for 15 per cent of total exports of goods and services in 2012, the latest year available.
... netting out merchanting flows
According to the most recent international statistical standards (SNA08), exports of goods in national accounts include net merchanting flows. Merchanting occurs when a resident buys goods from a non-resident and sells them to another non-resident without such goods ever entering the economic territory of the resident. The net profit resulting from these two transactions is recorded as a positive export flow of the resident’s country. Although the inclusion in the goods’ component is justified by the strict application of the “change in economic ownership” principle, merchanting
13
tends to reflect trading and arbitrage activities that may be unrelated to the determinants of exports actually produced in a given economy.
The heterogeneous relevance of this activity across the four euro-area countries may blur to some extent the comparative assessment of exports. While negligible for Italy and Spain (less than 0.5 per cent of goods exports in 2016), merchanting flows are relevant for Germany and, especially, France (1.8 and 4.9 per cent, respectively). In the latter country they have grown in particular since 2010, doubling their share on goods exports and significantly contributing to the country’s performance on external markets: net of merchanting, the average annual growth rate of French exports at current prices would have been 0.5 percentage points lower between 2010 and 2016.3 No significant impact is instead observed in the other countries. This result suggests that Italy’s performance with respect to France is even more favourable if assessed net of merchanting flows.
… and in value added terms
The overall diffusion of global value chains in the period under study has reduced the informative content of standard indicators based on gross exports in assessing the contribution of external demand to GDP dynamics. The availability of global input-output tables such as the World Input Output Database (WIOD) and the OECD Trade in Value Added Database (TiVA) has opened up the analysis of trade in value added as an alternative to that in gross terms (see, for instance, Koopman et al., 2014, Johnson and Noguera, 2017, Timmer et al., 2015, Cappariello and Felettigh, 2015, Felettigh and Oddo, 2016, Borin and Mancini, 2015).
As production is increasingly organized in several stages over many countries, the gross value of exports recorded by trade statistics includes a significant amount of imported inputs (the “import content of exports”) and is thus much higher than the value added generated in the exporting country. The developments of a country’s exports may thus overestimate its ability at activating domestic value added. However, sourcing cheaper or higher-quality intermediates from abroad can be a means for exporters to improve their competitiveness (amongst many studies, see for example Markusen, 1989; Grossman and Helpman, 1991; Bas and Strauss-Kahn, 2014). This implies that, while a given increase in exports has a different impact on domestic activity depending on the import content of exports, it could have been smaller had exporters not been as competitive via sourcing of intermediate inputs from abroad.
To assess the extent to which global value chains influence the export patterns of the main euro-area countries, we rely on the latest release of WIOD (Timmer and al., 2016), which covers 43 countries over the period 2000-2014. Following Koopman et al. (2014), we decompose gross exports into three main components: domestic value added, foreign value added and a residual double-counting term. The first component reflects the use of domestic inputs in the production of exports and thus captures the contribution of gross exports to GDP (“GDP in exports” or GDPX).4 This is, in principle, what one should examine when assessing a country’s external performance. The second component reflects the use of foreign inputs in the production of exports. The third 3 According to Banque de France (2015; 2017), merchanting flows in France reflect global manufacturing processes
in automobile, aerospace and food and beverage companies and, yet to a lower extent, transactions in commodities carried out by specialized trading companies or major corporations.
4 The concept is akin to the contribution of net exports to GDP growth, though the latter considers the import content of exports together with that of domestic demand.
14
refers to intermediate goods that cross the national border back and forth as they are processed in subsequent stages of production and thus are recorded multiple times in both aggregate and bilateral trade statistics. The ratio between the first component and gross exports is an indicator of “GDPX-intensity”, since it represents the amount of GDP that is embodied in one unit (one euro-worth) of exports.
Table 3 compares the annual growth rate of goods exports at current prices and in gross terms, derived from national accounts, in the upper panel and that of our estimates of GDPX, in the lower panel. At least three facts stand out.
First, over the entire period in each country the average annual growth rate of GDPX is lower than that of gross exports (for Italy, 2.8 against 3.8 percent, respectively). This reflects the declining trend in GDPX-intensity which was experienced by the vast majority of countries in the world, mirroring the growing international fragmentation of production: for instance, GDPX-intensity in Italy fell from 0.78 to 0.71 between 2000 and 2014.
Table 3 – Growth rate of gross exports and domestic value added embodied in exports (1) (average yearly percentage changes; exports of goods at current prices)
Source: authors’ calculations on Eurostat and WIOD (2016 release) data. (1) Gross exports of goods are from national accounts. Domestic value added embodied in exports is computed by multiplying gross exports of goods by the GPDX-intensity for exports of goods (estimated from WIOD).
Second, when measured with GDPX rather than gross exports, Italy’s position relative to its main euro-area competitors since 2000 improves, although the overall picture in terms of country ranking remains unchanged. The average growth rate of Italy’s GDPX continues to be below that of Spain and, especially, of Germany, while remaining above the rate observed in France. Italy’s underperformance with respect to Spain and Germany, however, shrinks (by 20 and 5 per cent, respectively).5
Third, the impact of using GDPX for the assessment of export performance across countries is not constant over time but fluctuates reflecting changes in the GDPX-intensity of each economy. For instance, considering GDPX instead of gross exports significantly worsens the amplitude of Italy’s negative growth gap with respect to Spain before 2007, but has a sharply opposite effect thereafter, especially in the post-crisis period: whereas between 2010 and 2014 the growth rate of Italy’s gross exports was on average 1.7 percentage points lower than that of Spain, in terms of GDPX Italy’s performance was actually marginally more dynamic. This reflects a larger decline in 5 Felettigh and Oddo (2016) find that market shares based on gross exports are generally consistent with market
shares based on value added, especially for advanced economies, although the export performance of Germany relative to France and Italy is less outstanding in value-added terms. Differences with the results provided in this paper reflect the different period under consideration and the use of a previous vintage of WIOD data.
Italy France Germany Spain
2000-2007 5.8 3.5 9.3 7.1
2007-2010 -2.6 -1.2 -0.3 0.1
2010-2014 4.6 3.6 5.3 6.3
2000-2014 3.8 2.6 7.0 6.2
2000-2007 4.7 2.7 7.9 7.2
2007-2010 -3.9 -2.1 -0.7 -2.0
2010-2014 4.5 3.0 4.9 4.4
2000-2014 2.8 1.8 5.8 4.7
Gross exports (GX)
Domestic value added embodied in exports (GDPX)
15
the GDPX intensity of Spanish exports, which was particularly intense in specific sectors (such as transport equipment and basic metals).
While these results might reflect structural changes in the international fragmentation of production, they should however be interpreted with great caution. International input-output tables are typically based on several assumptions regarding the input-output structure of the economy. These issues are even more relevant for the latest release of WIOD, given that the switch to the SNA08 statistical standards has sharply reduced the number of years for which benchmark supply and use tables – necessary for a complete portrait of the inter-industry deliveries of goods and services – are available for each country. In particular, data for the most recent years might be revised in the future, as updated benchmark tables become available in the various countries.
Coming to the flip side of the coin, there is only indirect evidence that sourcing of intermediates from abroad has helped exports. For instance, large exporters and especially multinational enterprises tend both to outperform smaller firms and to resort more intensively to imported intermediates (see for example Istat, 2017). Looking at manufacturing exports of the four euro-area countries under study, Felettigh and Oddo (2016) find that the sectors whose exports grew faster than the national average in the last fifteen years were also the sectors whose GDPX-intensity fell the most, which tends to signal that their involvement in global value chains was more dynamic than the average.
Has Italy been able to reap the benefits of international production networks, in terms of cost-effectiveness, at a par with its main competitors? While the declining trend in GDPX-intensity is quite similar across the countries under examination, Italy stands out for displaying the highest value, at all points in time. While this might indicate that there is scope for further participation in global supply chains by Italian exporters,6 a more thorough, sector-specific analysis is warranted, specifically focused on backward linkages, namely on integration with the downstream stages of production.
Given the scarcity of available information on “domestic value added in exports”, we do not pursue further along these lines. In the remainder of this section we shall focus on IMTS at current prices, since they are the only source offering an extensive set of detailed information on sectors, destination markets and exporting firms and they provide a quantitative assessment which is largely consistent with the picture portrayed by national accounts data at current prices.
2.2 Destination markets
The geographical perspective is the first dimension we address in our dissection of the relative performance of Italy’s exports of goods against that of its main euro-area competitors.
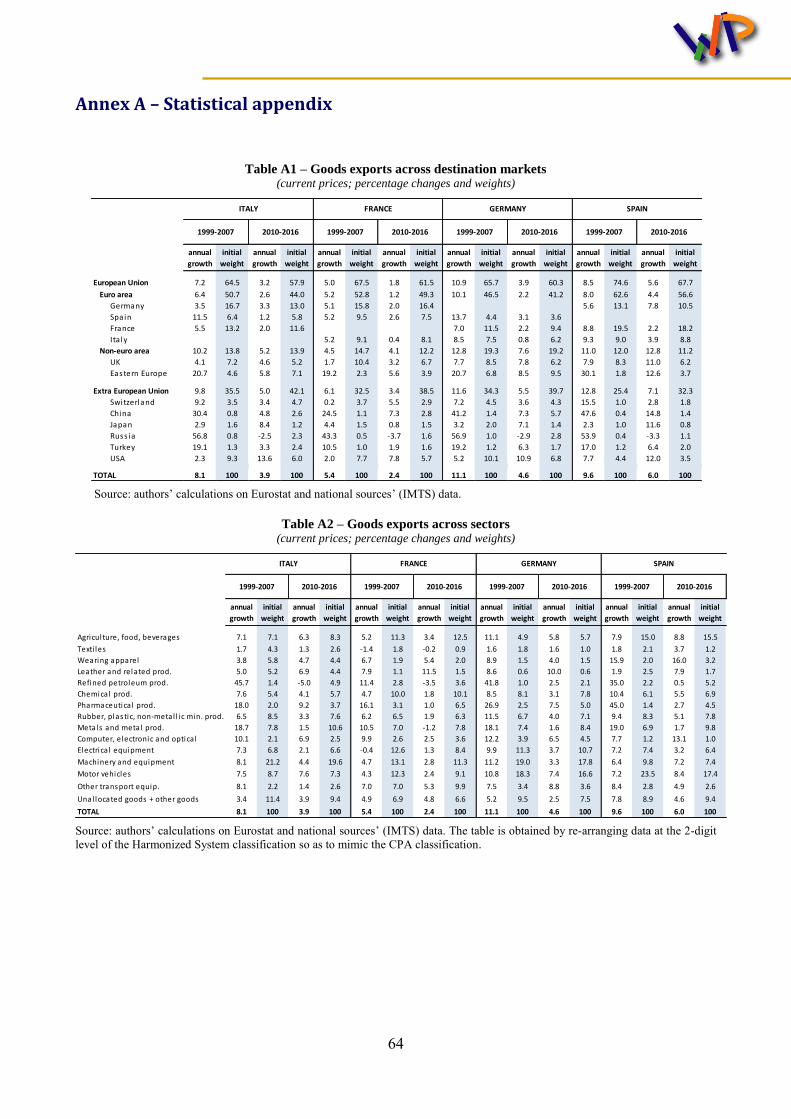
The weight of trade with EU partners on overall trade is predominant for all four countries, despite a decrease over time (Table A1 in Annex A). It is the lowest for Italy and Germany, slightly higher for France and much larger for Spain (almost 75 per cent in 1999, 68 in 2010). Within Europe, most of the trade occurs with members of the euro area; their incidence, although set on a 6 Other indicators, measuring the international fragmentation of production or the degree to which exports are related
to global value chains (GVC-related trade; see, for example, Aiello et al., 2015 and Borin and Mancini, 2017), confirm that Italy is less integrated into global value chains than Germany.
16
decreasing trend for all four countries, is higher for Spain and France than for Italy and, especially, Germany.
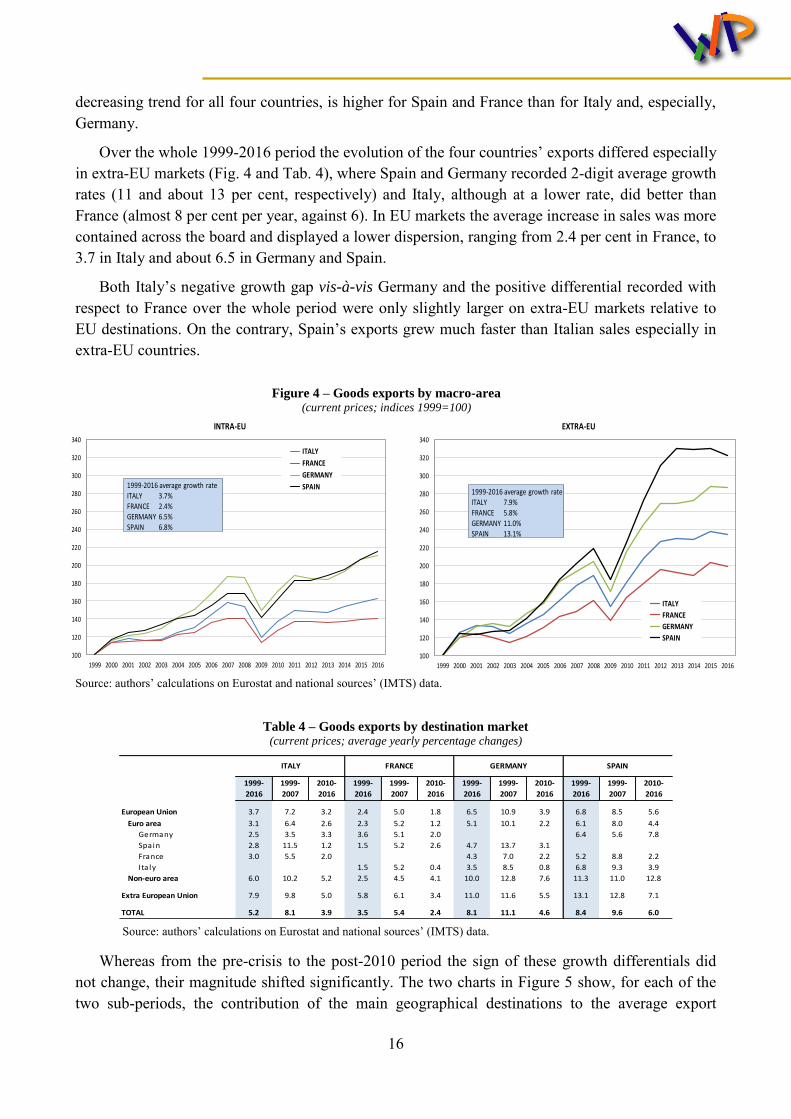
Over the whole 1999-2016 period the evolution of the four countries’ exports differed especially in extra-EU markets (Fig. 4 and Tab. 4), where Spain and Germany recorded 2-digit average growth rates (11 and about 13 per cent, respectively) and Italy, although at a lower rate, did better than France (almost 8 per cent per year, against 6). In EU markets the average increase in sales was more contained across the board and displayed a lower dispersion, ranging from 2.4 per cent in France, to 3.7 in Italy and about 6.5 in Germany and Spain.
Both Italy’s negative growth gap vis-à-vis Germany and the positive differential recorded with respect to France over the whole period were only slightly larger on extra-EU markets relative to EU destinations. On the contrary, Spain’s exports grew much faster than Italian sales especially in extra-EU countries.
Figure 4 – Goods exports by macro-area (current prices; indices 1999=100)
Source: authors’ calculations on Eurostat and national sources’ (IMTS) data.
Table 4 – Goods exports by destination market (current prices; average yearly percentage changes)
Source: authors’ calculations on Eurostat and national sources’ (IMTS) data.
Whereas from the pre-crisis to the post-2010 period the sign of these growth differentials did not change, their magnitude shifted significantly. The two charts in Figure 5 show, for each of the two sub-periods, the contribution of the main geographical destinations to the average export
growth gap between Italy and the other three countries (hence taking into account the weights, and their variation over time, that destination markets have for each country’s exports).
The large negative differential recorded between 1999 and 2007 relative to Germany was generated almost entirely within the European Union and in particular in euro-area markets. Extra-EU destinations accounted for only half a percentage point of the average export growth differential, due in particular to more sluggish sales to the US and to China. Conversely, in comparison with Spain, Italy’s negative growth gap originated solely from intra-euro area trade, due to the very low incidence of extra-EU destinations on total Spanish exports in this period. Relative to French exporters, Italian exporting firms proved to be more successful across all destination markets.
Figure 5 – Contribution of destination markets to the annual export growth differential
between Italy and the other main euro-area countries (percentage points)
a) 1999-2007
b) 2010-2016
Source: authors’ calculations on Eurostat and national sources’ (IMTS) data. Percentage contributions to the annual export growth differential between Italy and the other main euro-area countries. (1) “other 3” is the difference between the contribution to the growth rate of Italian exports of sales in the remaining three countries on the one hand, and the contribution to the growth rate of country j’s exports (j representing France, Germany or Spain) of sales in the remaining three countries on the other hand.
Turning to the post-2010 period, the observed narrowing of the gap with respect to Germany was largely due to the relative performance in euro-area markets: the growth differential of exports to the euro-area switched from moderately negative to slightly positive (the average annual growth rate became broadly the same in the two countries, after controlling for bilateral flows; Tab. 4).7 Indeed, German exports within the euro area slowed down more intensely (from 10.1 to 2.2 per cent on average) than Italian sales (from 6.4 to 2.6 per cent). However, Germany continued to out-perform Italy in its sales to Central and Eastern Europe, presumably reflecting the strong trade linkages and supply chains in this region (Muir and Elekdag, 2013). A significant contribution to the reduction of the growth differential also came from extra-EU destinations, where the negative gap observed before 2007 practically evaporated in the recent six-year period, mostly owing to the marked recovery of trade between Italy and the US.
7 In the first sub-period the contribution of Germany to the growth of Italian exports was the same as the contribution
of Italy to the growth of German exports (0.6 percentage points per annum). This is shown in Fig. 5 (left hand-side panel) by the green bar “of which: other 3” being very close to nil. In the second sub-period, the relative weakness of economic activity in Italy resulted in a positive contribution of Germany to the growth of Italian exports (0.4 percentage points per annum), while the contribution of Italy to the growth of German exports evaporated.
The deepening of the overall negative growth gap vis-à-vis Spain after 2010 continued to be mainly driven by intra-euro area trade, although the growth differential also turned negative for exports to both non-euro area EU countries and extra-EU countries. In particular, as regards the former, Spanish sales to Central and Eastern Europe grew on average at a rate more than double that of Italy (Table A1 in Annex A); concerning the latter, although in both sub-periods Spanish exports to extra-EU partners grew faster than the corresponding Italian exports by 2 to 3 per cent per year on average (Tab. 4), the weight of such destinations on overall sales for Spain only became relevant in 2010-2016, to the extent that only then these exports significantly contributed to Italy’s negative growth gap.
The slight reduction of Italy’s over-performance relative to France in the post-2010 period concerned both EU and non-EU markets, with Italian exports slowing down more than French ones. Outside the EU, Italian exports to the US grew faster than those of France (in the previous period the opposite held true), whereas destinations such as Switzerland, China and Russia contributed to the narrowing of the positive growth gap.
The geographical dimension can also be exploited to better understand the protracted loss of Italy’s export market share on world imports in the pre-crisis period and its resilience after 2010.
The worsening of the overall share at current prices – which by construction is a weighted average of the share on each individual market – between 1999 and 2007 was almost entirely a “within-euro area” phenomenon (Fig. 6a) and, in particular, was driven by the large loss recorded by Italian exporters in the German and French markets (explaining respectively 40 and 25 per cent of the decline of the overall share in the period, also given their large weight in Italy’s trading basket). The loss of competitive positions in extra-EU markets was significantly more contained. Conversely, the substantial stability of the market share after 2010 derived from the resilience in both extra-EU markets, which increased their weight on world imports, and within the EU (Fig. 6b), driven by non-euro area markets. Outside Europe, the increase in the penetration in the US market was sizeable.
Figure 6 – Italy’s export market shares by geographical area (1) (percentage shares)
a) 1999-2007
b) 2010-2016
Source: authors’ calculations on Istat (IMTS) data, Eurostat National Accounts data and IMF-WEO data. (1) Share of Italian goods’ exports on total goods’ imports (at current prices) by reference area (excluding Italy, when applicable).
0
1
2
3
4
5
6
7
8
9
10
11
12
13
14
15
0
5
10
15
20
25
30
35
40
45
50
55
60
65
70
75
EU Euro area Germany France Spain Rest ofeuro area
EU non-euro area
Extra EU US China
country share on world imports, 1999 country share on world imports, 2007Italian share in country imports, 1999 (rhs) Italian share in country imports, 2007 (rhs)
0
1
2
3
4
5
6
7
8
9
10
11
12
13
14
15
0
5
10
15
20
25
30
35
40
45
50
55
60
65
70
75
EU Euro area Germany France Spain Rest ofeuro area
EU non-euro area
Extra EU US China
country share on world imports, 2010 country share on world imports, 2016
Italian share in country imports, 2010 (rhs) Italian share in country imports, 2016 (rhs)
19
2.3 Sectors
Over the whole 1999-2016 period Italy’s exports recorded lower average growth rates than Germany and Spain in all main sectors (Tab. 5). The opposite holds true with respect to France, with the exception of few specific industries (wearing apparel, leather products and other transport equipment), where however France’s advantage was substantial. These long-run developments suggest that the factors driving Italy’s relative performance are not specific to certain sectors, but must be related to horizontal macro or structural features that are pervasive across sectors.
Table 5 – Goods exports across sectors (current prices; average yearly percentage changes)
Source: authors’ calculations on Eurostat and national sources’ (IMTS) data. The table is obtained by re-arranging data at the 2-digit level of the HS classification so as to mimic the CPA classification.
These considerations notwithstanding, the sectoral dimension offers some interesting insights into the changes that occurred in the behaviour of Italian exports from the 1999-2007 to the post-2010 period, in particular in comparison with Germany and Spain.
Between 1999 and 2007 Italian exports grew more slowly than Germany’s in almost all main sectors; given the respective sectoral composition of trade, the largest contribution to the overall negative growth gap stemmed from sales of electrical equipment and, in particular, of motor vehicles (Fig. 7a), which in Germany recorded a solid expansion (10.8 per cent per year).8 The motor vehicles sector also explains a large part of the negative growth gap in the same period with respect to Spain, followed by the agriculture and food sector; these negative differentials were partly compensated by the marked over-performance of Italian exports in machinery and equipment. In comparison with France, Italy performed better in all sectors, except for wearing apparel and leather.
8 Exports of motor vehicles account for almost 20 per cent of total German exports, against less than 10 per cent in
Figure 7 – The contribution of sectors to the annual export growth differential
between Italy and the other main euro-area countries (percentage points)
a) 1999-2007
b) 2010-2016
Source: authors’ calculations on Eurostat and national sources’ (IMTS) data. Data at the 2-digit level of the Harmonized System classification have been re-arranged so as to mimic the CPA classification. Data for France in 1999 are estimated. (1) For France this category includes goods that are not allocated to any other sector.
In the post-crisis recovery period the cross-sector comparison between Italy and Germany appears more balanced: average growth rates were higher in Italy in a number of key sectors, such as pharmaceutical9 and chemical products, machinery, electronics, wearing apparel, food and beverages and even motor vehicles, although only slightly (Table A2 in Annex A). In comparison with the pre-crisis period, the main industry behind the narrowing of the overall negative growth gap vis-à-vis Germany was machinery and equipment (Fig. 7b); a boost also came from the significant lessening of Italy’s under-performance in motor vehicles and electrical equipment, pharmaceutical, chemical and plastic products. Agricultural and food products, which were a drag in the first sub-period, exerted a boost in the second phase. In sum, the relative improvement with respect to Germany was rather widespread across sectors; net of motor vehicles and other transport equipment, Italian exports grew almost at a par with Germany.
After 2010 exports continued to grow faster in Spain than in Italy in all main sectors, with the exception of pharmaceutical products.10 The negative growth gap widened, mostly due to the reduction of Italy’s advantage in machinery and to the larger negative differential in refined oil products, wearing apparel and food.
The relative performance of Italian exports with respect to France continued to be positive in almost all main industries also in the post-2010 period. The slight reduction of the positive differential derived mainly from exports of other transport vehicles, which includes aeronautics,11 and from a narrowing of Italy’s advantage in the machinery, electrical equipment and metal sectors.
9 The significant growth of Italy’s pharmaceutical exports is also the result of manufacturing activities on behalf of a
foreign principal. Bracci, Fabiani and Felettigh (2015) estimate that such activities accounted for about 15 per cent of export flows in the 2010-14 period; for pharmaceutical products WIOD data show a stronger decline in the domestic-value-added content in Italy than in the other three countries.
10 The largest contributors to the overall negative growth gap were indeed the sectors whose exports increased the fastest in Spain relative to Italy (wearing apparel and refined petroleum products) and those in which Spanish exports are specialized (motor vehicles and the agricultural and food sector, that together accounted for almost one third of total exports in 2010, a much higher weight than in Italy).
11 Exports in the aeronautical sector, which are mainly driven by Airbus, accounted for 6 per cent of French exports in
All in all, whereas until 2007 the relative under- or over-performance of Italy on international markets was rather widespread across industries, the developments in the recent six years were more heterogeneous. In particular, the positive dynamics recorded by the exports of some specific sectors (machinery, motor vehicles, pharmaceutical and food products) contributed in reducing the growth gap with respect to Germany, while traditional productions only played a marginal role.
2.4 Firms
The last dimension we here examine is firm heterogeneity. Taking advantage of the data published in the ICE-Istat annual reports, we analyse the structure and the evolution of Italian exporters by size class over the 1999-2015 period (data for 2016 are currently not available). We also exploit the firm-level database on the universe of Italian exporters made available by Istat for a slightly shorter time span (2000-2014) to extract information on the relative importance of the intensive and the extensive margins in the pattern of aggregate exports. For a comparative analysis we resort to Eurostat’s Trade by Enterprise Characteristics (TEC). All sources only report flows at current prices.
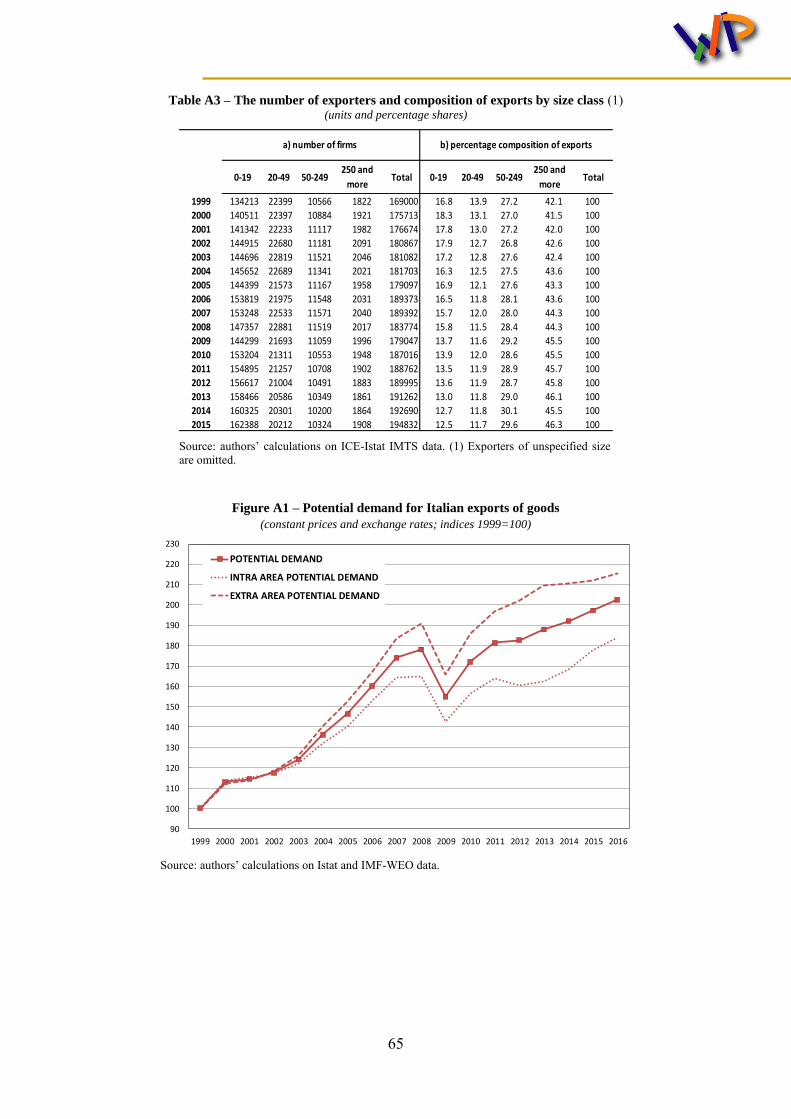
According to ICE-Istat data, in 2015 Italian firms exporting goods were almost 195,000.12 This number has systematically increased over time since 1999, with the sole exception of the “Great Trade Collapse” period: indeed, it rose from nearly 170,000 in 1999 to just under 190,000 in 2007, then decreased by about 10,500 units in 2008-2009 and sharply recovered thereafter (Tab. A3a in Annex A). In 2015 more than 80 per cent of exporting firms had less than 20 employees; including also firms with 20-49 workers, this share reached almost 94 per cent. Larger firms (with more than 250 employees) were about 2,000, just 1 per cent of the total.
The relatively few large Italian firms account for 41-46 per cent of total exports, around 30 per cent is accounted for by medium-sized firms (50-249 employees) and the rest is divided in almost equal parts between the numerous micro-enterprises and firms in the 20-49 class (Tab. A3b in Annex A).
The distribution of goods exports by firm size is skewed to the right (the “happy few” stylized fact advocated by Mayer and Ottaviano, 2011), but less than that of the other main euro-area countries. While in all four countries the largest share of total exports is accounted for by firms with more than 250 employees (according to the TEC database, where the most recent full set of data for the four countries analysed herein refer to 2014), Italy stands out for a relatively larger contribution of medium-sized exporters, coupled with a sizable population of small – especially micro – firms characterized by relatively low average exports.13 The share of exports by the top exporters is the lowest in Italy in comparison with the other countries, Germany in particular, thereby pointing to a lower concentration of exports in Italy: the top 10 exporters explain 8 per cent of total exports in Italy against 25 per cent in Germany; the top 1000 exporters generate almost 50 per cent of Italian
2000 and more than 10 per cent in 2016. According to Bas et al. (2015) aeronautics ranks among the top sectors in France in terms of non-price competitiveness.
12 The count includes firms whose economic activity is in the services sector, as long as they export goods, such as retail and wholesale traders.
13 With a focus on productivity, rather than exports, De Nardis (2014) shows that net of micro-enterprises the productivity of Italian firms is only just below that of their German competitors.
22
exports against nearly 60 in Germany.14 The corresponding figures for sales outside the EU are just above 50 per cent for Italy, 70 per cent for Germany; concentration tends to be higher in more distant extra-EU destinations, where the comparative advantage of larger firms becomes stronger.
Larger firms also tend to serve a higher number of markets. According to TEC data, 75 per cent of German exports in 2014 originated from enterprises serving at least 20 destination countries. The share was similar to that of France (73 per cent), smaller for Italy (67 per cent) and even smaller for Spain (61 per cent).
Larger exporters also tend to be more involved in global production schemes, so that they are also active on the import side. The relevance of these “two-way traders” is especially large for Germany, covering 71 per cent of total merchandise exports in 2014. The corresponding weight in the remaining three countries is significantly smaller, between 48 per cent (for France) and 55 per cent (for Italy).
How did the Italian exporting firms’ characteristics evolve over time15 and what were their effects on aggregate export dynamics?
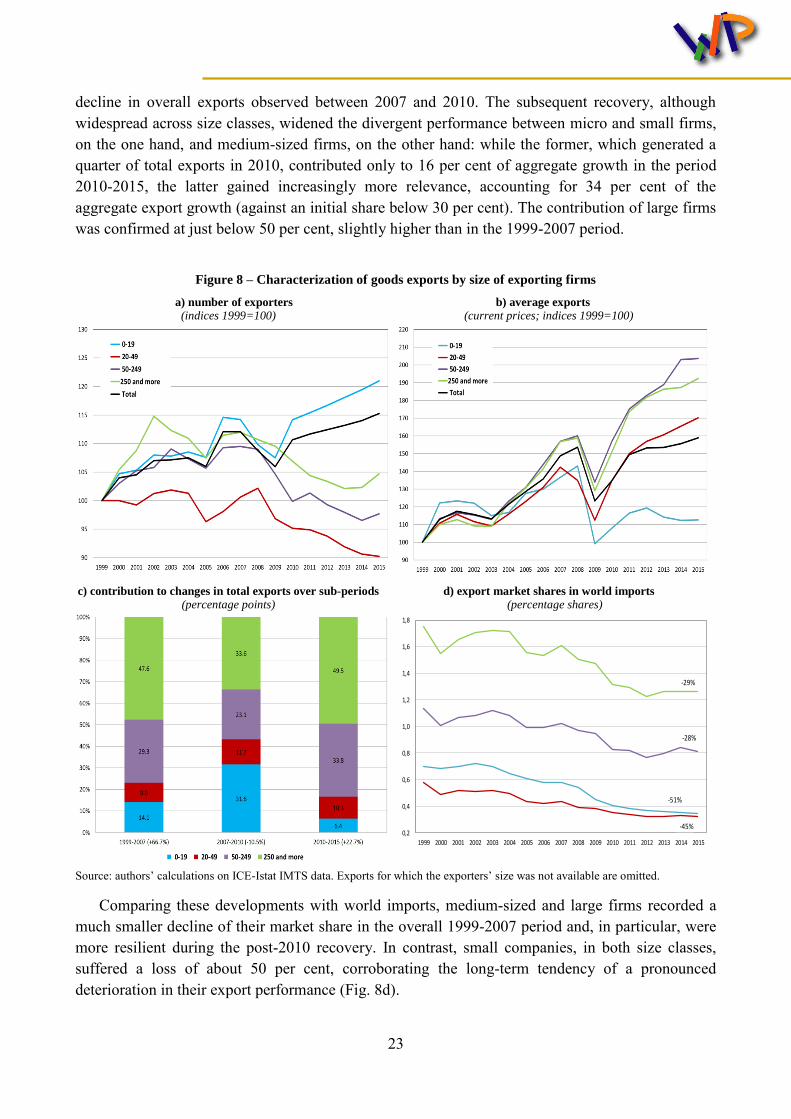
The evolution of the total number of exporters reflects different developments across size classes.16 In particular, Figure 8a depicts two opposite long-run trends characterizing small firms: the first is a marked and persistent increase in the number of micro enterprises (0-19), with the exception of a temporary reduction during the 2008-2009 crisis; the second is a fall in the number of firms in the 20-49 class, which became particularly intense after 2008. As for the number of both medium-sized and large firms, a rising trend may be observed until 2007 and a decline thereafter (which came to a halt in 2015).
Between 1999 and 2007 the value of average exports per firm increased at similar rates for all size classes, yet slightly lower for micro and small firms (Fig. 8b). The effects of the global financial crisis, which hit firms across the board, were particularly severe for the enterprises in the 0-19 category. The subsequent recovery was widely heterogeneous across size classes: very weak for micro-enterprises, faster for small firms, significantly stronger for large and medium-sized exporters.
As a result of the patterns described above, the contribution of individual size classes to the dynamics of total exports changed significantly over time and in particular across sub-periods (Fig. 8c). Before the crisis, the contribution from the two smallest categories accounted for less than one quarter of overall export growth, although their share in Italy’s total exports was above 30 per cent in 1999; the contribution was relatively larger for the micro-enterprises especially in the years immediately after the introduction of the euro, which likely offered these firms better prospects in terms of currency stability. On the other hand, large companies, whose share in total exports was slightly above 42 per cent in 1999, accounted for almost half of the cumulated increase in exports until 2007. While affecting all firms, the international crisis weighed more heavily on those with less than 50 employees, whose negative performance explained almost half of the 10 per cent
14 Evidence stemming from CompNet (an ESCB-based research network) data for firms with more than 20 employees
confirms these results for a wider, yet different set of countries (among others, see Berthou et al., 2015). 15 A dynamic cross-country comparison is not meaningful since TEC data only cover a very short time span. 16 The time series employed here presents a structural break since the criteria for compiling the Italian registry of
active firms were recently revised and data on exporting firms were only updated as of 2011.
23
decline in overall exports observed between 2007 and 2010. The subsequent recovery, although widespread across size classes, widened the divergent performance between micro and small firms, on the one hand, and medium-sized firms, on the other hand: while the former, which generated a quarter of total exports in 2010, contributed only to 16 per cent of aggregate growth in the period 2010-2015, the latter gained increasingly more relevance, accounting for 34 per cent of the aggregate export growth (against an initial share below 30 per cent). The contribution of large firms was confirmed at just below 50 per cent, slightly higher than in the 1999-2007 period.
Figure 8 – Characterization of goods exports by size of exporting firms
a) number of exporters
(indices 1999=100)
b) average exports
(current prices; indices 1999=100)
c) contribution to changes in total exports over sub-periods
(percentage points)
d) export market shares in world imports
(percentage shares)
Source: authors’ calculations on ICE-Istat IMTS data. Exports for which the exporters’ size was not available are omitted.
Comparing these developments with world imports, medium-sized and large firms recorded a much smaller decline of their market share in the overall 1999-2007 period and, in particular, were more resilient during the post-2010 recovery. In contrast, small companies, in both size classes, suffered a loss of about 50 per cent, corroborating the long-term tendency of a pronounced deterioration in their export performance (Fig. 8d).
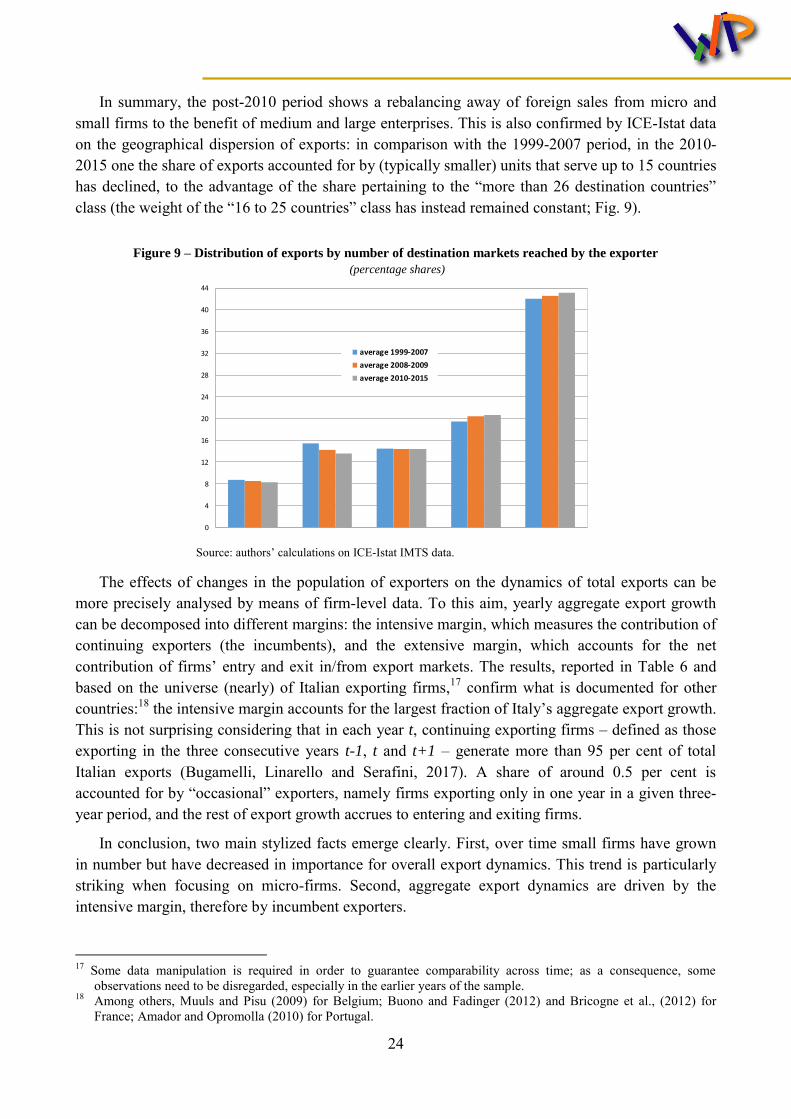
In summary, the post-2010 period shows a rebalancing away of foreign sales from micro and small firms to the benefit of medium and large enterprises. This is also confirmed by ICE-Istat data on the geographical dispersion of exports: in comparison with the 1999-2007 period, in the 2010-2015 one the share of exports accounted for by (typically smaller) units that serve up to 15 countries has declined, to the advantage of the share pertaining to the “more than 26 destination countries” class (the weight of the “16 to 25 countries” class has instead remained constant; Fig. 9).
Figure 9 – Distribution of exports by number of destination markets reached by the exporter
(percentage shares)
Source: authors’ calculations on ICE-Istat IMTS data.
The effects of changes in the population of exporters on the dynamics of total exports can be more precisely analysed by means of firm-level data. To this aim, yearly aggregate export growth can be decomposed into different margins: the intensive margin, which measures the contribution of continuing exporters (the incumbents), and the extensive margin, which accounts for the net contribution of firms’ entry and exit in/from export markets. The results, reported in Table 6 and based on the universe (nearly) of Italian exporting firms,17 confirm what is documented for other countries:18 the intensive margin accounts for the largest fraction of Italy’s aggregate export growth. This is not surprising considering that in each year t, continuing exporting firms – defined as those exporting in the three consecutive years t-1, t and t+1 – generate more than 95 per cent of total Italian exports (Bugamelli, Linarello and Serafini, 2017). A share of around 0.5 per cent is accounted for by “occasional” exporters, namely firms exporting only in one year in a given three-year period, and the rest of export growth accrues to entering and exiting firms.
In conclusion, two main stylized facts emerge clearly. First, over time small firms have grown in number but have decreased in importance for overall export dynamics. This trend is particularly striking when focusing on micro-firms. Second, aggregate export dynamics are driven by the intensive margin, therefore by incumbent exporters.
17 Some data manipulation is required in order to guarantee comparability across time; as a consequence, some
observations need to be disregarded, especially in the earlier years of the sample. 18 Among others, Muuls and Pisu (2009) for Belgium; Buono and Fadinger (2012) and Bricogne et al., (2012) for
France; Amador and Opromolla (2010) for Portugal.
0
4
8
12
16
20
24
28
32
36
40
44
1-5 countries 6-15 countries 16-25 countries 26-40 countries more than 40 countries
average 1999-2007
average 2008-2009
average 2010-2015
25
Table 6 – Goods export growth: intensive and extensive margins (average yearly percentage changes and contributions)
Source: authors’ calculations on Istat data.
3. The standard determinants
Having explored the developments in Italian exports from several perspectives we now switch our focus to investigating the main drivers, with the aim of assessing the relative role they played in determining aggregate export dynamics. We first consider standard “macro” factors: external demand and price competitiveness.
Briefly anticipating the main outcome of this analysis, we find that growth in the demand stemming from destination markets (potential demand) was broadly similar across the four countries, thereby plausibly contributing little to the observed export growth differential in Italy with respect to its three main competitors, whereas price-competitiveness developments can partly explain Italy’s relative performance: in particular, they penalized it before 2007 and supported it to a certain extent in the post-2010 period.
3.1 External demand
The ability of a country to keep pace with foreign demand is typically evaluated on the basis of the export market share, namely by assessing the development of its exports against that of world trade.19 Considering world trade as the main indicator of external demand for a euro-area country’s exports has however, several drawbacks. The most relevant shortcoming is the bias induced by the dynamics of trade flows within geographical areas that are very integrated among themselves and possibly not as integrated with Europe. This is the case of Asian imports, which contribute highly to world trade developments but are not equivalently relevant for European countries’ exports, since they are often driven by the endemic production network that goes under the name of “factory Asia”.
More generally, gravity equations (for instance, Anderson and van Wincoop, 2003) teach us that a country’s exports are not likely to benefit from demand independently from where it originates: exports are more reactive to demand in close, than in distant markets; the concept of distance at stake is not only geographical, but also cultural, institutional and linguistic.
In our view the performance on external markets is better assessed against a weighted measure of demand that takes into account the geographical and possibly the sectorial composition of exports. These are structural characteristics that, together with commercial presence abroad and international distribution networks, indeed evolve and adapt over time, albeit slowly.
19 It is well-known that the aggregation of national statistics leads to world imports differing from world exports,
raising the issue of how to measure “world trade”: while some commentators use the average of global exports and imports, we consider world imports as our preferred measure.
entry exit
2000-2007 5.3 5.3 0.0 3.7 -3.7
2007-2010 -1.6 -1.1 -0.5 2.6 -3.1
2010-2014 4.2 4.5 -0.3 1.8 -2.1
of which:Average
export growth
Intensive
margin
Extensive
margin
26
Several approaches are available for constructing a weighted measure of demand, also depending on purpose, data availability and timeliness constraints; they share the basic intent of capturing the evolution of exports that would be attained, all else (in particular, relative prices) constant, if market shares in partner countries’ imports were to remain unchanged. This may be interpreted as a measure of “potential exports”, before price-competitiveness arguments are brought into the picture (and that is probably why the indicator is often dubbed as “potential demand”, with a slight semantic abuse).
The simplest methodology, at least in terms of data requirements, is to build the measure of changes in potential exports by weighing the growth rates of partner countries’ imports with the previous-period percentage composition of exports by destination country (“evolving composition approach”).
A different and more disaggregated approach is to characterize destination markets as country-product pairs and to define potential demand as the exports that the country would have recorded if it had kept its market share constant in each destination cell.20 Conceptually, potential demand computed with this “constant market share approach” is a benchmark not for a country’s overall exports, but only for the intensive margin of exports, here defined (differently to Section 2.4) as sales in the subset of markets reached in the initial period.21
While potential demand indicators aim at capturing the evolution of exports as driven by partner countries’ imports, all else constant, China joining the WTO in 2001 is a serious challenge to the ceteris paribus clause for the period under study in this paper, as discussed in Box B.
Box B. The effect on potential demand of China joining the WTO
In a nutshell, in 2000 China was a large, emerging, closed economy that decided to start engaging in international trade. It joined the WTO in the following year, with the prospect of gaining large market shares, given its economic size and its initial price levels. This can be thought of, in loose terms, as the transition of China to a new “steady state”. Our measures of potential demand may be biased during the transition, as we now discuss, if China approaches its “steady-state” share of world trade – as a competitor – faster than its “steady-state” share of world absorption – as a destination market.
As mentioned in the main text, potential demand indicators aim at capturing the evolution of exports as driven by partner countries’ imports, all else constant (especially relative prices). China joining the WTO in 2001 is a serious challenge to this ceteris paribus clause, and it is tempting to describe this event as a pure price-competitiveness shock, namely the entry of a new competitor
20 The OECD pursues a similar methodology in building its weighted measure of demand (referred to as “export
market for goods and services”), except that markets are distinguished along the sole geographical dimension (and imports of each partner country are proxied by world exports to that destination).
21 Stated differently, one can expect exports to grow at a par with potential demand (absent competitiveness effects) only for “mature” exporters that have reached their “steady state” penetration of world markets. Vice-versa, exports by countries that still have plenty of scope for expanding their commercial presence world-wide (such as Spain, as we argue below) should be expected to outpace potential demand. Restricting one’s attention to the intensive margin of exports becomes irrelevant if markets are distinguished along the sole geographical dimension (thus dropping the sectorial one), as is the case in the “evolving composition approach”; indeed, for each of the euro-area countries under examination sales reach virtually all destination markets.
27
characterized by relatively lower price levels. This would definitely safeguard the intended interpretation of potential demand but one may show, within the constant-elasticity-of-substitution background that underpins its validity, that a large player entering international trade has an effect on demand for all other “varieties” which cannot be traced back to price competitiveness alone.
Specifically, recall the standard Marshallian demand for variety ω priced at p(ω) when consumers have Dixit-Stiglitz preferences of the form
q(ω) = [p(ω)
P]
−σI
P ,
where is the constant elasticity of substitution among varieties, I is the consumer’s exogenous nominal income and P is the ideal aggregate price index over the set of varieties :
P = (∫ p(ω)1−σdω∈
ω)
11−σ
.
Moving from an initial steady state where all varieties, for a total mass of n, are priced at the same price p and consumption is consequently uniform across varieties at level
q =1
n
I
p ,
assume that China starts offering its own varieties, also priced at p. Since China is a large player, this can be modelled as an increase in mass n, and the previous equation shows that the effects on incumbents is unambiguously that of reducing their demand, even if no competitiveness issues are at stake (since also all Chinese varieties are priced at the uniform price level p). This is an immediate consequence of consumers displaying love-of-variety.
Based on this simple argument, we do reckon that potential demand indicators are likely to misrepresent the effects of China joining the WTO. However, removing this element of noise would require disentangling the effect of the ensuing increase in available varieties, on the one hand, from the effects of Chinese varieties being offered at competitive prices relative to the average p on the other hand. It is very likely that embarking in such exercise would introduce a degree of arbitrariness that we regard as not worth the effort.
In summary, the potential demand indicators we present are likely to display an upward bias, for Italy as well as for the other main euro-area countries, during a period of “transition” that begins around 2001 and whose length we are not able to assess. While the sign of the bias is determined, its magnitude is unknown. It is likely to be larger for economies (such as Italy, as we argue in Section 4.2) that are most exposed to competition from China.
The Banca d’Italia’s indicator of potential demand for Italy, computed with the “evolving
composition approach” described above, is presented in Figure 10.22 This measure considers 80 destination countries, whose import volumes are taken from the IMF-WEO database, and whose weight for year t is based on the corresponding weight on Italian exports at current prices in the
22 The methodology is close to that adopted at the ECB (Hubrich and Karlsson, 2010).
28
triennium t-3, t-2, t-1 (rolling base). Rolling 3-year periods, in the place of more volatile previous-period weights, are a good compromise for capturing the stickiness of a country’s export specialization. Moreover, they also help capturing the “transition between steady states” that began after China joined the WTO, discussed in Box B, more gradually.
Figure 10 – Italy’s goods exports, world imports and potential demand
(constant prices and exchange rates)
a) indices 1999=100 b) average yearly growth rates over sub-periods
Source: authors’ calculations on Istat and IMF-WEO data.
Figure 10a shows developments in potential demand against those of (the un-weighted sum of) world import volumes: whereas before the “Great Trade Collapse” the two indicators grew at broadly the same pace, they started diverging thereafter, with potential demand increasing at a lower rate especially in 2010-2013, reflecting the weak imports of euro-area partners (which have quite a large weight in the latter indicator).
Overall, between 1999-2007 and 2010-2016 potential demand for Italian exports decelerated drastically, from an average growth rate of about 9 per cent per year to barely 3 per cent (Fig. 10b and Fig. A1 in Annex A). The slowdown was slightly stronger than the slump registered by world trade and was common to both the intra and the extra-euro area component, although particularly intense for the latter.
Against these broad patterns of external demand, the relative performance of Italian exports was very different across the two periods. Until 2007 exports of goods lagged significantly behind: their volumes grew on average at a 5.3 per cent yearly rate, almost half that of potential demand, accumulating a negative gap of almost 30 percentage points in the eight years since 1999. By breaking down both exports and potential demand into the component originating from euro area importers and that coming from the rest of the world, it is quite evident that the underperformance before the crisis entailed a loss both within and outside the euro area, although the gap was particularly large within the euro area. However, from 2010 onwards this tendency reversed and exports almost systematically outpaced potential demand, owing to a very positive performance on non-euro area markets. Conversely, within the euro area Italian exporters performed slightly worse than if they were able to fully satisfy potential demand.
How has the potential demand for Italian exports evolved as compared to that for German, French and Spanish products? Is there any significant difference that might help explaining relative export performances? To investigate this aspect we compute a simplified version of the indicator of potential demand at constant prices that is comparable across countries (Fig. 11); its pattern turns out to be broadly similar in the four countries between 1999 and 2016. The demand for German and French exports was only marginally less dynamic than that for Italian products and the gap vanished after 2010; for Spain it was the weakest, cumulating a negative growth gap against Italy of about 15 percentage points, also in this case concentrated in the 1999-2007 period.
Figure 11 - Potential demand for Italy, France, Germany and Spain (1)
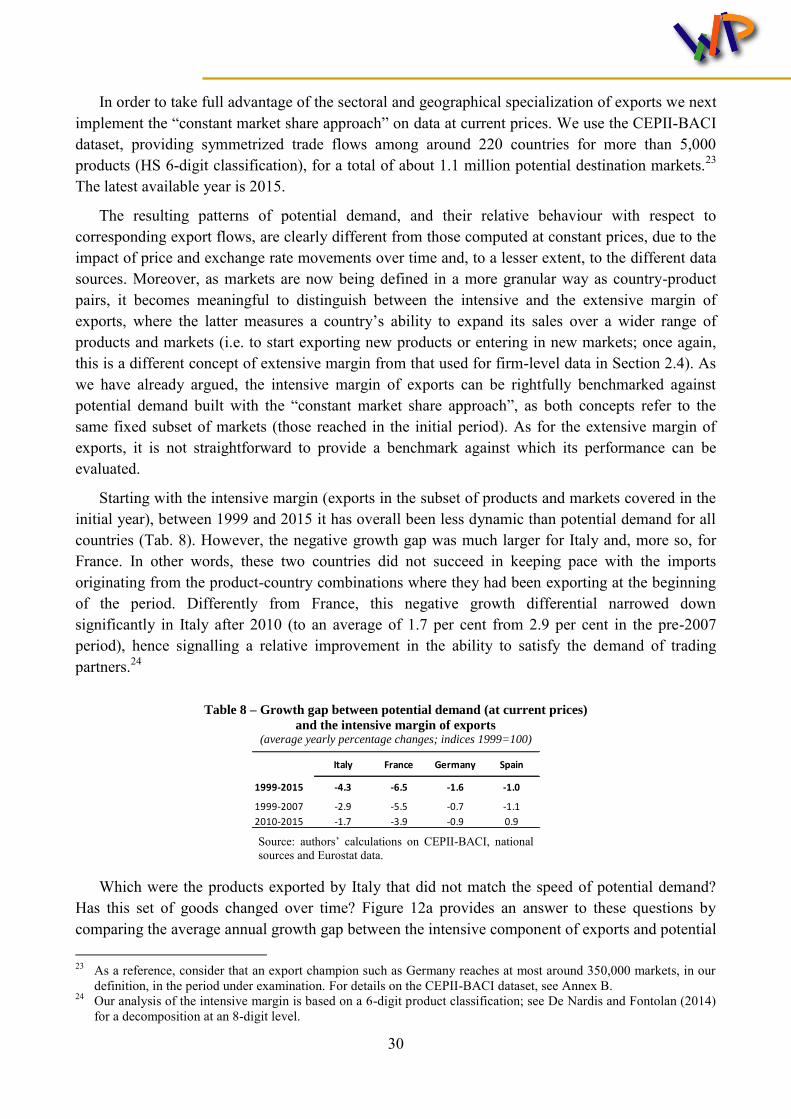
(constant prices and exchange rates; indices 1999=100)
Source: authors’ calculations on national sources, Eurostat and IMF-WEO data. (1) The indicator differs very marginally from that described in Figure 10: it considers the import volumes of the main 80 trading partners of each country (covering about 98-99 per cent of its exports and sourced from national accounts data at constant prices from the IMF WEO) and weights them with their average share in the country’s exports in 1999-2000 (for the indicator from 1999 to 2007) and in 2006-2007 (for the indicator from 2008 onwards).
In the overall 1999-2016 period export volumes have increased more than the corresponding
potential demand in Germany and Spain, less in Italy and France (Tab. 7). Whereas before the crisis only German exporters were able to outpace the demand for their exports, in all countries the growth rate of exports was on average higher than that of potential demand in the post-2010 period (especially for Spain and Germany).
Table 7 – Goods exports and potential demand (volumes) in the main euro-area countries (average yearly percentage changes)
Source: authors’ calculations on national sources, Eurostat and IMF-WEO data. (1) For Italy, growth rates are consistent with the potential demand series plotted in Figure 10. Refer instead to Figure 11 for the other countries.
In order to take full advantage of the sectoral and geographical specialization of exports we next implement the “constant market share approach” on data at current prices. We use the CEPII-BACI dataset, providing symmetrized trade flows among around 220 countries for more than 5,000 products (HS 6-digit classification), for a total of about 1.1 million potential destination markets.23 The latest available year is 2015.
The resulting patterns of potential demand, and their relative behaviour with respect to corresponding export flows, are clearly different from those computed at constant prices, due to the impact of price and exchange rate movements over time and, to a lesser extent, to the different data sources. Moreover, as markets are now being defined in a more granular way as country-product pairs, it becomes meaningful to distinguish between the intensive and the extensive margin of exports, where the latter measures a country’s ability to expand its sales over a wider range of products and markets (i.e. to start exporting new products or entering in new markets; once again, this is a different concept of extensive margin from that used for firm-level data in Section 2.4). As we have already argued, the intensive margin of exports can be rightfully benchmarked against potential demand built with the “constant market share approach”, as both concepts refer to the same fixed subset of markets (those reached in the initial period). As for the extensive margin of exports, it is not straightforward to provide a benchmark against which its performance can be evaluated.
Starting with the intensive margin (exports in the subset of products and markets covered in the initial year), between 1999 and 2015 it has overall been less dynamic than potential demand for all countries (Tab. 8). However, the negative growth gap was much larger for Italy and, more so, for France. In other words, these two countries did not succeed in keeping pace with the imports originating from the product-country combinations where they had been exporting at the beginning of the period. Differently from France, this negative growth differential narrowed down significantly in Italy after 2010 (to an average of 1.7 per cent from 2.9 per cent in the pre-2007 period), hence signalling a relative improvement in the ability to satisfy the demand of trading partners.24
Table 8 – Growth gap between potential demand (at current prices)
and the intensive margin of exports (average yearly percentage changes; indices 1999=100)
Source: authors’ calculations on CEPII-BACI, national sources and Eurostat data.
Which were the products exported by Italy that did not match the speed of potential demand?
Has this set of goods changed over time? Figure 12a provides an answer to these questions by comparing the average annual growth gap between the intensive component of exports and potential 23 As a reference, consider that an export champion such as Germany reaches at most around 350,000 markets, in our
definition, in the period under examination. For details on the CEPII-BACI dataset, see Annex B. 24 Our analysis of the intensive margin is based on a 6-digit product classification; see De Nardis and Fontolan (2014)
for a decomposition at an 8-digit level.
Italy France Germany Spain
1999-2015 -4.3 -6.5 -1.6 -1.0
1999-2007 -2.9 -5.5 -0.7 -1.1
2010-2015 -1.7 -3.9 -0.9 0.9
31
demand in 1999-2007 (horizontal axis) and 2010-2015 (vertical axis) for the main sectors. It shows that whereas before the crisis exports lagged behind demand in all sectors except for electronics, after 2010 they succeeded in increasing at a par with in the machinery, food and leather sectors and even outpaced potential demand in the pharmaceutical and motor vehicles industries. According to the position of each sector with respect to the 45° diagonal (with points above the line corresponding to sectors in which the performance of exports with respect to potential demand improved in the post-crisis years relatively to the pre-crisis period), the improvement since 2010 is rather widespread. The empty positive quadrant testifies that there was no sector whose exports managed to grow faster than potential demand in both sub-periods. Considering also the sectoral weights in total exports, it appears that the largest contribution to the general improvement in 2010-2015 derived from the relative recovery of exports of machinery products and of motor vehicles (Fig. 12b).
Figure 12 – Italy’s intensive margin of exports vs. potential demand across sectors
(average yearly percentage changes and contributions)
a) growth gap between exports and potential demand
b) contribution to the narrowing of the growth gap in 2010-15
Source: authors’ calculations on CEPII-BACI, national sources and Eurostat data at current prices and exchange rates. In chart a) the size of the bubbles is proportional to the sector’s weight on Italy’s exports. HS 6-digit products were aggregated so as to mimic the 2-digit CPA classification, as in Table 5.
In order to assess the extent of the widening over time of the product-destination pairs reached by exports, Figure 13 provides a synthetic picture of the over-performance of exports with respect to the intensive margin. It confirms the outstanding case of the Spanish economy, where the gap between the two measures is the largest, pointing to a significant role for the extensive margin, which became particularly intense after 2010. The other three countries instead show very similar patterns: the extent to which the observed pattern of exports is explained by the widening of the number of products-markets reached over time is relatively small. While the extensive margin explains around 5 percentage points of the cumulated growth rate of exports between 1999 and 2015 in France, Germany and Italy, it explains 19 points for Spain. We interpret this mainly as a “catching up” story: Spain had room for further expanding its world-wide commercial presence which the other three countries had already largely saturated. Indeed, while in 1999 France and Italy served an overall number of markets that was around 85 per cent of the German overall count, the
share was only 53 per cent for Spain.25 The extensive margin accounts for around 13 percentage points, that is around one fourth, of the negative growth gap (at current prices) that Italy cumulated vis-à-vis Spain.
Figure 13 – Over-performance of exports with respect to the intensive margin: the role of the extensive margin
(current prices and exchange rates; indices 1999=100)
Source: authors’ calculations on CEPII-BACI, national sources and Eurostat data.
3.2 Price competitiveness
Price competitiveness is another key driver of export developments. A standard measure of a country’s price competitiveness is the real effective exchange rate (REER), i.e. a weighted average of nominal exchange rates of a country’s main trading partners, deflated by relative prices or costs. In this paper we define it so that a rise in the REER signals a loss in price competitiveness.
Since the inception of EMU and until 2016, Italy’s price competitiveness, measured according to an indicator deflated by producer price indices (PPIs), improved by over 1 percentage point, relative to more substantial gains in France and Germany (7 and 9 points, respectively) and to a loss (8 points) in Spain (Fig. 14a).26 The overall improvement observed in the first three countries was driven by more contained price dynamics relative to their respective trading partners (Fig. 14b), against a general backdrop of an overall appreciation of the nominal effective exchange rate (NEER; Fig. 14c). In Italy, however, relative to its main competitors, both the drop in relative prices was more contained (except relative to Spain) and the appreciation of its NEER was larger. The second fact is due to the interplay between the 62 bilateral exchange rates and the corresponding country-specific trade weights that underlie the indicators; in other terms, the geographical structure of Italy’s trade flows penalized the “exogenous” component of price competitiveness that is driven by the exchange rate of the euro.
25 The corresponding ratios in 2015 were 89, 81 and 69 per cent, respectively, for Italy, France and Spain. Germany
served around 313,000 markets in 1999, around 342,000 in 2015. 26 Banca d’Italia constructs and releases monthly price-competitiveness indicators, deflated by producer prices of
manufactures sold domestically, of 62 countries, which we use in this paper (see Felettigh et al., 2016).
Source: Banca d’Italia. (1) The real effective exchange rate is deflated by producer prices of manufactures sold domestically (see Felettigh et al., 2016 for details on the methodology). An increase in the indicator signals a loss in price competitiveness. (2) Ratio of country’s producer prices to partners’ prices.
These overall price-competitiveness outcomes reflect different cyclical patterns over time. Between 1999 and 2007 Italy’s competitiveness deteriorated by more than 4 percentage points, against a smaller loss in France (under 2 points) and a significantly larger deterioration in Spain (10 points); in contrast and in spite of the appreciation of the euro, in the same period Germany stood out as an outlier, recording a moderate gain (3 points). The governance structure of German labour market institutions, underpinned by flexible contracts and mutual agreements between trade unions, employer associations and work councils, which led to the decentralization of wage bargaining to the firm level, has been highlighted as a key explanation of Germany’s wage, and therefore price, moderation in this period (Dustmann et al., 2014; Burda, 2016).
The general recovery in price-competitiveness, started in 2008-2009, continued thereafter, although to a different extent across the four countries (under 1 percentage point between 2010 and 2016 in Germany and Spain, about 2 points in Italy and almost 4 in France), against a backdrop of a modest depreciation or broad stability of nominal effective exchange rates and a very subdued pattern of relative prices in Italy and France in particular.
As a result of these medium-term developments, in 2016 competitiveness gaps with respect to Germany, the best-performing country over the whole period, stood at about 2 points for France, 7
for Italy and 17 for Spain, confirming a picture of non-negligible divergence within the euro area, despite some significant re-balancing in recent years.
The aggregate dynamics of the real effective exchange rate may be decomposed into the developments vis-à-vis euro area and non-euro area trading partners on all markets, regardless of whether they are located within or outside the euro area (Fig. 15); this decomposition therefore allows capturing competitive pressures stemming from selected competitors, and not that arising on specific geographical markets. Italy’s modest gain between 1999 and 2016 was due entirely to an improvement in price competitiveness relative to partners outside the euro area, which was partially offset by a small cumulated loss vis-à-vis euro-area countries. The latter was driven by Italian prices rising slightly faster than average euro-area PPIs (Table A4 in Annex A). France and Germany gained, whereas Spain lost, competitiveness with respect to both sub-groups of partners.
Figure 15 – Real effective exchange rates vis-à-vis different groups of trading partners (1999=100)
a) vis-à-vis euro-area countries
b) vis-à-vis non-euro area countries
Source: Banca d’Italia. (1) The real effective exchange rate is deflated by producer prices of manufactures sold domestically (see Felettigh et al., 2016 for details on the methodology). An increase in the indicator signals a loss in price competitiveness.
Before the 2008-2009 recession all four countries recorded a better performance vis-à-vis euro-area partners, with the important difference that Germany and France gained price competitiveness, while Italy and, more so, Spain lost competitiveness. Focusing on the period since 2010, Italy’s gain in price competitiveness vis-à-vis its non-euro area partners (of about 4 percentage points) was due roughly for two thirds to the stimulus stemming from the nominal depreciation of the euro and for one third to more contained PPI dynamics relative to its competitors. A similar gain was observed in Spain, whereas the improvement was larger in France and smaller in Germany. Conversely, Italy’s price competitiveness relative to euro-area countries deteriorated by approximately 1 point, against slightly larger losses in Germany and Spain; only France recorded a modest gain.
All in all, the performance of Italy’s price competitiveness, measured on the basis of relative producer prices, has only mildly improved over time since the adoption of the euro, and to a lower extent than in France and in Germany. Only Spain performed worse, given that its PPI-deflated REER currently is well above that observed in 1999. The bulk of Italy’s adjustment has been concentrated in recent years, thereby counteracting the losses accumulated between 1999 and 2007, and has also been driven by a slowdown in Italy’s growth in relative prices. Indeed, since 2010 Italy’s price-competitiveness gains have been larger than those recorded in Spain and in Germany.
It is noteworthy that different trends and rankings amongst the four euro-area countries emerge when considering alternative price-competitiveness indicators, based on different deflators to PPIs, namely consumer prices, GDP deflators and unit labour costs in total economy (ULCT). The discrepancy is particularly pronounced when comparing PPI-deflated measures with ULCT-deflated indicators, across all four countries. In the case of Italy whereas the former signal an overall moderate gain, the latter indicate a loss of over 1 percentage point (Table A5 in Annex A). Although both theoretically and empirically no deflator proves to be optimal (Turner and Van’t Dack, 1993; Chinn, 2006; Giordano and Zollino, 2016), PPIs of manufactured goods have the advantage of proxying for developments that encompass all production cost pressures, not only labour costs, in the sector of tradable goods. PPI-deflated REERs prove in turn to be strongly correlated with both GDP deflator and CPI-based indicators (as shown in Fig. A2 in Annex A). In contrast, the evolution of ULCT-deflated REERs may be influenced by the possible substitution between material inputs, labour and capital. Furthermore, these deflators are not available for many emerging economies, thereby constraining the assessment of price competitiveness to that relative to significantly few trading partners, which may therefore be misleading.
Finally, the rising importance of global value chains, already discussed in Section 2.1, also has an impact on the construction of REERs and, more in general, on the assessment of price competitiveness. This issue is discussed more thoroughly in Box C.
Box C. Real effective exchange rates and global value chains
In addition to the choice of the deflator, another significant element underlying the construction of REERs refers to the weights with which the bilateral nominal exchange rates of the reference country vis-à-vis its trading partners are constructed. Standard REERs, such as those employed in the analysis herein, use weights based on bilateral gross trade flows of goods and are constructed according to two key assumptions: i) countries trade only in final goods (Armington, 1969) and ii) the elasticity of substitution is constant not only for products coming from different countries, but also across different products (Spilimbergo and Vamvakidis, 2003).
By using information on value added extracted from World Input-Output tables, sourced from WIOD, the most recent literature has however made progress in incorporating at least three dimensions of the rising internationalization of production processes, which question these two key assumptions, in the construction of REERs: a) as already discussed in Box B, owing to (increasing) vertical integration into trade, countries add value to different stages of the production process and therefore compete in supplying domestic value added to international markets (Bems and Johnson, 2012); b) an appreciation of a country’s currency raises the international price of its final goods, but this effect may be (partially or entirely) offset by the fact that the appreciation also reduces the cost of importing intermediate goods, thereby dampening overall production costs within the country, especially for economies at the end of the production chain (Bems and Johnson, 2015), c) sectors are not identical in their interactions across borders (Patel, Wang and Wei, 2017).
Adopting the theoretical framework and weights in Bems and Johnson (2015), Fidora and Schmitz (2017) construct VA-REERs (which tackle the first implication of global value chains) and IO-REERs (which take on board both the first and the second dimensions). These indicators, deflated by GDP deflators and for a set of 39 partner countries, are compared to standard REERs which
36
differ only owing to their different weighting systems. According to both standard REERs and VA-REERs, in the overall period 1999-2016 Italy’s gain in price competitiveness was similar and of approximately one percentage point, whereas the IO-REER signal a loss of under one point. The difference across indicators was mainly accumulated in the period 1999-2007. Across all four largest euro-area economies the IO-REER signals less favourable price-competitiveness developments relative to the other two measures, but the differences are slightly larger in the case of Italy.
In addition to input-output linkages, Patel, Wang and Wei (2017) introduce a further methodological improvement in the construction of REERs vis-à-vis the same set of trading partners considered by Fidora and Schmitz (2017) to tackle the third dimension mentioned above, therefore by accounting for sectoral heterogeneity both in the prices and in the weights employed.1 Sectoral deflators, in particular, are derived from different entries in the WIOD tables appraised at both current and previous year prices, and are available only until 2009. The authors conclude that accounting for sectoral heterogeneity is even more relevant in tracking price-competitiveness developments than merely accounting for input-output linkages at the country level. In the overall period 1999-2007 price-competitiveness dynamics in the four main euro-area countries are indeed generally significantly more favourable when assessed according to these indicators relative to all the other measures discussed so far: the loss in price competitiveness in both Italy and Spain appears to have been more contained, and the gain in France and in Germany more pronounced. Yet, if sectoral heterogeneity in both weights and prices is taken into account, Italy’s cumulated price-competitiveness gap in 2007 relative to the best-performing country, Germany, is nearly double that measured according to the standard REERs discussed in the main text.
Considering however the limited geographical coverage of these more sophisticated REERs and their short time-span in the case of Patel, Wang and Wei’s (2017) indicators, strong conclusions concerning Italy’s price competitiveness based on these innovative measures cannot be drawn, and we therefore prefer to base our assessment on the standard and more encompassing (in terms of country coverage) REERs discussed in the main text. (1) The sectoral REER indicator we will employ in Section 5.1, sourced from Sato et al. (2015), takes into account only sectoral differences in the deflator (PPI).
3.3 A constant market share decomposition of exports
A constant market share (CMS) approach is a useful, though synthetic, tool for measuring the relative contribution of various determinants to a country’s performance on export markets. The approach in fact provides a quantitative assessment of the relevance of the sectoral and geographical specialization of a country’s exports – which ultimately determines the evolution of its potential demand – against other determinants, also comparatively across different time periods and countries. Although it rests on an algebraic identity, the quantitative assessment is accompanied by an economic interpretation, providing that some caution is exerted. In Annex C we instead disentangle the contribution of both potential demand and price competitiveness to export dynamics, albeit only for Italy, in a standard macro-econometric approach.
37
As is shown formally in Annex D, a CMS analysis decomposes the change in a country’s market share on world trade into three items: i) a “structural” component; ii) a “competitiveness” term and iii) a “dynamic adaptation” component. The “structural” term measures whether, due to their composition by sector and geographical destination, exports are exposed to markets that grow faster or slower than world trade.27 The second term is a weighted average of the changes in the country’s market share on individual markets, identified as product-country pairs. It is often referred to as the “competitiveness” effect, since it reflects price and non-price factors which determine gains or losses of competitive positions on each specific market. The third component depends on the correlation between the change in the country’s market share on individual product-country pairs and the changes in their weight on world trade. It is often referred to as the “dynamic adaptation” effect, as it assesses whether a country is able to gain shares in markets that grow faster than the average (or lose shares on slow-growing markets). In a nutshell, the “structural” component captures the change in a country’s world market share that would have occurred had the country’s exports grown at a par with potential demand (measured with the “constant market share approach”). What is not explained by potential demand has a residual interpretation and the breakdown into an “adaptation” component and a (price and non-price) “competitiveness” term is only indicative.
We applied this CMS decomposition to the export market share changes observed in Italy and in the other three main euro-area countries over the period 1999-2015, for which data are currently available. The analysis was carried out using CEPII-BACI data (at current prices) at an intermediate level of product detail (HS 4-digit, which includes about 1,200 products) and considering all world destinations.
The results, shown in Figure 16, suggest that the decline in Italy’s market share on world trade over the last two decades was driven, to a large extent, by the negative contribution of the “competitiveness” and “adaptation” components. Sectoral and geographical specialisation also had a negative, yet smaller, impact, accounting for only one tenth of the observed decrease in Italy’s market share.28 In particular, sectoral specialisation exerted a slightly more negative effect than the geographic composition of destination markets.29
Among the other economies, Spain stands out as the only country where the “competitiveness” term contributed positively to the change in the export market share; this effect was more than offset by the unfavourable sectoral and, in particular, geographical specialization. In the case of Germany, the percentage loss in market share (which was about half that recorded by Italy) was mainly due to the “adaptation” term, while the effects of both “competitiveness” and specialisation were negligible (although the composition by destination markets had a slightly more negative impact). The picture for France is qualitatively similar to that for Italy, namely characterized by a 27 This component can be further decomposed into three items, which separately capture the sectoral and the
geographical specialization and their interaction. 28 Our results are largely in line with those found in other studies (among others, Memedovic and Iapadre, 2009 and
Cheptea, Fontagné and Zignago, 2014). 29 Annex D reports results of the CMS analysis using different levels of product disaggregation, which are known to
have a significant impact on the decomposition results: the contribution of the sectoral and geographical specialization to the decline in Italy’s market share goes from 8 per cent (with products at the 6-digit level) to 18 per cent (with products at the 2-digit level). The negative contribution of sectoral specialization reflects, to some extent, the rise in commodity prices over the last two decades. Indeed, replicating the CMS analysis excluding mineral products, the contribution of these factors becomes almost negligible (Table D1 in Annex D).
38
strongly adverse impact of the “competitiveness” term, coupled with insufficient “adaptation” and an unfavourable geographical specialization.
Figure 16 – Constant-market-share decomposition of percentage changes in export market shares
between 1999 and 2015 (1) (as a percentage of market shares in 1999; exports at current prices)
Source: authors’ calculations on CEPII-BACI data. (1) Changes in market shares can be decomposed into the following components (see Annex D for the details): sectoral specialization, geographical specialization, sectoral and geographical interaction, “competitiveness” and “adaptation”.
Focusing on Italy’s export performance across sub-periods, Figure 17 reveals that the steep loss in the market share between 1999 and 2007 was largely due to the negative effect of both “competitiveness” and “adaptation”: the contribution of the structural composition of exports was only slightly negative, as a result of the adverse influence of the sectoral specialization, partly offset by the positive effect of geographical specialization. Between 2007 and 2010 the contribution of both sectoral and geographical effects was negative and competitiveness factors continued to penalize Italian exports. On the contrary, the resilience of the market share since 2010 reflected mainly the positive contribution of product specialization (especially in 2014-2015), which was offset by the “adaptation” component, while the curbing effect of competitiveness factors almost disappeared.30
Overall, the CMS analysis indicates that the performance of Italian exports since the late 1990s can be explained only to a minor extent by the country’s unfavourable product or geographical specialization.31
30 According to the World Bank Export Competitiveness Database (Gaulier et al., 2013), which reports regression-
based decompositions over the period 2005-2015, the contribution of sectoral specialization to the change of Italy’s export market share has been positive since mid-2012, but has been partly offset by the negative contributions of geographical specialization and of performance effects.
31 Notice that the product specialization term only considers whether the composition of exports is geared towards more or less dynamic segments of world trade, but a country might have an “unfavourable” product specialization for other reasons. For instance, the composition of exports might be concentrated in sectors where there are lower barriers to entry of low-cost producers, thus implying a strong price competition. Measures of the intensity of
-45
-40
-35
-30
-25
-20
-15
-10
-5
0
5
10
Italy France Germany Spain
Sectoral specialization
Geographical specialization
Structure interaction
Adaptation
Competitiveness
Change in market share
39
Figure 17 – Italy: constant-market-share decomposition of absolute changes in export market shares (1) (percentage points; exports at current prices)
a) by sub-periods
b) by year
Source: authors’ calculations on CEPII-BACI data. (1) Changes in market shares can be decomposed into the following components (see Annex D for the details): sectoral specialization, geographical specialization, sectoral and geographical interaction, “competitiveness” and “adaptation”.
4. Broadening the spectrum of potential drivers
In this section we move away from “standard” determinants of exports, namely external demand and price competitiveness, to investigate the relevance of additional potential drivers, put forward by the most recent trade literature, in explaining Italy’s relative export performance. Here we consider the following factors: competition from China, product quality and domestic demand. There could be a fourth factor: foreign direct investment (FDI). Inward FDI often boosts exports via additional capital, technology and managerial know-how and improved access to global markets and distribution networks. Outward FDI and exports may be substitutes when the motivation of FDI is to produce in the foreign country products that had previously been exported from the home nation, or may be complements when the activity in the foreign country generates increased demand for intermediate products from the investing country. Given the complexity of the issues involved and the scarce availability of detailed cross-country data on multinational companies’ export activity (Federico, 2016), we leave the analysis of this factor for further research.
4.1 Competition from China
As already mentioned, the increasing role of China as a global player in world markets has undoubtedly been the main feature of international trade in the last two decades: from its entry in the WTO in 2001 the country’s share of world goods exports has almost tripled, reaching about 15 per cent in 2015.32 This protracted shock affected the external performance of advanced economies
competition from China at the product level seem to suggest indeed that Italian exports were more exposed to the “China shock” (as shown in Section 4.1).
32 Another significant development was the trade integration of Central and Eastern European countries, which led to “regional supply chains” and which might have, at least in part, displaced Italian exports, especially those to the German market. The magnitude of this shock was however considerably smaller compared to the “China shock”. While China's market share on world trade increased by ten percentage points between 1999 and 2015, the combined market share of the main five Central and Eastern European countries (the Czech Republic, Hungary, Poland, the Slovak Republic and Slovenia) increased by just 1.6 percentage points in the same period. The
through a variety of channels: just to mention some of the aspects covered in our analysis, it had an impact on countries’ market shares, on the development of the potential demand for their exports, on their (price and non-price) competitiveness, in terms of both dynamics and levels, and on the quality composition of exported goods.33
Developments in Italian exports were undoubtedly influenced through each of the above channels, although it is very difficult to empirically disentangle their effects from one another and, in particular, to determine whether they were relatively more severe than for other countries.
A synthetic way to qualitatively assess the strength of these adverse shocks in comparison with the other euro-area partners is to examine and compare the evolution of exports according to their different exposure to Chinese competitive pressures. Using the CEPII-BACI dataset, we classify products on the basis of the intensity of competition exerted by China on world markets, measured by China’s world market share for each product in 2007 (the midpoint of the period under consideration).34 We distinguish three groups of products based on the terciles of the distribution: “high” (when China’s world market share is above 15 per cent), “medium” (when China’s share falls between 4 and 15 per cent) and “low competition” (when China’s share is below 4 per cent).
Two facts stand out. First, the degree of exposure to Chinese competition is indeed associated with a less favourable performance of exports in all main euro-area countries: Figure 18a shows that the overall decrease in their market share between 1999 and 2015 was generally much larger for products characterized by high competition from China and, on the contrary, very small (except for France) for those facing less intense competition. The picture for Spain and that for Germany are strikingly similar.
Second, since the very beginning of the period under analysis, Italy has been relatively more exposed, due to its productive specialization, to the global shock induced by China: in 1999 the products characterized by a high degree of competition amounted to 31 per cent of its total exports, compared to around 20 per cent for the other countries (Fig. 18b). More in detail, all the sectors in which at the end of the Nineties Italy was relatively specialized in comparison with the other three economies were associated to a high level of exposure to Chinese competition (Tab. 9).35
magnitude of the two shocks becomes more comparable only if we consider imports from euro-area countries rather than world trade, although even in this case China recorded a larger increase in market share than Central and Eastern European countries. We therefore choose to focus only on competition from China in this part of our analysis, although we are aware that competition from Central and Eastern European countries might have been a factor behind Italy's less favourable performance in euro-area markets.
33 Several studies suggest that the “China shock” and, more generally, the increasing competition of low-wage countries did indeed have a significant impact on advanced economies (for a survey, see Autor, Dorn and Hanson, 2016). Focusing on Italy, there is evidence of an impact on sector-level productivity (Bugamelli and Rosolia, 2006; Bugamelli, Schivardi and Zizza, 2009), on firms’ pricing strategies (Bugamelli, Fabiani and Sette, 2015), on output and employment in the manufacturing sector, including inter-sectoral effects via input-output linkages (Federico 2014), on exports (Giovannetti, Sanfilippo and Velucchi, 2011) and on export unit values (Giovannetti and Sanfilippo, 2016).
34 The analysis is based on more than 4,500 products defined at the HS 6-digit level. Since exports are measured at current prices, we exclude mineral products to avoid that our results be influenced by commodity price cycles. We measure the intensity of competition from China using its market share in 2007, but broadly similar results are obtained using the share in 2015.
35 Similar indications derive from an export similarity index, which measures the overlap in two countries’ export bundles. Similarity with China is larger in Italy than in each of the other main euro-area countries (see Annex E).
41
Figure 18 – Market shares and intensity of competition from China (1)
Source: authors’ calculations on CEPII-BACI data. (1) Exports at current prices. Mineral products are excluded.
Table 9 – Italy’s exposure to competition from China by sector (1) (percentage shares)
Source: authors’ calculations on CEPII-BACI data. (1) Mineral products are excluded from the analysis. Sectors are ranked in descending order of relative specialization in 1999 (defined with respect to the mean of France, Germany and Spain). Cells highlighted in red correspond to sectors with an exposure to competition from China that is above the median in a given year.
As a consequence of these two aspects (weaker export performance and higher ex ante exposure) the set of products in the segment characterized by high exposure to pressures from China
-60
-50
-40
-30
-20
-10
0
Italy France Germany Spain
a) Percentage change in market shares : 1999-2015
High competition from China
Medium competition from China
Low competition from China
Total33
5550 51
41
6356 58
36
2530 28
35
2328 25
31
20 20 21 2413 16 17
0
10
20
30
40
50
60
70
80
90
100
Italy France Germany Spain Italy France Germany Spain
b) Percentage composition of exports
High competition from China Medium competition from China Low competition from China
1999 2015
-3
-15
0 0
-11
-10
-5 -6
-14
-12
-6 -7
-40
-35
-30
-25
-20
-15
-10
-5
0
Italy France Germany Spain
c) Contributions to percentage change in market share: 1999-2015 (percentage points)
High competition from ChinaMedium competition from ChinaLow competition from China
d) Italy's market share by intensity of competition from China (percentages)
High competition from China
Medium competition from China
Low competition from China
1999 2015 1999 2015
Textiles 73 76 11 7
Machinery / Electrical 24 17 29 27
Miscellaneous 68 57 8 7
Footwear / Headgear 74 70 3 2
Raw Hides, Skins, Leather, & Furs 37 64 2 3
Stone / Glass 31 26 6 5
Metals 37 30 8 10
Plastics / Rubbers 21 18 5 5
Pharmaceuticals 1 0 2 6
Foodstuffs 9 6 4 6
Wood & Wood Products 21 17 3 2
Animal products 5 3 1 1
Vegetable Products 6 4 2 3
Chemicals & Allied Industries 12 7 6 6
Transportation 9 6 11 11
Relative under-
specialization
Sectors
% share of exports in
products facing high
competition from China
% share of exports on total
non-oil exports
Relative specialization
42
accounted for more than half of the overall decline in Italy’s share on world markets between 1999 and 2015, which was much more pronounced than the decline observed in Germany and Spain (Fig. 18c).36 These overall patterns however conceal significantly different developments over time and in particular between the pre- and the post-crisis period: the steep decline in Italy’s market share in the “high competition” product group has significantly flattened since 2010 (Fig. 18d), hence pointing to a possible progressive unwinding of the negative effects of the “China shock” on export performance.
Still, despite the significant shift in the composition of exports towards products which are more sheltered from Chinese competition, Italy’s exposure to the latter continues to be relatively high (24 per cent of exports in 2015, as against 13-17 per cent for the other main euro-area countries). Furthermore, even the segment of “medium competition” products, which is also disproportionately represented in Italian exports, might be increasingly exposed to competitive pressures, as Chinese companies expand their production capabilities.
Can the “China shock” explain the underperformance of Italy’s exports with respect to those of Germany and Spain? It can be reasonably argued that it does so only partly, as Italy’s loss of market shares was more intense not just in the segment of high-competition products but across all product groups, independently of the pressures exerted by Chinese exports. For a simple “back-of-the-envelope” quantitative assessment, we can consider a counterfactual scenario in which Italy’s ex
ante export composition in terms of intensity of competition from China is set equal to the other three countries’ average. In other words, we assume that the share of high-competition products in Italian exports in 1999 was not 31 but 21 per cent (those of the medium and low-competition product groups increase proportionately: from 36 to 41 per cent and from 33 to 38 per cent, respectively). We also assume that the decline in the market share over time in each segment was the same as that observed. Under this rather conservative counterfactual scenario, the overall percentage loss of Italy’s share on world trade (excluding energy goods) between 1999 and 2015 would have been about 1.5 percentage points smaller than the decrease actually observed (26.5 per cent rather than 28.1). This would have reduced the growth gap between Italian and German (or Spanish) exports by approximately 10 per cent.37 Clearly, this exercise relies on several assumptions, some of which are admittedly arbitrary (for example, the measurement of the intensity of competition according to the terciles of the distribution, the dynamics of market shares in the hypothetical scenario; see Annex E for a robustness analysis), while disregarding potentially relevant features of destination markets (product-country pairs), such as the market power of Italian firms. It provides however a rough intuition of what is probably a lower bound for the magnitude of the impact of China’s expansion on world markets on Italian trade performance.
36 An additional driver of this pattern is that world exports of products characterized by high competition from China
have grown more slowly than world trade: their share on world trade (excluding non-energy products) decreased from 32.1 to 29.3 per cent between 1999 and 2015.
37 In an alternative, less conservative, counterfactual scenario we assume that the relative shares of medium and high-competition products are also in line with the average of the other three euro-area countries (therefore accounting for 27 and 52 per cent of total exports, respectively, in 1999). In this exercise, the loss of Italy’s share on world trade would have been about 3.5 percentage points smaller than that observed. The gap with respect to Germany and Spain would be almost 25 per cent smaller. This scenario is less realistic, however, as it assumes that the share of low-competition products in Italian exports is almost 20 percentage points larger than the actual share.
43
Overall, this descriptive analysis offers suggestive elements in support of the conclusion that the “China shock” did play a significant role in moulding the development of Italy’s exports over the last two decades and in particular that, due to the country’s product specialization, it hurt the Italian exporting industry harder in comparison to its main euro-area competitors. Our rough calculations suggest that the relatively higher effects exerted by competition from China could explain part (at least one-tenth) of the under-performance on world markets relative to Germany and Spain.38 We will come back to the effects of Chinese competition in Section 5, where we document that they have been stronger for smaller exporters. Since these are over-represented in Italian exports relative to the other three euro-area countries, this is another reason why the figures presented here probably underestimate the relative severity of the “China shock” for Italy.
4.2 Quality
In the last decades, and especially following the massive entry into world trade of firms located in emerging economies (China, in primis, as discussed above), price-based competitive pressures have increased. In advanced countries, this has shifted the attention of commentators and policy-makers to non-price factors, to the extent that, given the wide and unbridgeable gaps in terms of production costs, firms located in these countries should have been increasingly forced to compete through factors such as brand, product quality and attractiveness of after-sale services offered to consumers.39
Measuring non-price competitiveness is however a difficult task. Indirect indicators, such as innovation propensity or capacity to attract FDI, confirm that Italy has not been particularly capable of improving its non-price competitiveness. This is, though, only indirect evidence that moreover refers to the whole economy and not only to exported goods. Therefore, we follow an alternative strategy and apply a methodology put forward in the trade literature to directly measure the quality of a country’s exported goods. Using the CEPII-BACI dataset at the HS-6 digit product classification level (excluding mineral products), we follow Khandelwal et al. (2013) and estimate an export quality parameter that is assumed to be a demand shifter in a CES demand function:
𝑞𝑝𝑜𝑑𝑡 = 𝜆𝑝𝑜𝑑𝑡
𝜎−1 𝑝𝑝𝑜𝑑𝑡−𝜎
𝑃𝑝𝑑𝑡1−𝜎 𝐸𝑝𝑑𝑡 (1)
where indices refer to product (𝑝), origin (𝑜) and destination country (𝑑) and year (𝑡); P is the aggregate price level and E is nominal expenditure. The intuition behind the demand shifter (𝜆) is that it explains differences in quantity sold in a given destination country holding prices constant. In other terms, a demand shifter captures all differences in prices holding sold quantities constant. Thereby it captures not only the true quality of the product but also all the features – other than the price level – that make a given product relatively more attractive to consumers. A second word of caution should come from the observation that this methodology infers quality only from the
38 We only address the “supply side” of the China shock, not taking into account China’s growing demand for imports.
Cappariello and Felettigh (2015) find that the boost exerted by the growth of China’s final internal demand was particularly relevant for German exports.
39 For Italy, see for instance De Nardis and Traù (2005).
44
demand side, so without specifying a model that may be accounting for firms’ quality choice from a supply-side perspective.
When the elasticity of substitution (σ), the quantity exported (q) and prices (p) are observed, equation (1) can be rearranged in the following way:
To retrieve an estimate of the demand shifter (λ), we can proxy the aggregate price index (Ppdt) and the expenditure (Epdt) with product-destination-year fixed effects (δpdt) and estimate the following equation using standard OLS:
ln 𝑞𝑝𝑜𝑑𝑡 + 𝜎 ln 𝑝𝑝𝑜𝑑𝑡 = 𝛿𝑝𝑑𝑡 + 휀𝑝𝑜𝑑𝑡 (2)
The estimated residuals from (2) are then combined with the elasticity of substitution to derive the quality of a single product sold in year t by a given country in a given destination market:
𝑙𝑛𝜆𝑝𝑜𝑑�� = 𝜀𝑝𝑜𝑑𝑡
𝜎−1.
We take advantage of the estimated elasticities of substitution 𝜎 (more precisely, pd) from Soderbery (2015) and estimate equation (2) using the CEPII-BACI data for quantities and prices. For simplicity, we assume a constant-elasticity-of-substitution demand system, and as such we disregard potential price variation across firms due to differences in mark-ups.
The quality parameters can then be aggregated by country of origin, using the share of each good in US imports as exogenous weights, to prevent that our measured quality estimate reflects compositional effects rather than actual quality within each product category.
In Figure 19 the average quality level for each of the four main euro-area countries in each year is plotted against the (log of) GDP per capita in destination markets. A few findings are noteworthy. First, in all four countries the quality of exports increases with GDP per capita of the destination market, which is in line with the idea that richer markets have a higher demand for high-quality goods (Linder, 1961). Second, Germany is the country with the highest average quality in all destination markets, followed by Italy, then France and lastly Spain. Third, while the relative ranking of the four countries is stable across destinations, the differences increase with the prosperity of the latter.
The average level of quality within each country however masks significant heterogeneity across sectors.
Table 10 reports the quality level relative to that of Germany (the highest in almost all sectors with only a few exceptions) for each exporter and each sector. Italy stands out for the high relative quality in footwear, textiles and other non-metallic mineral products. In these sectors the relative quality also shows an upward trend, which may be interpreted as suggestive evidence in favour of the hypothesis that Italian exporters of “traditional” products, which were especially exposed to price-based competitive pressures, have reacted by progressively raising the relative quality of their exports. On the other hand, the decrease in the relative quality of exports in sectors characterized by a high level of R&D and technological intensity (such as chemicals and pharmaceuticals and communication equipment) might be consistent with a gap in terms of innovation.
45
Figure 19 – Export quality and GDP per capita of destination markets (averages by origin, destination and year)
Source: authors’ calculations on CEPII-BACI data. The graph aggregates quality estimates at the product level up to the origin-destination-year level using fixed weights for the products. The same results are confirmed when regressing the export quality indicator on GDP per capita and controlling for different sets of fixed effects: the R2 is around 0.4, the coefficient of GDP per capita is positive and statistically significant, its level is significantly higher for Germany and Italy than for France and Spain.
Table 10 – Average quality of exports by sector relative to Germany (ratios; Germany=1)
Source: authors’ calculations on CEPII-BACI data.
To appreciate quality dynamics in a more concise way, we compute the percentage changes in average quality for Italy, France, Germany and Spain in the three different sub-periods (Tab. 11,
Average 0.65 0.65 0.65 0.72 0.76 0.75 0.47 0.51 0.45
46
upper panel).40 It must be borne in mind that these dynamics reflect both the changes in single products’ quality (genuine quality upgrading) and the reallocation of exported volumes across different varieties within a given product category (composition or selection effects). In all four countries the average quality of exports increased between 1999 and 2007: Italy recorded the largest growth (3.4 per cent) followed by Spain (3.3), Germany (3.1) and France (2.3). During the 2008-2009 recession there was a general decline, which was less intense in Germany (1 per cent) than in Spain (2.6), Italy (2.7) and especially France (3.2). This could be the result of a composition effect related to the substitution of higher quality foreign inputs with domestic inputs or to a stronger impact of the crisis on high-quality capital goods. Since 2010 the quality of exports has recorded small increases in Italy and Spain, an even smaller increase in Germany and a negligible reduction in France.
Table 11 – Changes in quality and estimated elasticities (percentage changes and estimation results)
Source: authors’ calculations on CEPII-BACI data. Standard errors in parentheses * p < 0.05, ** p < 0.01, *** p < 0.001.
How do these different quality changes map into the dynamics of aggregate exports? In order to answer this question, we run the following regression on an (origin) country-by-country basis so as to estimate country-specific elasticities of exported quantities to quality:
Product-time (δpt) and destination-time (δdt) fixed effects are meant to control for changes in demand conditions that are common across products or destinations. The results are shown in the lower panel of Table 11 (one column for each exporter). Our results do not show large differences in the estimated elasticities among countries; however, in all countries the elasticity of exports to quality is positive but smaller than unity, while the price elasticity is larger than one in absolute terms. These coefficients imply that the positive effects of quality improvement on exports could vanish rapidly if coupled with unfavourable price dynamics. 40 We compute average changes at the aggregate level in the following way. First, we compute for each product-
origin-destination the yearly percentage change (log difference) in our estimated quality parameter. Second, for each country we exclude observations below the 5th and above the 95th percentile in order to reduce the influence of outliers. Finally, we aggregate yearly percentage changes – across products – at the origin-country level using as weights the share of each good in US imports (an exogenous set of weights prevents our measured changes in quality from reflecting compositional effects rather than quality upgrading within each product category). As a robustness check we experimented with alternative weighting schemes (simple averages and quantities as weights); our results remain qualitatively unchanged, although the quantitative implications are somewhat different.
Taken together, the evidence discussed in this section provides useful insights into Italy’s observed relative export patterns. The average quality improvement of Italy’s exports41 (which was especially pronounced, in the 1999-2007 period, among “traditional” sectors) should be interpreted as having positively contributed to Italy’s relative export performance with respect to France and, to a lower extent, Germany. However, the cumulated effects of the increase in prices and the larger than unity price elasticity of exports acted as countervailing forces. Also Spain’s exports benefitted from a significant quality upgrading.
Admittedly, this conclusion is based on a single indicator which, as explained, is very likely mixing true quality with other factors able to shift demand. However, Benkovskis and Wörz (2013), who propose an indicator of competitiveness based on relative unit values adjusted for quality and taste, confirm the quality upgrading of Italian exports (see Fig. A3 in Annex A).42
4.3 Domestic demand
In addition to foreign demand, domestic demand may also affect a country’s export performance, especially in periods of sharp downturns such as the double recessionary phase recorded by Italy since 2008. Exporting can indeed be considered as a form of risk diversification through the distribution of sales across various markets with different business cycle conditions, thereby providing an opportunity to substitute sales at home by sales abroad when a negative demand shock hits the home market. On the other hand, foreign and domestic sales may be driven by similar factors (for instance, credit availability, which allows firms to expand production, regardless of its subsequent destination) and therefore be complementary. Results on the link between domestic demand and export dynamics, however, appear to be country-specific, time-specific and data-dependent.
Using national accounts data, Martinez-Mongay and Maza Lasierr (2009) find a significant negative impact of contemporaneous domestic demand growth on Spanish exports in the period 1970-2007, yet no significant relationship in the case of Italy, Germany and France. Giordano and Zollino (2016) confirm the lack of a significant role for domestic demand in Italy’s aggregate exports in the period 1993-2012. According to Esteves and Rua (2013), in Portugal lagged domestic demand developments have affected export performance significantly and negatively over the past three decades; moreover, this relationship is asymmetric, as it is stronger when domestic demand is falling than when it is increasing. A similar result was found by Bobeica et al. (2016) for a panel of euro-area countries.
Analyses based on firm-level data appear to be more clear-cut, although they are generally country-specific. Vannoorenberghe (2012) and Banco de España (2017) point to significant evidence for French and Spanish firms, respectively, that output variations on the domestic and export market are negatively correlated. Bugamelli, Gaiotti and Viviano (2015) argue that the
41 To be assessed against a level that is lower but close to that of Germany. 42 They start from a standard relative unit value indicator that is a weighted average of a country’s export unit values
relative to its competitors and adjust it by relative quality, estimated using relative prices, relative volumes and the associated elasticities of substitution. Relative unit values are obtained at the product-market level and are then aggregated through weights that take into account the elasticity of substitution between product varieties, as estimated by Broda and Weinstein (2006).
48
correlation may change over the cycle, as is the case for Italy. Using firm-level data from Banca d’Italia’s survey on industrial firms, they find a negative correlation in the 2001-2007 period, yet a positive one during both the “Great Trade Collapse” (2008-2010) and the subsequent sovereign debt crisis (2011-2012). They show that this result depends on the evolution of the share of firms with binding constraints to production capacity, liquidity and credit.43 In particular, before 2008 diffused capacity constraints, on the one side, and the large availability of credit, on the other, turned domestic and foreign sales into substitutes. Thereafter, when credit constraints and liquidity problems became more intense and widespread, domestic and foreign sales started to co-move, turning the overall correlation to a positive value.
In conclusion, developments in domestic demand may contribute to explain the over-performance of Spanish exports relative to Italy after 2010. Both countries experienced a stark contraction in domestic demand (around 10 per cent in cumulated terms between 2010 and 2013), and the empirical evidence suggests that, while this helped Spanish exports, it penalized those of Italy.
5. Putting the pieces together
In this section we offer a unified framework to evaluate the relative importance of all the determinants discussed so far and their possible interactions. In the specific case of Italy, our aim is to assess how relevant structural features such as firms’ size or exposure to Chinese competition are with respect to standard macro determinants and whether, possibly more interestingly, these structural features affect the way aggregate exports respond to macro shocks.
The role of micro heterogeneity to understand aggregate outcomes has been recently gaining increasing attention in the economic literature.44 In the trade literature, the empirical works of the late 1990’s were followed by the seminal theoretical contributions of Melitz (2003) and Bernard et al. (2003). More recently, among many other papers, Barba Navaretti et al. (2017) show a direct link between micro heterogeneity and macro trade performance. Using the CompNet dataset, which contains information on the productivity distribution across firms for a panel of 16 European countries and 21 manufacturing industries, they find a positive effect of the skewness of the firm productivity distribution on aggregate export performance, meaning that, in line with the “happy few” story (Mayer and Ottaviano, 2011), a country’s export competitiveness is crucially affected by its most efficient firms.
Accounting for firm heterogeneity also helps explain why prices and therefore quantities do not fully adjust to exchange-rate movements (Campa and Goldberg, 2005, among many others). This incomplete exchange rate pass-through, which from a macro perspective is key to forecast the reaction of exported volumes to fluctuations in the relative value of a currency, calls for studying how firms change their export prices in the face of shocks to exchange rates (or, equivalently,
43 Several studies investigate the role of financial constraints on firms’ exports or foreign direct investment (among
those using data on Italian firms, see e.g. Del Prete and Federico, 2014 and De Bonis et al., 2014). We refer the reader to Cristadoro and Federico (2015) for a summary of this literature and an overall assessment of the impact of the credit crunch on exporting activity in Italy.
44 As a very general example, see the literature on “granularity” showing that aggregate economic outcomes frequently relate to the behaviour of few, large firms (Gabaix, 2011).
49
costs). Recent papers using firm-level data connect the relatively low sensitivity of aggregate exported volumes to exchange rates to the role of firms with some sort of market power.45 Berman, Martin and Mayer (2012) find that highly productive French exporters increase their mark-up in response to a depreciation significantly more than less productive firms: this implies a lower exchange rate pass-through and a muted effect on quantities. The same relationship between the exchange rate elasticity and productivity is found by Berthou and Dyhne (2017) on more aggregated and cross-country CompNet data. They conclude that low aggregate price elasticity could be the result of high concentration of aggregate exports amongst large, high-productivity firms, which display a lower elasticity to the exchange rate. On Belgian firm-level data, Amiti, Itskhoki and Konings (2014) find that more-import intensive exporters, which are usually the largest and most productive firms even amongst exporters, have low exchange rate pass-through into their export prices, since they face offsetting effects on their marginal costs;46 this low reactivity to developments in exchange rates is further reinforced by the fact that these exporters also have high export market shares and hence large mark-ups. On the basis of these results, they rationalize aggregate evidence of low exchange rate pass-through with a composition effect, whereby large and import-intensive firms account for a high share of total exports. Also multi-products firms may be less sensitive to exchange-rate movements: in response to negative shocks, these firms pull out of the export market their least profitable products and increase their focus on “core” products, i.e. those where they presumably have larger cost advantages and market power (Dekle, Jeong and Kiyotaki, 2015; Mayer, Melitz and Ottaviano, 2016).
The impact of competitive pressures stemming from low-wage countries is also different across firms. Bernard, Jensen, and Schott (2006a) find that the effect of competition from low-wage countries is indeed weaker on high productivity and relatively more capital-intensive plants. In a companion paper, Bernard, Jensen, and Schott (2006b) find that the probability of plant death is smaller for more productive plants. According to Bloom, Draca and Van Reenen (2015), the negative impact of import penetration from China on employment is stronger for low-tech firms, while the positive impact on innovation and TFP-growth is stronger for high-tech enterprises. For Italy, Bugamelli, Fabiani and Sette (2015) find that growing imports from China have had a sizable negative effect on the dynamics of prices charged by Italian firms and that this effect is larger, in absolute terms, for low-productive firms in low-skill sectors.
Lastly, as recalled in section 4.3, Bugamelli, Gaiotti and Viviano (2015) explain the mixed empirical evidence on the correlation between domestic sales and exports with firm heterogeneity in terms of productive capacity and financial structure.
In the remainder of this section we undertake two alternative empirical strategies, along the lines suggested in the literature. First, we construct a country-sector panel referring to the four main euro-area economies with a twofold aim: a) explore the role of both standard determinants (external demand and price competitiveness) and additional explanatory variables; b) assess any structural differences in the elasticities of exports across countries and sectors. Second, we use firm-level data
45 Short of micro data, yet using highly disaggregated product and destination market trade data, Bugamelli and
Tedeschi (2008) find that exchange rate pass-through is indeed highly incomplete for sales by oligopolistic industries.
46 Namely, imported inputs act as a “natural hedge” against exchange rate fluctuations.
50
on the universe of Italian exporters to better gauge the role of firm characteristics in explaining different export elasticities and outcomes.
5.1 Country-sector panel regressions
The empirical strategy we adopt for our country-sector panel regressions follows an incremental approach. Inspired by the previous descriptive evidence in the paper, we first estimate dynamic country-sector export equations à la Goldstein and Kahn (1985) in which we include only the two standard drivers of exports, REERs and potential demand. Then, we augment the regressions with additional determinants, namely competition from China, product quality, size composition and proxies to capture domestic developments.
The first equation we therefore estimate is the following:
tiitjitjitji cpotdemaREERaa ,,,2,,10,,exp DDD (3)
where all variables are expressed in logs and D indicates first differences, expi,j refers to current-value exports of goods of country i in sector j, REERi,j is the real effective exchange rate of country i and sector j, potdemi,j is the potential demand of goods that country i-sector j faces, ci are country fixed effects, which capture differences in export growth rates due to time-invariant country characteristics.47 In a set of alternative specifications we also include time fixed effects (yt), which account for yearly common shocks, and sector fixed effects (sj), which account for time-invariant sector features, although, as we shall see, at the expense in some cases of eroding the statistical significance and/or magnitude of the coefficients of the exports determinants. The countries are Italy, France, Germany and Spain, while the sectors included are 12 manufacturing branches defined by the 2002 Nace Rev.1.1 classification, consistent with the HS1996 classification of products, in turn available for a sufficiently long time period,48 and the period considered is 2003-2015, due to the availability of data.
Exports of goods at current prices are taken from the CEPII-BACI dataset (converted from US dollars into euros using the average annual nominal bilateral exchange rate); they are slightly different to the data underlying Table 5, which refers to all, and not only manufacturing, goods and is based on Eurostat and national IMTS sources. The choice of the CEPII-BACI dataset was dictated both by its historical depth, which avoids having to splice different data sources, and by internal consistency within this set of regressions since, as we shall see, several variables are constructed using this database.
47 This dynamic specification is derivable from a specification in levels in which country-time (which capture supply
shocks) and sector fixed effects are included. 48 The manufacturing sectors herein considered are: Food, Beverages and Tobacco (DA); Textiles and Textile Products
(DB); Leather, Leather and Footwear (DC); Wood and Products of Wood and Cork (DD); Pulp, Paper, Paper, Printing and Publishing (DE); Chemicals and Chemical Products (DG); Rubber and Plastics (DH); Other Non-Metallic Mineral (DI); Basic Metals and Fabricated Metal (DJ); Machinery, Nec (DK); Electrical and Optical Equipment (DL); Transport Equipment (DM). Coke, Refined Petroleum and Nuclear Fuel (DF) is dropped due to the fact that it is a clear outlier; this sector anyhow accounts for under one percent of total goods exports for all four countries on average over the 1999-2015 period. REER data for Manufacturing, Nec; Recycling (DN) are unavailable, so this sector too is dropped from the regressions, but this is anyhow a miscellaneous, residual sector.
51
The baseline REER measure is the sector-level REER produced by Sato et al. (2015),49 to our knowledge currently the most comprehensive and accurate sectoral indicator available (albeit only as of 2001), employed also, for example, in Chen, Milesi-Ferretti and Tressel’s (2013).50 It is defined such that an increase signals a loss of price competitiveness, in order to guarantee comparability of signs with the existing trade literature. Similarly to the Bank of Italy’s total-economy REER, discussed in Section 3.2, this indicator is deflated using PPIs. However, it is constructed vis-à-vis 28 trading partners (against 61 for the Banca d’Italia indicator).51
The potential demand variable is constructed using CEPII-BACI data for each country-sector-year cell and is based on three different sets of import weights: a) average 1998-2000 weights; b) average 2005-2007 weights and c) a series obtained by splicing the previous two. We chose to fix the weights at the beginning of the period considered (case a) or at its midpoint (case b) in order to reduce a potential reverse causality bias between export and potential demand developments which could stem from the time-varying rolling import weights employed in Section 3.1.
Equation (3) is estimated using standard OLS and robust standard errors.52 Results are displayed in Table 12. The lag structure of the explanatory variables is determined by selecting the number of lags that maximises the fit of the model in terms of adjusted R-squared and that guarantees statistical significance of the corresponding variable. Amongst the three possible indicators of potential demand, the third “spliced” indicator is selected as, ceteris paribus, it guarantees a higher model fit. Results are anyhow all confirmed when the other two indicators are adopted.
Column (1) depicts results when only country dummies are included. Both REER dynamics and changes in potential demand are highly significant. The signs of the estimated coefficients are in line with expectations and are consistent with previous total-economy findings discussed in Giordano and Zollino (2016; 2017). Indeed, goods exports’ dynamics are found to be negatively associated with an appreciation of the REER with a one-year lag and positively correlated with contemporaneous changes in potential demand. The coefficient of the latter is generally around unity, whereas the coefficient of the REER is slightly smaller than that in most of the existing literature, since it is well below unity. Country fixed effects are expressed relative to Germany. Over the whole period and controlling for standard determinants, as well as for sector and year fixed effects, average goods export growth rates were lower in Italy and, even more so, in France 49 Data are available at: http://www.rieti.go.jp/users/eeri/en/. This variable is available for the Nace Rev.2 2007
classification: similarly to other variables broken down according to this classification, in order to obtain the Nace Rev.1.1 2002 disaggregation, which is less disaggregated, weighted averages of the sectoral variables were taken, where the weights were given by the country-specific time-varying value added shares, computed on Eurostat data, of each Nace Rev.2 2007 sector in the more aggregated Nace Rev.1.1 2002 sector.
50 The sectoral REER indicator produced by Patel, Wang and Wei (2017) and discussed in Box C is available only until 2009 and therefore cannot be used in these regressions.
51 Another difference with respect to Banca d’Italia’s REERs and, more generally, to standard total-economy REERs is that Sato et al.’s (2015) indicators are constructed using only (simple) export weights. Generally and in order to appraise a country’s total international competitive position, REERs are based on both import and export weights. In particular, export weights are double in the sense that, in addition to direct competition between exporters and domestic producers in a particular export market, they also take into account the competition between exporters of two different countries in a third market (see Felettigh et al., 2016 for details). Sato et al.’s (2015) REERs do not include the third-market competition component of export weights nor do they include import weights. However, in a robustness analysis, partially reported in Table A6 in Annex A, we check and show that all results discussed in this section hold across differently deflated and weighted total-economy REERs.
52 All results reported in this section are broadly robust to clustering standard errors by country-sector. The results and the robustness tests not reported in the Tables are available upon request.
than in Germany, whereas the Spain country dummy, although statistically insignificant, displays a positive sign. These results concur with the descriptive evidence concerning developments in current-price aggregate goods exports provided in Section 2.1.
Table 12 - The standard determinants of exports (dependent variable: log-differences of goods exports; estimation period: 2003-2015)
Source: authors’ calculations. OLS estimates with White’s correction for heteroscedasticity. * p<0.10, ** p<0.05,*** p<0.01. Standard errors are in small font and in brackets.
By including sector fixed effects (not reported for sake of brevity; column 2) results are practically unchanged. The additional inclusion of year dummies (column 3), however, leads to a decrease in the magnitude of coefficients of both the REER and potential demand (in absolute value); the REER also loses significance at conventional confidence intervals. This may reflect the low variance in our panel, which includes only four countries and 12 sectors.
Column (4) investigates any structural difference in the baseline relationships across countries, by including the interaction of the two determinants with country dummies. Over the whole period Spanish exports of goods appear to be more reactive to changes in price competitiveness than the average (this is also the case for Italy when alternative total-economy REERs are employed; see Table A6 in Annex A). Moreover, Italy’s export dynamics display a greater elasticity to changes in potential demand, whereas France records a lower sensitivity to the same variable (the latter result is obtained when alternative REERs are employed, as reported in Table A6). It is noteworthy,
however, that in this regression and relative to column (3) the negative coefficients of the French and Italian country dummies become, respectively, smaller and larger.
Finally, in column (5) we interact the country fixed effects with a “post-2010” dummy: after 2010, and controlling for the two determinants, Spain marked higher export growth rates to Germany, Italy displayed broadly comparable dynamics and France continued to underperform.
These results may suffer from an omitted variable bias. Indeed various cross-country empirical analyses have shown how, over recent years, standard determinants such as price competitiveness and foreign demand have a low and decreasing explanatory power for export dynamics of advanced European economies (see, amongst others, Di Mauro and Forster, 2008; Bayoumi, Harmsen and Turunen, 2011; Bricogne et al., 2012). Moreover, a specific issue arises concerning the documented negative link between export and REER dynamics: since exports are expressed in value terms, the relationship found in the data could be due either to a “quantity/actual competitiveness effect”, according to which a REER depreciation boosts the volume of exports, or to a “price effect”, in the case of incomplete pass-through and pricing-to-market, due to market power of the exporting firms. Indeed, price developments depend upon both cost dynamics and the variable mark-ups applied by firms, which are in turn a result of their market power. This implies that prices may rise as a result of the increase in market power, for example due to improved product quality, without jeopardizing firms’ competitiveness and export performance; vice-versa, price declines that drive profit margins to unsustainably low levels may endanger firm survival and not be linked to improvements in price competitiveness. A recent study by Amici, Bobbio and Torrini (2017), focused on ten early joiners of the euro area over the period 2000-2014, provides evidence of profit margins indeed significantly and positively driving a country’s export performance, even when traditional PPI- or ULC-deflated REERs (and potential demand) are controlled for. This study too therefore suggests that “standard” determinants are not sufficient to fully explain export developments.
We therefore augment equation (3) with additional potential drivers of exports discussed in Section 4: competition from China (compChina), a measure of quality change (Dquality), which can be considered as an indirect measure of market power and the share of small firms in each sector (share 0-49). Capacity utilization (caputil) and financial constraints (finconstr) are also included, to capture the channels through which developments in domestic demand may affect export growth. The resulting full specification is the following:
tiitjitjiji
tjitjtjitjitji
cfinconstracaputilasharea
qualityacompChinaapotdemaREERaa
,,,7,,62005,,5
,,4,3,,2,,10,,
490exp
DDDD (4)
In columns (1) to (4) of Table 13 we depict results in which we add each additional variable incrementally to specification (3), yet only with country fixed effects included; in columns (5) to (8) results with the full set of fixed effects (that is, also sj and yt) are reported.
Competition from China is proxied by the share of exports of China to all destinations for each sector and year, and is constructed on CEPII-BACI data and is therefore the same across all four countries under investigation. Our results point to this factor exerting a significant drag on export growth (column 1). This finding is robust to alternative measures of competition from China as well as to the use of total-economy REERs. The inclusion of sector and year fixed effects (column 5), however, erodes the statistical significance of the Chinese competition effect.
54
Table 13 - Exports and additional determinants (dependent variable: log-differences of goods exports; estimation period: 2003-2015)
Source: authors’ calculations. OLS estimates with White’s correction for heteroscedasticity. * p<0.10, ** p<0.05,*** p<0.01. Standard errors are in small font and in brackets.
In column (2) we include a measure of product quality at the country-sector-year level, which is based on the measure discussed in Section 4.2 aggregated up to the sectoral level using country-specific weights (given by the country average over the entire period).53 Higher growth in product quality is found to be significantly associated with faster export expansion. When product quality is controlled for, competition from China becomes only marginally significant – possibly because quality upgrading is generally associated with less fierce competition from China – but all other previous findings hold. The statistical significance of the quality variable is retained even when sector and time fixed effects are included, as shown in column (6).
In columns (3) and (7) we add the share of small firms (appraised in employment terms) in each country and sector. Although it is very hard to construct a satisfactory measure which captures the role of firm size using macro data, we attempt this endeavour by exploiting Eurostat’s Structural Business Statistics database, which provides information on the number of firms in different size classes by manufacturing sector and country, and assume that the size composition of all firms in
53 Our results are robust to five alternative indicators. Three are based on the elasticity of substitution taken from
Broda and Weinstein (2006), whereas the two others are constructed using the elasticity of substitution of Soderbery (2015). Two different sets of weights are employed to aggregate the measures up to the Nace Rev.1.1 2002 sectoral level of disaggregation, other than that described in the text: time-varying, country-specific weights at time t-1 and time-varying U.S. weights, taken as an “exogenous” benchmark country. These quality measures are meaningful only in first log-differences, whereas they should not be used in levels, unless compared with a benchmark country.
manufacturing is similar to that of exporters. Owing to the patchiness of these data, we select a year for which missing values were few and which represents a mid-point in the period under analysis, namely 2005 (this notwithstanding, the inclusion of the variable leads to the number of observations dropping from 624 to 559). We here define “small” firms as those with 0-49 employees, but results are robust also to 0-9 and 0-19 size classes. In spite of these data limitations, and although this variable appears not to be significant per se on average for the four countries, it presents the expected negative sign.54 Moreover, it is noteworthy that the Italian country dummy (and only this country’s dummy) loses statistical significance when the share of small firms is introduced, suggesting the importance of this structural feature for Italy’s external performance.
Capacity utilization is based on the monthly European Commission Business Survey of manufacturing firms; it is the average current level of capacity utilization in percentage points reported by firms within each sector. From the same survey we also extract an indicator of financial frictions, namely the share of firms which report that financial factors are an obstacle to their economic activity. We then define a dummy taking value 1 if the share is above the 90th percentile of the distribution of this variable across the four countries, 0 otherwise.
Results reported in columns (4) and (8) show that, all other things equal, lower capacity utilization is associated with higher export dynamics (with a year’s lag), suggesting that on average a weaker domestic cycle encourages firms to sell abroad.55 Moreover, we find a significant negative role of financial constraints in explaining export dynamics: by limiting firms’ productive activity, financial restrictions hinder also foreign sales. These results are in line with the evidence discussed in Section 4.3.
Finally, we explore the presence of possible interactions between the two standard determinants (the REER and potential demand) and firm size, which we add to the richest specification defined thus far.
As shown in column (1) of Table 14, the higher the share of small enterprises in a country and sector, the higher the sensitivity of export dynamics to REER movements, as predicted by the microeconomic literature. Moreover, the higher the share of small firms the higher the reactivity to changes in potential demand. All other previously discussed findings hold.
In column (2) we also include the interactions of the REER and potential demand with the country dummies. This wipes out the interactions with the share of small firms, and Spain and Italy are confirmed to be the two countries with a high elasticity of exports to the REER and to potential demand, respectively. The result is unsurprising considering that, according to our data and on average across all manufacturing sectors, Spain and Italy display a higher share of enterprises with less than 50 employees (47 and 50 per cent, respectively) compared with France and Germany (28 and 22 per cent). Finally, controlling for all explanatory variables and interactions discussed thus far, we find that after 2010 Italy’s export performance was still broadly comparable to that in Germany, whereas the interaction terms between the post-2010 period and the other two country dummies are not statistically significant anymore.
54 When the share of small firms is included in the baseline regression with only the two standard determinants and no
sector and year fixed effects, it is marginally significant and with the expected negative sign. 55 These findings are confirmed when the deviation of the degree of capital utilization relative to its country-sector
2002-2015 average is employed in lieu of the absolute level of capital utilization.
56
Table 14 - Exports and some interactions between determinants (dependent variable: log-differences of goods exports; estimation period: 2003-2015)
Source: authors’ calculations. OLS estimates with White’s correction for heteroscedasticity. * p<0.10, ** p<0.05,*** p<0.01. Standard errors are in small font and in brackets.
(1) (2) (3)
ΔREER(t-1) 0.088 0.124 0.118
(0.13) (0.15) (0.15)
ΔREER(t-1)*Share 0-49 -0.380* -0.155 -0.167
(0.22) (0.38) (0.38)
ΔREER(t-1)*Spain dummy -0.445* -0.407
(0.23) (0.25)
ΔREER(t-1)*France dummy -0.127 -0.107
(0.13) (0.14)
ΔREER(t-1)*Italy dummy -0.097 -0.034
(0.19) (0.19)
ΔPotdem(t) 0.761*** 0.811*** 0.820***
(0.04) (0.04) (0.04)
ΔPotdem(t)*Share 0-49 0.132** 0.036 0.033
(0.06) (0.08) (0.08)
ΔPotdem(t)*Spain dummy 0.011 0.003
(0.04) (0.04)
ΔPotdem(t)*France dummy -0.064 -0.07
(0.05) (0.05)
ΔPotdem(t)*Italy dummy 0.065* 0.054
(0.04) (0.04)
CompChina(t) 0.016 0.022 0.027
(0.07) (0.07) (0.07)
ΔQuality(t) 0.248*** 0.217*** 0.213***
(0.06) (0.05) (0.05)
Share 0-49 -0.027 -0.028 -0.026
(0.03) (0.03) (0.03)
Caputil(t-1) -0.001** -0.001* -0.001*
(0.00) (0.00) (0.00)
Finconstr(t) -0.012** -0.013*** -0.013***
(0.00) (0.00) (0.00)
Spain dummy 0.009 0.013 0.010
(0.01) (0.01) (0.01)
France dummy -0.013*** -0.009* -0.012*
(0.00) (0.01) (0.01)
Italy dummy -0.008 -0.009 -0.013
(0.01) (0.01) (0.01)
Post-2010 dummy*Spain dummy 0.007
(0.01)
Post-2010 dummy*France dummy 0.005
(0.01)
Post-2010 dummy*Italy dummy 0.010*
(0.01)
Year fixed effects YES YES YES
Sector fixed effects YES YES YES
Adjusted R-squared 0.912 0.914 0.914
N 552 552 552
57
5.2 Firm-level panel regressions for Italy
To better bridge the macro-micro evidence we estimate export growth equations at the firm level using detailed data on the universe of Italian exporters56 for the period 2000-2014 made available by Istat. In particular we start from the following equation:
where D indicates log differences, Dexpi is the rate of growth of firm i’s nominal exports, DPotdemi the rate of growth of the potential demand for its exports, Dreeri the dynamics of its real exchange rate and Chinasharei measures firm i’s exposure to Chinese competition. This specification is enriched with industry-time fixed effects (jt) and a vector of time-varying firm controls (Xit) to account for structural differences among exporters.
The firm-specific measure of potential demand growth is constructed in the following steps. First, we define the firm-specific mix of exported products (p), at the 6-digit level of the HS classification, to destination market (d), as that observed in the first year (t=0) the firm enters the sample. Second, for any product-destination mix (p,d) we compute the growth rate (log difference) of country d’s imports of product p (∆ 𝐼𝑀𝑃𝑝𝑑𝑡), excluding those from Italy. Finally, we aggregate these growth rates across all the product-destination pairs reached by the firm in the initial year (t=0), using as weights their share in the firm’s exports at the beginning of the period (𝜔𝑖𝑝𝑑0):
∆ 𝑃𝑜𝑡𝑑𝑒𝑚𝑖𝑡 = ∑ 𝜔𝑖𝑝𝑑0(∆ 𝐼𝑀𝑃𝑝𝑑𝑡)
𝑝,𝑑
where the choice of keeping the product-destination mix constant is meant to assure that the potential demand shock is exogenous to the firm, i.e. it does not reflect the product-mix adjustment over time.
The firm-specific real exchange rate variable is constructed as follows. First, for any destination country (d) we compute the bilateral real exchange rate as the product between the nominal exchange rate and the relative producer price index: 57
𝑟𝑒𝑟𝑑,𝑡 = 𝑒𝑑,𝑡 ∗𝑃𝑃𝐼𝑡
𝐼𝑇𝐴
𝑃𝑃𝐼𝑡𝑑
where an increase signals an appreciation of the real exchange rate, therefore implying a loss in price competitiveness. Second, we define the set of countries (d) served by firm i in the first year it enters the sample (t=0). Finally, we aggregate the destination-specific real exchange rate across all the destinations reached by the firm in the initial year, using as weights their share in the firm’s exports at the beginning of the period (𝜔𝑖𝑑0):
56 The universe is actually restricted to the set of firms that provide information on the breakdown of foreign sales by
product. According to statistical reporting requirements, this information is available for all firms that export annually more than 250,000 euros to EU markets and more than 1,000 euros to extra EU markets. Figure A4 in Annex A compares the growth rate of exports in the sample with that of total exports.
57 Such measure, that only looks at domestic prices of local producers on each destination d, is meant to proxy for the overall price pressures on that market, including those stemming from third-country exporters.
58
𝑟𝑒𝑒𝑟𝑖,𝑡 = ∑ 𝜔𝑖𝑑0 ∗ 𝑟𝑒𝑟𝑑,𝑡
𝑑
Notice that this variable is included in our regressions with a lag, to take into account the fact that the real exchange rate fluctuations might affect exports with some delay.
Finally, the firm-specific measure of competition from China is constructed combining information on the firm’s product-mix and China’s global market share in the following way. First, for each product and year we use the CEPII-BACI dataset at the HS 6-digit level to compute China’s world market share, i.e. the value of China’s exports as a fraction of world exports, for that product (Chinasharep,t). Second, we observe the firm-level product-mix (𝑃𝑖0) in the first year the firm enters the sample (𝑡 = 0), irrespective of the destination of its exports. Finally, we aggregate the values of China’s market share across all the products included in Pi0, using as weights the composition across products of the firm’s exports observed at the beginning of the period (𝜔𝑝0):
𝐶ℎ𝑖𝑛𝑎𝑠ℎ𝑎𝑟𝑒𝑖𝑡 = ∑ 𝜔𝑝0(𝐶ℎ𝑖𝑛𝑎𝑠ℎ𝑎𝑟𝑒𝑝𝑡)
𝑝 ∈ 𝑃𝑖0
We estimate equation (5) weighting each observation by the firm’s export level in the previous period; this is aimed at estimating elasticities that reflect the impact of each determinant on aggregate export flows rather than on average firms responses. Results are reported in Table 15.
In the first column, we include in the regression only the standard export determinants and industry-time fixed effects. The estimated coefficients of the two variables that capture potential demand and competition from China are highly significant and have the expected sign: firms’ exports grow with potential demand (with an elasticity of 0.2), while they decrease with a larger exposure to competitive pressures from China (a 10-percentage point increase in Chinese market share reduces export growth by 0.6 percentage points); the correlation with the real exchange rate is statistically not different from zero. When firm-level controls are included (column 2), the results barely change: the coefficient of the Chinese export share is slightly smaller and the elasticity of exports to the real exchange rate turns negative, despite remaining not significant.
How sensitive are these results to the business cycle? To answer this question, we add to our model the interaction between the standard export determinants and three dummies, one for each separate sub-period (2001-2007, 2008-2010, and 2011-2014).
Results are shown in columns (3) to (5) of Table 15, where each column reports the interaction referred to a specific period. The coefficients of potential demand and of the Chinese share have the same sign as before but different magnitudes across periods. The estimated elasticity to potential demand is always positive and statistically significant and is higher during the 2008-2010 period. As we argued in previous sections using aggregate data, the negative effect of Chinese pressures is strong and significant only in the 2001-2007 period, whereas it appears not to have played any significant role thereafter. The elasticity of aggregate exports to real exchange rate fluctuations is negative and statistically significant only when interacted with the pre-2007 dummy, hence confirming the evidence, discussed in the previous sections, that the loss in price competitiveness before 2007 contributed to slow down export dynamics.
59
As a final exercise we augment equation (5) with interaction terms aiming at capturing firm heterogeneity in response to macro shocks. In particular, we interact potential demand, the real exchange rate and China’s share with four size-class dummies (where the size classes are 0-19, 20-49, 50-249 and more than 250 employees).
Columns (6) to (9) of Table 15 show the results. A clear pattern emerges: the elasticity of exports to potential demand increases monotonically with firm size, whereas the effect of the exposure to competition from China and the reactivity to real exchange rate changes decrease with firm size, as suggested in the literature.
Overall, the results support the claim that Italy’s productive structure, centred around a large number of micro and small firms, exerts a drag on aggregate export performance: smaller firms are less capable of defending their market shares and suffer more from exchange-rate appreciations and stronger competitive pressures by competitors located in low-wage countries such as China.
Source: authors’ calculations. The model is estimated using weighted OLS, where the weights are equal to firm’s exports in t-1. The vector of firm controls includes: export intensity (exports divided by total sales), log of output per worker measured at t-1, log of total sales measured at t-1, log change in domestic sales, log of firm age and a dummy for exiting firms. Clustered standard errors in parentheses at industry (Nace 4 digit) level. Significance: *** p<0.01, ** p<0.05, * p<0.1.
To gauge the impact of Italy’s large number of micro and small exporters on export dynamics we perform some counterfactual exercises whereby we assume a productive structure that is more balanced toward medium-sized firms. We use the coefficients estimated in columns (6) to (9) of Table 15 in the following way. We start by computing each firm’s predicted export growth and then we aggregate these values across firms using observed export shares:
∆𝑒𝑥𝑝𝑡 = ∑ ∆𝑒𝑥𝑝𝑖𝑡
𝑖
𝑒𝑥𝑝𝑖𝑡−1
𝑒𝑥𝑝𝑡−1
To account for the fact that in our sample micro and small firms are under-represented because of the previously described statistical thresholds, we rescale firm-level export shares within each size class so as to match the aggregate export share distribution reported in Table A3 in Annex A.
We then build two alternative counterfactual exercises. In the first we assume that there are no Italian exporting firms with 0-19 employees and re-attribute their yearly share of exports to firms
with 20-49 employees. In other words, since in 2003 (taken here as an example) firms in the 0-19 class accounted for 17.2 per cent of aggregate exports and those in the 20-49 class for 12.8 per cent, we assume that the share of the former group goes down to zero while that of the latter moves up to 30 per cent. In the second exercise we impose a more drastic change in the productive structure and assume that all exporters with 0-49 employees switch to the 50-249 class. Under both scenarios, we re-compute aggregate export growth applying the alternative set of weights to the baseline firm-level predicted values. We estimate that in 2001-2014 the yearly growth rate of aggregate exports would have been on average 0.2 percentage points higher than in the baseline in the first scenario and 1.2 points in the second scenario. Considering the significant coefficients in column (8) of Table 15, this boost to aggregate exports is mostly the result of medium-sized firms’ higher ability to keep pace with foreign demand. These figures amount to between 6 and 40 per cent of the actual growth gap of Italian exports with respect to Germany before the crisis (almost 3 percentage points per year, as reported in Tab. 4).
6. Conclusions
Motivated by the debate on Italy’s structural weaknesses and persistently low GDP and productivity growth, this paper focuses on the role of exports, in particular of goods exports, in a period (1999-2016) in which the European integration process was fairly consolidated. The paper addresses the following two closely related questions. What are the main factors that explain Italy’s broadly less favourable export performance relative to the other main euro-area countries observed in the overall period? How should we interpret the signs of recovery since 2010: are they the result of a successful structural adjustment of Italian firms or rather simply due to more favourable, cyclical and therefore temporary factors?
Considering exports of goods at current prices as a benchmark indicator (to be preferred to exports at constant prices, because of methodological issues in the estimation of deflators), a clear picture emerges. Italy’s exports have significantly underperformed vis-à-vis Germany and Spain throughout the 1999-2016 period, while clearly over-performing vis-à-vis France (with the exception of the “Great Trade Collapse” years, when the decline in Italy’s exports was exceptional in comparative terms).
Standard determinants – price competitiveness and external demand – can explain part, but not all, of these relative patterns. Italy’s price competitiveness, measured by the official Banca d’Italia PPI-based real effective exchange rate, although marginally improving over the entire period, worsened vis-à-vis France and Germany mainly as a result of an overall faster rise in Italian prices, but improved vis-à-vis Spain. Growth in external demand was instead broadly in line with that of France and Germany, and higher than that of Spain.
In search for additional candidate explanations, two main hypotheses seem to find support in our analysis. The first is that the competitive pressures exerted by China and other emerging economies were considerably larger for Italy than for the other countries: our rough estimates suggest that this exposure could explain at least one-tenth of Italy’s under-performance on world markets relative to Germany and Spain. We find some evidence of quality upgrading of Italian
61
exports, possibly in response to these pressures; however, this process does not seem to have been significantly more pronounced than in the other main euro-area competitors.
The second hypothesis is that the composition of Italy’s productive structure, mainly centred on small and micro firms, acted as a drag on aggregate exports. Indeed, while medium-sized and large firms recorded a much smaller decline in export market shares until 2007, and were more resilient during the post-2010 period, small companies suffered a loss of about 50 per cent in the overall period.
All in all, we argue that the unsatisfactory performance of Italian aggregate exports in the pre-crisis period (1999-2007) is the result of the interplay between three factors. The first is the significant appreciation of the real effective exchange rate for Italy, which compounded unfavourable developments of relative prices and a nominal appreciation that was stronger than that of its three main competitors, owing to the different composition of trading partners. The second factor is the specialization in productions that were particularly exposed to the increasing weight of low-wage countries, China in particular, on world exports. The third factor is the relatively large number of small exporters, which compounded the previous two. Indeed, micro and small firms struggled in defending their exports in the face of the exchange-rate appreciation, in keeping pace with potential demand and, finally, in successfully facing competition from low-wage countries.
As regards the second main question, that is to what extent the recent improvement in Italy’s export patterns can be interpreted as a signal of a successful structural adjustment, the evidence is fairly mixed.
Among the positive signals, the resilience of Italy’s market share on world trade since 2010 stands out in sharp contrast with the steep decline experienced since the late Nineties. Italian exports have been growing at a slightly faster pace than the demand stemming from destination markets, and have managed to reduce the negative growth differential vis-à-vis German exports significantly. In contrast to the past, when the under-performance of Italy’s exports was rather widespread across industries, the recent developments point to a more heterogeneous picture, with particularly positive dynamics in some sectors (machinery, motor vehicles, pharmaceutical products, food and beverages). This may indicate that the sectoral specialization has shifted towards sectors that are less exposed to competitive pressures stemming from Chinese products, as well as towards productions that are particularly effective in activating domestic value added.
However, recent patterns were sustained by the recovery in price competitiveness and by the positive contribution of sectoral specialization, with cyclical or temporary factors playing a role in both cases: the former was mainly helped by the nominal depreciation of the euro, although some relative-price adjustment vis-à-vis Germany was also at play, while the latter reflected favourable, possibly short-run, developments of world demand in some of Italy’s specialization sectors. These positive effects were partly counteracted by the cyclical weakness of domestic demand, also in connection with tight financial constraints.
On the back of these overall findings, what is to be expected in the near future? Forecasting the path of export determinants clearly goes beyond the scope of this paper. We nonetheless provide a few considerations that might be relevant for the outlook of Italy’s external performance.
62
As far as price competitiveness is concerned, our work points to the role not just of the nominal exchange rate but also of relative prices within the euro area, thus relating to the discussion on the adjustment of area-wide macroeconomic imbalances. The dynamics of relative prices reflect not only changes in the cost of labour and of the other production factors, but also productivity growth and quality improvements. Whereas the quality of Italy’s exports has encouragingly grown over time, although no differently to that in the other main euro-area countries, sluggish productivity appears to be a long-run trait of the Italian economy (Giordano, Toniolo and Zollino, 2017). In this light, price competitiveness gains and the resulting boost to foreign sales would be larger if Italy’s productivity growth returned to rates comparable to those observed in its main competitor countries.
The geography mix might continue to have a mildly negative impact on Italy’s exports, although there are reasons to believe that it will be more attenuated than in the past: the recent slowdown in world trade has affected all the main regions in the world, and smaller divergences are expected between trade growth in emerging markets – in which Italian exporters are relatively less active – and in advanced markets. Moreover, Italy’s trade linkages with the UK are weaker than for the other main euro-area countries, thus leading to a smaller exposure to a potential fall-out of a “hard Brexit” scenario in the current conjuncture (Cappariello, 2017).
In terms of product mix, Italy still appears significantly more exposed to the competitive pressures of Chinese and other low-wage countries’ producers: should these competitors manage to penetrate a wider set of products, leaving only the very high-technology sectors sheltered from competition, Italian exports would most likely continue to suffer more than those of the other main euro-area countries. On the other hand, the worst phase of the “China shock” is likely over.
The positive selection of firms we have discussed in Section 2.4 might have structurally strengthened the population of Italian exporters, making it more capable of both facing adverse shocks and taking advantage of new opportunities. Indeed, some pieces of evidence reported in the paper seem to point in this direction. Since the eruption of the global financial crisis, but to some extent even before, small and micro Italian exporters have lost ground; the resulting recomposition of the exporting population is plausibly going to affect aggregate exports via different channels. First, the ability to keep pace with external demand should be stronger. Second, a productive system that is more balanced away from very small firms is likely to be more resilient in the face of increased competitive pressures.
Although this paper is very lengthy, several research questions remain unaddressed. First, a more thorough investigation of the (possibly different) intra- and extra-extra euro export flows is warranted. This analysis however would require the construction of a new set of REERs which allow the correct measurement of price competitiveness in different markets, rather than vis-à-vis selected trading partners, as captured by standard indicators such as those employed here. Second, the paper has not covered the link between FDIs and external performance, which may differ across the four countries considered. Third, more refined indicators than gross exports, referring to the domestic value added embodied in a country’s foreign sales, need to be assessed in a comprehensive and systematic way in order to fully gauge a country’s international performance; the availability of more timely and granular data would allow progress along these lines. Fourth, a comparative analysis of firm-level data across countries would be needed to draw clear-cut conclusions on the extent to which Italy’s relative export patterns are explained by specific aspects
63
of its industrial structure. In particular, this would help address the following questions: how different were entry or exit patterns in the population of exporters? What was the contribution of multinational companies and of intra-firm trade to overall exports? What was the role of “export superstars”?
Moreover, whereas Germany’s outstanding export performance relative to all euro-area countries in the 1999-2007 period has been vastly documented (see, for example, Dustmann et al., 2014; Marin, Schymik and Tscheke, 2015), it is also relevant to understand in greater depth the reasons behind the superior export dynamics of Spain, which too appears to be an outlier in many respects. A mix of factors seems to be at work: an ongoing catching-up process (as reflected in the positive contribution of the extensive margin to export growth), a different product specialization (with a lower exposure to the competitive pressures exerted by China), and stronger FDI inflows (especially in sectors such as transport equipment, chemicals and pharmaceuticals). There are also indications that Italy’s growth gap vis-à-vis Spain after 2010 disappears when looking at the domestic value added embodied in exports rather than at gross exports.
Finally, while this paper is mainly focused on trade in goods owing to data availability issues, trade in services is growing rapidly, in connection with ICT developments that have led to an increasingly blurred boundary between manufactures and services. Aggregate data point to a significantly slower growth of services’ exports in Italy than in France and Germany in recent years, in particular for R&D, professional, technical, communication and other business services. Since some of these sectors are characterized by economies of scale and a high degree of market concentration, the small number of truly large companies in Italy might explain the country’s difficulties in this segment, but a more thorough analysis is needed to better understand this documented stylized fact.
64
Annex A – Statistical appendix
Table A1 – Goods exports across destination markets (current prices; percentage changes and weights)
Source: authors’ calculations on Eurostat and national sources’ (IMTS) data.
Table A2 – Goods exports across sectors (current prices; percentage changes and weights)
Source: authors’ calculations on Eurostat and national sources’ (IMTS) data. The table is obtained by re-arranging data at the 2-digit level of the Harmonized System classification so as to mimic the CPA classification.
annual
growth
initial
weight
annual
growth
initial
weight
annual
growth
initial
weight
annual
growth
initial
weight
annual
growth
initial
weight
annual
growth
initial
weight
annual
growth
initial
weight
annual
growth
initial
weight
European Union 7.2 64.5 3.2 57.9 5.0 67.5 1.8 61.5 10.9 65.7 3.9 60.3 8.5 74.6 5.6 67.7
Euro area 6.4 50.7 2.6 44.0 5.2 52.8 1.2 49.3 10.1 46.5 2.2 41.2 8.0 62.6 4.4 56.6
Source: Banca d’Italia. (1) Based on producer prices of manufactures sold on domestic markets. (2) Fixed composition (18 countries excluding Luxembourg). (3) An increase signals a loss in price competitiveness. (4) Ratio of domestic to partners’ prices.
Figure A3 - Adjusting relative unit value index for quality and taste
(1999=100)
a) relative unit value index b) relative unit value index adjusted for quality and taste
Source: Aiello et al. (2015). The indicators are based on Benkovskis and Worz (2013). An increase in the relative unit value index signals a deterioration in competitiveness.
Figure A4 – Goods exports: comparison between ITMS and firm-level data
Table A6 – Exports and standard determinants (total-economy REERs; dependent variable: log-differences of goods exports; estimation period: 1999-2015)
Source: authors’ calculations. All REERs refer to the total economy, and each column differs according to the deflator employed. The first indicator is the PPI-based price competitiveness indicator, sourced from Banca d’Italia and discussed in Section 3.2. The remaining indicators are, respectively, ULCT-, CPI- and GDP deflator-based, sourced from the ECB and depicted in Figure A2. OLS estimates with White’s correction for heteroscedasticity. * p<0.10, ** p<0.05, *** p<0.01. Standard errors are in small font and in brackets.
The BACI world trade database, developed by the CEPII, provides bilateral values and quantities of exports at the HS 6-digit product disaggregation for more than 200 countries. It is based on information provided by the United Nations Statistical Division (COMTRADE database) and uses a harmonization procedure that reconciles the declarations of the exporter and the importer. The dataset provides information on the value of trade (in US dollars) and the quantity (in tons) by exporter, importer, product category and year. For the product category, we use the 1996 version of the HS. Italy’s market share on world imports of goods according to the BACI database is broadly similar to the market share based on national accounts data, with relatively minor differences over time. The differences tend to be fairly small also in the other main euro-area countries, with the exception of Germany, mainly owing to the discrepancy between Germany’s national accounts and foreign trade data.
71
Annex C - A standard macro-econometric equation
How does a standard macro-econometric approach explain Italy’s export performance since 1999? In order to answer this question we consider an equation for the volume of exports of manufacturing goods (net of energy and agricultural products; in short, non-farm non-energy, NFNE). The equation, borrowed from the Banca d’Italia Quarterly Model (BIQM),58 posits that (log-) exports move one-to-one with (log-) external demand in the long run; the unit-elasticity hypothesis is indeed not rejected by the data. Dynamics are further determined by the evolution of price competitiveness, by the growth rate of external demand stemming from euro and non-euro area countries, considered separately, and by the inclusion of a lagged dependent variable. Two dummies help capture the exceptional decline in exports in 2008-2009.
External demand is measured as the quarterly version of potential demand illustrated in Figure 9; price competitiveness is computed against a basket of 30 competitors and is proxied by the ratio between a weighted average of the manufacturing prices of Italy’s trading partners and Italy’s export deflator for goods, to ease its forecasting. Although different from the PPI-based REER described in Section 3.2, both in terms of deflator employed and of the number of trading partners considered, the two measures’ dynamics are qualitatively very similar, although the BIQM metric shows a faster deterioration in price competitiveness from the mid-1990s throughout 2009 and a slightly slower recovery thereafter (Fig. C1). All in all, we deem that the findings on the contribution of price competitiveness to the growth of goods exports discussed in this section are reasonably consistent with the pattern of the indicator described in Section 3.2.
Figure C1 – The BIQM price-competiveness indicator and the PPI-deflated REER for Italy (yearly averages; indices 1999=100)
Source: Banca d’Italia. An increase in the two indicators here signals an improvement in price competitiveness.
58 The BIQM is the large-scale macro-econometric model that is used to forecast the developments of the Italian
economy in Banca d’Italia within the Broad Macroeconomic Projection Exercise coordinated by the ECB (Busetti, Locarno and Monteforte, 2005; Bulligan et al., 2017).
We have “solved backward” the BIQM equation so that contemporaneous NFNE exports can be traced back to the effect of contemporaneous and lagged shocks to external demand and to price competitiveness.59 The results of this exercise are illustrated in Figure C2, after aggregating at the annual frequency.
According to the BIQM equation, the growth gap Italian exports had accrued between 1999 and 2007 with respect to contemporaneous potential demand is mainly accounted for by the loss of price competitiveness. Stated in absolute terms, the burden of price competitiveness weighed for around 25 points on the cumulated growth of exports since 1999: around 15 points stemmed from the appreciation of the nominal effective exchange rate, while the rest originated from domestic prices growing faster than Italy’s competitors’ prices. In the post-2010 period, the effects at play have an opposite sign and are significantly more muted: both the depreciation of the nominal exchange rate and the initial improvement in relative prices helped boost export growth.
Figure C2 - Export growth decomposition: the role of standard determinants (percentage points)
Source: authors’ calculations on Banca d’Italia data, according to the BIQM equation of non-farm non-energy exports.
Interpreting these results as a counterfactual scenario requires extreme caution, since the domestic-price component of price competitiveness becomes endogenous as soon as we abandon the single-equation perspective employed here, in favour of a macro-wide standpoint. In other terms, had Italy maintained its price competitiveness unchanged, can one say, based on our results, that cumulated export growth in 1999-2007 would have been 25 percentage points higher? The answer is that the question is ill-posed since a counterfactual experiment requires a counterfactual scenario for an exogenous variable, and price competitiveness is indeed not exogenous: the 25 points’ boost in exports would have had feedback effects on domestic prices (via economic activity) and thus on price competitiveness itself.
While insightful, reading the Italian export performance through the lens of the BIQM equation taken alone requires great caution. Moreover, the contribution of price competitiveness might be 59 The effect of the constant term and of the “initial point” (the time-zero exports that initialize the difference equation)
are negligible thanks to the fact that the start of the estimation period (1983) is sufficiently distant from the period under examination.
over-estimated as that variable might also capture the effects of other determinants not included in the equation, including non-price factors (such as quality upgrading), the structural composition of exports by firm size (a proxy for the distribution of productivity across firms) and China’s progressive penetration into world markets. The latter aspect deserves some further considerations, beyond its effect on potential demand discussed in Box B, since price competitiveness is typically measured on the basis of price indices rather than levels,60 and hence is driven by relative inflation rates and is not able to capture the entry of a new competitor characterized by low price levels.61
Notwithstanding these caveats, this standard macro-econometric approach we have adopted does not perform poorly in tracking the evolution of Italian merchandise exports. The data indeed confirm the assumption that foreign sales and external demand move one-to-one in the long run and the equation does not run into systematic over or under-predictions, despite omitting some potentially relevant determinants. While this may be an indication that candidate omitted variables counterbalanced each other (for instance, quality upgrading counteracted the negative effects of increasing competition from low-wage countries), the estimated contribution of price competitiveness to the overall evolution of exports is likely to be overestimated.
60 Attempts at measuring relative price levels include Turner and Van't dack (1993), Esteves (2007) and Thomas,
Marquez and Fahle (2008). For a review on the subject, see also Froot and Rogoff (1995). However, relative price levels also have various drawbacks. For instance, since they are derived as the difference between market exchange rates and purchasing power parity exchange rates, they are known to be subject to large measurement errors.
61 Chinese goods, essentially unavailable before 2001, can be modelled as product varieties that experience an infinite deflation (“new varieties can be thought of as having a price fall from infinity”; Feenstra, 1994, p. 159).
74
Annex D – The constant market share analysis (CMS)
The methodology behind the CMS analysis is briefly presented below. The change in a country’s market share (s) between year t and year t-1 can be decomposed in the sum of structural effects (SE), competitive effects (CE) and adaptation effects (AE). Structural factors can be further decomposed in the sum of product specialization (PSE), geographic specialization (GSE) and a structure interaction effect (SIE):
The terms on the right side are defined in the following way:
𝑃𝑆𝐸 = ∑(𝑝𝑖𝑡 − 𝑝𝑖
𝑡−1)𝑠𝑖𝑡−1
𝑖
𝐺𝑆𝐸 = ∑(𝑔𝑗𝑡 − 𝑔𝑗
𝑡−1)𝑠𝑗𝑡−1
𝑗
𝑆𝐼𝐸 = ∑ ∑(𝑤𝑖𝑗𝑡 − 𝑤𝑖𝑗
𝑡−1)𝑠𝑖𝑗𝑡−1 − 𝑃𝑆𝐸 − 𝐺𝑆𝐸
𝑗𝑖
𝐶𝐸 = ∑ ∑(𝑠𝑖𝑗𝑡 − 𝑠𝑖𝑗
𝑡−1)𝑤𝑖𝑗𝑡−1
𝑗𝑖
𝐴𝐸 = ∑ ∑(𝑠𝑖𝑗𝑡 − 𝑠𝑖𝑗
𝑡−1)(𝑤𝑖𝑗𝑡 − 𝑤𝑖𝑗
𝑡−1)
𝑗𝑖
where i refers to products and j refers to importing countries, stij corresponds to the market share in a
given market (defined as a country-product combination), wtij is the weight of each individual
market’s imports on world trade, pti is the weight of product i’s world imports on world trade, and
gtj is the weight of country j’s world imports on world trade.
The product specialization term captures the change in the market share due to changes in the product structure of world trade; it is positive if a country is specialized in products whose weight on world trade increases. The geographic specialization term captures the change in the market share due to changes in the geographic structure of world trade; it is positive if a country is specialized in exporting towards countries whose weight on world trade increases. The structure interaction term reflects the combination of changes in the product structure and changes in the geographic structure of world trade. The competitiveness term is a weighted average of changes in the country’s market share in individual markets, with weights reflecting the importance of each individual market relative to world trade. The adaptation term reflects the correlation between changes in the country’s market share in individual markets and changes in the individual markets’ share on world trade.
The CMS analysis described in Section 3.3 has been applied to the BACI trade dataset, with products defined according to the 6-digit HS level and export values in US dollars at current prices. We have also run a robustness exercise excluding oil and mineral products, to attenuate the impact of commodity price cycles (Tab. D1).
75
Table D1 – Constant market share analysis for Italy by sub-periods: robustness (1) (percentage points)
Source: authors’ calculations on CEPII-BACI data. (1) Changes in market shares can be decomposed into the following components: “structural” factors (sectoral specialization, geographical specialization, structure interaction), “competitiveness” factors and “adaptation” factors. The results of the CMS analysis are based on: 4-digit level of the HS classification (baseline; upper panel), 2-digit level (upper middle panel), 6-digit level (lower middle panel) and 4-digit level excluding mineral products (lower panel).
Annex E – Robustness analysis on the impact of competition from China on Italian exports
We replicate the analysis of the impact of competition from China on Italian exports with some changes in the methodology, to test the robustness of the results.
As a first exercise, we include oil and mineral products (specifically, the following 2-digit groups of the HS classification: 25, 26, 27), which are generally classified among products with low competition from China: this tends to attenuate differences in the percentage change in market shares by intensity of competition from China, but it reflects the effect of the rise in commodity prices during the period and the associated loss in the main euro-area countries’ market share (Fig. E1a).
Second, we exclude the motor vehicles sector (specifically, the following 2-digit group of the HS classification: 87): the results are almost unchanged with respect to our baseline estimate reported in Section 4.2 (Fig. E1b).
Figure E1 – Changes in market shares by intensity of competition from China: 1999-2015 (percentage changes)
Source: authors’ calculations on CEPII-BACI data.
In the third exercise we classify exports according to intensity of competition from China using deciles instead of terciles. For each segment, Figure E2a reports the percentage change in Italy’s market share between 1999 and 2015. There is a clear, although not always monotonic, negative relation between intensity of competition from China and the change in Italy’s market share. In none of the first four deciles Italy’s market share decreases by more than 20 percent, while in each of the remaining deciles it falls by at least 30 percent. The main exceptions to the monotonicity are the fourth decile (in which the decrease in the share is milder than in the two previous deciles) and the fifth decile (in which the decrease is comparable to those with the highest intensity of competition). Comparing the weight of each decile in Italy’s exports relative to the other main euro-area countries, it appears that Italy is relatively under-specialized in the three deciles with the lowest intensity of competition from China, while it is specialized in almost all of the remaining deciles (fig. E2b). Between 1999 and 2015 Italian exports underperformed with respect to German exports in all but the first decile, and with respect to Spanish exports in all but the second decile.
-60
-50
-40
-30
-20
-10
0
Italy France Germany Spain
a) including oil and mineral products
High competition from China
Medium competition from China
Low competition from China
Total
-60
-50
-40
-30
-20
-10
0
10
Italy France Germany Spain
b) excluding motor vehicles
High competition from China
Medium competition from China
Low competition from China
Total
77
Figure E2 – Market shares and intensity of competition from China by decile
Source: authors’ calculations on CEPII-BACI data.
Finally, we build a measure of the overlap in countries’ export bundles, based on the “export similarity” index (Finger and Kreinin, 1979; see also Schott, 2008). For any two countries i and j, the index is defined as follows:
𝐸𝑆𝐼𝑡𝑖𝑗
= ∑ min (𝑠𝑡𝑝𝑖
𝑝
, 𝑠𝑡𝑝𝑗
)
where 𝑠𝑡𝑝𝑖 is the share of country i’s export value in product p on country i’ s total exports in year t
and 𝑠𝑡𝑝𝑗 is the corresponding share for country j. The index is zero if the two countries do not share
any product in common in their export bundle and one if the product distribution of the two countries’ exports is identical. Using trade values at the HS 6-digit level, we find that China's exports were more similar to Italy’s than to those of the other main euro-area countries throughout the entire period from 1999 to 2015 (fig. D3). Export similarity with China increased over time for each of the four largest euro-area countries: the increase was more pronounced in the case of Germany.
Figure E3 – Export similarity with China (similarity index)
Source: authors’ calculations on CEPII-BACI data.
-50
-40
-30
-20
-10
0
1 2 3 4 5 6 7 8 9 10
a) change in Italy's market share by deciles of intensity of competition from China: 1999-2015
(percentage changes)
% change in Italy's market shareby decile
Deciles ordered from lowest competition (1) to highest competition (10)
-15
-12
-9
-6
-3
0
3
6
9
12
15
1 2 3 4 5 6 7 8 9 10
b) Italy's relative export composition by intensity of competition from China: 1999
(percentage values)
difference between weight of decile in Italian exports and weight in theother main euro area countries' exports
Deciles ordered from lowest competition (1) to highest competition (10)Deciles ordered from lowest competition (1) to highest competition (10)
Aiello, G., Benkovskis, K., Bluhm, B., Bobeica, E., Buelens, C., Cavallini, F., Christodoulopoulou, S., De Clercq, M., Giordano, C., Joseph, A., Karadeloglou, P., Leonte, A., Lommatzsch, K., Lopez-Garcia, P., Momchilov, G., Osbat, C., Orszaghova, L., Pappadà, F., Prades Illanes, E., Silgoner, M., Tkacevs, O., Vermeulen, R., Wörz, J., Zollino, F. (2015), “Compendium on the diagnostic toolkit for competitiveness”, European Central Bank Occasional Papers 163.
Amador, J and Opromolla L.D. (2010), “The margins of exports: Firms, products and destinations”, Economics Bulletin (Banco de Portugal), Spring, pp. 103-119.
Amici, M., Bobbio, E. and Torrini, R. (2017), “Patterns of convergence (divergence) in the euro-area. Profitability versus cost and price indicators”, Banca d’Italia Occasional Papers, forthcoming.
Amiti, M., Itskhoki, O. and Konings, J. (2014), “Importers, Exporters, and Exchange Rate Disconnect”, American Economic Review 104(7), pp. 1942-1978.
Anderson, J. E. and van Wincoop, E. (2003), “Gravity with Gravitas: A Solution to the Border Puzzle", American Economic Review 93(1), pp. 170-192.
Armington, P. (1969), “A Theory of Demand for Products Distinguished by Place of Production”, IMF Staff Papers 16, pp. 159-78.
Autor, D.H., Dorn, D. and Hanson, G.H. (2016), “The China Shock: Learning from Labor Market Adjustment to Large Changes in Trade”, NBER Working Papers 21906.
Banco de España (2017), Annual Report.
Banque de France (2015), The French Balance of Payments and International Investment Position:
Annual Report 2014.
Banque de France (2017), The French Balance of Payments and International Investment Position:
Annual Report 2016.
Barba Navaretti, G., M. Bugamelli, E. Forlani and G.I.P., Ottaviano (2017), “It takes (more than) a moment: revisiting the link between firm productivity and aggregate exports”, mimeo.
Bas, M. and Strauss-Kahn V. (2014), “Does importing more inputs raise exports? Firm-level evidence from France”, Review of World Economics 150(2), pp. 241-475.
Bas M., Fontagné L., Martin P. and Mayer T. (2015), “In search of lost market shares”, Les notes du
conseil d’analyse économique 23.
Bayoumi, R.T., Harmsen, J. and Turunen, T. (2011), “Euro Area Export Performance and Competitiveness”, IMF Working Papers 140.
Bems, R. and Johnson, R.C. (2012), “Value-Added Exchange Rates”, NBER Working Papers 18498.
Bems, R. and Johnson, R.C. (2015), “Demand for Value Added and Value-Added Exchange Rates”, NBER Working Papers 21070.
Benkovskis, K. and Wörz, J. (2013), “Non-price competitiveness of exports from emerging countries”, ECB Working Papers 1612.
79
Berman, N., Martin, P. and Mayer, T. (2012), “How do different exporters react to exchange rate changes?”, The Quarterly Journal of Economics 127(1), pp. 437-492.
Bernard, A.B., Eaton, J., Jensen, J.B. and Kortum, S. (2003), “Plants and Productivity in International Trade”, American Economic Review 93(4), pp. 1268-1290.
Bernard, A. B., Jensen, J.B., and Schott. P.K. (2006a), “Survival of the Best Fit: Exposure to Low Wage Countries and the (Uneven) Growth of US Manufacturing Plants”, Journal of International
Economics 68, pp. 219–37.
Bernard, A. B., Jensen, J.B. and Schott, P.K. (2006b), “Trade Costs, Firms and Productivity”, Journal of Monetary Economics 53, pp. 917–37.
Berthou, A. and Dyhne, E. (2017), “Exchange rate movements, firm-level exports and heterogeneity”, Banque de France Working Papers, forthcoming.
Bloom, N., Draca, M. and Van Reenen, J. (2015), “Trade Induced Technical Change: The Impact of Chinese Imports on Innovation, Diffusion and Productivity”, Review of Economic Studies,
February.
Bobeica, E., Esteves, P.S., Rua, A. and Staeh, K. (2016), “Exports and domestic demand pressure: a dynamic panel data model for the euro area countries”, Review of World Economy 152, pp. 107-125.
Borin, A. and Mancini, M. (2015), “Follow the value added: Bilateral gross exports accounting”, Banca d’Italia Working Papers 1026.
Borin, A. and Mancini, M. (2017), “Participation in global value chains: measurement issues and the place of Italy”, forthcoming.
Bracci, L., Fabiani, S. and Felettigh, A. (2015), “Trading processing for goods: a different view from the past on Italian trade flows?”, Banca d’Italia Occasional Papers 284.
Brandolini, A., Bugamelli, M., Barone, G., Bassanetti, A., Bianco, M. Breda, E., Ciapanna, E. Cingano, F. D'Amuri, F. D'Aurizio, L., Di Nino, V., Federico, S., Generale, A., Lagna, F., Lotti, F., Palumbo, G., Sette, E., Szego, B., Staderini, A., Torrini, R., Zizza, R., Zollino, F. and Zotteri, S. (2009), “Report on trends in the Italian productive system”, Banca d’Italia Occasional Papers 45.
Bricogne, J-C., Fontagné, L., Gaulier, G., Taglioni, D. and Vicard, V. (2012), “Firms and the global crisis: French exports in the turmoil”, Journal of International Economics 87(1), pp. 134-146.
Broda, C. and Weinstein, D.E. (2006), “Globalization and the Gains from Variety”, Quarterly
Journal of Economics 121(2), pp. 541-585.
Bugamelli, M. (2007), “Prezzi delle esportazioni, qualità dei prodotti e caratteristiche di impresa: un’analisi su un campione di imprese italiane”, Banca d’Italia Working Papers 634.
Bugamelli, M. and Rosolia, A. (2006), “Produttività e concorrenza estera”, Rivista di Politica
Economica 9-10.
Bugamelli, M. and Tedeschi, R. (2008), “Pricing-to-Market and Market Structure”, Oxford Bulletin
of Economics and Statistics 70(2), pp. 158-180.
Bugamelli, M., Schivardi, F. and Zizza, R. (2009), “The Euro and Firm Restructuring”, in A. Alesina and F. Giavazzi (eds.) Europe and the Euro, Chicago: Chicago University Press.
Bugamelli, M., Fabiani, S. and Sette, E. (2015), “The Age of the Dragon: The Effect of Imports from China on Firm-Level Prices”, Journal of Money, Credit and Banking 47(6), pp. 1091–1118.
80
Bugamelli, M., Gaiotti, E. and Viviano, E. (2015), “Domestic and foreign sales: complements or substitutes?”, Economic Letters 135, pp. 46-51.
Bugamelli, M., Linarello, A. and Serafini, R. (2017), “The ‘Margin Call’: firm-level export dynamics in Italy”, Banca d’Italia, mimeo.
Bulligan, G., Busetti, F., Caivano, M., Cova, P., Fantino, D., Locarno, A. and Rodano, M.L. (2017), “The Bank of Italy econometric model: an update of the main equations and model elasticities”, Banca d'Italia Working Papers 1130.
Buono, I. and Fadinger, H. (2012), “The micro dynamics of exporting: Evidence from French Firms”, Banca d'Italia Working Papers 880.
Burda, M.C. (2016), “The German Labor Market Miracle, 2003 -2015: An Assessment”, SFB 649
Discussion Papers 2016-005.
Busetti, F., Locarno, A. and Monteforte, L. (2005), “The Bank of Italy’s quarterly model”, in Fagan, G. and Morgan, J. (eds.), Econometric models of euro area Central Banks, Edward Elgar.
Campa, J.M. and Goldberg, L.S. (2005), “Exchange Rate Pass-Through Into Import Prices”, The
Review of Economics and Statistics 87(4), pp.679–690
Cappariello, R. (2017), “Brexit: estimating tariff costs for EU countries in a new trade regime with the UK”, Banca d'Italia Occasional Papers 381.
Cappariello, R. and Felettigh, A. (2015), “How Does Foreign Demand Activate Domestic Value Added? A Comparison Among the Largest Euro-area Economies”, Banca d'Italia Working Papers 1001.
Chen, R., Milesi-Ferretti, G.M. and Tressel, T. (2013), “Eurozone external imbalances”, Economic
Policy, January.
Cheptea, A., Fontagné, L. and Zignago, S. (2014), “European export performance”, Review of
World Economics 150 (1), pp. 25-58.
Chinn, M.D. (2006), “A Primer on Real Effective Exchange Rates: Determinants, Overvaluation, Trade Flows and Competitive Devaluation”, Open Economies Review 17, pp. 115-143.
Cristadoro, R. and Federico S. (2015), “L’internazionalizzazione del sistema produttivo”, Banca d’Italia, Banca d’Italia Occasional Papers 260.
De Bonis, R., Ferri G. and Rotondi Z. (2014), “Do firm-bank relationships affect firms’ internationalization?” Banca d’Italia Occasional Papers 251.
Dekle, R., Jeong, H. and Kiyotaki, N. (2015), “Dynamics of Firms and Trade in General Equilibrium”, USC Dornsife Institute for New Economic Thinking Working Paper 15-12.
Del Prete, S. and Federico, S. (2014), “Trade and finance: is there more than just “trade finance”?”, Banca d’Italia Working Papers 948.
De Nardis, S. (2014), “Efficienza e specializzazione”, Scenario Nomisma, October 9.
De Nardis S. and Traù F. (2005), “Il modello che non c’era. L’Italia nella divisione internazionale del lavoro industriale”, Rubbettino: Soveria Mannelli.
De Nardis, S. and Fontolan F. (2014), “Intensi esportatori”, Scenario Nomisma, June 11.
81
Di Mauro, F. and Forster, K. (2008), “Globalisation and the Competitiveness of the Euro Area”, ECB Occasional Papers 97.
Dustmann, C., Fitzenberger, B., Schonberg, U. and Spitz-Oener, A. (2014), “From Sick Man of Europe to Economic Superstar: Germany’s Resurgent Economy,” Journal of Economic
Perspectives 28, pp. 167–88.
Esteves, P.S. (2007), “Foreign competitors’ price aggregation in computing price-competitiveness indicators: an application to the EU15 countries”, Banco de Portugal Economic Bulletin, Spring, pp. 1-11.
Esteves, P. and Rua, A. (2013), ‘Is there a role for domestic demand pressure on export performance?’, ECB Working Papers 1594.
Federico, S. (2014), “Industry Dynamics and Competition from Low-Wage Countries: Evidence on Italy”, Oxford Bulletin of Economics and Statistics 76(3), pp. 389-410.
Federico, S. (2016), “How does multinational production affect the measurement of competitiveness?”, Banca d’Italia Occasional Papers 301.
Feenstra, R. C. (1994), “New Product Varieties and the Measurement of International Prices”, The
American Economic Review 84(1), pp. 157-177.
Felettigh, A., Giordano, C., Oddo, G. and Romano, V. (2016), “New indicators to assess price-competitiveness developments in the four largest euro-area countries and in their main trading partners ”, Journal of Economic and Social Measurement 41(3), pp. 203-235.
Felettigh, A. and Oddo, G. (2016), “Market shares in manufacturing value-added: is the picture different?”, Banca d’Italia Occasional Papers 336.
Fidora, M. and Schmitz, M. (2017), “Real effective exchange rates”, in ECB, Impact of GVCs on
the macroeconomic analysis and forecasting of the euro area/EU , Report presented at the Work Programme WGF meeting, 30-31 January.
Finger, J.M. and Kreinin, M.E. (1979), “A Measure of ‘Export Similarity’ and Its Possible Uses”, The Economic Journal 89(356), pp. 905-912.
Froot, K. A. and Rogoff, K. (1995), “Perspectives on PPP and long-run real exchange rates”, in Grossman, G. and Rogoff, K. (eds.), Handbook of International Economics, Vol. III. North-Holland, Amsterdam, pp. 1647-1688.
Gabaix, X. (2011), “The Granular Origins of Aggregate Fluctuations”, Econometrica 79, pp. 733–772.
Gaulier, G., Santoni G., Taglioni D. and Zignago S. (2013), “In the Wake of the Global Crisis: Evidence from a New Quarterly Database of Export Competitiveness”, World Bank Policy
Research Working Paper 6733.
Giordano, C. and Zollino, F. (2016), “Shedding Light on Price- and Non-price Competitiveness Determinants of Foreign Trade in the Four Largest Euro-area Countries”, Review of International
Economics 24(3), pp. 604–634.
Giordano, C. and Zollino, F. (2017), “La competitività di prezzo in Italia: misurazione, andamenti e determinanti”, in Dell’Aringa, C., Lucifora, C. and Treu, T. (eds.), Salari, produttività,
disuguaglianze. Verso un nuovo modello contrattuale?, AREL-Il Mulino: Bologna.
Giordano, C., Toniolo, G. and Zollino, F. (2017), “Long run trends in Italian productivity”, Banca
d’Italia Occasional Papers, forthcoming.
82
Giovannetti, G. and Sanfilippo, M. (2016), “China’s competition and the export price strategies of developed countries”, International Review of Applied Economics 30(2), pp. 238-254.
Giovannetti, G., Sanfilippo, M. and Velucchi, M. (2011), “The “China effect” on EU Exports to OECD markets – A focus on Italy”, Universita' degli Studi di Firenze Economics Working Papers 17.
Goldstein, M. and Kahn, M.S. (1985), “Income and price effects in foreign trade”, in Jones, R.W. and Kenen, P.B. (eds.), Handbook of International Economics, vol. 2. North Holland: Amsterdam.
Grossman, G. and Helpman, E. (1991), “Quality ladders in the theory of growth”, Review of
Economic Studies 58(1), pp. 43-61.
Hubrich, K. and Karlsson, T. (2010), “Trade consistency in the context of the ESCB projection exercises”, ECB Occasional Papers 108.
Istat (2017), Rapporto Annuale 2017, Istat: Roma.
Johnson, R. and Noguera G. (2017), “A Portrait of Trade in Value Added over Four Decades”, The
Review of Economics and Statistics, forthcoming.
Khandelwal, A. K., Schott, P. K., and Wei, S.-J. (2013), “Trade Liberalization and Embedded Institutional Reform: Evidence from Chinese Exporters”, American Economic Review 103(6), pp. 2169–2195. Koopman, R., Wang, Z. and Wei, S.-J. (2014), “Tracing Value-Added and Double Counting in Gross Exports”, American Economic Review 104(2), pp. 459-94.
Linder, S. B. (1961), An Essay in Trade and Trasformation, Almqvist and Wiksell: Stockholm.
Marin, D., Schymik, J. and Tscheke, J. (2015), “Europe’s export superstars – It’s the organization!”, Bruegel Working Papers 2015/05.
Markusen, J. (1989), “Trade in producer services and in other specialized, intermediate inputs”, American Economic Review 79(1), pp. 85-95.
Martinez-Mongay, C. and Maza Lasierr, L.A. (2009), “Competitiveness and growth in EMU: The role of the external sector in the adjustment of the Spanish economy”, European Economy –
Economic Papers 355.
Mayer T. and Ottaviano, G.I.P. (2011), “The happy few: the internationalization of European firms”, Blueprints Bruegel 12.
Mayer, T, Melitz, M.J. and Ottaviano, G. I.P. (2016), “Product Mix and Firm Productivity Responses to Trade Competition”, CEP Discussion Papers 1442.
Melitz, M.J. (2003), “The Impact of Trade on Intra-Industry Reallocations and Aggregate Industry Productivity”, Econometrica 71, pp. 1695-1725.
Mellens, M.C., Noordman H.G.A., and Verbruggen J.P. (2007), “Re-exports: international comparison and implications for performance indicators”, CPB Document 149.
Memedovic, O. and Iapadre L. (2009), “Industrial Development and the Dynamics of International Specialization Patterns”, UNIDO Research Paper.
Muir, D.V. and Elekdag S. (2013). “Trade linkages, balance sheets and spillovers: the Germany-Cental European Supply Chain”, IMF Working Papers 210.
83
Muuls, M. and Pisu, M. (2009), “Imports and Exports at the level of the Firm: evidence from Belgium”, The World Economy 32(5), pp. 692-734.
Patel, N., Wang, Z. and Wei, S-J. (2017), “Global value chains and effective exchange rates at the country-sector level”. BIS Working Papers 637.
Sato, K., Shimizu, J., Shrestha, N. and Zhang, S. (2015), “Industry-specific Real Effective Exchange Rates in Asia”, RIETI Discussion Papers 15-E-036.
Schott, P. (2004), “Across-product versus within-product specialization in international trade”, Quarterly Journal of Economics 119(2), pp. 647-678.
Silver, M. (2007), “Do Unit Value Export, Import, and Terms of Trade Indices Represent or Misrepresent Price Indices?”, IMF Working Papers 121.
Schott, P. (2008), “The relative sophistication of Chinese exports”, Economic Policy 23(53), pp. 5-49.
Soderbery, A. (2015), “Estimating import supply and demand elasticities: Analysis and implications”, Journal of International Economics 96(1), pp. 1–17.
Spilimbergo, A. and Vamvakidis, A. (2003), “Real effective exchange rate and the constant elasticity of substitution assumption”, Journal of International Economics 60(2), pp. 337-354.
Thomas, C., Marquez, J. and Fahle, S. (2008), “Measuring U.S. International Relative Prices”, Federal Reserve Board International Finance Discussion Papers 917.
Timmer, M.P., Dietzenbacher E., Los B., Stehrer R., and de Vries G.J. (2015), “An Illustrated User Guide to the World Input–Output Database: the Case of Global Automotive Production”, Review of
International Economics 23(3), pp. 575–605.
Timmer, M.P., Los B., Stehrer R., and de Vries G.J. (2016), “An Anatomy of the Global Trade Slowdown based on the WIOD 2016 Release”, GGDC Research Memorandum 162.
Turner, P. and Van’t dack, J. (1993), “Measuring international price and cost competitiveness”, BIS
Economic Papers 39.
Vannoorenberghe, G. (2012), “Firm-level volatility and exports”, Journal of International
Economics 86(1), pp. 57-67.
4
Ministry of Economy and Finance
Department of the Treasury
Directorate I: Economic and Financial Analysis
Address: Via XX Settembre, 97 00187 - Rome Websites: