Abstract—Nowadays, real-time video communication is an increasingly popular application for real-time demonstrations and/or interactive teleconferences offering original quality and assuring smooth movement of the video with clarity of sound over an Intra-Domain and Inter-Domain network. Traffic characteristics analysis are needed to improve the quality service for real-time video communication systems. It is necessary for simulation and study. Recently, VoIP, HTTP, FTP, SMTP and other Internet protocol applications have already been widely studied. However, a characteristic of Digital Video Transmission System (DVTS) is high-quality real-time audio and visual communication which are rarely studied. Therefore, this paper presents characteristics of DVTS over Intra-Domain traffic based on terms of time-delay (msec), packet size distribution (byte), and packet arrival rate (pps). Effects of variable bandwidth are also investigated. In addition, the packet interval time (pps) is represented in the form of Probability Density Function (PDF). The results are very useful for applying to generating and/or simulating DVTS traffic in order to evaluate QoS capability. Index Terms—Digital Video Transmission System (DVTS), traffic characteristics, teleconferences, telemedicine. I. INTRODUCTION Recently, there has been much research about traffic characteristic analysis of HyperText Transfer Protocol (HTTP), TELecommunication NETwork (Telnet), File Transfer Protocol (FTP), Simple Mail Transfer Protocol (SMTP), Domain Name System (DNS) , Voice over Internet Protocol (VoIP) and other Internet applications in terms of bandwidth usage, packet length (size) distribution (byte) and, volume of packet arriving rate (pps) [1]-[7]. The packet arrival rate is normally measured in a unit of packet per second (pps). The packet length and the packet arriving rate (pps) of VoIP, Telnet, DNS, SMTP, HTTP and FTP on LAN are listed in [1]-[7]. Mean packet lengths are 66.8, 104, 128, 446, 504, 752 bytes for VoIP, Telnet, DNS, SMTP, HTTP, and FTP traffic, respectively. In [1], the internet traffic stream is analyzed in terms of bandwidth usage (byte). There are three types of traffic: Web TCP, Non-Web TCP and UDP. It is found that Web TCP traffic is of the highest volume and UDP traffic is of the lowest volume for both university networks. In [3], Fowler et al. studied traffic characteristics of congestion on LANs with connectionless service. This analysis was presented in terms of packet arrival time by daily in order to understand congestion Manuscript received November 9, 2012; revised December 21, 2012. Puttinun Patpituck, Suthin Yokbua, Seksan Phosri, and Nopphol Pausawasdi are Medical Educaton Technology Center, Faculty of Medicine Siriraj Hospital, Mahidol University, Prannok Road, Siriraj, Bangkoknoi, Bangkok, 10700 Thailand (e-mail: puttinun.pat@ mahidol.ac.th; nopphol.pau@ mahidol.ac.th; suthin.yok@ mahidol.ac.th; seksan.pho@ mahidol.ac.th ). management for each application, e.g., FTP, HTTP etc. In [4], there were three traffic models measured as follows: Wired-line LAN, WAN and Intranet. This study focuses on the relationship of IP packets length in bytes and frequency as percentages. The packet length distribution and packet interval time or packet arrival time (pps) of WAN, Wired- line LAN and Intranet traffic are presented. The highest percentage of IP packet length is 46, 144, and 46 bytes on WAN, Wired-line LAN, and Intranet traffic, respectively. In [7], Thompson, et al. reported traffic characteristics that were measured from WAN traffic in terms of traffic volume, flow volume, flow duration and packet size from two locations on an internet Microwave Communications Incorporated (MCI) commercial backbone. Additionally, traffic composition, in terms of IP protocols, TCP and UDP applications, was presented. Traffic patterns and characteristics are important for network design. Additionally, it is necessary for QoS routing which relates to a constraint of delay-sensitive applications. The constraint of VoIP is that time-delay in a one-way direction of VoIP packet should be less than 150 ms [2], [5]. Telnet’s constraint is that teletyping in Telnet should be below 150 ms [1]-[3], [6], [7]. A display of each webpage on browsers (e.g., IE) should be less than 5s [8]. Chen et al. [9], analyzed, compared, and summarized HTTP characteristics and trends in future networks. Currently, the most traffic in backbone and residential access networks is World Wide Web (WWW) traffic. The WWW traffic has been studied extensively in the past, but some of its characteristics have not been covered before. Yang et al. [10], analyzed and characterized the HTTP behavior from an institute Wired-line LAN using a custom program to capture on source or destination port 80. The level of HTTP message in length, and duration distribution of HTTP request and response were analyzed and presented in the form of the Cumulative Distribution Function (CDF). It was found that the size distribution of HTML file in HTTP response has changed only slightly compared with the data measured 10 years ago, when Shimizu et al. [14] conducted 49 teleconferences in 33 medical institutions. Questionnaires were used to evaluate the quality of video and sound system. The reported survey is 70.6%, 22.5%, 2.7%, 1.7%, and 2.5% on very good, good, poor, very poor, and nonresponsive, respectively. In [15], questionnaires reported that 100 teleconmedicines over the inter-domain are very attractive in terms of good quality. Up to now, the research about DVTS traffic characteristic analysis has rarely been studied. This paper is to analyze DVTS traffic characteristics and two proposed factors; both DVTS characteristic factors and network characteristic factors in terms of statistics are very useful for DVTS traffic simulation, Quality of Service (QoS) testing, and gridline for network design. Back-to-Back Networking for Traffic Characteristics on Digital Video Transmission System (DVTS) Puttinun Patpituck, Suthin Yokbua, Seksan Phosri, and Nopphol Pausawasdi International Journal of Information and Electronics Engineering, Vol. 3, No. 4, July 2013 403 DOI: 10.7763/IJIEE.2013.V3.345
Transcript
Abstract—Nowadays, real-time video communication is an
increasingly popular application for real-time demonstrations
and/or interactive teleconferences offering original quality and
assuring smooth movement of the video with clarity of sound
over an Intra-Domain and Inter-Domain network. Traffic
characteristics analysis are needed to improve the quality
service for real-time video communication systems. It is
necessary for simulation and study. Recently, VoIP, HTTP,
FTP, SMTP and other Internet protocol applications have
already been widely studied. However, a characteristic of
Digital Video Transmission System (DVTS) is high-quality
real-time audio and visual communication which are rarely
studied. Therefore, this paper presents characteristics of DVTS
over Intra-Domain traffic based on terms of time-delay (msec),
packet size distribution (byte), and packet arrival rate (pps).
Effects of variable bandwidth are also investigated. In addition,
the packet interval time (pps) is represented in the form of
Probability Density Function (PDF). The results are very
useful for applying to generating and/or simulating DVTS
traffic in order to evaluate QoS capability.
Index Terms—Digital Video Transmission System (DVTS),
International Journal of Information and Electronics Engineering, Vol. 3, No. 4, July 2013
404
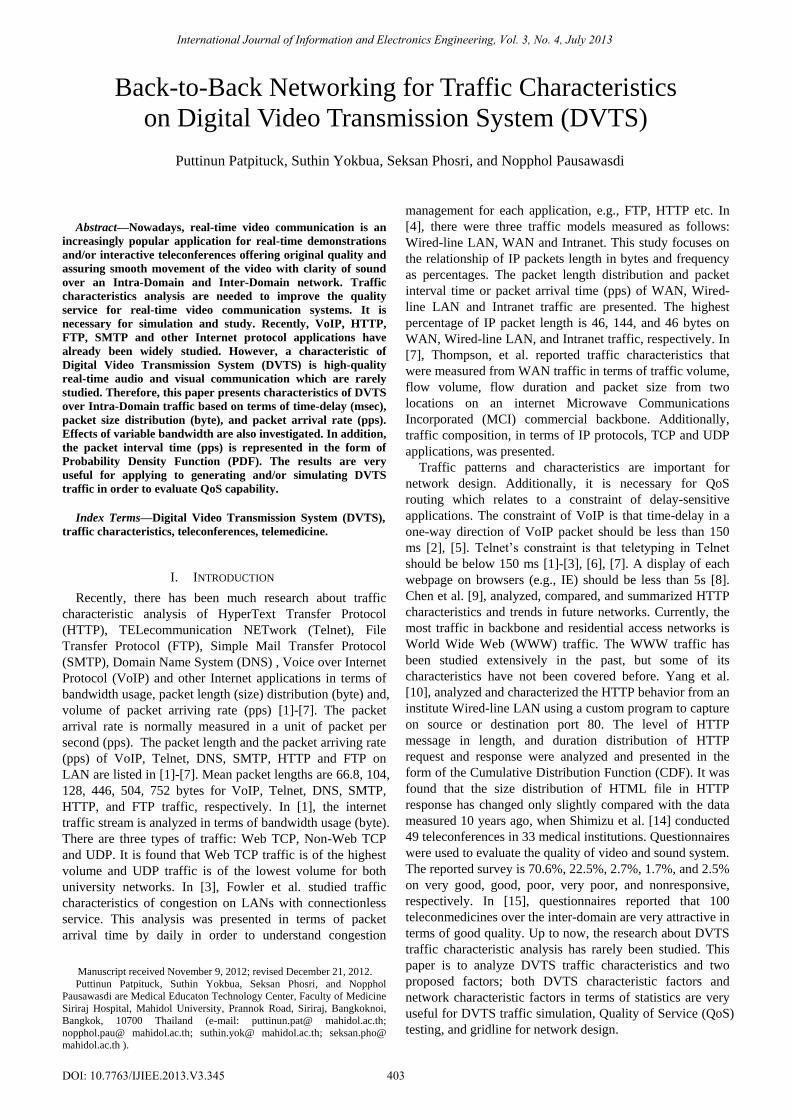
interface of the Ethernet switch using the PRTG Traffic
Grapher network monitor tool version 6.1.1.855. The
interval between capture the packets is equal to 1ms.
The network protocol analyzer known as Wireshark
v.1.6.5 starts capturing the DVTS packets on both sender
and receiver sites and saves them in the file type of Packet
CAPture (.pcap)
B. Experiment Configuration
This sub-section explains experimental configurations.
There are four main experiments. The first experiment is to
observe the effect of variable bandwidth on pingRTT. The
second experiment is to study the bandwidth consumption of
DVTS traffic. Experiment 3 is to compare the packet
interval time of DVTS traffic between sender and receiver
over speeds of 10, 100, and 1,000 Mbps in the form of PDF.
Experiment 4 is to find the packet size distribution in bytes.
IV. EXPERIMENT RESULT
This section consists of four experiment results; pingRTT,
bandwidth consumption, packet interval time, and packet
size distribution.
A. Result of Experiment 1-- Ping Round Trip Time (RTT)
The goal of this experiment was to investigate the effect
of DVTS traffic load using pingRTT and variable
bandwidths from 10, 100, and 1,000 Mbps. This experiment
presents the PingRTT with and without DVTS traffic. There
are two interesting ranges as shown in Fig. s 3, 4, and 5.
In the first range (1 to 300 packets), there is only ping ICMP packets using hrPing sent continually from receiver to sender every 100 ms with a packet size equal to 1,024 bytes, as shown in Fig. 3.
In the second range (301 to 600 packets), there are two parts running simultaneously. In the first part, ping ICMP packets using hrPing are sent continually from receiver to sender every 100 ms with packet size equal to 1,024 bytes. In the other part, the sender started sending DVTS. It was measured on 12/09/2011, and 19/09/2011.
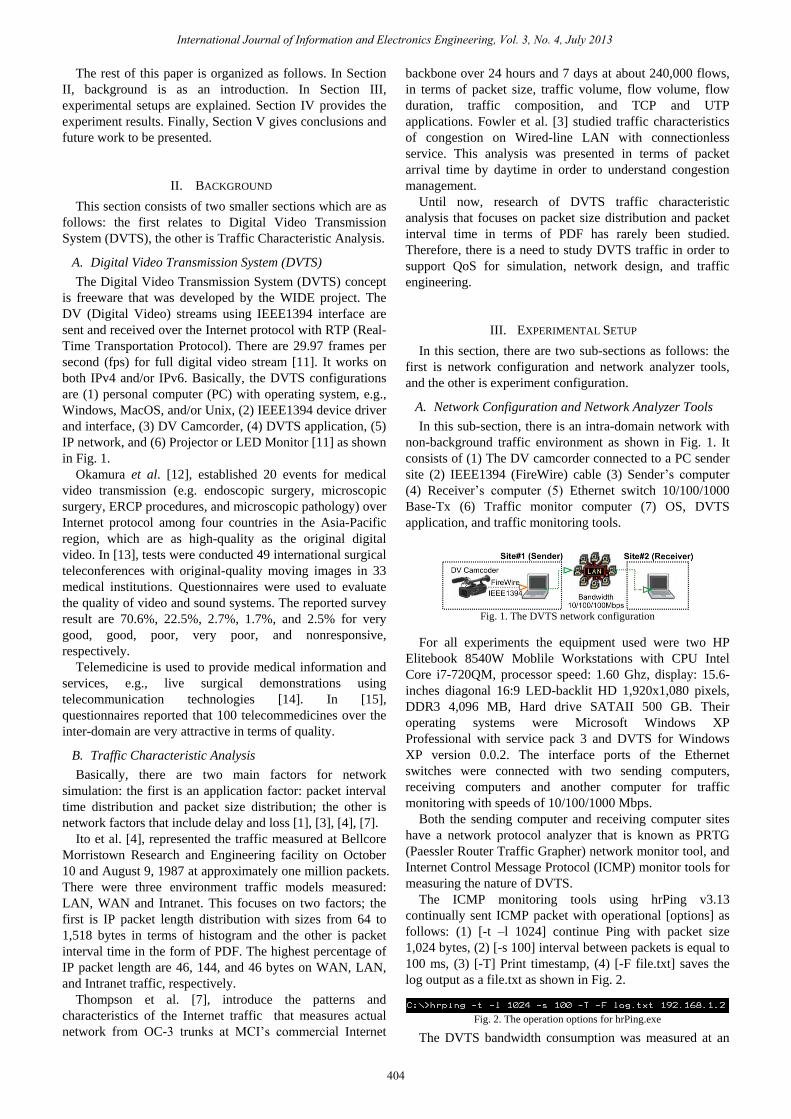
Fig. 3 presents the comparison of PingRTT packets
without DVTS (1 to 309) and PingRTT packets with DVTS
(310 to 600) over data-rate of 10Mbps. It can be seen that
when the traffic of DVTS starting at the average of Ping
RTT is increased up to 110 times it compares with ICMP
only in the first range.
5.596 ms
24.943 ms
0
5
10
15
20
25
30
Rou
nd T
rip
Tim
e (
ms)
Number ICMP of packets
pingRTT (ms)
- Start sending DVTS- ICMP with 1,024 byte
Fig. 3. A comparison of PingRTT with and without DVTS and PingRTT
packets with DVTS over a data-rate of 10Mbps
Table I shows the lost, minimum, maximum, average, and
standard deviation of pingRTT between “with DVTS” and
“without DVTS” traffic, which is over LAN 10 Mbps. From
the result in column 6, it is found that the standard deviation
of pingRTT introduces itself at 3,362.50% when compared
to non DVTS traffic. In the maximum at column 5, the
contrast of values is shown when starting the DVTS traffic.
Additionally, the relationship among minimum, maximum,
average, and standard deviation of pingRTT are always in
the same direction.
TABLE I : STATISTICS FOR ICMP WITH AND WITHOUT DVTS TRAFFIC
(10MBPS)
Type Lost Min Avg Max Std.
Without DVTS 0 5.40 5.56 6.44 0.08
With DVTS 0 5.38 11.66 24.94 2.77
% - + 0 -0.37 109.71 287.27 3,362.50
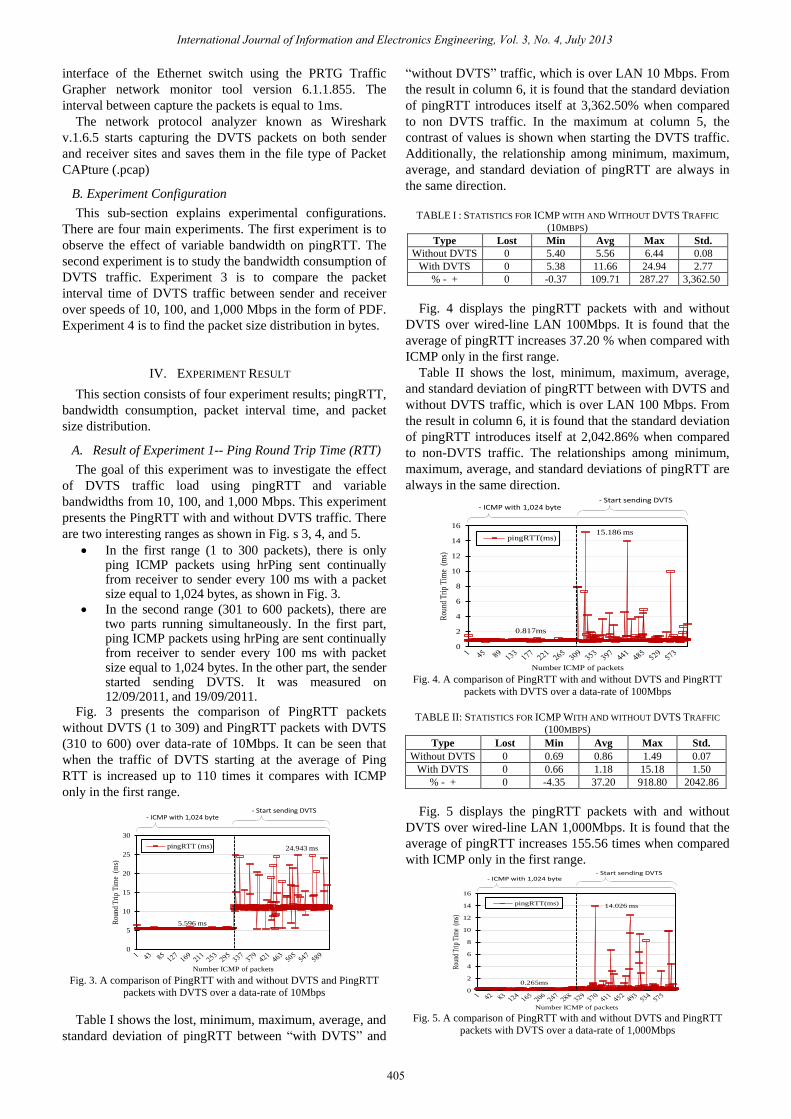
Fig. 4 displays the pingRTT packets with and without
DVTS over wired-line LAN 100Mbps. It is found that the
average of pingRTT increases 37.20 % when compared with
ICMP only in the first range.
Table II shows the lost, minimum, maximum, average,
and standard deviation of pingRTT between with DVTS and
without DVTS traffic, which is over LAN 100 Mbps. From
the result in column 6, it is found that the standard deviation
of pingRTT introduces itself at 2,042.86% when compared
to non-DVTS traffic. The relationships among minimum,
maximum, average, and standard deviations of pingRTT are
always in the same direction.
0.817ms
15.186 ms
0
2
4
6
8
10
12
14
16
Rou
nd T
rip
Tim
e (
ms)
Number ICMP of packets
pingRTT(ms)
- Start sending DVTS- ICMP with 1,024 byte
Fig. 4. A comparison of PingRTT with and without DVTS and PingRTT
packets with DVTS over a data-rate of 100Mbps
TABLE II: STATISTICS FOR ICMP WITH AND WITHOUT DVTS TRAFFIC
(100MBPS)
Type Lost Min Avg Max Std.
Without DVTS 0 0.69 0.86 1.49 0.07
With DVTS 0 0.66 1.18 15.18 1.50
% - + 0 -4.35 37.20 918.80 2042.86
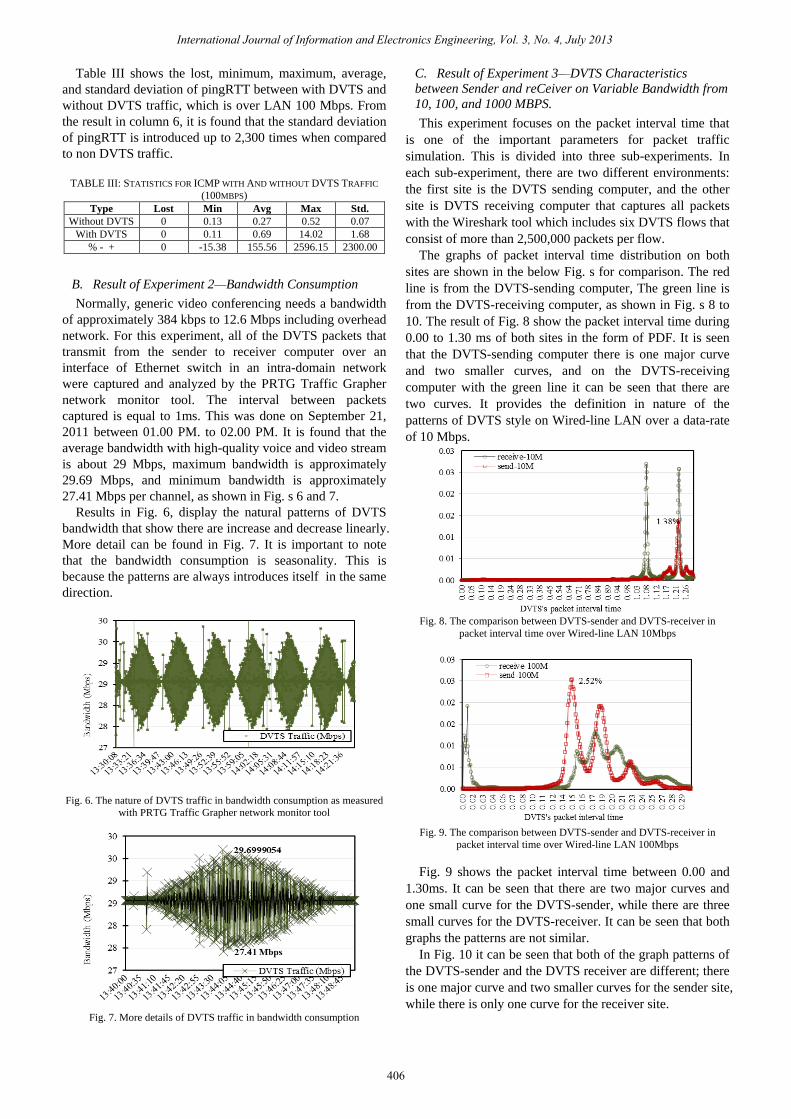
Fig. 5 displays the pingRTT packets with and without
DVTS over wired-line LAN 1,000Mbps. It is found that the
average of pingRTT increases 155.56 times when compared
with ICMP only in the first range.
0.265ms
14.026 ms
0
2
4
6
8
10
12
14
16
Rou
nd T
rip T
ime
(ms)
Number ICMP of packets
pingRTT(ms)
- Start sending DVTS- ICMP with 1,024 byte
Fig. 5. A comparison of PingRTT with and without DVTS and PingRTT
packets with DVTS over a data-rate of 1,000Mbps
International Journal of Information and Electronics Engineering, Vol. 3, No. 4, July 2013
405
Table III shows the lost, minimum, maximum, average,
and standard deviation of pingRTT between with DVTS and
without DVTS traffic, which is over LAN 100 Mbps. From
the result in column 6, it is found that the standard deviation
of pingRTT is introduced up to 2,300 times when compared
to non DVTS traffic.
TABLE III: STATISTICS FOR ICMP WITH AND WITHOUT DVTS TRAFFIC
(100MBPS)
Type Lost Min Avg Max Std.
Without DVTS 0 0.13 0.27 0.52 0.07
With DVTS 0 0.11 0.69 14.02 1.68
% - + 0 -15.38 155.56 2596.15 2300.00
B. Result of Experiment 2—Bandwidth Consumption
Normally, generic video conferencing needs a bandwidth
of approximately 384 kbps to 12.6 Mbps including overhead
network. For this experiment, all of the DVTS packets that
transmit from the sender to receiver computer over an
interface of Ethernet switch in an intra-domain network
were captured and analyzed by the PRTG Traffic Grapher
network monitor tool. The interval between packets
captured is equal to 1ms. This was done on September 21,
2011 between 01.00 PM. to 02.00 PM. It is found that the
average bandwidth with high-quality voice and video stream
is about 29 Mbps, maximum bandwidth is approximately
29.69 Mbps, and minimum bandwidth is approximately
27.41 Mbps per channel, as shown in Fig. s 6 and 7.
Results in Fig. 6, display the natural patterns of DVTS
bandwidth that show there are increase and decrease linearly.
More detail can be found in Fig. 7. It is important to note
that the bandwidth consumption is seasonality. This is
because the patterns are always introduces itself in the same
direction.
Fig. 6. The nature of DVTS traffic in bandwidth consumption as measured
with PRTG Traffic Grapher network monitor tool
Fig. 7. More details of DVTS traffic in bandwidth consumption
C. Result of Experiment 3—DVTS Characteristics
between Sender and reCeiver on Variable Bandwidth from
10, 100, and 1000 MBPS.
This experiment focuses on the packet interval time that
is one of the important parameters for packet traffic
simulation. This is divided into three sub-experiments. In
each sub-experiment, there are two different environments:
the first site is the DVTS sending computer, and the other
site is DVTS receiving computer that captures all packets
with the Wireshark tool which includes six DVTS flows that
consist of more than 2,500,000 packets per flow.
The graphs of packet interval time distribution on both
sites are shown in the below Fig. s for comparison. The red
line is from the DVTS-sending computer, The green line is
from the DVTS-receiving computer, as shown in Fig. s 8 to
10. The result of Fig. 8 show the packet interval time during
0.00 to 1.30 ms of both sites in the form of PDF. It is seen
that the DVTS-sending computer there is one major curve
and two smaller curves, and on the DVTS-receiving
computer with the green line it can be seen that there are
two curves. It provides the definition in nature of the
patterns of DVTS style on Wired-line LAN over a data-rate
of 10 Mbps.
Fig. 8. The comparison between DVTS-sender and DVTS-receiver in
packet interval time over Wired-line LAN 10Mbps
Fig. 9. The comparison between DVTS-sender and DVTS-receiver in
packet interval time over Wired-line LAN 100Mbps
Fig. 9 shows the packet interval time between 0.00 and
1.30ms. It can be seen that there are two major curves and
one small curve for the DVTS-sender, while there are three
small curves for the DVTS-receiver. It can be seen that both
graphs the patterns are not similar.
In Fig. 10 it can be seen that both of the graph patterns of
the DVTS-sender and the DVTS receiver are different; there
is one major curve and two smaller curves for the sender site,
while there is only one curve for the receiver site.
International Journal of Information and Electronics Engineering, Vol. 3, No. 4, July 2013
406
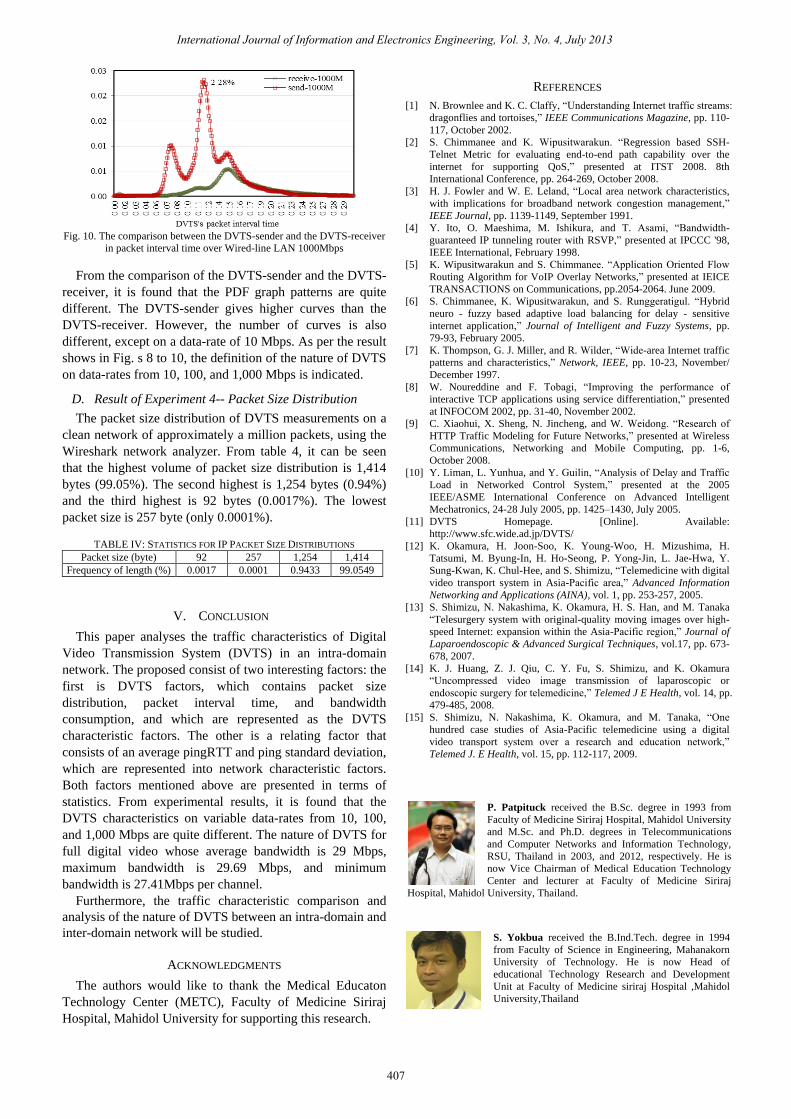
Fig. 10. The comparison between the DVTS-sender and the DVTS-receiver
in packet interval time over Wired-line LAN 1000Mbps
From the comparison of the DVTS-sender and the DVTS-
receiver, it is found that the PDF graph patterns are quite
different. The DVTS-sender gives higher curves than the
DVTS-receiver. However, the number of curves is also
different, except on a data-rate of 10 Mbps. As per the result
shows in Fig. s 8 to 10, the definition of the nature of DVTS
on data-rates from 10, 100, and 1,000 Mbps is indicated.
D. Result of Experiment 4-- Packet Size Distribution
The packet size distribution of DVTS measurements on a
clean network of approximately a million packets, using the
Wireshark network analyzer. From table 4, it can be seen
that the highest volume of packet size distribution is 1,414
bytes (99.05%). The second highest is 1,254 bytes (0.94%)
and the third highest is 92 bytes (0.0017%). The lowest
packet size is 257 byte (only 0.0001%).
TABLE IV: STATISTICS FOR IP PACKET SIZE DISTRIBUTIONS
Packet size (byte) 92 257 1,254 1,414
Frequency of length (%) 0.0017 0.0001 0.9433 99.0549
V. CONCLUSION
This paper analyses the traffic characteristics of Digital
Video Transmission System (DVTS) in an intra-domain
network. The proposed consist of two interesting factors: the
first is DVTS factors, which contains packet size
distribution, packet interval time, and bandwidth
consumption, and which are represented as the DVTS
characteristic factors. The other is a relating factor that
consists of an average pingRTT and ping standard deviation,
which are represented into network characteristic factors.
Both factors mentioned above are presented in terms of
statistics. From experimental results, it is found that the
DVTS characteristics on variable data-rates from 10, 100,
and 1,000 Mbps are quite different. The nature of DVTS for
full digital video whose average bandwidth is 29 Mbps,
maximum bandwidth is 29.69 Mbps, and minimum
bandwidth is 27.41Mbps per channel.
Furthermore, the traffic characteristic comparison and
analysis of the nature of DVTS between an intra-domain and
inter-domain network will be studied.
ACKNOWLEDGMENTS
The authors would like to thank the Medical Educaton
Technology Center (METC), Faculty of Medicine Siriraj
Hospital, Mahidol University for supporting this research.
REFERENCES
[1]
N. Brownlee and K. C. Claffy, “Understanding Internet traffic streams:
dragonflies and tortoises,” IEEE Communications Magazine, pp.
110-
117, October 2002.
[2]
S. Chimmanee and K. Wipusitwarakun. “Regression based SSH-
Telnet Metric for evaluating end-to-end path capability over the
internet for supporting QoS,” presented at ITST 2008. 8th
International Conference, pp.
264-269, October 2008.
[3]
H.
J. Fowler and W.
E.
Leland, “Local area network characteristics,
with implications for broadband network congestion management,”
IEEE Journal, pp. 1139-1149, September 1991.
[4]
Y. Ito, O. Maeshima, M. Ishikura, and T.
Asami, “Bandwidth-
guaranteed IP tunneling router with RSVP,” presented at IPCCC '98,
IEEE International, February 1998.
[5]
K. Wipusitwarakun and S. Chimmanee. “Application Oriented Flow
Routing Algorithm for VoIP Overlay Networks,” presented at IEICE
TRANSACTIONS on Communications, pp.2054-2064. June 2009.
[6]
S. Chimmanee, K. Wipusitwarakun, and S. Runggeratigul. “Hybrid
neuro - fuzzy based adaptive load balancing for delay - sensitive
internet application,”
Journal of Intelligent and Fuzzy Systems, pp.
79-93, February 2005.
[7]
K. Thompson, G.
J. Miller, and R. Wilder, “Wide-area Internet traffic
patterns and characteristics,”
Network,
IEEE, pp. 10-23, November/
December 1997.
[8]
W. Noureddine and F.
Tobagi, “Improving the performance of
interactive TCP applications using service differentiation,” presented
at INFOCOM 2002, pp. 31-40, November 2002.
[9]
C. Xiaohui, X. Sheng, N. Jincheng, and W. Weidong. “Research of
HTTP Traffic Modeling for Future Networks,” presented at Wireless
Communications, Networking and Mobile Computing, pp. 1-6,
October 2008.
[10]
Y. Liman, L. Yunhua, and Y. Guilin, “Analysis of Delay and Traffic
Load in Networked Control System,” presented at the 2005
IEEE/ASME International Conference on Advanced Intelligent
Mechatronics, 24-28 July 2005, pp. 1425–1430, July 2005.
[11]
DVTS Homepage. [Online]. Available:
http://www.sfc.wide.ad.jp/DVTS/
[12]
K. Okamura, H. Joon-Soo, K. Young-Woo, H. Mizushima, H.
Tatsumi, M. Byung-In, H. Ho-Seong, P. Yong-Jin, L. Jae-Hwa, Y.
Sung-Kwan, K. Chul-Hee, and S. Shimizu, “Telemedicine with digital
video transport system in Asia-Pacific area,” Advanced Information
Networking and Applications (AINA), vol. 1, pp. 253-257, 2005.
[13]
S. Shimizu, N. Nakashima, K. Okamura, H. S. Han, and M. Tanaka
“Telesurgery system with original-quality moving images over high-
speed Internet: expansion within the Asia-Pacific region,” Journal of
Laparoendoscopic & Advanced Surgical Techniques, vol.17, pp. 673-
678, 2007.
[14]
K. J. Huang, Z. J. Qiu, C. Y. Fu, S. Shimizu, and K. Okamura
“Uncompressed video image transmission of laparoscopic or
endoscopic surgery for telemedicine,” Telemed J E Health, vol. 14, pp.
479-485, 2008.
[15]
S. Shimizu, N. Nakashima, K. Okamura, and M. Tanaka, “One
hundred case studies of Asia-Pacific telemedicine using a digital
video transport system over a research and education network,”
Telemed J. E Health, vol. 15, pp.
112-117, 2009.
P.
Patpituck received the B.Sc. degree in 1993 from
Faculty of Medicine Siriraj Hospital, Mahidol University
and M.Sc. and Ph.D. degrees in Telecommunications
and Computer Networks and Information Technology,
RSU, Thailand in 2003, and 2012, respectively. He is
now Vice Chairman of Medical Education Technology
Center and lecturer at Faculty of Medicine Siriraj
Hospital, Mahidol University, Thailand.
S.
Yokbua received the B.Ind.Tech. degree in 1994
from Faculty of Science in Engineering, Mahanakorn
University of Technology. He is now Head of
educational Technology Research and Development
Unit at Faculty of Medicine siriraj Hospital ,Mahidol
University,Thailand
International Journal of Information and Electronics Engineering, Vol. 3, No. 4, July 2013
407
International Journal of Information and Electronics Engineering, Vol. 3, No. 4, July 2013
408
S. Phosri received the Bachelor Faculty of Education
degree in 1997, From Ramkhamhaeng University .He is
now Education Technologist Medicine Siriraj Hospital,
Mahidol University, Thailand.
N. Pausawasdi received the B. Ed. degree in
Educational Technology in 1993 from Srinakharinwirot
University, Bangkok, Thailand and MFA in Computer
Arts in 1998 from Academy of Art University, San
Francisco, USA and Ph.D. in Education-Information
Technology in 2002 from James Cook University,
Townsville, Australia. He is currently a Chairman of
Medical Education Technology Center at the Faculty of Medicine Siriraj