Back to Basics: Trends and Educator Outlooks on School Spending • A webinar exclusively for Educational Book and Media Association members • Presented by Bob Stimolo, president and founder, School Market Research Institute, Inc. • Includes recent data collected from: o Survey of school marketers o Survey of school secretaries o Tested marketing strategies and practices
Transcript
Back to Basics:
Trends and Educator Outlooks on School Spending
• A webinar exclusively for Educational Book
and Media Association members
• Presented by Bob Stimolo, president and
founder, School Market Research Institute,
Inc.
• Includes recent data collected from:o Survey of school marketers
o Survey of school secretaries
o Tested marketing strategies and practices
School Secretary Survey
What is your opinion of the amount of direct mail
and catalogs that your school receives each year?
2%
5%
21%
72%
0% 10% 20% 30% 40% 50% 60% 70% 80%
Somewhat less than necessary
Just the right amount
Somewhat more than necessary
Way too much
Source: SMRI-MDR 2018 School Secretary Survey
What is your opinion of the number of email promotions
received by yourself and others in your school each year?
1%
2%
20%
52%
25%
0% 10% 20% 30% 40% 50% 60%
Way too little
Somewhat less than necessary
Just the right amount
Somewhat more than necessary
Way too much
Source: SMRI-MDR 2018 School Secretary Survey
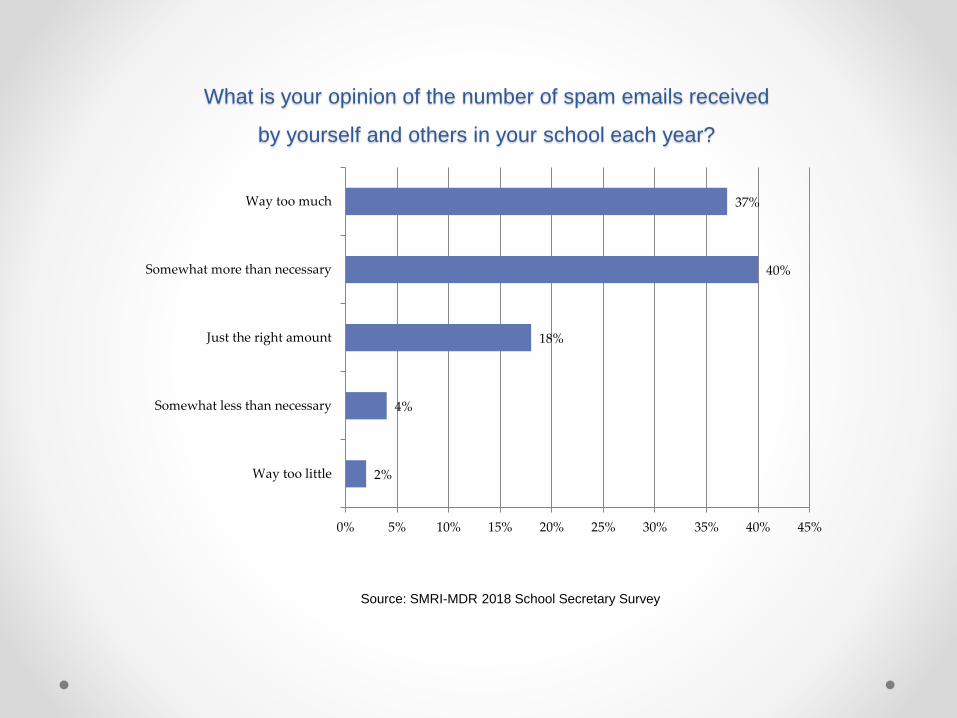
What is your opinion of the number of spam emails received
by yourself and others in your school each year?
2%
4%
18%
40%
37%
0% 5% 10% 15% 20% 25% 30% 35% 40% 45%
Way too little
Somewhat less than necessary
Just the right amount
Somewhat more than necessary
Way too much
Source: SMRI-MDR 2018 School Secretary Survey
How would you rate the technology readiness of your school?
2%
31%
67%
0% 10% 20% 30% 40% 50% 60% 70% 80%
Not yet technology ready
Somewhat technology ready
Very technology ready
Source: SMRI-MDR 2018 School Secretary Survey
In my school at least one computer
with Internet access can be found in:
3%
3%
8%
87%
0% 20% 40% 60% 80% 100%
Few classrooms
Some classrooms
Most classrooms
Every classroom
Source: SMRI-MDR 2018 School Secretary Survey
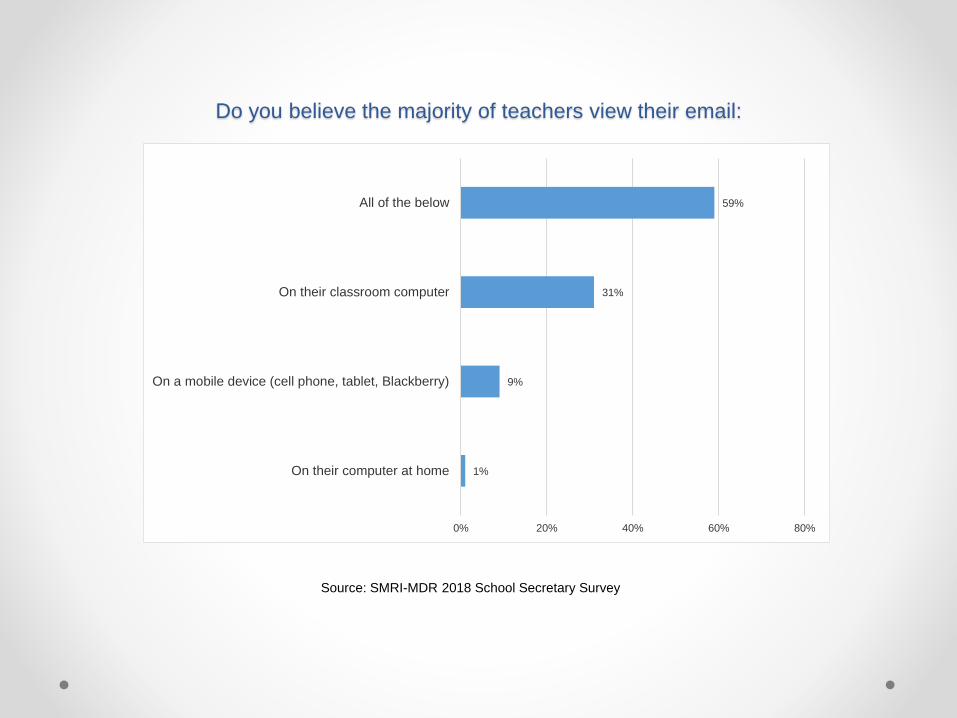
Do you believe the majority of teachers view their email:
1%
9%
31%
59%
0% 20% 40% 60% 80%
On their computer at home
On a mobile device (cell phone, tablet, Blackberry)
On their classroom computer
All of the below
Source: SMRI-MDR 2018 School Secretary Survey
In your opinion what is the single best way to advertise
educational products and services to administrators?
1%
1%
4%
4%
5%
12%
15%
25%
34%
0% 10% 20% 30% 40%
Telephone call
Personal sales call
Social media
Print ads in education magazines and journals
Web ads
Internet search engines
Direct mail (letters, catalogs)
Educator conferences
Email
Source: SMRI-MDR School Secretary Survey
In your opinion, what is the single best way to advertise
educational products and services to teachers?
1%
1%
3%
4%
10%
13%
17%
20%
32%
0% 10% 20% 30% 40%
Telephone call
Personal sales call
Print ads in education magazines and journals
Web ads
Social media
Internet search engines
Direct mail (letters, catalogs)
Educator conferences
Email
Source: SMRI-MDR 2018 School Secretary Survey
In your opinion, what is the single best way to advertise
educational products and services?
0%
5%
10%
15%
20%
25%
30%
35%
40%
Telephone call Personal salescall
Social media Print ads inmagazines &
journals
Web ads Internet searchengines
Direct mail Educatorconferences
Email
Administrators Teachers
Source: SMRI-MDR 2018 School Secretary Survey
School Marketers Most Effective Media vs
School Secretaries Best Way to Advertise
0%
5%
10%
15%
20%
25%
30%
35%
40%
School Marketers
Which is the most
effective media
School Secretaries
Best way to advertise
Source: SMRI 2018 Surveys-School Marketers vs School Secretaries
In the 2017-18 academic year do you expect that your school
will spend more or less on printed instructional materials?
6%
24%
45%
16%
9%
0% 5% 10% 15% 20% 25% 30% 35% 40% 45% 50%
Much less
Somewhat less
The same as last year
Somewhat more
Much more
Source: SMRI-MDR 2018 School Secretary Survey
In the 2017-18 academic year do you expect that
your school will spend more or less on school supplies?
2%
11%
51%
28%
9%
0% 10% 20% 30% 40% 50% 60%
Much less
Somewhat less
The same as last year
Somewhat more
Much more
Source: SMRI-MDR School Secretary Survey
In the academic year 2017-18 do you expect that your school
will spend more or less on digital/online instructional materials?
3%
8%
38%
48%
7%
0% 10% 20% 30% 40% 50% 60%
Much less
Somewhat less
The same as last year
Somewhat more
Much more
Source: SMRI-MDR 2018 School Secretary Survey
In the 2017-18 academic year do you expect that your school
will spend more or less on instructional materials?
0%
10%
20%
30%
40%
50%
60%
Much less Somewhat less The same as last year Somewhat more Much more
Printed Material School Supplies Digital/Online Material
Source: SMRI-MDR School Secretary Survey
What is the biggest issue facing
your school administrators this year?
5%
8%
31%
56%
0% 20% 40% 60%
Implementation of Common Core State Standards
Improvement in technology readiness
Assessments, student performance on standardized tests
School funding
Source: SMRI-MDR 2018 School Secretary Survey
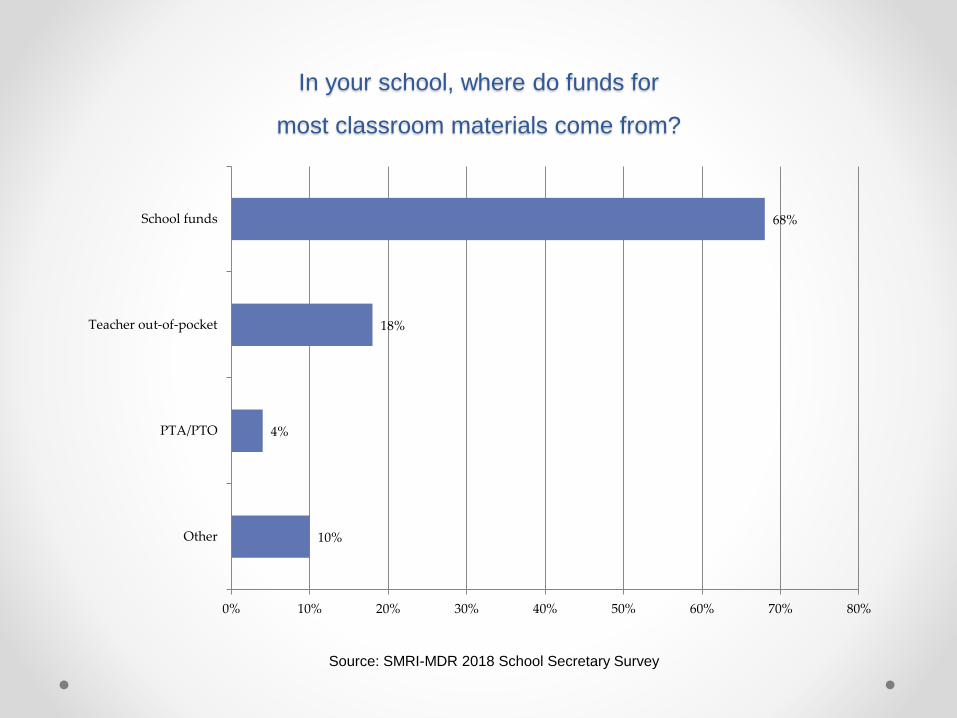
In your school, where do funds for
most classroom materials come from?
10%
4%
18%
68%
0% 10% 20% 30% 40% 50% 60% 70% 80%
Other
PTA/PTO
Teacher out-of-pocket
School funds
Source: SMRI-MDR 2018 School Secretary Survey
The Trump administration has decided to return education policy
decisions to the states. What impact do you think that will have
on states spending to meet federal education requirements?
13%
18%
52%
11%
6%
0% 10% 20% 30% 40% 50% 60%
Funds previously spent will significantly free up
Funds previously spent will somewhat free up
There will be little or no change in spending
Spending will somewhat increase
Spending will significantly increase
Source: SMRI-MDR 2018 School Secretary Survey
Do you think that the Trump administration’s decision
to return education policy decisions to the states will:
6%
12%
42%
22%
18%
0% 5% 10% 15% 20% 25% 30% 35% 40% 45%
Will significantly hinder our school's ability to meet the needs
of students
Will somewhat hinder our school's ability to meet the needs of
students
Will have little or no impact on our school's ability to meet the
needs of students
Allow our school to do a somewhat better job at meeting the
needs of students
Allow our school to do a much better job at meeting the needs
of students
Source: SMRI-MDR 2018 School Secretary Survey
Do you think that school choice and vouchers that enable parents
to choose alternative schools for their children would:
17%
17%
34%
13%
19%
0% 10% 20% 30% 40%
Allow our school to do a much better job at meeting the needsof students
Allow our school to do a somewhat better job at meeting theneeds of students
Will have little or no impact on our school's ability to meet theneeds of students
Will somewhat hinder our school's ability to meet the needs ofstudents
Will significantly hinder our school's ability to meet the needs ofstudents
Source: SMRI-MDR 2018 School Secretary Survey
School Marketer Survey
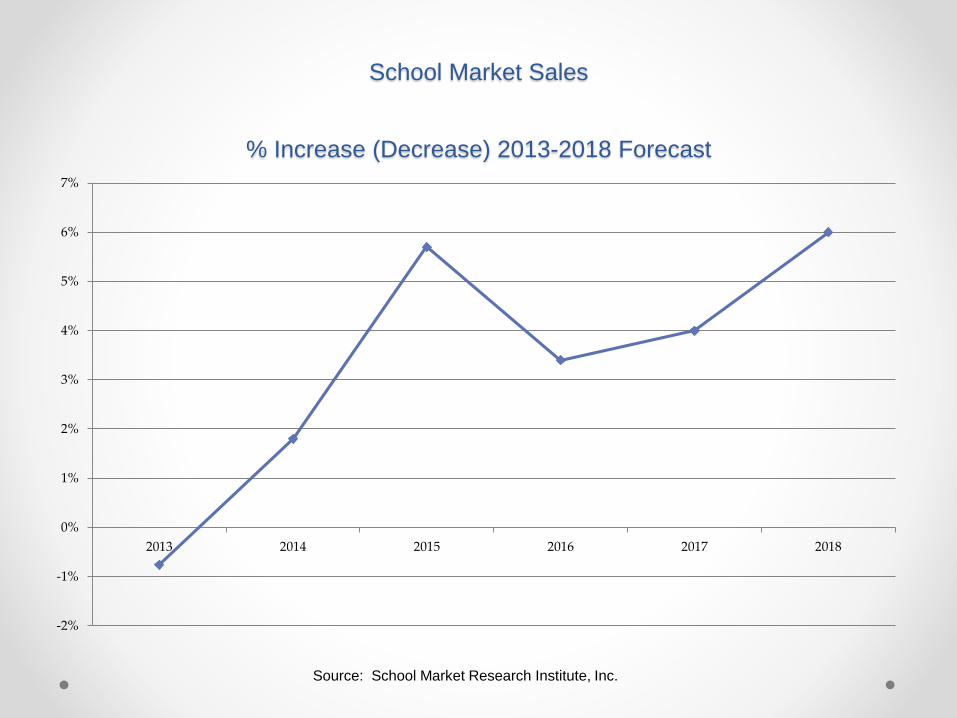
School Market Sales
% Increase (Decrease) 2013-2018 Forecast
-2%
-1%
0%
1%
2%
3%
4%
5%
6%
7%
2013 2014 2015 2016 2017 2018
Source: School Market Research Institute, Inc.
Enrollment (000) by Grade Level
0
5,000
10,000
15,000
20,000
25,000
2013 2014 2015 2016 2017 2018
PreK
Elementary
Middle/Jr
Senior
Source: Projections of Education Statistics to 2025 by NCES
Sales Growth vs Expenditure Per Pupil in Constant $
-4.0%
-2.0%
0.0%
2.0%
4.0%
6.0%
8.0%
2013 2014 2015 2016 2017 2018
Sales
Exp. Per Pupil
Source: Projections of Education Statistics to 2025 by NCES
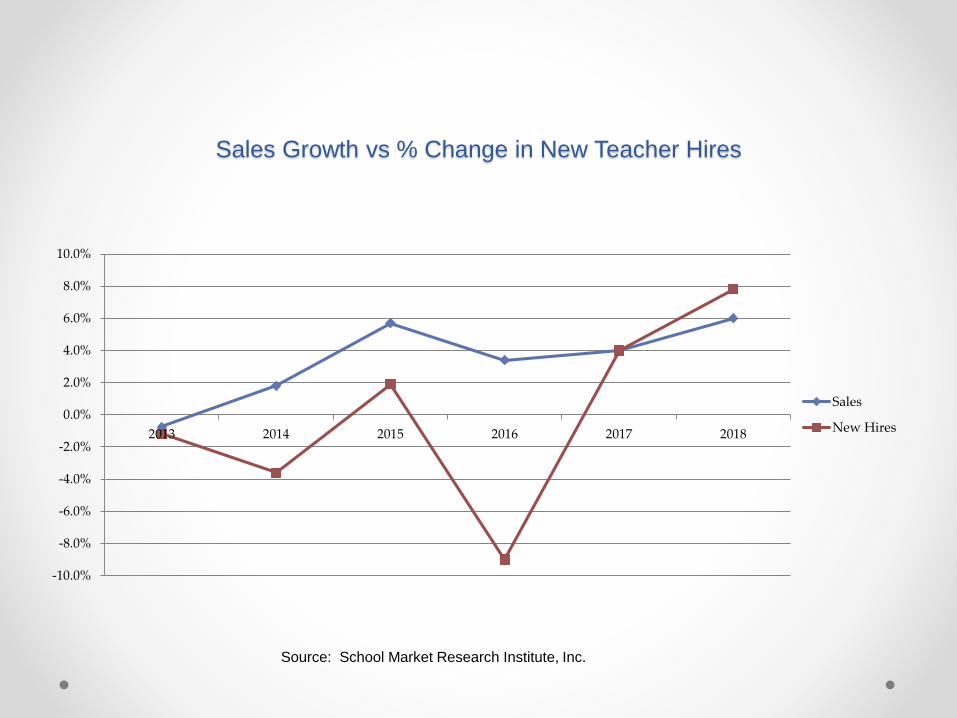
Sales Growth vs % Change in New Teacher Hires
-10.0%
-8.0%
-6.0%
-4.0%
-2.0%
0.0%
2.0%
4.0%
6.0%
8.0%
10.0%
2013 2014 2015 2016 2017 2018
Sales
New Hires
Source: School Market Research Institute, Inc.
Sales Growth by Industry Segment
-6.0%
-4.0%
-2.0%
0.0%
2.0%
4.0%
6.0%
8.0%
10.0%
12.0%
14.0%
2013 2014 2015 2016 2017 2018
Publishing
School Supplies
Furniture
Source: School Market Research Institute, Inc.
Sales Growth by Market Segment
-2.0%
0.0%
2.0%
4.0%
6.0%
8.0%
10.0%
2013 2014 2015 2016 2017 2018
PreK
Elementary
Middle/Jr
Senior
Source: School Market Research Institute, Inc.
Technology Budget Outlook: All Districts 2016-17 School Year
0%
10%
20%
30%
40%
50%
60%
70%
Increase a lot Increase a little Stay the same Decrease a little Decrease a lot
Hardware
Software
Training
Support
Source: EdNET Insight Survey by Market Data Retrieval
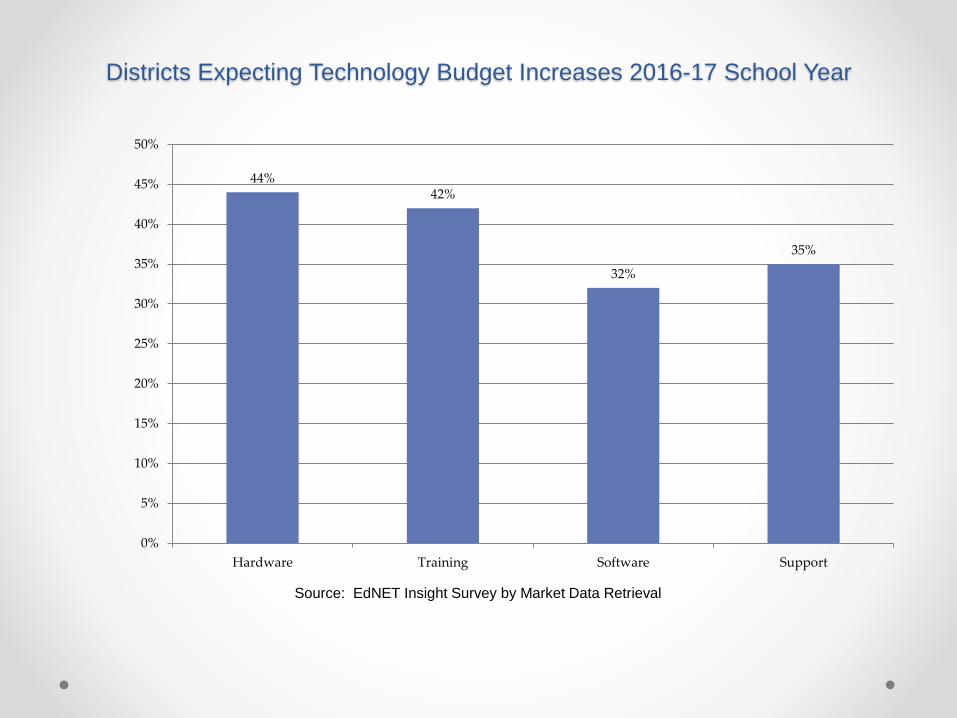
Districts Expecting Technology Budget Increases 2016-17 School Year
44%42%
32%
35%
0%
5%
10%
15%
20%
25%
30%
35%
40%
45%
50%
Hardware Training Software Support
Source: EdNET Insight Survey by Market Data Retrieval
Back to Basic Marketing
School Marketers Most Effective Media
0%
5%
10%
15%
20%
25%
30%
35%
40%
Source: SMRI 2018 Surveys-School Marketers vs School Secretaries