32
Back to Profitability Making Profitability Systems Work for the Bank May 27, 2015 Webinar .
Back to Profitability
Making Profitability Systems Work for the Bank
May 27, 2015Webinar
.

2
AUSTIN ASSOCIATES, LLCFinancial Management Consultants for Community Bankers
Community bank advisors for more than 40 years
Specialized consulting and advisory services
o Asset / Liability Management
o Profitability Measurement &
Improvement
o Loan & Relationship Pricing Systems
o Balance Sheet Structuring
o Regulatory Compliance
Current owners are consultants/managers
Over 200 bank/thrift clients in 2014 in 26 states

Upcoming Webinars
• July 28, 2015 – Strategic Planning
• Sept 29, 2015 – Commercial Loan Pricing
3
Austin Associates Webinar Series

4
PRESENTER
Jeff Morris- joined Austin Associates' Financial
Management Division in 1998. He is responsible for
profitability analysis services and works with clients who
utilize the firm's innovative software products, including
its proprietary organization/product/customer profitability
software and its loan and deposit pricing software, with
over 35 years experience in various financial
management roles.
Jeff MorrisManaging Director & PrincipalFinancial Management & [email protected]
419-517-1775

5
AGENDAProfitability Webinar
May 27, 2015
Industry Trends
Profitability Concepts, Dimensions, Best Practices
Using Profitability Measurement Results
Product
Branch
Officer
Customer

6
INDUSTRY TRENDS
Source: SNL Financial
2004Y 2005Y 2006Y 2007Y 2008Y 2009Y 2010Y 2011Y 2012Y 2013Y 2014Y
Nation Total 13.58% 12.57% 12.57% 7.79% 0.51% -0.93% 5.68% 7.62% 8.68% 9.28% 8.82%
Nation < $1 Bil 11.19% 10.62% 9.72% 7.75% 1.46% -1.66% 1.66% 4.30% 6.17% 7.17% 7.77%
-5.00%
0.00%
5.00%
10.00%
15.00%
10-14%
6-9%

7
BARRIERS TO PROFITABILITY IMPROVEMENT
Low interest rate
environment
Stringent price competition
Slow growth economy /
weak demand
Pressure on fees
Increased regulatory costs

8
PROBLEMS WITH PROFITABILITY SYSTEMS
Cumbersome
Expensive
Fluctuating results
Lack of buy-in, confidence in methodology
Domain of larger banks
Inconsistent with community banking
philosophy
9
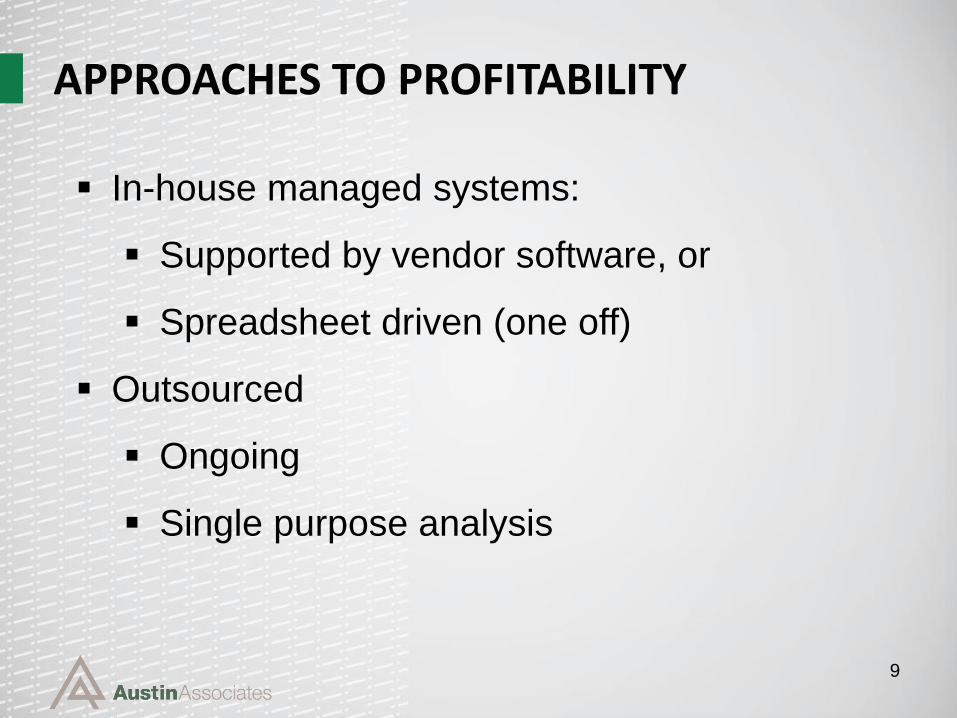
APPROACHES TO PROFITABILITY
In-house managed systems:
Supported by vendor software, or
Spreadsheet driven (one off)
Outsourced
Ongoing
Single purpose analysis

10
PROMISE OF GOOD PROFITABILITY SYSTEMS
Customer centric
Provides understanding of profit drivers
Measurement enables management
Management enables improvement
Tracking improvement period-to-period
Ability to reward performance
11
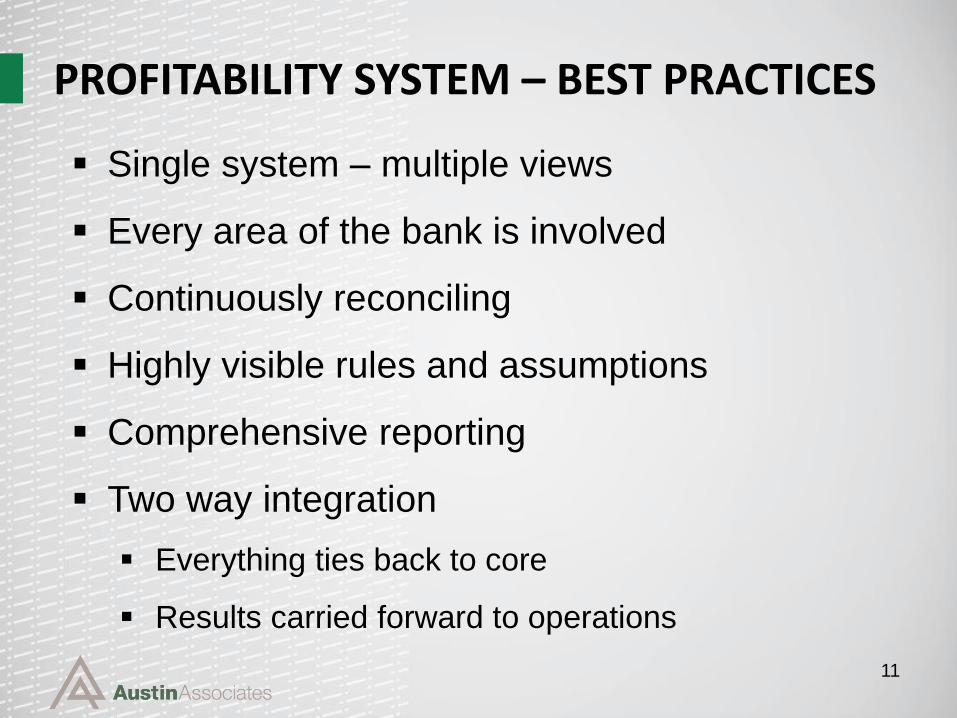
PROFITABILITY SYSTEM – BEST PRACTICES
Single system – multiple views
Every area of the bank is involved
Continuously reconciling
Highly visible rules and assumptions
Comprehensive reporting
Two way integration
Everything ties back to core
Results carried forward to operations

Funds Transfer Pricing
• Maturity Matching FTP for:
– Loans
– Investments
– Certificates
– Other Borrowings
• Blended Rates for:
– Checking
– Savings
• A fully-balanced system
(i.e. Credit for Funding
Equals Costs of Funding)
Operating Cost Allocation
• Identify variable costs and
assign directly to products
• Allocate staff time directly to
the products and services they
provide
• Base overhead allocations on
most reasonable available
statistics
• Use a cost flow diagram to
make costing system visible
• Show cost components by
product in graphic form
12
CRITICAL MEASURES TO GET RIGHT (1 of 2)

13
Example Cost Flow DiagramCost Allocation Process - Conceptual Diagram
Austin Example Institution
Mortgage Loans
$1,057,000 - 14% of Prod Supp
By Natural Classification
of Account TypeBy Department Type
Salaries
$9,662,047
38.7% of Total
75.5% Fixed
24.5 % Variable
Benefits
$3,560,228
14.3% of Total
General Service Depts.
$806 K 3.2%
Administrative
Departments
$6,503 K
26.1%
All Other Costs Combined
$3,045,237
12.2% of Total
Occupancy Costs
$2,461,395
9.9% of Total
Data Processing Costs
$1,655,247 6.6%
Amortization Costs
$1,321,574 5.3%
Franchise Tax
$1,103,826 4.4%
Postage & Supplies
$983,012 3.9%
Deposit Costs
$669,938
2.7%
Advertising Costs
$490,494 2.0%
Direct Costs
of Branches
$10,266 K
41.1%
Branch 3
$0.9 M 9%
Branch 4
$0.9 M 9%
Product Service
Departments
$7,379
29.6% of Total
Branch 9
$0.4 M 4%
All Other Branches (#12)
$3.0 M 30%
Main Branch
$1.7 M 16%
Human Resources Costs
$717,107 11% of Admin Costs
Other Admin. (Marketing, Compliance, etc.)
(-$218,000) (-3%)
Commercial Loans
$3,012,000
41% of Product Support
Checking Accounts
$1,263,000 17% of Prod Supp
Savings Accounts
$900,000 12% of Prod Supp
Certificates of Deposit
$200,000 3% of Prod Supp
Allocate General Service Costs to
Branches And Other
Departments Serviced
Executive Dept Costs
$2,433,774
37% of Admin Costs
Accounting Dept. Costs
$1,925,702
30% of Admin Costs
Data Processing Costs
$1,654,189
25% of Admin Costs
Main Br. Properties $381 K
All Other Branch Props. $425 K
Executive Dept Costs
$2,433,774
37% of Admin Costs
Accounting Dept. Costs
$1,925,702
30% of Admin Costs
Data Processing Costs
$1,654,189
25% of Admin Costs
Costs as Allocated Within General Ledger
By Individual Department
Branch 5
$0.7 M 6%
Branch 6
$0.6 M 6%
Human Resources Costs
$717,107 11% of Admin Costs
Other Admin. (Marketing, Compliance, etc.)
(-$218,000) (-3%)
Commercial Loans
$3,012,000
41% of Product Support
Installment Loans
$946,000 13% of Prod Supp
Installment Loans
$946,000 13% of Prod Supp
Mortgage Loans
$1,057,000 - 14% of Prod Supp
Branch 7
$0.5 M 4%
Branch 8
$0.4 M 4%
Branch 2
$1.1 M 11%
Checking Accounts
$1,263,000 17% of Prod Supp
Savings Accounts
$900,000 12% of Prod Supp
Certificates of Deposit
$200,000 3% of Prod Supp
Main Branch
$1.7 M 16%
Branch 2
$1.1 M 11%
Branch 3
$0.9 M 9%
Branch 4
$0.9 M 9%
All Other Branches (#12)
$3.0 M 30%
Allocate Administrative Costs to
Branches And Other
Departments Serviced
Commercial Loans
$3,012,000
41% of Product Support
Mortgage Loans
$1,057,000 14% of Prod Supp
Installment Loans
$946,000 13% of Prod Supp
Checking Accounts
$1,263,000 17% of Prod Supp
Savings Accounts
$900,000 12% of Prod Supp
Certificates of Deposit
$200,000 3% of Prod Supp
Main Branch
$1.7 M 16%
Branch 5
$0.7 M 6%
Branch 9
$0.4 M 4%
Branch 2
$1.1 M 11%
Branch 3
$0.9 M 9%
Branch 4
$0.9 M 9%
Branch 5
$0.7 M 6%
Branch 9
$0.4 M 4%
Branch 6
$0.6 M 6%
Branch 7
$0.5 M 4%
Branch 8
$0.4 M 4%
Branch 5
$0.7 M 6%
Branch 6
$0.6 M 6%
Branch 7
$0.5 M 4%
Branch 6
$0.6 M 6%
Branch 7
$0.5 M 4%
Branch 8
$0.4 M 4%
Checking
Accounts
Savings
Accounts
Certificates
of Deposit
Trust Department
All Other Branches (#12)
$3.0 M 30%
Allocate Product Support Costs to
Branches
Main Branch
$1.7 M 16%
Branch 2
$1.1 M 11%
Branch 3
$0.9 M 9%
Branch 4
$0.9 M 9%
Total Operating Costs
Direct, Indirect
Assigned & Allocated
$24,952,996
Branch 9
$0.4 M 4%
All Other Branches (#12)
$3.0 M 30%
Allocate Direct & Allocated
Branch Costs to Products
Loans & Deposits
LOANS DEPOSITS
Commercial
Loans
Branch 8
$0.4 M 4%
Mortgage
Loans
Installment
Loans

14
Example Cost by Account Type Summary
$0
$500
$1,000
$1,500
$2,000
$2,500
$3,000
Commercial Loans Mortgage Loans
Cost per Account Components
Direct Salary & Benefits Direct Non Salary
Indirect Salary & Benefits Indirect Non Salary
$2,720
$1,335
$0
$250
$500
$750
$1,000
Mortgage Loans
Direct Salaries
Lead Lender Credit Underwriter Loan Closer Loan Processor
$0
$50
$100
$150
$200
$250
Indirect Salaries
Gen'l Admin IT Finance Marketing
$260
$875

Fee Income Allocations
• Assign at account level
• Directly to account that paid
• Track interchange income
• NSF & ODP
Provision for Loan Losses
• To get to the customer account
level of detail you must track:
Changes to the Reserve (RFLL)
Charge-offs by customer
Recoveries
Upgrades
Downgrades
Relief of Provision for seasoned
loans
15
CRITICAL MEASURES TO GET RIGHT (2 of 2)

16
USING PROFITABILITY RESULTS TO GENERATEIMPROVEMENTS
Involve end users in system development
Tie expectations to elements under their
control
Make all assumptions visible

Audience / Users
• Senior Management
• ALCO
• Marketing
• Operatons
Deliverables
• Profit contribution of each
product ($’s, ROAA, ROAE)
• Product mix strategy
• Product growth
17
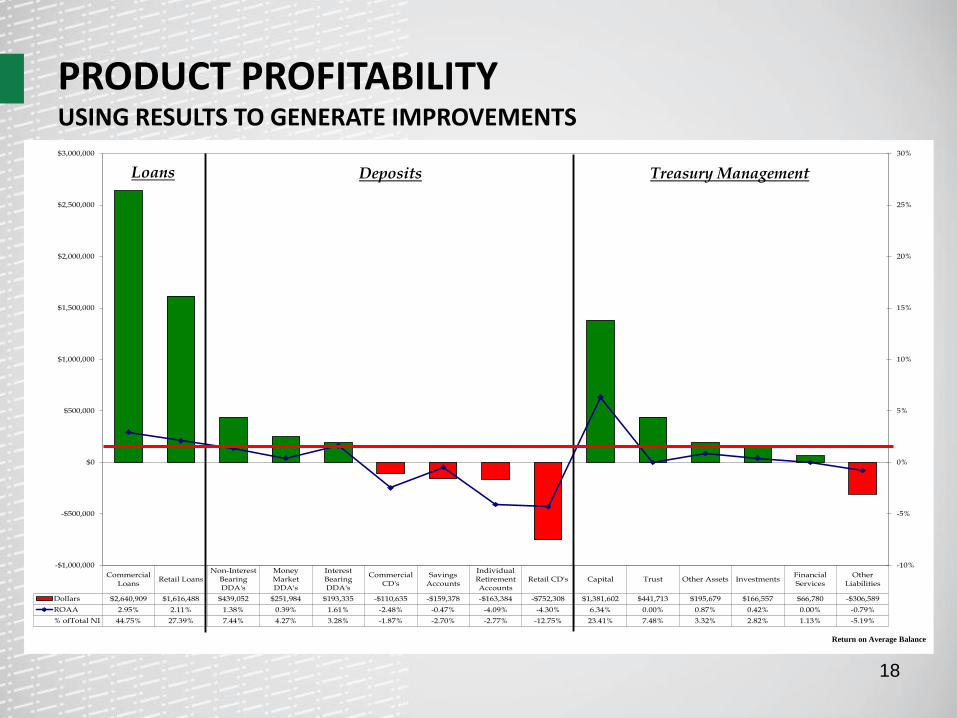
PRODUCT PROFITABILITY USING RESULTS TO GENERATE IMPROVEMENTS
18
PRODUCT PROFITABILITY USING RESULTS TO GENERATE IMPROVEMENTS
CommercialLoans
Retail LoansNon-Interest
BearingDDA's
MoneyMarketDDA's
InterestBearingDDA's
CommercialCD's
SavingsAccounts
IndividualRetirementAccounts
Retail CD's Capital Trust Other Assets InvestmentsFinancialServices
OtherLiabilities
Dollars $2,640,909 $1,616,488 $439,052 $251,984 $193,335 -$110,635 -$159,378 -$163,384 -$752,308 $1,381,602 $441,713 $195,679 $166,557 $66,780 -$306,589
ROAA 2.95% 2.11% 1.38% 0.39% 1.61% -2.48% -0.47% -4.09% -4.30% 6.34% 0.00% 0.87% 0.42% 0.00% -0.79%
% ofTotal NI 44.75% 27.39% 7.44% 4.27% 3.28% -1.87% -2.70% -2.77% -12.75% 23.41% 7.48% 3.32% 2.82% 1.13% -5.19%
-10%
-5%
0%
5%
10%
15%
20%
25%
30%
-$1,000,000
-$500,000
$0
$500,000
$1,000,000
$1,500,000
$2,000,000
$2,500,000
$3,000,000
Return on Average Balance
Treasury ManagementDepositsLoans
19
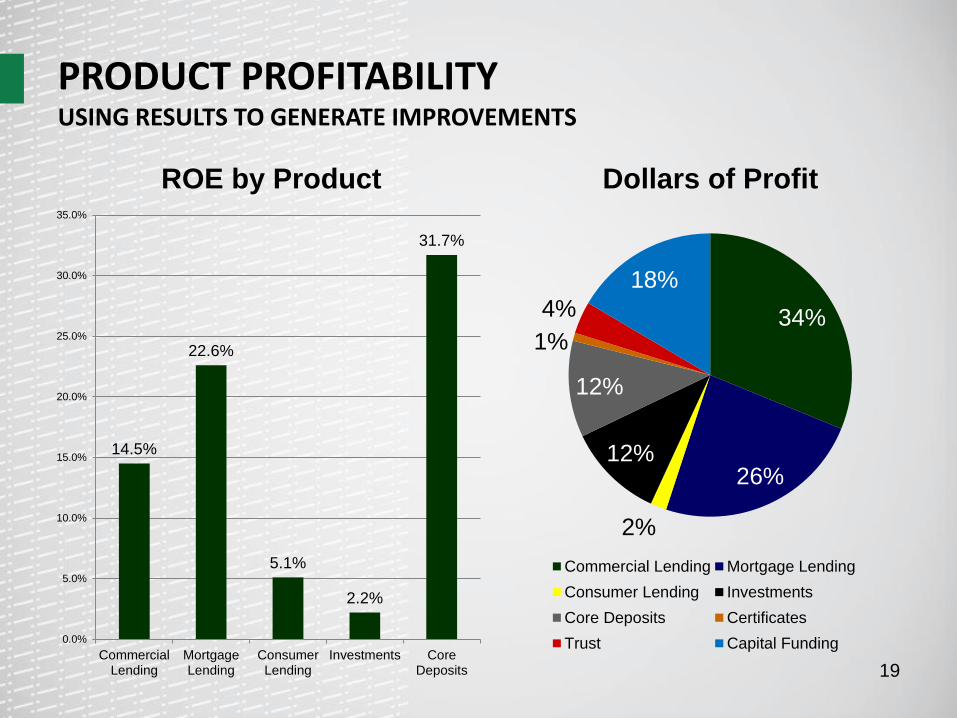
PRODUCT PROFITABILITY USING RESULTS TO GENERATE IMPROVEMENTS
14.5%
22.6%
5.1%
2.2%
31.7%
0.0%
5.0%
10.0%
15.0%
20.0%
25.0%
30.0%
35.0%
CommercialLending
MortgageLending
ConsumerLending
Investments CoreDeposits
ROE by Product
34%
26%
2%
12%
12%
1%
4%
18%
Dollars of Profit
Commercial Lending Mortgage Lending
Consumer Lending Investments
Core Deposits Certificates
Trust Capital Funding

Audience / Users
• Branch Managers
• Marketing
• Operations
• HR / Training
Deliverables
• Most profitable products
• Top 100 most profitable
customers
• Product mix of profitable
customers
• Cross sales success
• Product growth
20
BRANCH PROFITABILITY USING RESULTS TO GENERATE IMPROVEMENTS
21
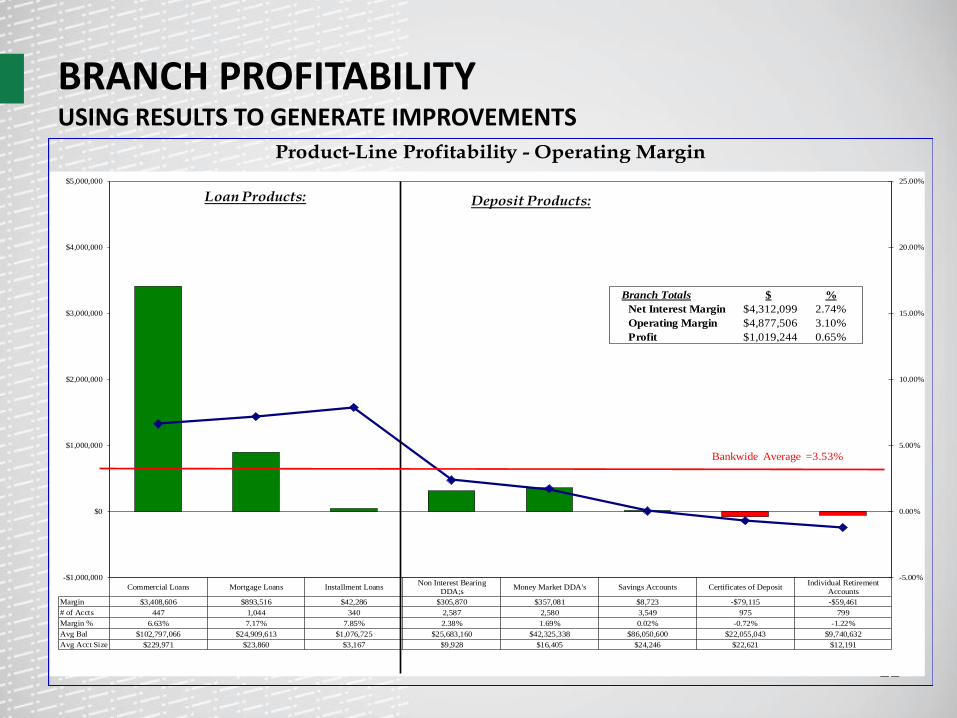
BRANCH PROFITABILITY USING RESULTS TO GENERATE IMPROVEMENTS
Product-Line Profitability - Operating Margin
Commercial Loans Mortgage Loans Installment LoansNon Interest Bearing
DDA;sMoney Market DDA's Savings Accounts Certificates of Deposit
Individual RetirementAccounts
Margin $3,408,606 $893,516 $42,286 $305,870 $357,081 $8,723 -$79,115 -$59,461
# of Accts 447 1,044 340 2,587 2,580 3,549 975 799
Margin % 6.63% 7.17% 7.85% 2.38% 1.69% 0.02% -0.72% -1.22%
Avg Bal $102,797,066 $24,909,613 $1,076,725 $25,683,160 $42,325,338 $86,050,600 $22,055,043 $9,740,632
Avg Acct Size $229,971 $23,860 $3,167 $9,928 $16,405 $24,246 $22,621 $12,191
-5.00%
0.00%
5.00%
10.00%
15.00%
20.00%
25.00%
-$1,000,000
$0
$1,000,000
$2,000,000
$3,000,000
$4,000,000
$5,000,000
Loan Products: Deposit Products:
Bankwide Average =3.53%
Branch Totals $ %
Net Interest Margin $4,312,099 2.74%
Operating Margin $4,877,506 3.10%
Profit $1,019,244 0.65%

22
BRANCH PROFITABILITY USING RESULTS TO GENERATE IMPROVEMENTS
Product-Line Profitability - Operating Margin
Commercial Loans Mortgage Loans Installment LoansNon Interest Bearing
DDA;sMoney Market DDA's Savings Accounts Certificates of Deposit
Individual RetirementAccounts
Margin $27,781 $325,397 $4,663 $47,865 $36,850 $26,528 -$10,056 -$5,367
# of Accts 5 347 35 439 395 462 88 34
Margin % 6.89% 7.10% 5.32% 3.70% 1.92% 0.94% -0.72% -1.86%
Avg Bal $806,313 $9,167,660 $175,267 $2,585,999 $3,839,060 $5,629,785 $2,782,910 $577,240
Avg Acct Size $161,263 $26,420 $5,008 $5,891 $9,719 $12,186 $31,624 $16,978
-10.00%
-5.00%
0.00%
5.00%
10.00%
15.00%
20.00%
-$200,000
-$100,000
$0
$100,000
$200,000
$300,000
$400,000
Loan Products: Deposit Products:
Bankwide Average =3.53%
Branch Totals $ %
Net Interest Margin $350,926 2.75%
Operating Margin $453,660 3.55%
Profit -$4,812 -0.04%

Other Deliverables
• Branch network evaluation
• Sales strategies
• Selling effectiveness
• Funding strategies
• Pricing adjustments
• Value as a source of loan referrals
• Incentives / rewards
23
BRANCH PROFITABILITY USING RESULTS TO GENERATE IMPROVEMENTS

Audience / Users
• Marketing
• Lenders
• Operations
• HR / Training
Deliverables
• Top 100 most profitable
customers
• Customer retention
• Profile of profitable customers
• Prospecting
• Marketing Strategies
24
CUSTOMER PROFITABILITY USING RESULTS TO GENERATE IMPROVEMENTS

25
CUSTOMER PROFITABILITY USING RESULTS TO GENERATE IMPROVEMENTS
Customer Profitability Distribution by Profit Tranche
Profit Dollars
DollarsOf Loss
No. of Customers

26
CUSTOMER PROFITABILITY USING RESULTS TO GENERATE IMPROVEMENTS
4,896 customers with $100 - $1,000 loss per year – if even 2% of these can be converted to a profit of $250 each (addition of one profitable product)
=
+ $56,000

Audience / Users
• Commercial Lenders
• Mortgage Lenders
• Branch Managers
• Senior Management
Deliverables
• Top 10 most profitable
customers
• All customers ranked in
descending order by ROE
• Portfolio average ROE
• Improvement trending
• Best prospects for profitability
improvement
27
OFFICER PROFITABILITY USING RESULTS TO GENERATE IMPROVEMENTS

28
OFFICER PROFITABILITY
0%
5%
10%
15%
20%
25%
30%
35%
40%
$0 $150,000 $300,000 $450,000 $600,000 $750,000
ROE
Lender's Net Income
Commercial Lender Portfolio Returns

29
Time for a few questions ?
THANK YOU FOR ATTENDING TODAY’S WEBINAR!
30
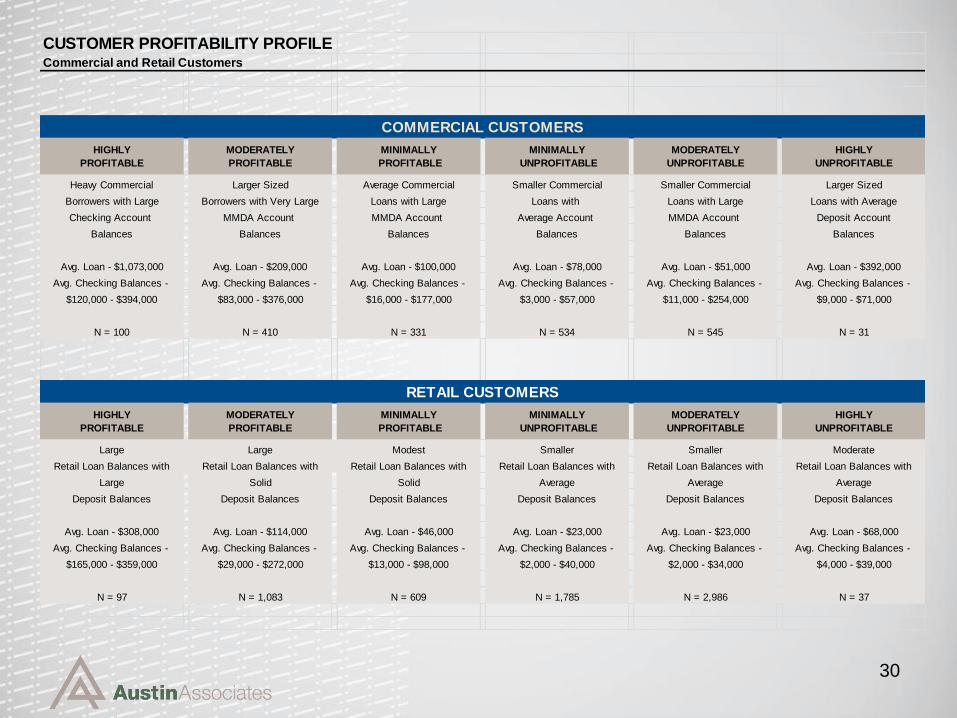
CUSTOMER PROFITABILITY PROFILECommercial and Retail Customers
COMMERCIAL CUSTOMERS
HIGHLY
PROFITABLE
MODERATELY
PROFITABLE
MINIMALLY
PROFITABLE
MINIMALLY
UNPROFITABLE
MODERATELY
UNPROFITABLE
HIGHLY
UNPROFITABLE
Heavy Commercial Larger Sized Average Commercial Smaller Commercial Smaller Commercial Larger Sized
Borrowers with Large Borrowers with Very Large Loans with Large Loans with Loans with Large Loans with Average
Checking Account MMDA Account MMDA Account Average Account MMDA Account Deposit Account
Balances Balances Balances Balances Balances Balances
Avg. Loan - $1,073,000 Avg. Loan - $209,000 Avg. Loan - $100,000 Avg. Loan - $78,000 Avg. Loan - $51,000 Avg. Loan - $392,000
Avg. Checking Balances - Avg. Checking Balances - Avg. Checking Balances - Avg. Checking Balances - Avg. Checking Balances - Avg. Checking Balances -
$120,000 - $394,000 $83,000 - $376,000 $16,000 - $177,000 $3,000 - $57,000 $11,000 - $254,000 $9,000 - $71,000
N = 100 N = 410 N = 331 N = 534 N = 545 N = 31
RETAIL CUSTOMERS
HIGHLY
PROFITABLE
MODERATELY
PROFITABLE
MINIMALLY
PROFITABLE
MINIMALLY
UNPROFITABLE
MODERATELY
UNPROFITABLE
HIGHLY
UNPROFITABLE
Large Large Modest Smaller Smaller Moderate
Retail Loan Balances with Retail Loan Balances with Retail Loan Balances with Retail Loan Balances with Retail Loan Balances with Retail Loan Balances with
Large Solid Solid Average Average Average
Deposit Balances Deposit Balances Deposit Balances Deposit Balances Deposit Balances Deposit Balances
Avg. Loan - $308,000 Avg. Loan - $114,000 Avg. Loan - $46,000 Avg. Loan - $23,000 Avg. Loan - $23,000 Avg. Loan - $68,000
Avg. Checking Balances - Avg. Checking Balances - Avg. Checking Balances - Avg. Checking Balances - Avg. Checking Balances - Avg. Checking Balances -
$165,000 - $359,000 $29,000 - $272,000 $13,000 - $98,000 $2,000 - $40,000 $2,000 - $34,000 $4,000 - $39,000
N = 97 N = 1,083 N = 609 N = 1,785 N = 2,986 N = 37

31
CONTACTS
We appreciate hearing from you.
If you have questions or comments,
regarding today’s Webinar, or if you
would like to see any of your bank’s
current customer relationships
modeled, please feel free to contact
us at any time.
We would also be pleased to
provide your management team
with a personalized demonstration
of the Austin Profitability System -
simply contact Jeff to arrange a
date and time for your demo.
Jeff MorrisManaging Director & PrincipalFinancial Management & Consulting
419-517-1775
Back to Profitability
Making Profitability Systems Work for the Bank
May 27, 2015Webinar
.


