40
Back to the Basics: EKG Interpretation Gaiane Doubinina, RN, MSN, FNP-BC Nurse Practitioner, Cardiac Nuclear Medicine 1

Back to the Basics: EKG Interpretation
Gaiane Doubinina, RN, MSN, FNP-BC Nurse Practitioner, Cardiac Nuclear Medicine
1

Overview
• Establish a consistent approach to
interpreting EKG’s
• Review basic EKG arrhythmias
2
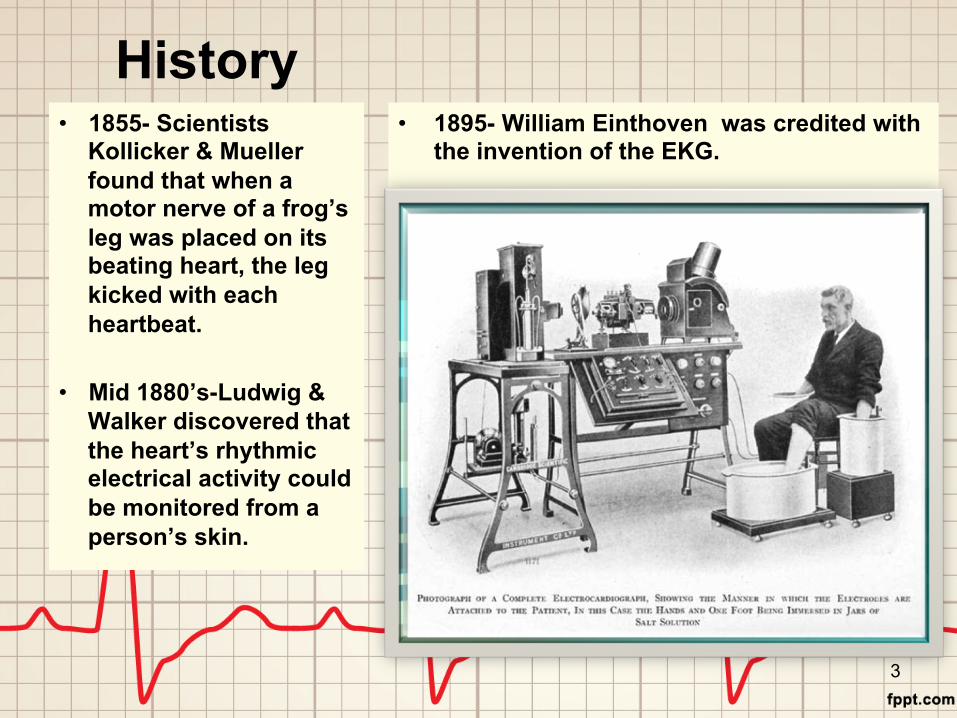
History • 1895- William Einthoven was credited with
the invention of the EKG. • 1855- Scientists
Kollicker & Mueller found that when a motor nerve of a frog’s leg was placed on its beating heart, the leg kicked with each heartbeat.
• Mid 1880’s-Ludwig &
Walker discovered that the heart’s rhythmic electrical activity could be monitored from a person’s skin.
3
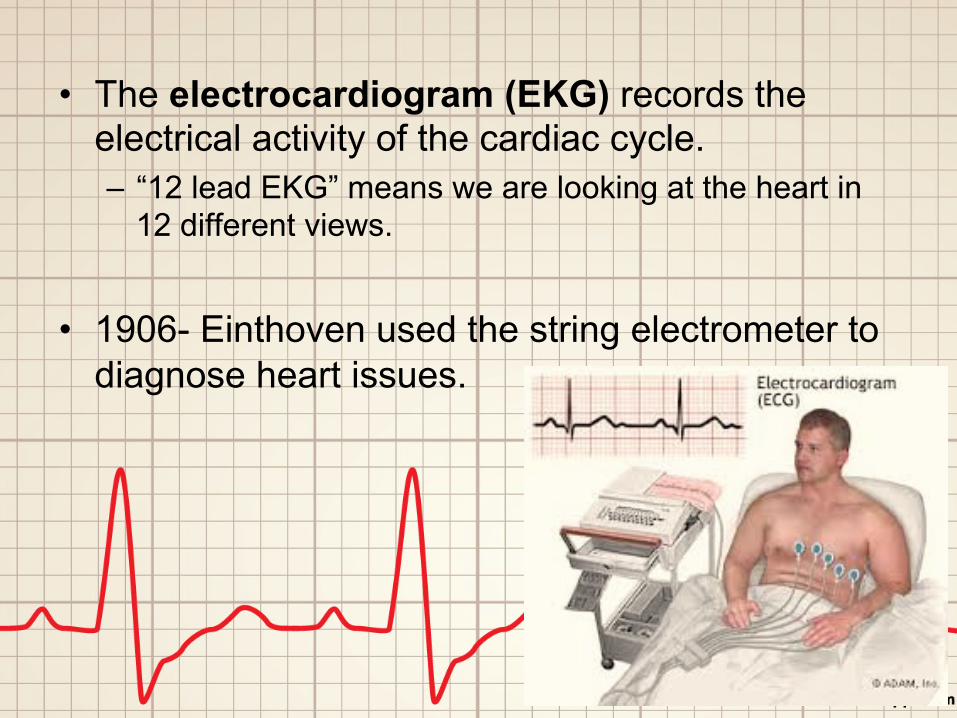
• The electrocardiogram (EKG) records the electrical activity of the cardiac cycle. – “12 lead EKG” means we are looking at the heart in
12 different views.
• 1906- Einthoven used the string electrometer to diagnose heart issues.
4
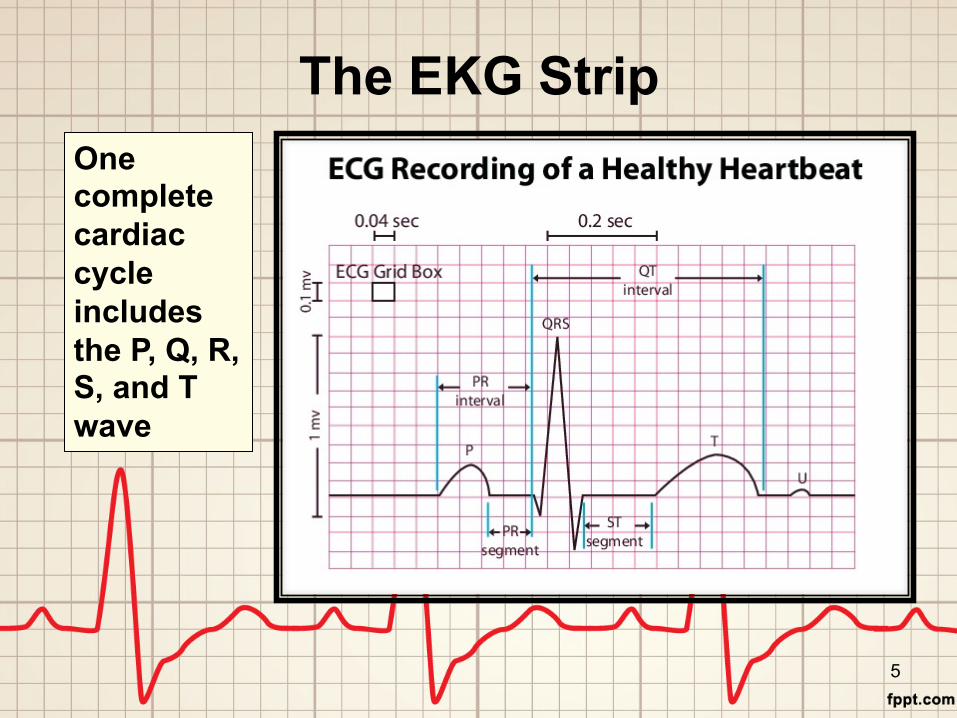
The EKG Strip
5
One complete cardiac cycle includes the P, Q, R, S, and T wave

P-Wave: Atrial contraction
Conduction Pathways Represented on the EKG
During each heartbeat, a healthy heart will have an orderly progression of depolarization that starts with the sinoatrial node, spreads out through the atrium, passes through the atrioventricular node down into the bundle of His and into the Purkinje fibers spreading down throughout the ventricles. This orderly pattern of depolarization gives rise to the characteristic ECG tracing.

5-Step Approach to EKG Interpretation
Analyze the: 1. Rhythm 2. Rate 3. P-wave 4. P-R Interval 5. QRS complex
7

Rhythm
• A sinus rhythm is when the R wave to R wave is occurring at regular intervals.
• If the R wave intervals are variable, then the rhythm is considered to be irregular.
8

Rate • Rate of 60-100 beats per minute (bpm) is normal. • >100 bpm is tachycardia • <60 bpm is bradycardia • Analyzing a rate of a regular rhythm using the
count method:
9

Rate • When the rhythm is irregular, another method
can be used to estimate the rate. Just count the number of R waves in a 6 second strip and multiply that by 10.
• For example, if there are 7 R waves in a 6 second rhythm, the rate is 70 (7x10=70) bpm.
10
R R

P-Wave • Produced upon L and R atrial contraction. • The P wave is the SA node firing at regular
intervals at a rate of 60-100 bpm. • Visible before each QRS complex.
11

P-R Interval • Interval representing AV
conduction time. • Starts at the beginning of
the P-wave to the beginning of the QRS complex.
• Duration of 0.12 to 0.20 sec
QRS Complex • Ventricular depolarization
triggering contraction of the ventricles.
• Starts at the end of P-R interval to end of S wave
• Duration of 0.06 to 0.12 sec
12
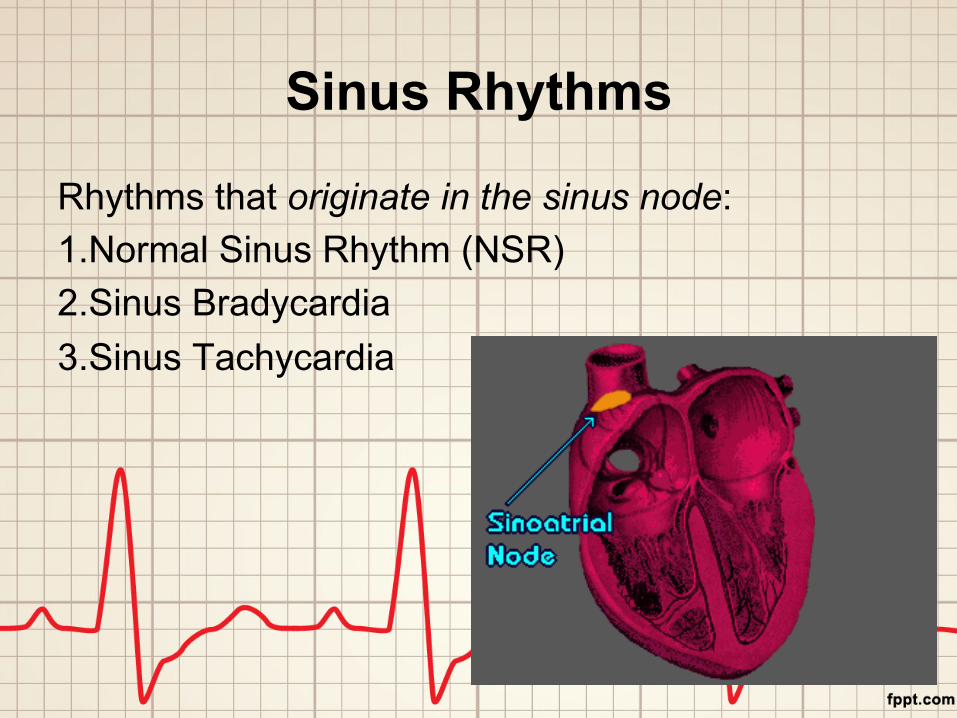
Sinus Rhythms
Rhythms that originate in the sinus node: 1. Normal Sinus Rhythm (NSR) 2. Sinus Bradycardia 3. Sinus Tachycardia
13

Normal Sinus Rhythm • Rhythm: R-R interval constant; rhythm is regular. • Rate: atrial and ventricular rates are equal; 60-100 beats per
minute. • P-Wave: uniform. One p-wave in front of each QRS complex. • P-R: measures between 0.12-0.20 sec; constant across entire
strip. • QRS: measures 0.06-0.12 sec
14

Sinus Bradycardia • Fits in the same criteria as the NSR except that the rate is less
than 60 beats per minute. • Rhythm: Regular • Rate: atrial and ventricular rates are equal; HR=<60 bpm • P-Wave: uniform; one P wave in front of each QRS. • PR: 0.12-0.20 sec • QRS: less than 0.12 sec
15
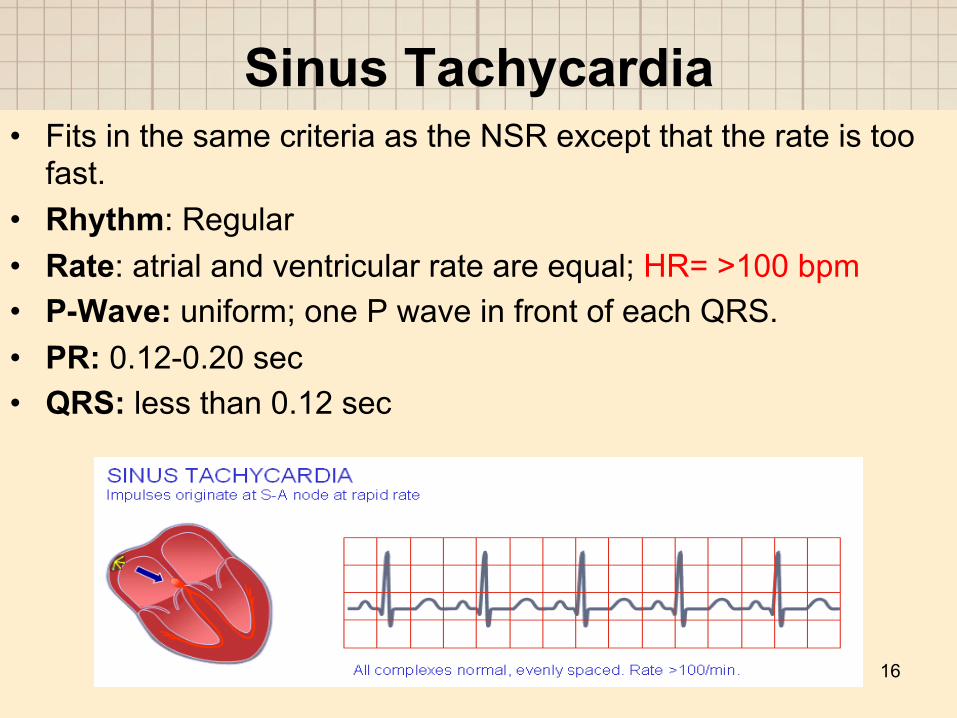
Sinus Tachycardia • Fits in the same criteria as the NSR except that the rate is too
fast. • Rhythm: Regular • Rate: atrial and ventricular rate are equal; HR= >100 bpm • P-Wave: uniform; one P wave in front of each QRS. • PR: 0.12-0.20 sec • QRS: less than 0.12 sec
16
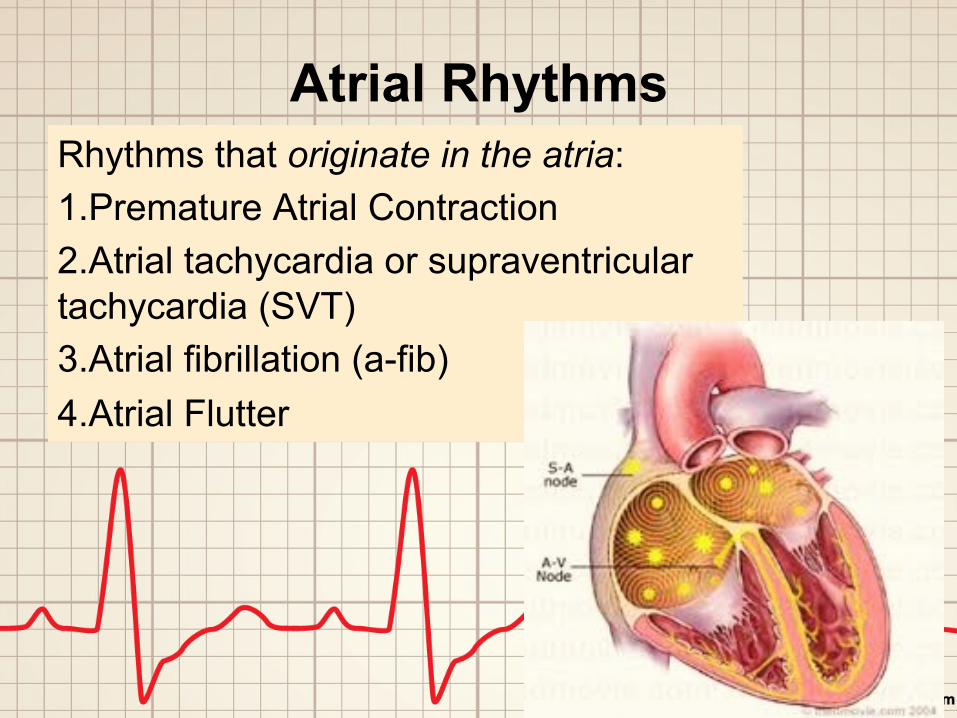
Atrial Rhythms Rhythms that originate in the atria: 1. Premature Atrial Contraction 2. Atrial tachycardia or supraventricular tachycardia (SVT) 3. Atrial fibrillation (a-fib) 4. Atrial Flutter
17

Atrial Rhythms • When the sinus node loses its pace making role,
another site takes over this function. • In atrial arrhythmias, the rhythm originates in the
atria. • Since the P-wave represents atrial depolarization,
you would expect to see an unusual or atypical P-wave, while the QRS remains narrow.
18

Premature Atrial Contraction (PAC) Originates in the atria and occurs before a normal beat.
Can be triggered by anxiety, fever, valve disease, stimulants, or acute MI. • Rhythm: Irregular with PAC’s • Rate: dependent on the rhythm • P-Wave: uniform; one P wave in front of each QRS. • PR: 0.12-0.20 sec, (based on underlying rhythm) • QRS: dependent on the rhythm
19

Supraventricular Tachycardia (SVT) “Supraventricular”= above the ventricles • Rhythm: Regular • Rate: 150-250 bpm • P-Wave: upright, if visible. Rate can be so rapid that the P waves run into the preceding T waves to become indistinguishable. • PR: 0.12-0.20 sec, (based on underlying rhythm) • QRS: Normal
20
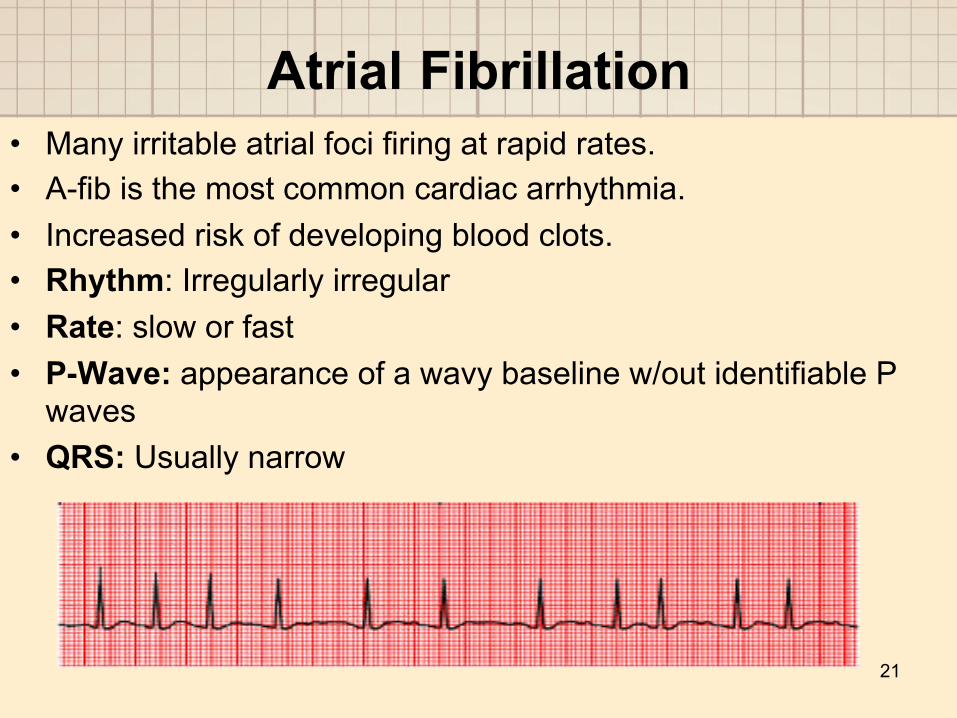
Atrial Fibrillation • Many irritable atrial foci firing at rapid rates. • A-fib is the most common cardiac arrhythmia. • Increased risk of developing blood clots. • Rhythm: Irregularly irregular • Rate: slow or fast • P-Wave: appearance of a wavy baseline w/out identifiable P
waves • QRS: Usually narrow
21

Atrial Flutter • An extremely irritable atrial focus fires at a rate of 250-350 per
minute, producing a rapid series of atrial depolarization's characterized as “saw tooth”.
• Rhythm: Rapid but organized • Rate: atrial rate 250-350, 2:1-8:1 conduction ratio (if ventricular
rate >150, may seriously compromise cardiac output) • P-Wave: Saw tooth • QRS: Usually narrow
22
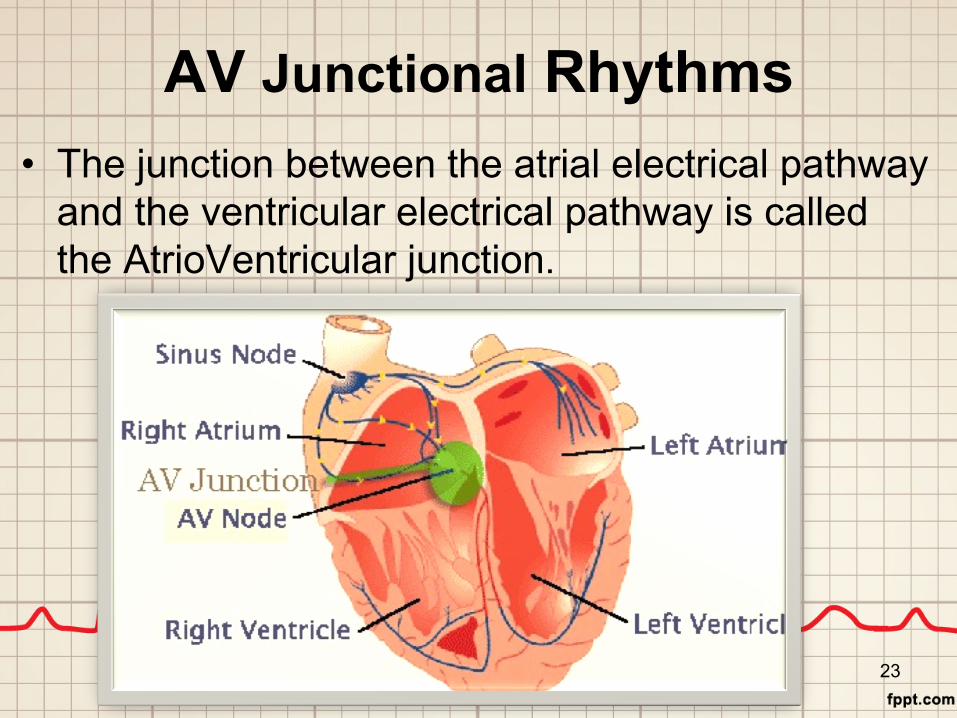
AV Junctional Rhythms • The junction between the atrial electrical pathway
and the ventricular electrical pathway is called the AtrioVentricular junction.
23
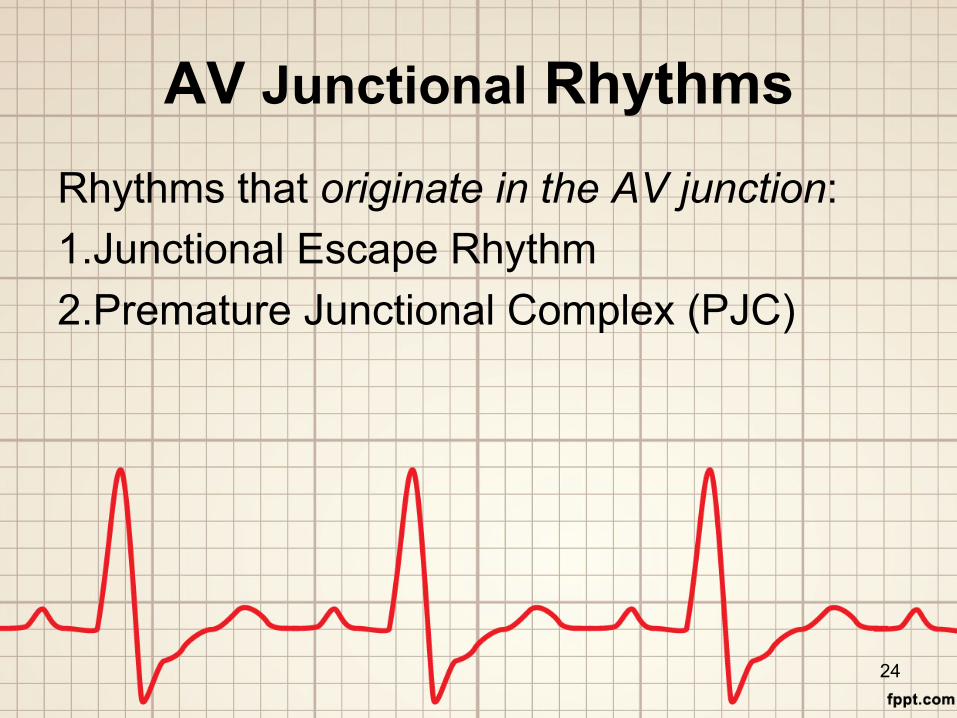
AV Junctional Rhythms Rhythms that originate in the AV junction: 1. Junctional Escape Rhythm 2. Premature Junctional Complex (PJC)
24

Junctional Rhythm • Because the origin is in the junction between the atria and
ventricles, this is called the Junctional Rhythm. • Rhythm: R-R interval constant; rhythm is regular. • Rate: 40-60 bpm • P wave: the irritable junctional focus may also depolarize the
atria from below in retrograde fashion; – Inverted P wave before each QRS – Inverted P wave after each QRS – Inverted P wave buried within each QRS
• P-R: <0.12-0.20 sec • QRS: measures <0.12 sec
25
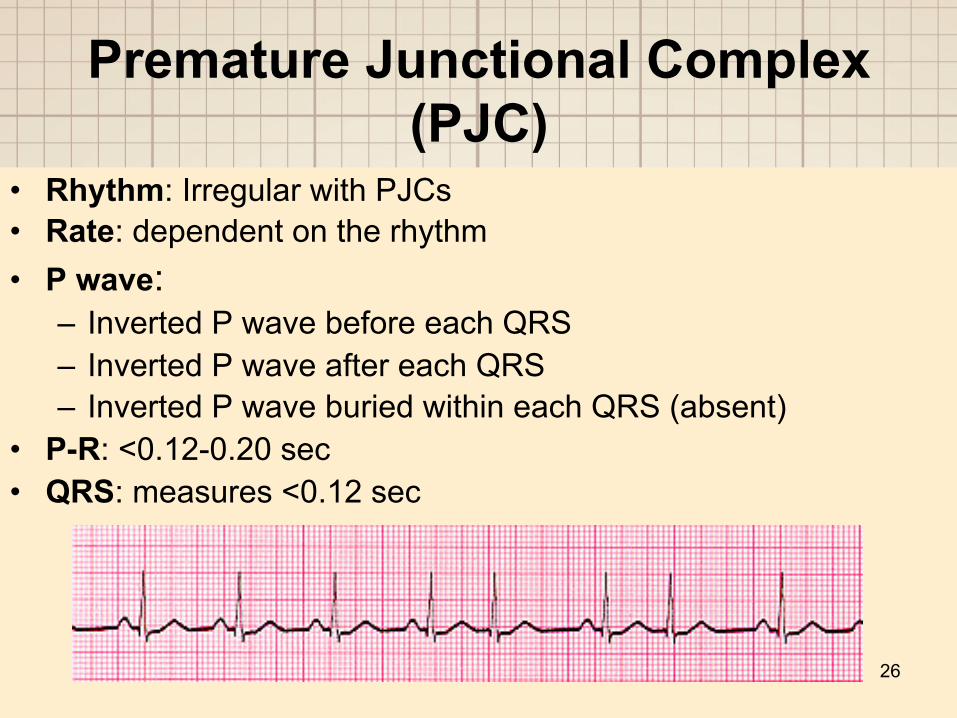
Premature Junctional Complex (PJC)
• Rhythm: Irregular with PJCs • Rate: dependent on the rhythm • P wave:
– Inverted P wave before each QRS – Inverted P wave after each QRS – Inverted P wave buried within each QRS (absent)
• P-R: <0.12-0.20 sec • QRS: measures <0.12 sec
26

Atrioventricular Blocks • Atrioventricular (AV) heart blocks results from an
interruption in the electrical conduction pathway between the atria and ventricles.
• It may be a total or partial block occurring at the AV node, the bundle of His, or the bundle branches.
• AV blocks are classified according to the severity of the block, rather than the location.
27
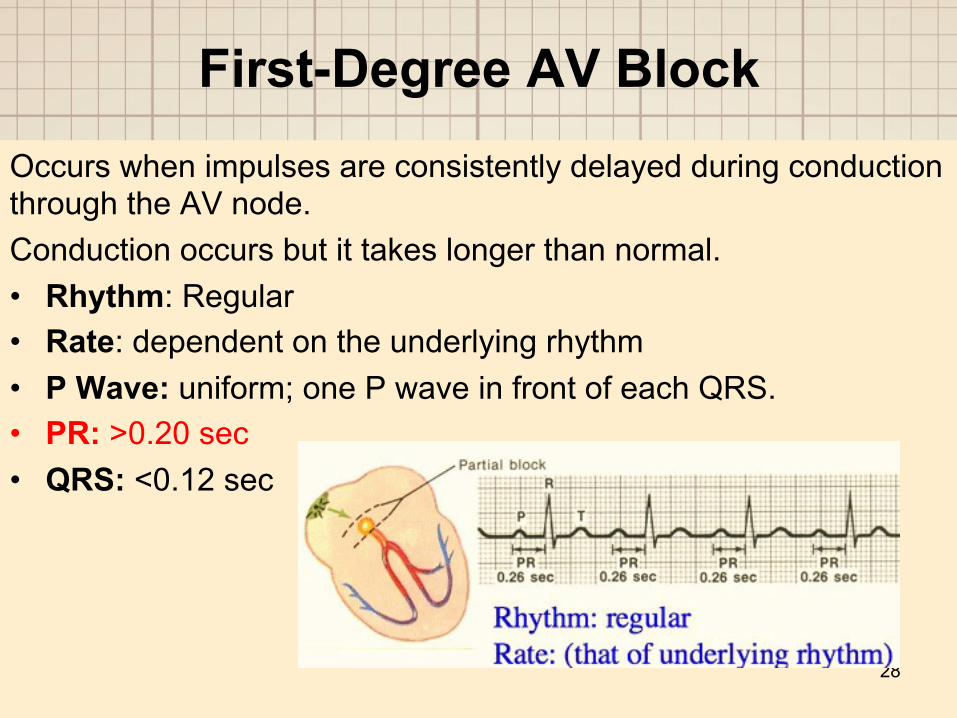
First-Degree AV Block Occurs when impulses are consistently delayed during conduction through the AV node. Conduction occurs but it takes longer than normal. • Rhythm: Regular • Rate: dependent on the underlying rhythm • P Wave: uniform; one P wave in front of each QRS. • PR: >0.20 sec • QRS: <0.12 sec
28

Second Degree AV Block Mobitz I (Wenckebach)
• Wenckebach is a progressive delay at the AV node until a beat is dropped.
• Rhythm: Irregular • PR: progressive lengthening until a beat is dropped (long,
longer, drop) • QRS: <0.12 sec
29
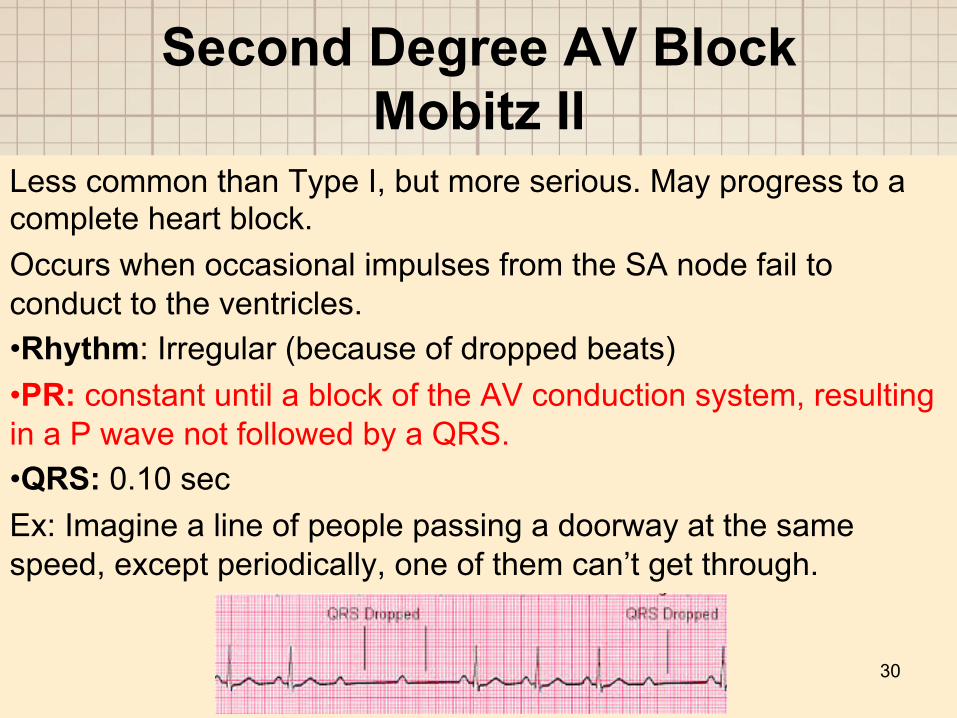
Second Degree AV Block Mobitz II
Less common than Type I, but more serious. May progress to a complete heart block. Occurs when occasional impulses from the SA node fail to conduct to the ventricles. • Rhythm: Irregular (because of dropped beats) • PR: constant until a block of the AV conduction system, resulting in a P wave not followed by a QRS. • QRS: 0.10 sec Ex: Imagine a line of people passing a doorway at the same speed, except periodically, one of them can’t get through.
30
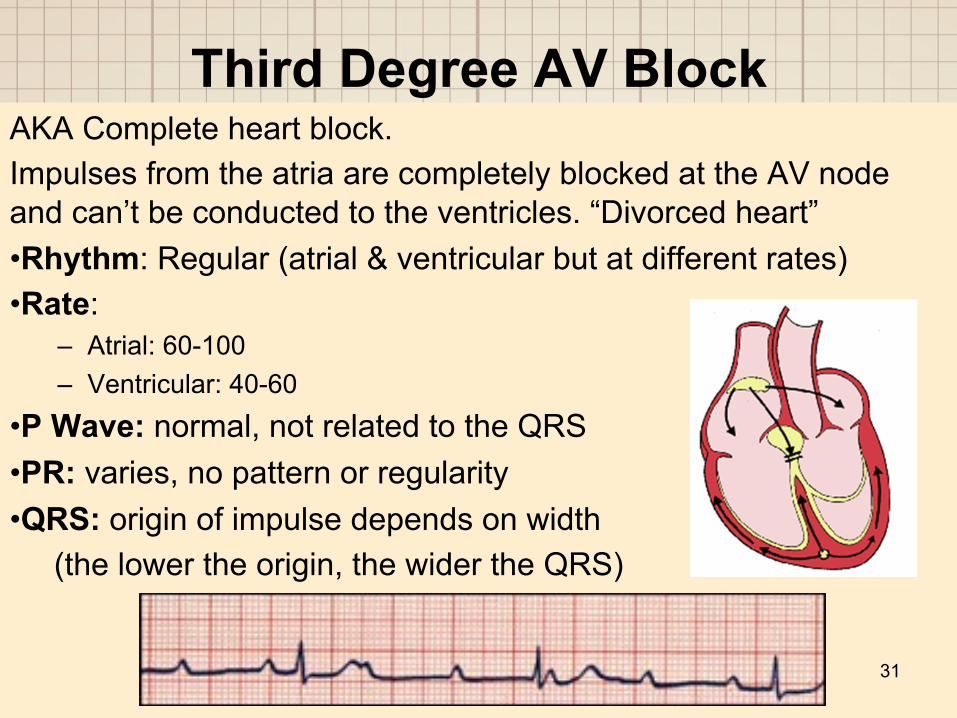
Third Degree AV Block AKA Complete heart block. Impulses from the atria are completely blocked at the AV node and can’t be conducted to the ventricles. “Divorced heart” • Rhythm: Regular (atrial & ventricular but at different rates) • Rate:
– Atrial: 60-100 – Ventricular: 40-60
• P Wave: normal, not related to the QRS • PR: varies, no pattern or regularity • QRS: origin of impulse depends on width (the lower the origin, the wider the QRS)
31

Ventricular Arrythmias • Ventricular arrhythmias originate in the ventricles
below the bundle of His. • On EKG:
– the QRS complex is wider because of the prolonged conduction through the ventricles.
– the P wave is absent because atrial depolarization doesn’t occur.
32

Premature Ventricular Contraction (PVC)
• A PVC is an ectopic beat that may occur isolated, in clusters of two or more (ex: couplet, VT), or in repeating patterns (bigeminy or trigeminy).
• Primary cause: electrical irritability. • Rhythm: irregular • P wave: absent with a PVC, but regularly present with other
QRS complexes. • QRS: greater than 0.12 seconds and “wide and bizarre”
33

Ventricular Tachycardia • Ventricular tachycardia or “V-tach” has 3 or more PVCs
occurring in a row with a ventricular rate exceeding 100 bpm. • Extremely unstable rhythm. If sustained, requires immediate
treatment to prevent death. • Rhythm: Regular • Rate: 100-250 bpm
• P Wave: absent • QRS: 0.24 sec, Wide and Bizarre
34
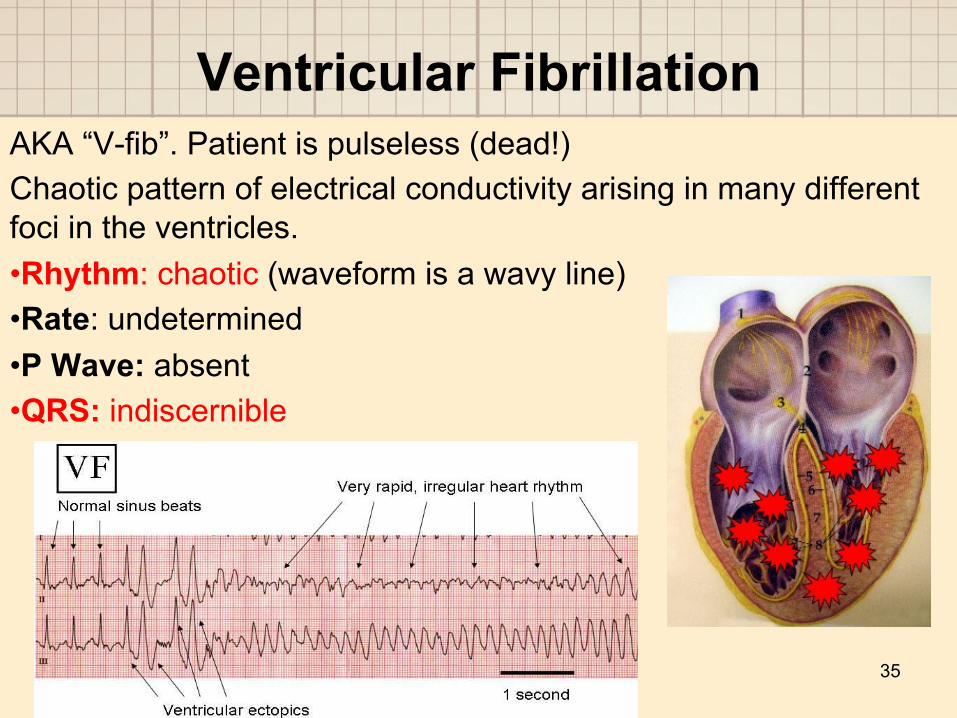
Ventricular Fibrillation AKA “V-fib”. Patient is pulseless (dead!) Chaotic pattern of electrical conductivity arising in many different foci in the ventricles. • Rhythm: chaotic (waveform is a wavy line) • Rate: undetermined
• P Wave: absent • QRS: indiscernible
35

Idioventricular Rhythm Rhythm of last resort. Mechanism to prevent ventricular standstill. His-Purkinje system takes over acting like the heart’s pacemaker. • Rhythm: Regular (Ventricular only) • Rate:
– Atrial: none – Ventricular: 20-40 bpm
• P Wave: absent • QRS: >0.12 sec (wide and bizarre) Note: Accelerated idioventricular rhythm has the same characteristics except that its faster. 36

Pulseless Electrical Activity (PEA) The presence of electrical activity without a pulse. The heart muscle loses its ability to contract even though electrical conductivity is maintained. • Rhythm: rhythm can be seen but the patient is pulseless. • PR: may appear normal • QRS: may appear normal
37
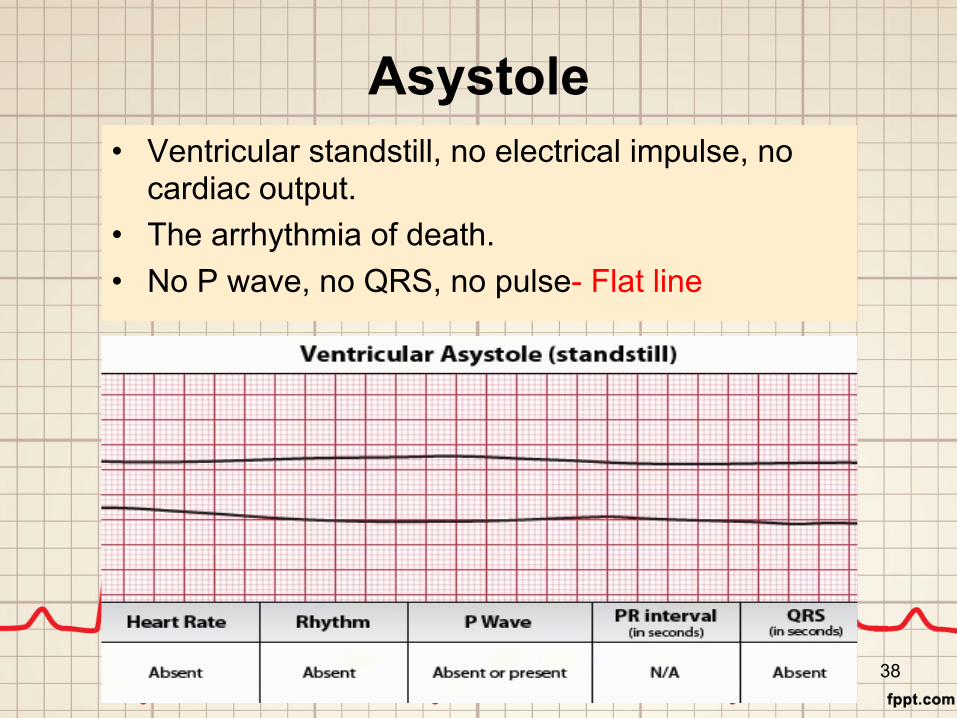
Asystole • Ventricular standstill, no electrical impulse, no
cardiac output. • The arrhythmia of death. • No P wave, no QRS, no pulse- Flat line
38

References • American Heart Association, ACLS for Healthcare
Providers - Algorithm Review. www.americanheartassociation.com
• Bazett HC. An analysis of the time-relations of electrocardiograms. Heart.1920;7:353.
• Dubin, D. (2000) Rapid interpretation of EKG’s. Fort Myers, FL: Cover Publishing.
• McBroom, K., Heart rhythms, let’s keep it simple!. Powerpoint presentation.
• The basics of EKG diagnosis. http://www.bem.fi/book/19/19.htm
39

40


