The IMRE Journal Volume 3 (1) 2009 2009. TU Bergakademie Freiberg http://www.wiwi.tu-freiberg.de/~urm/imre/journal/index.htm ‘Back to the Tap’: a Global Battle against Bottled Water Industry Huiju Tsai Technische Universität Bergakademie Freiberg Correspondence: [email protected]Revised: 16.06.2009 Online Publication Date: 30.10.2009 Abstract The global bottled water industry has been enjoying great prosperity in the past decade. In 2007, world consumption of bottled water totaled 188 billion liters, with an average annual growth rate of 8.8% from 1997 to 2007. Total revenues of the global bottled water market was $US 66.6 billion in 2007, representing a compound annual growth rate (CAGR) of 6.2% for the period 2003-2007. However, while the industry has been expanding at a high speed, a „Back to the Tap‟ movement against bottled water developed in Northern America, Europe and other developed countries in recent yeras. City governments, high-class restaurants, schools, and religious groups urge to ditch bottled water and encourage people to drink the public water from the faucet. Environmentalists condemn bottled water as wasteful and even immoral. Bottled water has been seen as an „Eco-sin‟. This article aims to give an insight into this issue. The stands of the protests, consumer views and bottling companies are analyzed and commented. Measures to be taken are further discussed. Finally, the potential new markets that might emerge under the „anti-bottled water‟ trend are explored. Keywords: Bottled water industry, PET bottles, energy consumption, water management Introduction The global bottled water market has been expanding rapidly in the past decade (See Figure 1). In 2007, world consumption of bottled water stood at a total of 188 billion liters, more than double (80 billion) in 1997. The consumption volume has grown fast from 1997 to 2007, with an average annual growth rate of approximately 8.8%. Between 1998 and 2003, the average annual growth rate exceeded 10%. The total revenues of the global bottled water market equaled $US 66.6 billion in 2007, representing a compound annual growth rate (CAGR) of 6.2% for the period 2003-2007 (See Figure 2). The market has expanded in all regions. The United States is the world‟s leading consumer of bottled water. In 2007, Americans drank almost 33 billion liters (See Figure 3).
Transcript
The IMRE Journal Volume 3 (1) 2009 2009. TU Bergakademie Freiberg
The global bottled water industry has been enjoying great prosperity in the past
decade. In 2007, world consumption of bottled water totaled 188 billion liters, with an
average annual growth rate of 8.8% from 1997 to 2007. Total revenues of the global
bottled water market was $US 66.6 billion in 2007, representing a compound annual
growth rate (CAGR) of 6.2% for the period 2003-2007. However, while the industry
has been expanding at a high speed, a „Back to the Tap‟ movement against bottled
water developed in Northern America, Europe and other developed countries in recent
yeras. City governments, high-class restaurants, schools, and religious groups urge to
ditch bottled water and encourage people to drink the public water from the faucet.
Environmentalists condemn bottled water as wasteful and even immoral. Bottled water
has been seen as an „Eco-sin‟. This article aims to give an insight into this issue. The
stands of the protests, consumer views and bottling companies are analyzed and
commented. Measures to be taken are further discussed. Finally, the potential new
markets that might emerge under the „anti-bottled water‟ trend are explored.
Keywords: Bottled water industry, PET bottles, energy consumption,
water management
Introduction
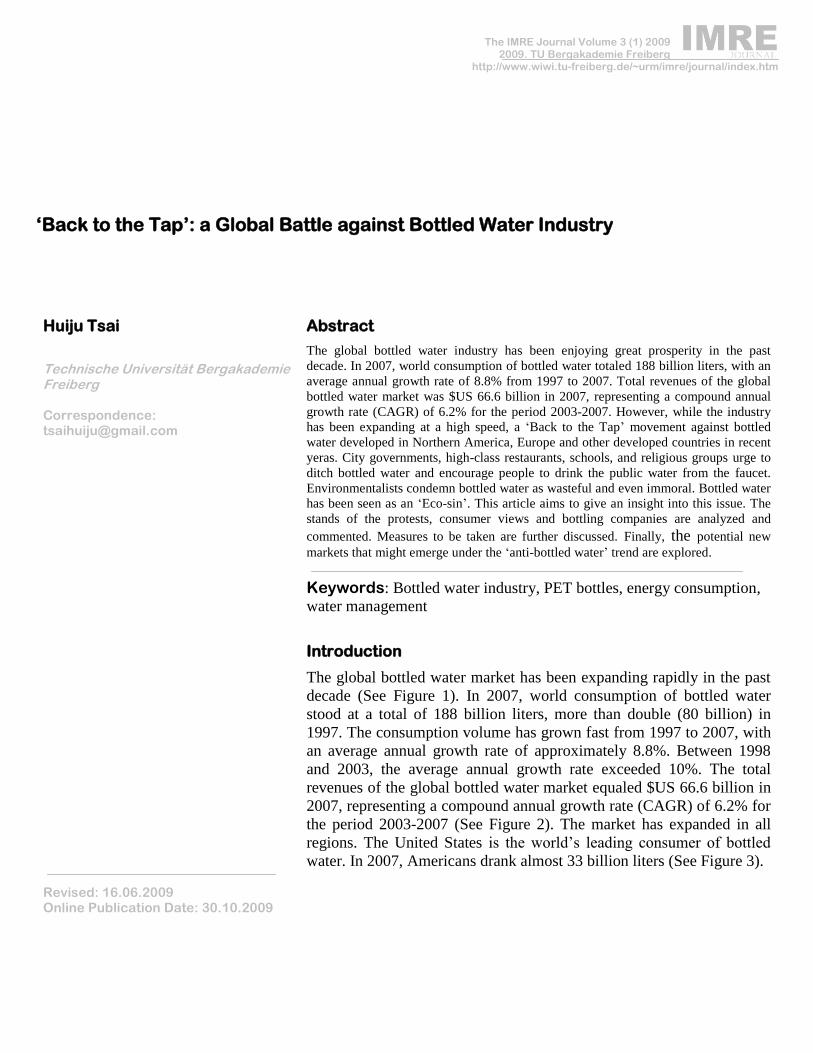
The global bottled water market has been expanding rapidly in the past
decade (See Figure 1). In 2007, world consumption of bottled water
stood at a total of 188 billion liters, more than double (80 billion) in
1997. The consumption volume has grown fast from 1997 to 2007, with
an average annual growth rate of approximately 8.8%. Between 1998
and 2003, the average annual growth rate exceeded 10%. The total
revenues of the global bottled water market equaled $US 66.6 billion in
2007, representing a compound annual growth rate (CAGR) of 6.2% for
the period 2003-2007 (See Figure 2). The market has expanded in all
regions. The United States is the world‟s leading consumer of bottled
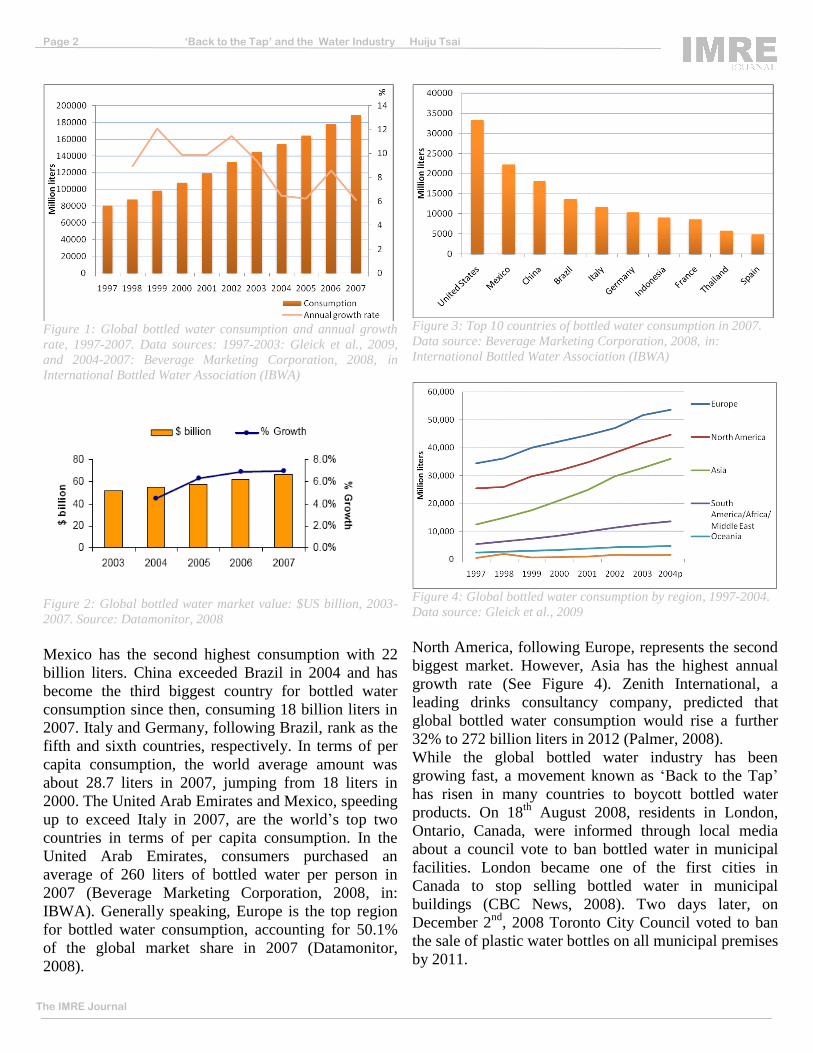
water. In 2007, Americans drank almost 33 billion liters (See Figure 3).
Figure 1: Global bottled water consumption and annual growth
rate, 1997-2007. Data sources: 1997-2003: Gleick et al., 2009,
and 2004-2007: Beverage Marketing Corporation, 2008, in
International Bottled Water Association (IBWA)
Figure 2: Global bottled water market value: $US billion, 2003-
2007. Source: Datamonitor, 2008
Mexico has the second highest consumption with 22
billion liters. China exceeded Brazil in 2004 and has
become the third biggest country for bottled water
consumption since then, consuming 18 billion liters in
2007. Italy and Germany, following Brazil, rank as the
fifth and sixth countries, respectively. In terms of per
capita consumption, the world average amount was
about 28.7 liters in 2007, jumping from 18 liters in
2000. The United Arab Emirates and Mexico, speeding
up to exceed Italy in 2007, are the world‟s top two
countries in terms of per capita consumption. In the
United Arab Emirates, consumers purchased an
average of 260 liters of bottled water per person in
2007 (Beverage Marketing Corporation, 2008, in:
IBWA). Generally speaking, Europe is the top region
for bottled water consumption, accounting for 50.1%
of the global market share in 2007 (Datamonitor,
2008).
Figure 3: Top 10 countries of bottled water consumption in 2007.
Data source: Beverage Marketing Corporation, 2008, in:
International Bottled Water Association (IBWA)
Figure 4: Global bottled water consumption by region, 1997-2004.
Data source: Gleick et al., 2009
North America, following Europe, represents the second
biggest market. However, Asia has the highest annual
growth rate (See Figure 4). Zenith International, a
leading drinks consultancy company, predicted that
global bottled water consumption would rise a further
32% to 272 billion liters in 2012 (Palmer, 2008).
While the global bottled water industry has been
growing fast, a movement known as „Back to the Tap‟
has risen in many countries to boycott bottled water
products. On 18th
August 2008, residents in London,
Ontario, Canada, were informed through local media
about a council vote to ban bottled water in municipal
facilities. London became one of the first cities in
Canada to stop selling bottled water in municipal
buildings (CBC News, 2008). Two days later, on
December 2nd
, 2008 Toronto City Council voted to ban
the sale of plastic water bottles on all municipal premises
by 2011.
The IMRE Journal
Page 2 ‘Back to the Tap’ and the Water Industry Huiju Tsai
Furthermore, by the end of 2008, according to the
Polaris Institute, 17 municipalities from five provinces
in Canada had banned bottled water, and another 45
municipalities were planning to restrict bottled water
(Canwest News Service, 2008). Thus, a backlash
movement against bottled water became a trend among
cities in the country.
In the United States, Chicago passed a 5-cent-per-bottle
tax on bottled water sold within city limits in
November, 2007. Chicago became the first city in the
country to enforce a tax on bottled water. The new law
was expected to raise $10.5 million for the city
annually. The revenue was planned to be used for the
maintenance of the city‟s water infrastructure (Clair,
2007). The state of Washington, following the bottled
water tax in Chicago, considered to impost a fine on
the sale of petroleum-based water bottles “by any retail
store, wholesale club or vending machine provider.”
State agencies would be also prohibited to buy such
products (Beverage Industry, 2008a). In addition, the
San Francisco Mayor barred officials from using
municipal funds to buy bottled water in the summer of
2007, while New York City launched a $1 million
campaign to encourage citizens to drink the city's clean
municipal water. In Salt Lake City the mayor asked to
stop serve bottled water at municipal events (Walsh,
2007). The backlash against bottled water also took
place in Europe. Early in 2005, the Paris municipality
distributed free designer carafes in a bid to obtain a
majority of the population back to drinking tap water
(BBC News, 2005a). In the United Kingdom in 2008,
the Cabinet sent an order to the head of every
government department to phase out bottled water in
government offices (Politics.Co.UK., 2008). Schools,
restaurants and religion groups also launched activities
against drinking bottled water. Washington University
banned the sale of bottled water on its campuses at the
end of last year, and other universities, like University
The IMRE Journal
Page 3 ‘Back to the Tap’ and the Water Industry Huiju Tsai
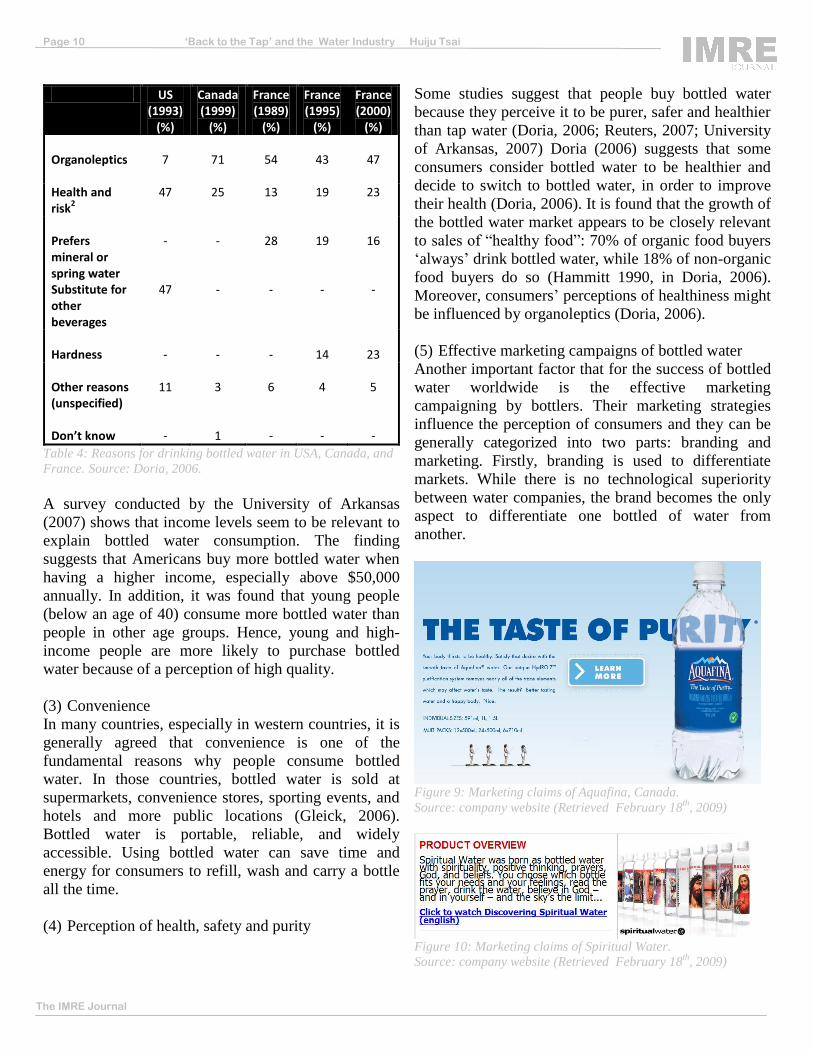
Figure 5: Product life cycle of bottled water and controversies over bottled water industry.
Filling &
Packaging
2
3
6
1
5
4
Bottled water plant
Water bottle disposal
Consumers
Bulk water from source
Water treatment Plastic bottle
manufacturing
Retailers
Filling & Packaging
The controversies:
Depletion of fresh water resources
High energy consumption
Big carbon footprint
High product prices
The quality and safety issues
Plastic bottle disposal
1
2
3
4
5
6
Steps during product life cycle
Energy requirement & carbon footprint
Source of the packing containers
of Leeds in England, were planning to follow the
same approach (O‟Neil, 2008; The National Student,
2009). Del Posto, a top restaurant in Manhattan,
reported to stop selling bottled water and serve diners
its kitchen's purified tap water, sparkling and still
(Walsh, 2007). On the list of the „Top 10 Food Trends
of 2008‟ conducted by Time Magazine, „the war on
bottled water‟ was ranked as number four (Time,
2009). The movement of „anti-bottled water‟ has
become a tide.
While the bottled water market has been emerging and
prospering, the backlash against this product has been
also growing worldwide. This paper aims to give an
overview of this issue. The claims by protesters,
consumers and bottlers will be examined. Certain
suggestions about what could be done to solve the
„bottled water conflict‟ will be further discussed.
Moreover, some potential new markets that might
emerge under the „anti-bottled water‟ trend will be
explored.
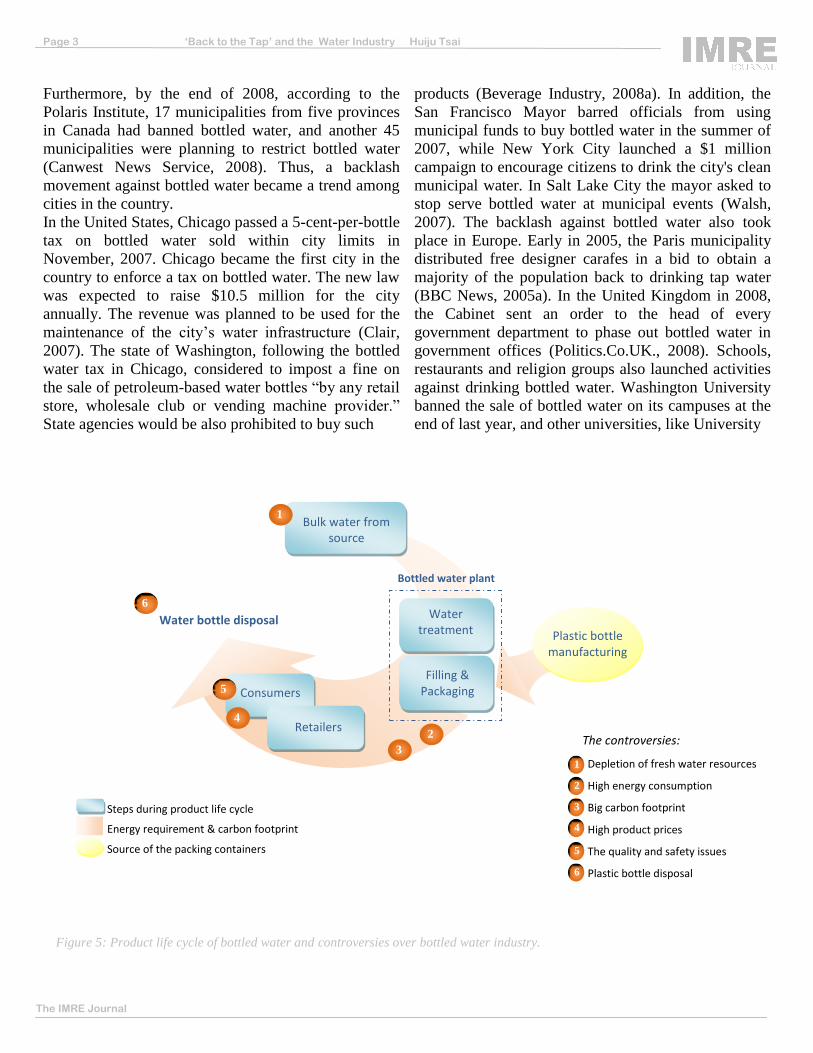
Protests: arguments against bottled water
The arguments against bottled water are addressed
along the product life cycle illustrated in Figure 5. Six
key issues have been argued.
1. Depletion of fresh water resources
Bottling companies have been accused of depleting
precious fresh water resources (Howard, 2003; Lohan,
2007; Polaris Institute, 2009) since groundwater is
considered as a „non-renewable‟ resource (Foster and
Loucks, 2006). The depletion of groundwater could
have severe impacts not only on local ecosystems but
also on local communities and the economy (Foster
and Loucks, 2006; Polaris Institute, 2009). For the
manufacturing of bottled water, companies may pump
up to more than 500 gallons of water per minute from
every well, with operations in many cases going on 24
hours a day and 365 days a year (Howard, 2003). The
permits to draw water normally last for decades. The
huge amount of water extraction concentrated in
communities often disturbs local water balances, and
further impacts local residential, agricultural and
fishery water uses and ecosystems. Thus, water
pumping often draws public opposition and outrage in
local communities (Howard, 2003; Lohan, 2007;
Polaris Institute, 2009).
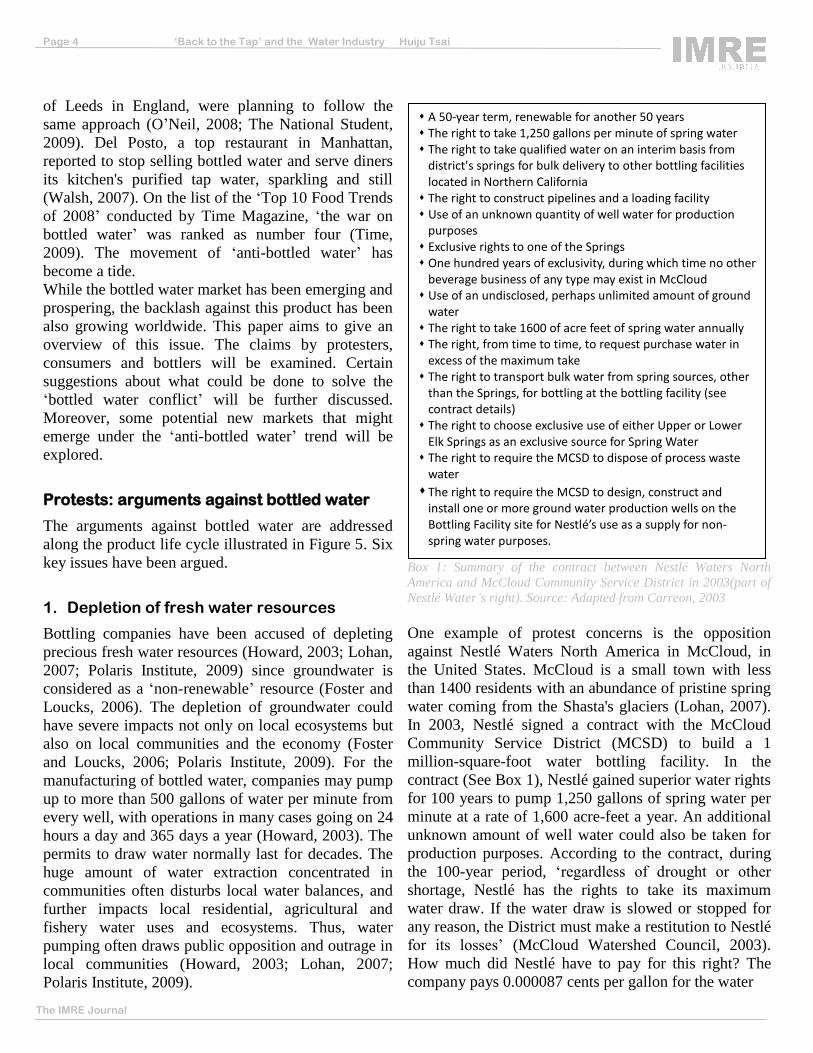
Box 1: Summary of the contract between Nestlé Waters North
America and McCloud Community Service District in 2003(part of
Nestlé Water’s right). Source: Adapted from Carreon, 2003
One example of protest concerns is the opposition
against Nestlé Waters North America in McCloud, in
the United States. McCloud is a small town with less
than 1400 residents with an abundance of pristine spring
water coming from the Shasta's glaciers (Lohan, 2007).
In 2003, Nestlé signed a contract with the McCloud
Community Service District (MCSD) to build a 1
million-square-foot water bottling facility. In the
contract (See Box 1), Nestlé gained superior water rights
for 100 years to pump 1,250 gallons of spring water per
minute at a rate of 1,600 acre-feet a year. An additional
unknown amount of well water could also be taken for
production purposes. According to the contract, during
the 100-year period, „regardless of drought or other
shortage, Nestlé has the rights to take its maximum
water draw. If the water draw is slowed or stopped for
any reason, the District must make a restitution to Nestlé
for its losses‟ (McCloud Watershed Council, 2003).
How much did Nestlé have to pay for this right? The
company pays 0.000087 cents per gallon for the water
The IMRE Journal
Page 4 ‘Back to the Tap’ and the Water Industry
Huiju Tsai
A 50-year term, renewable for another 50 years The right to take 1,250 gallons per minute of spring water The right to take qualified water on an interim basis from
district's springs for bulk delivery to other bottling facilities located in Northern California The right to construct pipelines and a loading facility Use of an unknown quantity of well water for production
purposes Exclusive rights to one of the Springs One hundred years of exclusivity, during which time no other
beverage business of any type may exist in McCloud Use of an undisclosed, perhaps unlimited amount of ground
water The right to take 1600 of acre feet of spring water annually The right, from time to time, to request purchase water in
excess of the maximum take The right to transport bulk water from spring sources, other
than the Springs, for bottling at the bottling facility (see contract details) The right to choose exclusive use of either Upper or Lower
Elk Springs as an exclusive source for Spring Water The right to require the MCSD to dispose of process waste
water
The right to require the MCSD to design, construct and install one or more ground water production wells on the Bottling Facility site for Nestlé’s use as a supply for non-spring water purposes.
it takes from McCloud's springs. That is a rate of 22
times lower than what local residents pay for drinking
water. Since the company can sell a 16-ounce bottle of
the water at a price of around $1.29, or $10.32 per
gallon, Nestlé can make $5,380,451,712 from the 1,600
acre-feet per year, by only selling the spring water from
McCloud (Lohan, 2007). This deal angered the local
community and a lawsuit against Nestlé went on for
years. Finally, in August 2008, Nestlé withdrew from
the contract (Food & Water Watch, 2008).
The depletion of groundwater by bottling companies
has also been reported to have caused strong impacts
on local communities. In Kerala, India, Coca Cola
established Hindustan Coca-Cola Beverages Pvt. Ltd in
1998-99 in a 40-acre plot. From this plant, the
company took away 15 million liters of groundwater
every day free of cost (PUCL, 2002). This huge water
extraction resulted in the depletion of water sources.
Local farmers eventually had to dig deeper and deeper
to search for water, sometimes under dangerous
conditions.
Global Issues reported that some farmers were digging
as deep as 450 feet without finding water (Global
Issues, 2007). Furthermore, during the bottling process,
the use of chemicals and effluents for bottle washing,
released without treatment by the bottling company had
contaminated the groundwater, creating a water crisis
for the surrounding communities and farmers, and
consequently, the local poverty situation worsened
(PUCL, 2002). In 2000, violent protests by furious
villagers forced the company to finally shut down the
plant (Global Issues, 2007).
Moreover, not all water extracted is bottled for
consumption. The Pacific Institute (2007) estimates
that one liter of bottled water sold represents three
liters of water used. In addition to the water sold in
plastic bottles, twice that amount of water is needed in
the production process. Generally, water bottlers
typically do not pay or pay only very low rates for the
right to use this precious public resource (Cormier,
2008; Saxe, 2008).
2. High energy consumption
Energy is required through the whole product life cycle
of bottled water. Figure 5 illustrates the path of energy
requirement during the bottled water product life cycle.
Energy is required to capture and treat water at the
water sources, send it to the bottling plant, fill and
package it in the bottling plant, and transport the
product to retailers and consumers. Energy is also
needed to cool the bottled water and, after
consumption, recycle or dispose the used containers
(Pacific Institute, 2007).
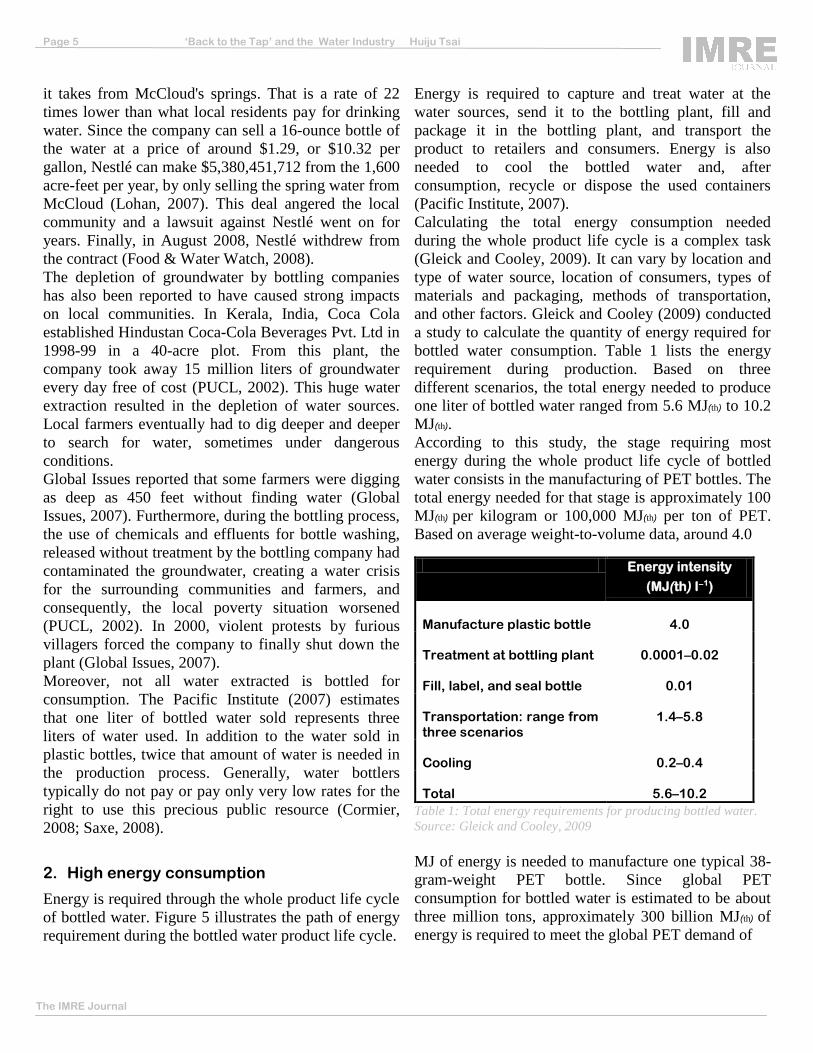
Calculating the total energy consumption needed
during the whole product life cycle is a complex task
(Gleick and Cooley, 2009). It can vary by location and
type of water source, location of consumers, types of
materials and packaging, methods of transportation,
and other factors. Gleick and Cooley (2009) conducted
a study to calculate the quantity of energy required for
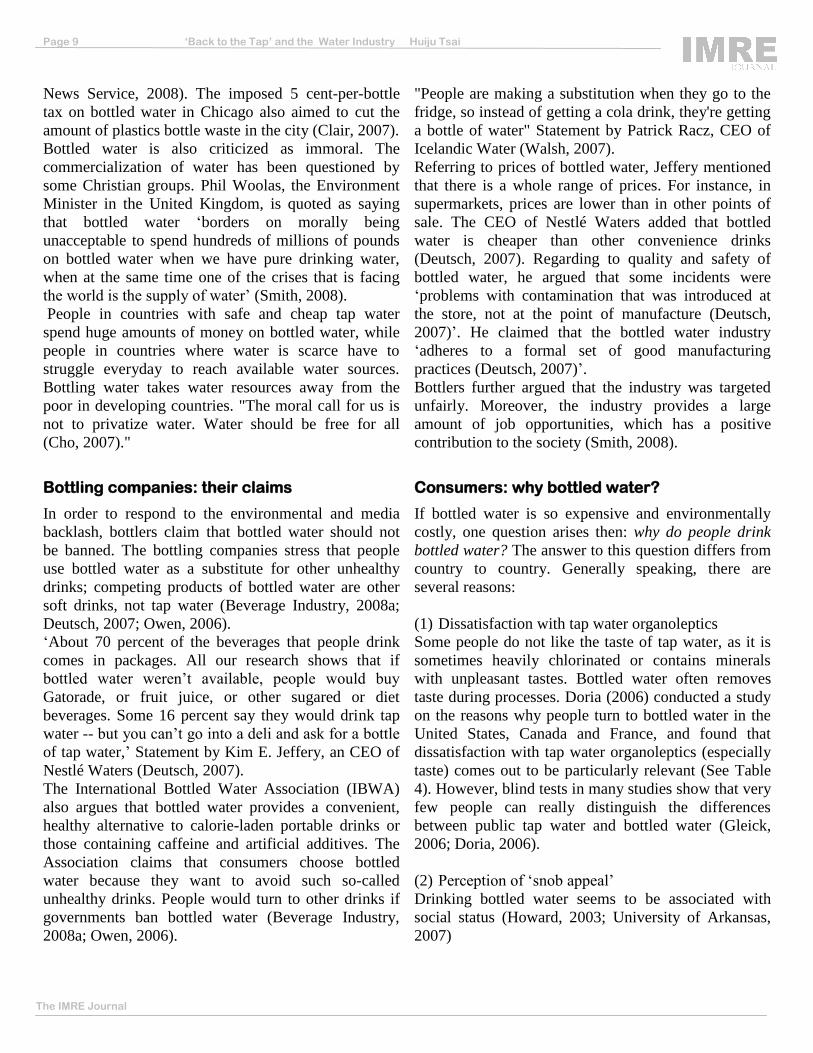
bottled water consumption. Table 1 lists the energy
requirement during production. Based on three
different scenarios, the total energy needed to produce
one liter of bottled water ranged from 5.6 MJ(th) to 10.2
MJ(th).
According to this study, the stage requiring most
energy during the whole product life cycle of bottled
water consists in the manufacturing of PET bottles. The
total energy needed for that stage is approximately 100
MJ(th) per kilogram or 100,000 MJ(th) per ton of PET.
Based on average weight-to-volume data, around 4.0
Table 1: Total energy requirements for producing bottled water.
Source: Gleick and Cooley, 2009
MJ of energy is needed to manufacture one typical 38-
gram-weight PET bottle. Since global PET
consumption for bottled water is estimated to be about
three million tons, approximately 300 billion MJ(th) of
energy is required to meet the global PET demand of
Energy intensity
(MJ(th) l−1)
Manufacture plastic bottle
4.0
Treatment at bottling plant
0.0001–0.02
Fill, label, and seal bottle
0.01
Transportation: range from three scenarios
1.4–5.8
Cooling
0.2–0.4
Total
5.6–10.2
The IMRE Journal
Page 5 ‘Back to the Tap’ and the Water Industry Huiju Tsai
the bottled water industry. This is the energy equivalent
of approximately 50 million barrels of oil per year
(Gleick and Cooley, 2009).
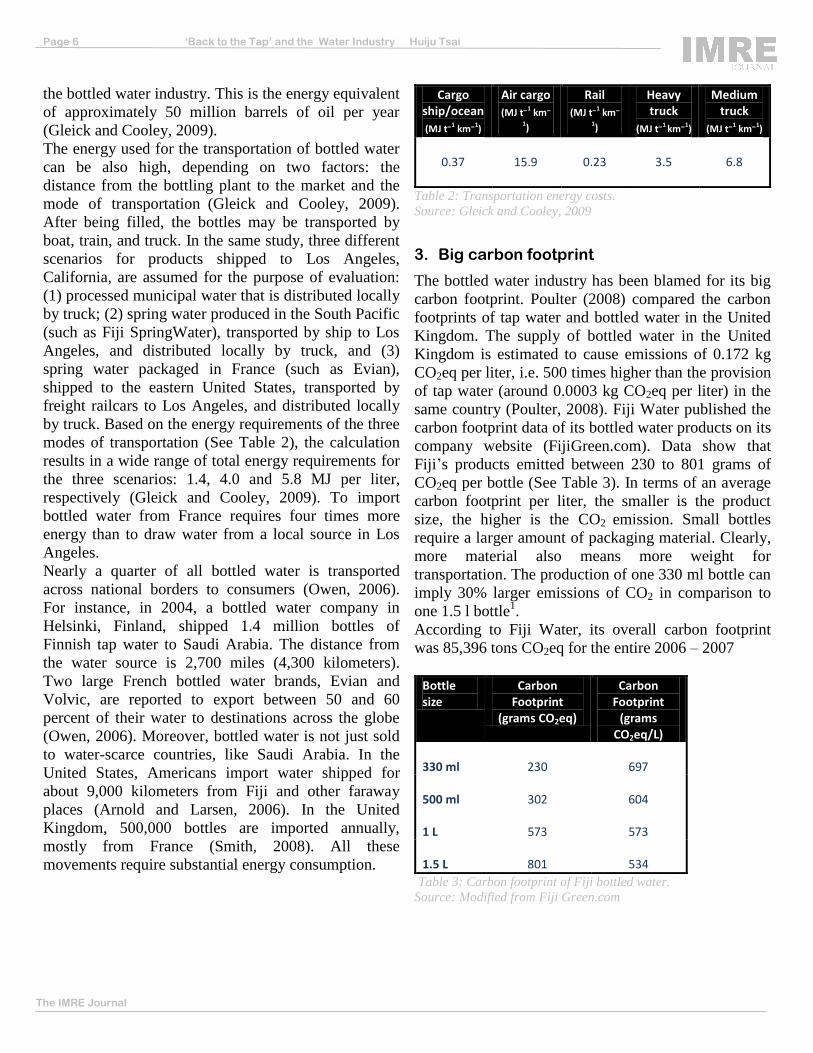
The energy used for the transportation of bottled water
can be also high, depending on two factors: the
distance from the bottling plant to the market and the
mode of transportation (Gleick and Cooley, 2009).
After being filled, the bottles may be transported by
boat, train, and truck. In the same study, three different
scenarios for products shipped to Los Angeles,
California, are assumed for the purpose of evaluation:
(1) processed municipal water that is distributed locally
by truck; (2) spring water produced in the South Pacific
(such as Fiji SpringWater), transported by ship to Los
Angeles, and distributed locally by truck, and (3)
spring water packaged in France (such as Evian),
shipped to the eastern United States, transported by
freight railcars to Los Angeles, and distributed locally
by truck. Based on the energy requirements of the three
modes of transportation (See Table 2), the calculation
results in a wide range of total energy requirements for
the three scenarios: 1.4, 4.0 and 5.8 MJ per liter,
respectively (Gleick and Cooley, 2009). To import
bottled water from France requires four times more
energy than to draw water from a local source in Los
Angeles.
Nearly a quarter of all bottled water is transported
across national borders to consumers (Owen, 2006).
For instance, in 2004, a bottled water company in
Helsinki, Finland, shipped 1.4 million bottles of
Finnish tap water to Saudi Arabia. The distance from
the water source is 2,700 miles (4,300 kilometers).
Two large French bottled water brands, Evian and
Volvic, are reported to export between 50 and 60
percent of their water to destinations across the globe
(Owen, 2006). Moreover, bottled water is not just sold
to water-scarce countries, like Saudi Arabia. In the
United States, Americans import water shipped for
about 9,000 kilometers from Fiji and other faraway
places (Arnold and Larsen, 2006). In the United
Kingdom, 500,000 bottles are imported annually,
mostly from France (Smith, 2008). All these
movements require substantial energy consumption.
Cargo ship/ocean
(MJ t−1 km−1)
Air cargo
(MJ t−1 km−
1)
Rail
(MJ t−1 km−
1)
Heavy truck
(MJ t−1 km−1)
Medium truck
(MJ t−1 km−1)
0.37
15.9
0.23
3.5
6.8
Table 2: Transportation energy costs.
Source: Gleick and Cooley, 2009
3. Big carbon footprint
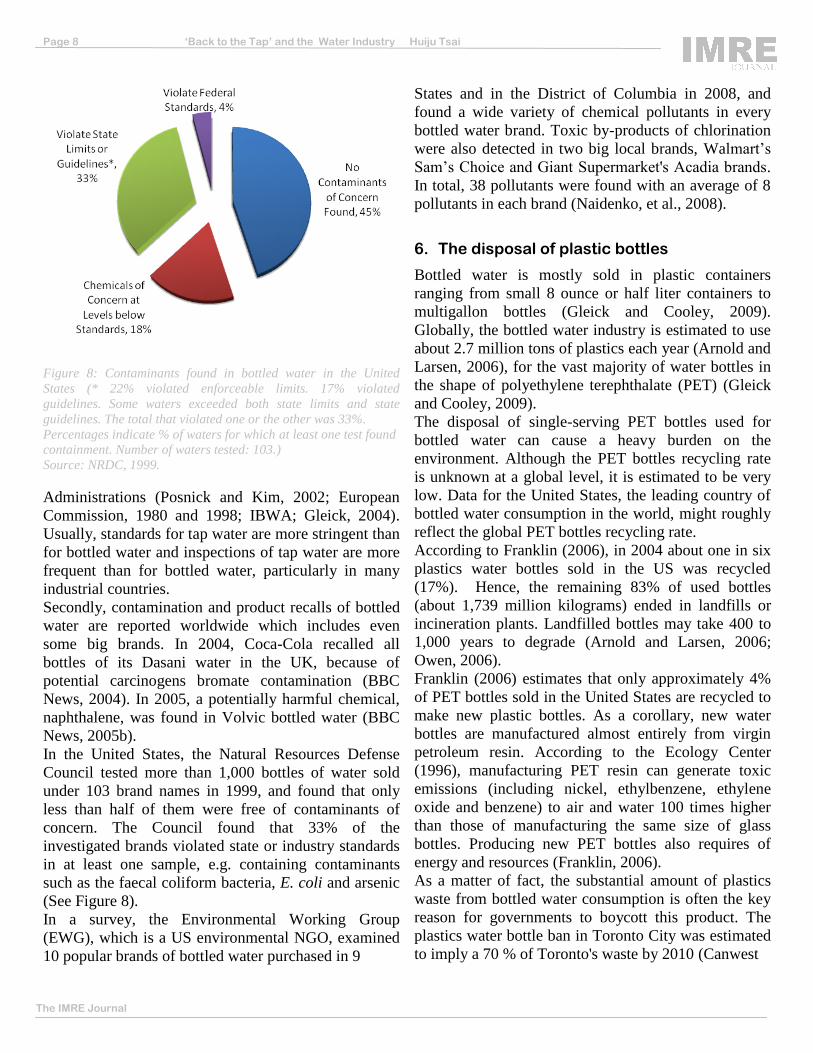
The bottled water industry has been blamed for its big
carbon footprint. Poulter (2008) compared the carbon
footprints of tap water and bottled water in the United
Kingdom. The supply of bottled water in the United
Kingdom is estimated to cause emissions of 0.172 kg
CO2eq per liter, i.e. 500 times higher than the provision
of tap water (around 0.0003 kg CO2eq per liter) in the
same country (Poulter, 2008). Fiji Water published the
carbon footprint data of its bottled water products on its
company website (FijiGreen.com). Data show that
Fiji‟s products emitted between 230 to 801 grams of
CO2eq per bottle (See Table 3). In terms of an average
carbon footprint per liter, the smaller is the product
size, the higher is the CO2 emission. Small bottles
require a larger amount of packaging material. Clearly,
more material also means more weight for
transportation. The production of one 330 ml bottle can
imply 30% larger emissions of CO2 in comparison to
one 1.5 l bottle1.
According to Fiji Water, its overall carbon footprint
was 85,396 tons CO2eq for the entire 2006 – 2007
Bottle size
Carbon Footprint
(grams CO2eq)
Carbon Footprint
(grams CO2eq/L)
330 ml
230
697
500 ml
302
604
1 L
573
573
1.5 L
801
534
Table 3: Carbon footprint of Fiji bottled water.
Source: Modified from Fiji Green.com
The IMRE Journal
Page 6 ‘Back to the Tap’ and the Water Industry Huiju Tsai
production period (See Figure 6). The manufacture of
packaging materials and ocean freight lead to more
than 50% of Fiji‟s CO2 emissions. This is compatible
with the high energy consumption of PET bottle
manufacturing and bottled water transportation, as
indicated by Gleick and Cooley (2009).
The Pacific Institute (2008) estimated that every ton of
PET production implies the emission of around 3 tons
of CO2. Based on this data, bottling water lead to CO2
emissions of more than 2.5 million tons in the United
States in 2006 (Pacific Institute, 2008). In the United
Kingdom, the bottled water industry was responsible
for 200,000 tons of CO2eq emissions each year. In
order to absorb an equivalent amount of CO2
emissions, 57,140 trees would be needed to be planted
annually (Smith, 2008).
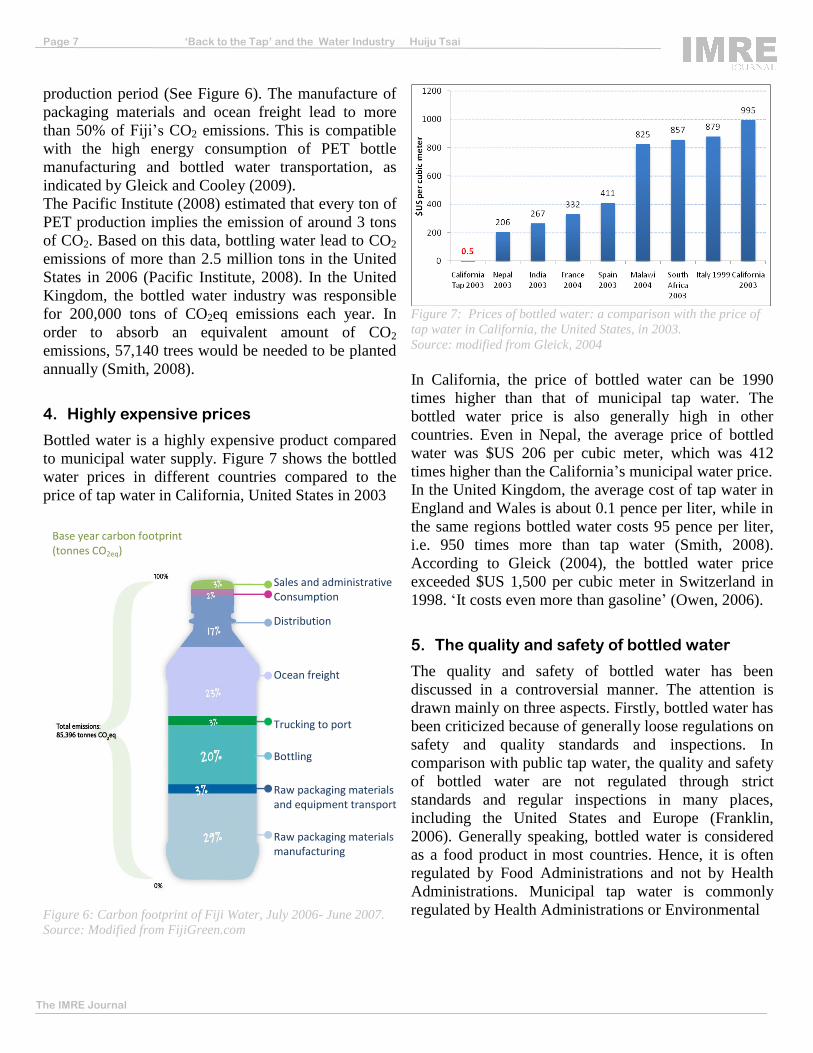
4. Highly expensive prices
Bottled water is a highly expensive product compared
to municipal water supply. Figure 7 shows the bottled
water prices in different countries compared to the
price of tap water in California, United States in 2003
Figure 6: Carbon footprint of Fiji Water, July 2006- June 2007.
Source: Modified from FijiGreen.com
Figure 7: Prices of bottled water: a comparison with the price of
tap water in California, the United States, in 2003.
Source: modified from Gleick, 2004
In California, the price of bottled water can be 1990
times higher than that of municipal tap water. The
bottled water price is also generally high in other
countries. Even in Nepal, the average price of bottled
water was $US 206 per cubic meter, which was 412
times higher than the California‟s municipal water price.
In the United Kingdom, the average cost of tap water in
England and Wales is about 0.1 pence per liter, while in
the same regions bottled water costs 95 pence per liter,
i.e. 950 times more than tap water (Smith, 2008).
According to Gleick (2004), the bottled water price
exceeded $US 1,500 per cubic meter in Switzerland in
1998. „It costs even more than gasoline‟ (Owen, 2006).
5. The quality and safety of bottled water
The quality and safety of bottled water has been
discussed in a controversial manner. The attention is
drawn mainly on three aspects. Firstly, bottled water has
been criticized because of generally loose regulations on
safety and quality standards and inspections. In
comparison with public tap water, the quality and safety
of bottled water are not regulated through strict
standards and regular inspections in many places,
including the United States and Europe (Franklin,
2006). Generally speaking, bottled water is considered
as a food product in most countries. Hence, it is often
regulated by Food Administrations and not by Health
Administrations. Municipal tap water is commonly
regulated by Health Administrations or Environmental
The IMRE Journal
Page 7 ‘Back to the Tap’ and the Water Industry Huiju Tsai
Sales and administrative Consumption
Distribution
Ocean freight
Trucking to port
Bottling
Raw packaging materials and equipment transport
Raw packaging materials manufacturing
Base year carbon footprint (tonnes CO2eq)
Figure 8: Contaminants found in bottled water in the United
States (* 22% violated enforceable limits. 17% violated
guidelines. Some waters exceeded both state limits and state
guidelines. The total that violated one or the other was 33%.
Percentages indicate % of waters for which at least one test found
containment. Number of waters tested: 103.) Source: NRDC, 1999.
Administrations (Posnick and Kim, 2002; European
Commission, 1980 and 1998; IBWA; Gleick, 2004).
Usually, standards for tap water are more stringent than
for bottled water and inspections of tap water are more
frequent than for bottled water, particularly in many
industrial countries.
Secondly, contamination and product recalls of bottled
water are reported worldwide which includes even
some big brands. In 2004, Coca-Cola recalled all
bottles of its Dasani water in the UK, because of
potential carcinogens bromate contamination (BBC
News, 2004). In 2005, a potentially harmful chemical,
naphthalene, was found in Volvic bottled water (BBC
News, 2005b).
In the United States, the Natural Resources Defense
Council tested more than 1,000 bottles of water sold
under 103 brand names in 1999, and found that only
less than half of them were free of contaminants of
concern. The Council found that 33% of the
investigated brands violated state or industry standards
in at least one sample, e.g. containing contaminants
such as the faecal coliform bacteria, E. coli and arsenic
(See Figure 8).
In a survey, the Environmental Working Group
(EWG), which is a US environmental NGO, examined
10 popular brands of bottled water purchased in 9
States and in the District of Columbia in 2008, and
found a wide variety of chemical pollutants in every
bottled water brand. Toxic by-products of chlorination
were also detected in two big local brands, Walmart‟s
Sam‟s Choice and Giant Supermarket's Acadia brands.
In total, 38 pollutants were found with an average of 8
pollutants in each brand (Naidenko, et al., 2008).
6. The disposal of plastic bottles
Bottled water is mostly sold in plastic containers
ranging from small 8 ounce or half liter containers to
multigallon bottles (Gleick and Cooley, 2009).
Globally, the bottled water industry is estimated to use
about 2.7 million tons of plastics each year (Arnold and
Larsen, 2006), for the vast majority of water bottles in
the shape of polyethylene terephthalate (PET) (Gleick
and Cooley, 2009).
The disposal of single-serving PET bottles used for
bottled water can cause a heavy burden on the
environment. Although the PET bottles recycling rate
is unknown at a global level, it is estimated to be very
low. Data for the United States, the leading country of
bottled water consumption in the world, might roughly
reflect the global PET bottles recycling rate.
According to Franklin (2006), in 2004 about one in six
plastics water bottles sold in the US was recycled
(17%). Hence, the remaining 83% of used bottles
(about 1,739 million kilograms) ended in landfills or
incineration plants. Landfilled bottles may take 400 to
1,000 years to degrade (Arnold and Larsen, 2006;
Owen, 2006).
Franklin (2006) estimates that only approximately 4%
of PET bottles sold in the United States are recycled to
make new plastic bottles. As a corollary, new water
bottles are manufactured almost entirely from virgin
petroleum resin. According to the Ecology Center
(1996), manufacturing PET resin can generate toxic
Waters UK & Ireland, part of Groupe DANONE, joined
the Carbon Trust in the UK. Carbon Trust is an
organization which promotes the labelling of carbon
footprints on products (Carbon Trust, 2008).
(2) Increase of using recycled PET bottles
Bottling companies start to increase the use of recycled
PET bottles. On its web site, Pepsi-Cola announces that
the average Pepsi bottle contains 10% recycled plastics
and that more than 150 billions of Pepsi‟s containers
have been recycled since 1990 (PepsiCo, company
website). In 2007, the Coca-Cola Company set the goal
to recycle or reuse 100% of the Company‟s PET
(polyethylene terephthalate) plastics bottles in the
United States. The company also announced that more
than $60 million would be invested to build the world‟s
largest plastic-bottle-to-bottle recycling plant to support
its goal for PET bottle recycling (The Coca-Cola
The IMRE Journal
Page 12 ‘Back to the Tap’ and the Water Industry Huiju Tsai
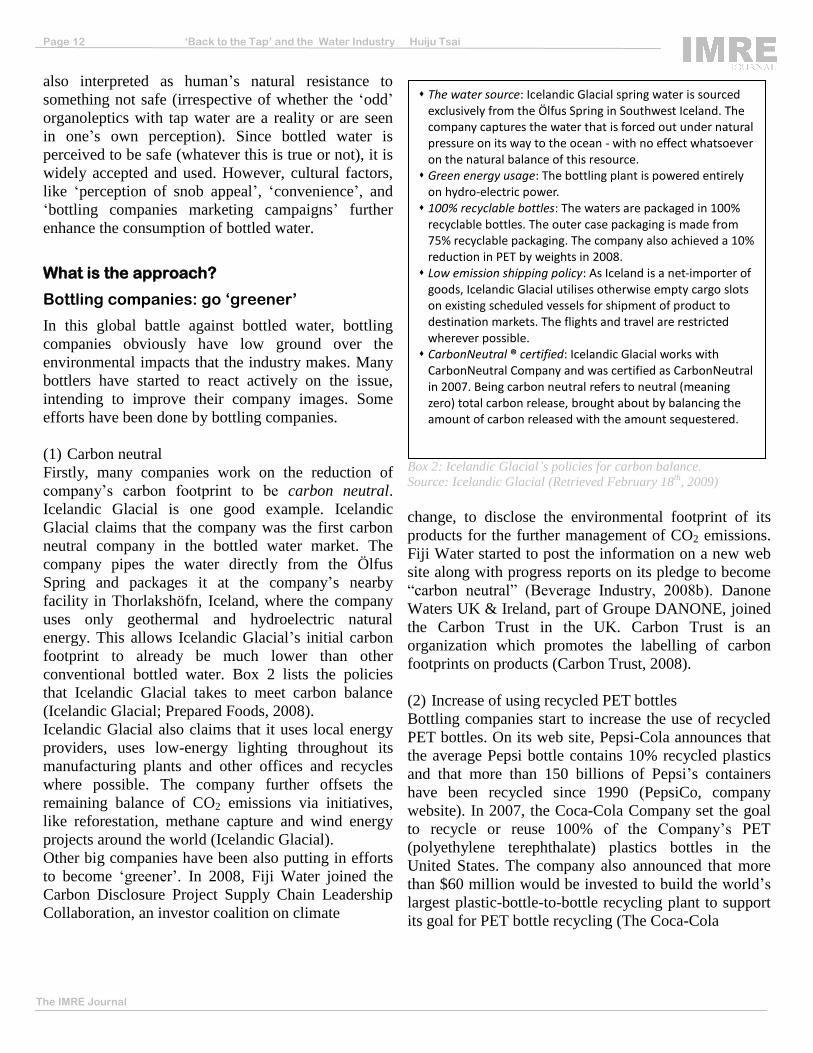
The water source: Icelandic Glacial spring water is sourced exclusively from the Ölfus Spring in Southwest Iceland. The company captures the water that is forced out under natural pressure on its way to the ocean - with no effect whatsoever on the natural balance of this resource. Green energy usage: The bottling plant is powered entirely
on hydro-electric power. 100% recyclable bottles: The waters are packaged in 100%
recyclable bottles. The outer case packaging is made from 75% recyclable packaging. The company also achieved a 10% reduction in PET by weights in 2008. Low emission shipping policy: As Iceland is a net-importer of
goods, Icelandic Glacial utilises otherwise empty cargo slots on existing scheduled vessels for shipment of product to destination markets. The flights and travel are restricted wherever possible. CarbonNeutral ® certified: Icelandic Glacial works with
CarbonNeutral Company and was certified as CarbonNeutral in 2007. Being carbon neutral refers to neutral (meaning zero) total carbon release, brought about by balancing the amount of carbon released with the amount sequestered.
Company, 2007). Evian introduced new 750-ml and 1-
liter bottles that incorporate post-consumer recycled
PET, and launched the Evian Water Protection
Institute (EWPI) to “advance the sustainable
management of natural water resources and to help the
world‟s populations preserve, maintain and restore
their wetlands.” Evian, Coca-Cola and other bottlers
cooperate with RecycleBank, a firm that offers
incentives for consumers to participate in municipal
curbside recycling programs (The Coca-Cola
Company, 2007; Beverage Industry, 2008b).
(3) Bottle lightweight race
‟Lightweighting‟ the PET (polyethylene terephthalate)
bottles and reducing the amount of packaging
materials is another bottlers‟ focus. Most water bottles
which are made by standard machinery contain 18
grams of plastics. Now, the weight of some bottles is
cut down to 12 grams or less (ElAmin, 2007; PepsiCo,
2009; Weaver, 2009). In March 2009, PepsiCo‟s
Aquafina brand, the best selling brand in the United
States, launched a half-liter bottle, named Eco-Fina
bottle, to the national market. The new bottle,
weighting 10.9 grams, is made with 50% less plastic
than the same size bottle from 2002. PepsiCo claims
that this new bottle reduces the amount of required
plastics by 75 million pounds every year (PepsiCo,
2009).
PepsiCo‟s Eco-Fina bottle is not the lightest one in the
world. In 2007, France-based Sidel Inc. launched its
ultra-lightweight NoBottle, weighting 9.9 grams per
500-ml bottle, while the average weight of 500-ml
bottles at the time ranged between 13 and 16 grams.
Hence, with NoBottle, a 25% to 40% percent reduction
of plastics bottle could be achieved (ElAmin, 2007).
Nestlé SA's U.S. water unit cut the weight of its half-
liter bottle to about 12.4 grams for some regional
brands such as Poland Springs in 2007, and further to
less than 11 grams for other brands, like Pure Life. The
company claims that a 9.8-gram half-liter bottle is to
be introduced to the market by 2011 (Bauerlein, 2009).
Lightweighting the PET bottles becomes a technology
competition between bottlers.
(4) Increase water efficiency
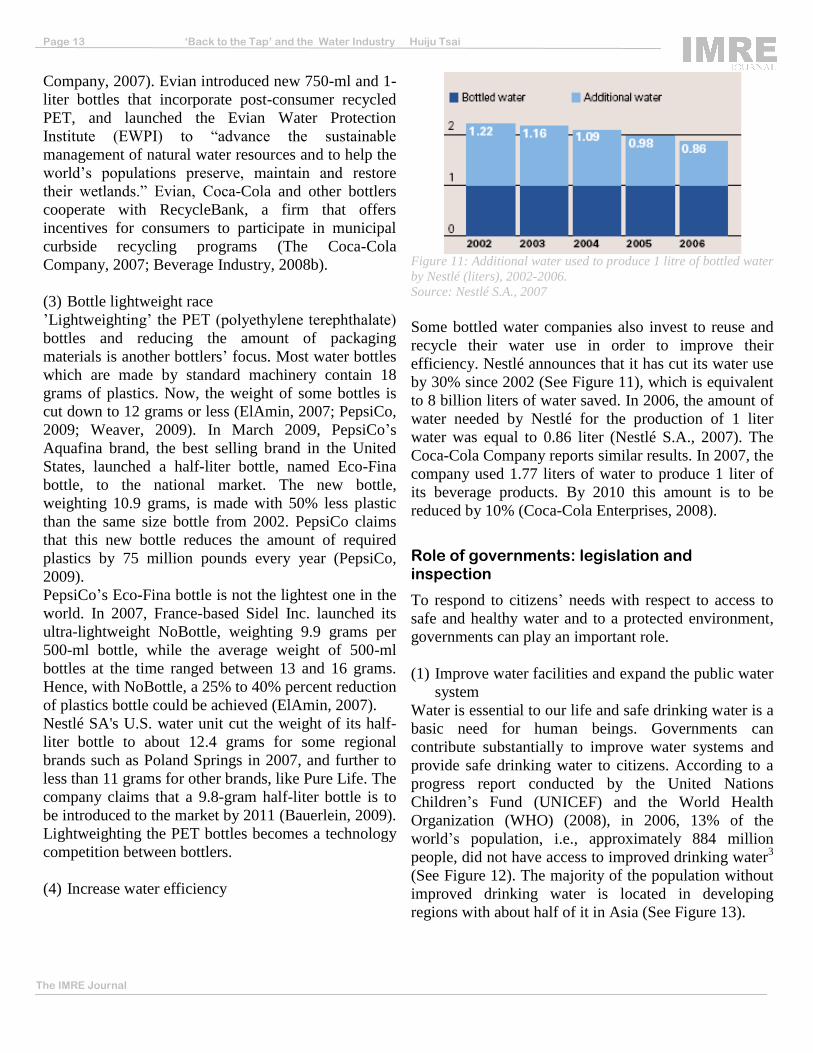
Figure 11: Additional water used to produce 1 litre of bottled water
by Nestlé (liters), 2002-2006.
Source: Nestlé S.A., 2007
Some bottled water companies also invest to reuse and
recycle their water use in order to improve their
efficiency. Nestlé announces that it has cut its water use
by 30% since 2002 (See Figure 11), which is equivalent
to 8 billion liters of water saved. In 2006, the amount of
water needed by Nestlé for the production of 1 liter
water was equal to 0.86 liter (Nestlé S.A., 2007). The
Coca-Cola Company reports similar results. In 2007, the
company used 1.77 liters of water to produce 1 liter of
its beverage products. By 2010 this amount is to be
reduced by 10% (Coca-Cola Enterprises, 2008).
Role of governments: legislation and inspection
To respond to citizens‟ needs with respect to access to
safe and healthy water and to a protected environment,
governments can play an important role.
(1) Improve water facilities and expand the public water
system
Water is essential to our life and safe drinking water is a
basic need for human beings. Governments can
contribute substantially to improve water systems and
provide safe drinking water to citizens. According to a
progress report conducted by the United Nations
Children‟s Fund (UNICEF) and the World Health
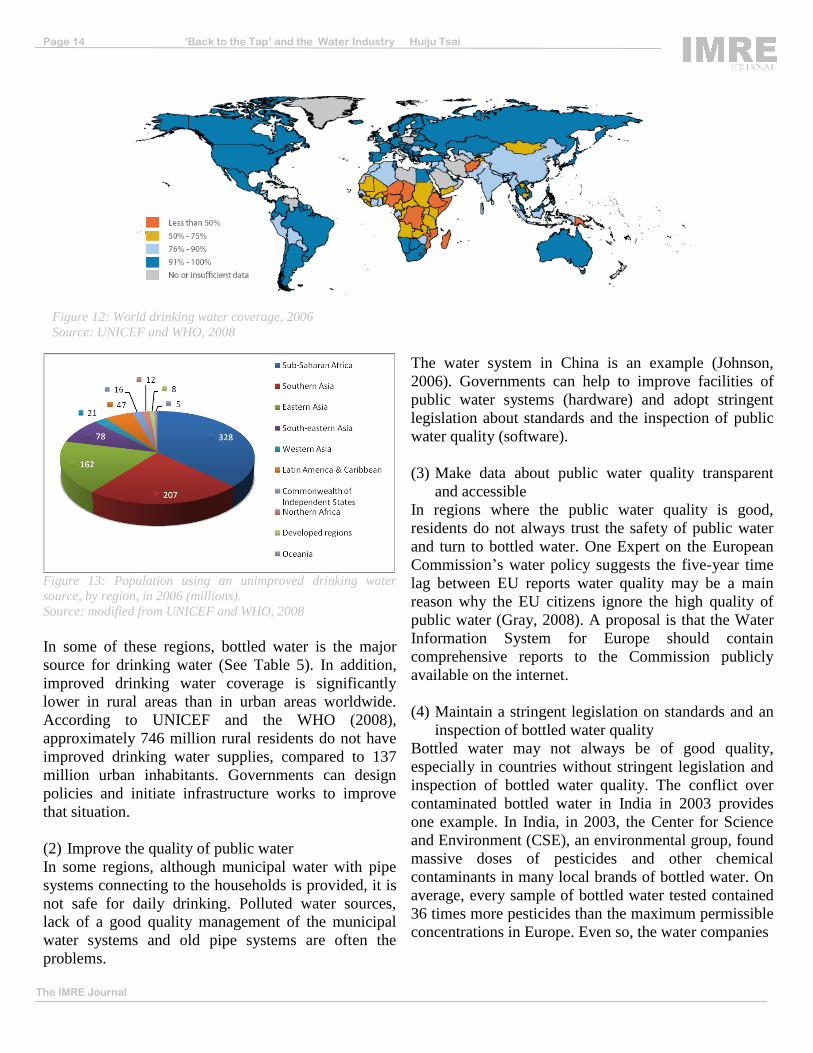
Organization (WHO) (2008), in 2006, 13% of the
world‟s population, i.e., approximately 884 million
people, did not have access to improved drinking water3
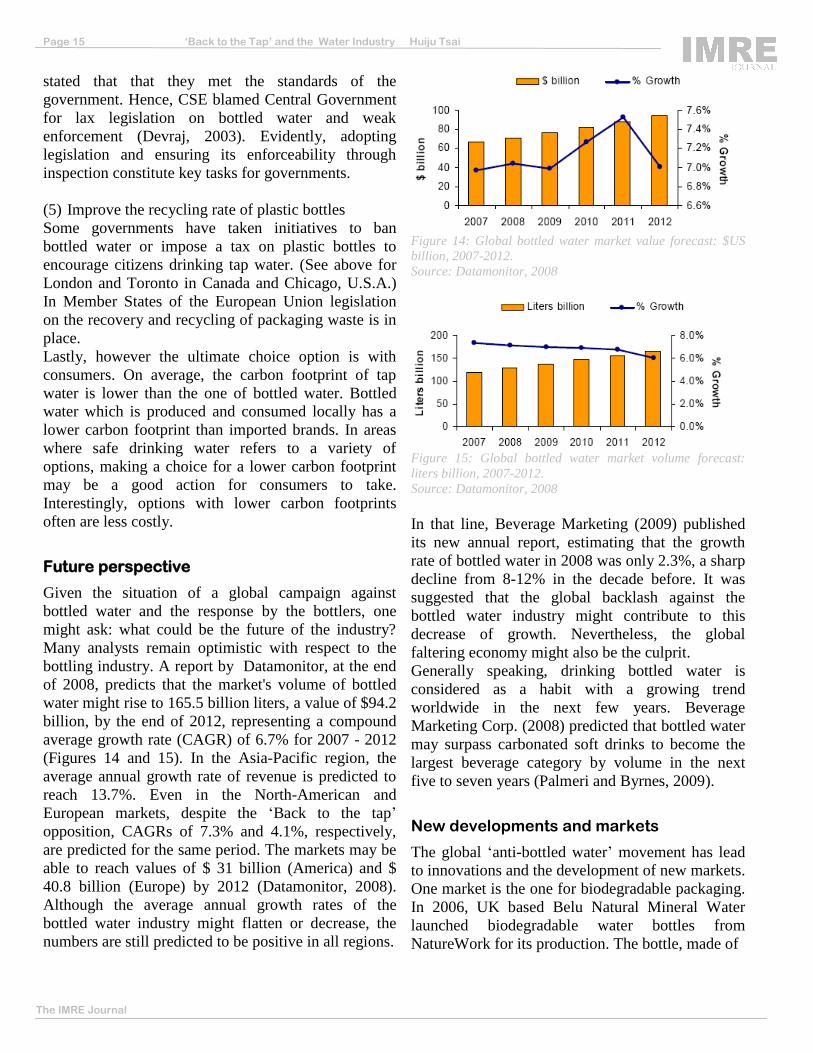
(See Figure 12). The majority of the population without
improved drinking water is located in developing
regions with about half of it in Asia (See Figure 13).
The IMRE Journal
Page 13 ‘Back to the Tap’ and the Water Industry Huiju Tsai
Figure 13: Population using an unimproved drinking water
source, by region, in 2006 (millions). Source: modified from UNICEF and WHO, 2008
In some of these regions, bottled water is the major
source for drinking water (See Table 5). In addition,
improved drinking water coverage is significantly
lower in rural areas than in urban areas worldwide.
According to UNICEF and the WHO (2008),
approximately 746 million rural residents do not have
improved drinking water supplies, compared to 137
million urban inhabitants. Governments can design
policies and initiate infrastructure works to improve
that situation.
(2) Improve the quality of public water
In some regions, although municipal water with pipe
systems connecting to the households is provided, it is
not safe for daily drinking. Polluted water sources,
lack of a good quality management of the municipal
water systems and old pipe systems are often the
problems.
The water system in China is an example (Johnson,
2006). Governments can help to improve facilities of
public water systems (hardware) and adopt stringent
legislation about standards and the inspection of public
water quality (software).
(3) Make data about public water quality transparent
and accessible
In regions where the public water quality is good,
residents do not always trust the safety of public water
and turn to bottled water. One Expert on the European
Commission‟s water policy suggests the five-year time
lag between EU reports water quality may be a main
reason why the EU citizens ignore the high quality of
public water (Gray, 2008). A proposal is that the Water
Information System for Europe should contain
comprehensive reports to the Commission publicly
available on the internet.
(4) Maintain a stringent legislation on standards and an
inspection of bottled water quality
Bottled water may not always be of good quality,
especially in countries without stringent legislation and
inspection of bottled water quality. The conflict over
contaminated bottled water in India in 2003 provides
one example. In India, in 2003, the Center for Science
and Environment (CSE), an environmental group, found
massive doses of pesticides and other chemical
contaminants in many local brands of bottled water. On
average, every sample of bottled water tested contained
36 times more pesticides than the maximum permissible
concentrations in Europe. Even so, the water companies
The IMRE Journal
Page 14 ‘Back to the Tap’ and the Water Industry
Huiju Tsai
Figure 12: World drinking water coverage, 2006
Source: UNICEF and WHO, 2008
stated that that they met the standards of the
government. Hence, CSE blamed Central Government
for lax legislation on bottled water and weak
enforcement (Devraj, 2003). Evidently, adopting
legislation and ensuring its enforceability through
inspection constitute key tasks for governments.
(5) Improve the recycling rate of plastic bottles
Some governments have taken initiatives to ban
bottled water or impose a tax on plastic bottles to
encourage citizens drinking tap water. (See above for
London and Toronto in Canada and Chicago, U.S.A.)
In Member States of the European Union legislation
on the recovery and recycling of packaging waste is in
place.
Lastly, however the ultimate choice option is with
consumers. On average, the carbon footprint of tap
water is lower than the one of bottled water. Bottled
water which is produced and consumed locally has a
lower carbon footprint than imported brands. In areas
where safe drinking water refers to a variety of
options, making a choice for a lower carbon footprint
may be a good action for consumers to take.
Interestingly, options with lower carbon footprints
often are less costly.
Future perspective
Given the situation of a global campaign against
bottled water and the response by the bottlers, one
might ask: what could be the future of the industry?
Many analysts remain optimistic with respect to the
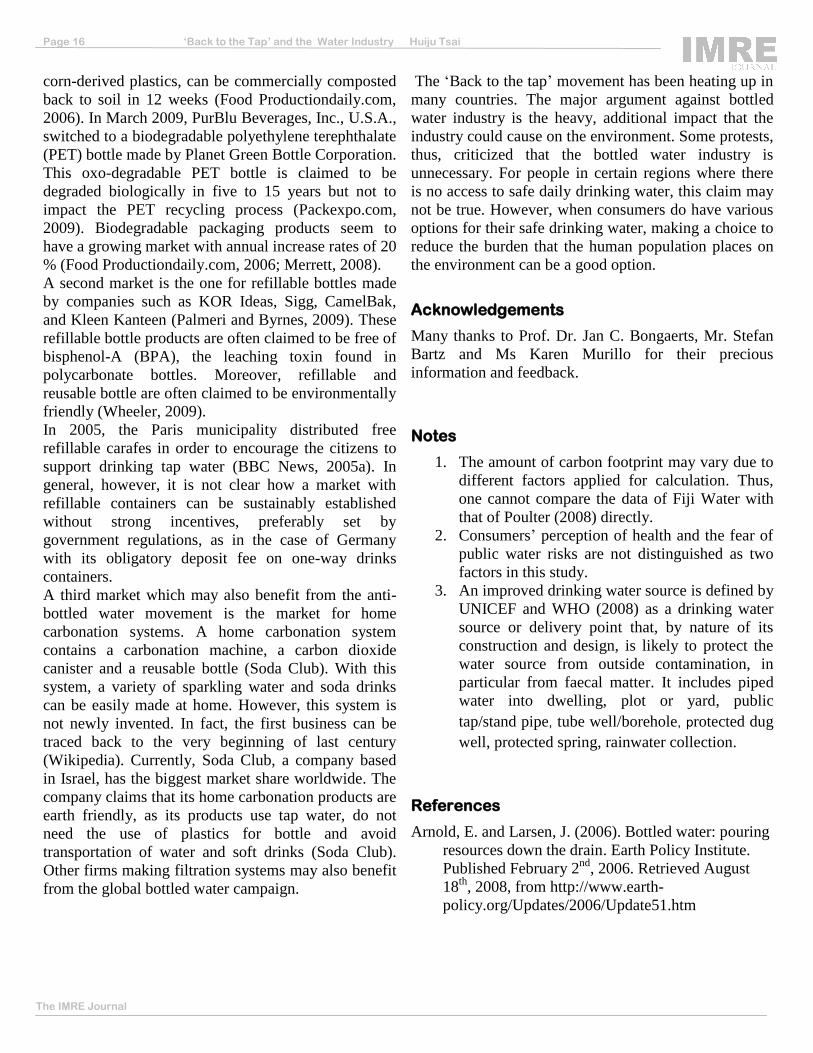
bottling industry. A report by Datamonitor, at the end
of 2008, predicts that the market's volume of bottled
water might rise to 165.5 billion liters, a value of $94.2
billion, by the end of 2012, representing a compound
average growth rate (CAGR) of 6.7% for 2007 - 2012
(Figures 14 and 15). In the Asia-Pacific region, the
average annual growth rate of revenue is predicted to
reach 13.7%. Even in the North-American and
European markets, despite the „Back to the tap‟
opposition, CAGRs of 7.3% and 4.1%, respectively,
are predicted for the same period. The markets may be
able to reach values of $ 31 billion (America) and $
40.8 billion (Europe) by 2012 (Datamonitor, 2008).
Although the average annual growth rates of the
bottled water industry might flatten or decrease, the
numbers are still predicted to be positive in all regions.
Figure 14: Global bottled water market value forecast: $US
billion, 2007-2012.
Source: Datamonitor, 2008
Figure 15: Global bottled water market volume forecast:
liters billion, 2007-2012.
Source: Datamonitor, 2008
In that line, Beverage Marketing (2009) published
its new annual report, estimating that the growth
rate of bottled water in 2008 was only 2.3%, a sharp
decline from 8-12% in the decade before. It was
suggested that the global backlash against the
bottled water industry might contribute to this
decrease of growth. Nevertheless, the global
faltering economy might also be the culprit.
Generally speaking, drinking bottled water is
considered as a habit with a growing trend
worldwide in the next few years. Beverage
Marketing Corp. (2008) predicted that bottled water
may surpass carbonated soft drinks to become the
largest beverage category by volume in the next
five to seven years (Palmeri and Byrnes, 2009).
New developments and markets
The global „anti-bottled water‟ movement has lead
to innovations and the development of new markets.
One market is the one for biodegradable packaging.
In 2006, UK based Belu Natural Mineral Water
launched biodegradable water bottles from
NatureWork for its production. The bottle, made of
The IMRE Journal
Page 15 ‘Back to the Tap’ and the Water Industry Huiju Tsai
corn-derived plastics, can be commercially composted
back to soil in 12 weeks (Food Productiondaily.com,
2006). In March 2009, PurBlu Beverages, Inc., U.S.A.,
switched to a biodegradable polyethylene terephthalate
(PET) bottle made by Planet Green Bottle Corporation.
This oxo-degradable PET bottle is claimed to be
degraded biologically in five to 15 years but not to
impact the PET recycling process (Packexpo.com,
2009). Biodegradable packaging products seem to
have a growing market with annual increase rates of 20