P2M.3 WRF MODEL SIMULATIONS OF A QUASI-STATIONARY, EXTREME-RAIN-PRODUCING MESOSCALE CONVECTIVE SYSTEM Russ S. Schumacher * and Richard H. Johnson Department of Atmospheric Science, Colorado State University, Fort Collins, Colorado 1. INTRODUCTION Extreme rainfall is responsible for a variety of societal impacts, including flash flooding that can lead to damage, injury, and death. In the United States, flash flooding is responsible for more fatalities than any other convective storm-related phenomenon, including tornadoes, hurricanes, and lightning (NOAA 2005). Despite the great need for accurate forecasts and warnings of extreme rainfall that can produce flash flooding, the prediction of warm-season heavy precipitation continues to be one of the most difficult challenges in operational fore- casting (Fritsch and Carbone 2004). In an attempt to understand more about how these extreme-rain-producing weather systems are organized and the conditions in which they occur, Schumacher and Johnson (2005, hereafter SJ05) ex- amined radar data and other observations for 116 extreme rain events in the eastern two-thirds of the United States over a three-year period. Among the types of mesoscale convective systems (MCSs) that commonly produce extreme rainfall, they iden- tified one that may present significant forecast chal- lenges, which they termed the “backbuilding/quasi- stationary” type (BB, Fig. 1). BB MCSs occur when convective cells repeatedly form upstream of their predecessors and pass over a particular area, lead- ing to large local rainfall totals. They were found to occur in environments characterized by weak synop- tic forcing, with storm-generated outflow boundaries often providing the lifting for repeated cell develop- ment. In this study, one of the BB MCSs identified by SJ05 will be examined in further detail using the Weather Research and Forecasting (WRF) model. This MCS, which produced rainfall amounts of up to 309 mm (12.2 in) and record flooding in Missouri on 6–7 May 2000, was characterized by an area of * Corresponding author address: Russ Schumacher, Department of Atmospheric Science, Colorado State University, Fort Collins, CO 80523-1371; rschu- [email protected]~ 150 KM BACKBUILDING / QUASI-STATIONARY (BB) PROPAGATION OUTFLOW BOUNDARY NEW CELLS FORM HERE CELL MOTION Figure 1: Schematic diagram of the radar-observed features of the BB pattern of extreme-rain-producing MCSs. Contours (and shading) represent approximate radar reflectivity values of 20, 40, and 50 dBZ. The dash-dot line represents an outflow boundary; such boundaries were observed in many of the BB MCS cases. The length scale at the bottom is approximate and can vary substantially for BB systems depending on the number of mature convective cells present at a given time. From Schumacher and Johnson (2005). convection that remained quasi-stationary for ap- proximately 6 h. The purpose of this study will be twofold: to determine the utility of the WRF model for simulating prolonged heavy-rain-producing con- vection, and to better understand the processes that are responsible for initiating, organizing, and main- taining such convection. Both of these purposes are focused on the goal of improving forecasts of extreme-rain-producing convective systems. 2. DESCRIPTION OF THE EVENT During the evening and overnight hours of 6–7 May 2000 a small area of quasi-stationary convec- tion produced a remarkable amount of rain over sev- eral counties just to the southwest of the St. Louis, Missouri metropolitan area (Fig. 2). The highest rainfall total reported at a National Weather Service rain gauge was 309 mm (12.15 in) at Union, MO, with unofficial reports of 406 mm (16 in) nearby (Glass et al. 2001). Consistent with past studies of
Transcript
P2M.3
WRF MODEL SIMULATIONS OF A QUASI-STATIONARY,
EXTREME-RAIN-PRODUCING MESOSCALE CONVECTIVE SYSTEM
Russ S. Schumacher∗ and Richard H. JohnsonDepartment of Atmospheric Science, Colorado State University, Fort Collins, Colorado
1. INTRODUCTION
Extreme rainfall is responsible for a varietyof societal impacts, including flash flooding thatcan lead to damage, injury, and death. In theUnited States, flash flooding is responsible for morefatalities than any other convective storm-relatedphenomenon, including tornadoes, hurricanes, andlightning (NOAA 2005). Despite the great need foraccurate forecasts and warnings of extreme rainfallthat can produce flash flooding, the prediction ofwarm-season heavy precipitation continues to be oneof the most difficult challenges in operational fore-casting (Fritsch and Carbone 2004).
In an attempt to understand more about howthese extreme-rain-producing weather systems areorganized and the conditions in which they occur,Schumacher and Johnson (2005, hereafter SJ05) ex-amined radar data and other observations for 116extreme rain events in the eastern two-thirds of theUnited States over a three-year period. Amongthe types of mesoscale convective systems (MCSs)that commonly produce extreme rainfall, they iden-tified one that may present significant forecast chal-lenges, which they termed the “backbuilding/quasi-stationary” type (BB, Fig. 1). BB MCSs occur whenconvective cells repeatedly form upstream of theirpredecessors and pass over a particular area, lead-ing to large local rainfall totals. They were found tooccur in environments characterized by weak synop-tic forcing, with storm-generated outflow boundariesoften providing the lifting for repeated cell develop-ment.
In this study, one of the BB MCSs identified bySJ05 will be examined in further detail using theWeather Research and Forecasting (WRF) model.This MCS, which produced rainfall amounts of upto 309 mm (12.2 in) and record flooding in Missourion 6–7 May 2000, was characterized by an area of
∗Corresponding author address: Russ Schumacher,Department of Atmospheric Science, Colorado StateUniversity, Fort Collins, CO 80523-1371; [email protected]
~ 150 KM
BACKBUILDING / QUASI-STATIONARY (BB)
PROPAGATION
OUTFLOW BOUNDARY
NEW CELLS FORM HERE
CELL MOTION
Figure 1: Schematic diagram of the radar-observedfeatures of the BB pattern of extreme-rain-producingMCSs. Contours (and shading) represent approximateradar reflectivity values of 20, 40, and 50 dBZ. Thedash-dot line represents an outflow boundary; suchboundaries were observed in many of the BB MCS cases.The length scale at the bottom is approximate and canvary substantially for BB systems depending on thenumber of mature convective cells present at a giventime. From Schumacher and Johnson (2005).
convection that remained quasi-stationary for ap-proximately 6 h. The purpose of this study will betwofold: to determine the utility of the WRF modelfor simulating prolonged heavy-rain-producing con-vection, and to better understand the processes thatare responsible for initiating, organizing, and main-taining such convection. Both of these purposesare focused on the goal of improving forecasts ofextreme-rain-producing convective systems.
2. DESCRIPTION OF THE EVENT
During the evening and overnight hours of 6–7May 2000 a small area of quasi-stationary convec-tion produced a remarkable amount of rain over sev-eral counties just to the southwest of the St. Louis,Missouri metropolitan area (Fig. 2). The highestrainfall total reported at a National Weather Servicerain gauge was 309 mm (12.15 in) at Union, MO,with unofficial reports of 406 mm (16 in) nearby(Glass et al. 2001). Consistent with past studies of
Figure 2: Estimated total precipitation (inches) fromthe KLSX WSR-88D for the period 0000–1803 UTC 7May 2000. The thick line in the center of the figure isthe border between Missouri and Illinois. Latitude andlongitude lines are shown every 1◦.
heavy rain environments (e.g., Maddox et al. 1979),there was high relative humidity in east-central Mis-souri as well as a 40-kt low-level jet from the south-west. However, in contrast to other observed ex-treme rainfall environments, there was relatively lit-tle instability and there were no apparent surfaceboundaries present prior to the onset of deep con-vection (not shown). A mesoscale convective vor-tex (MCV), evident in both the 500-hPa analysisand infrared satellite data, likely played a key rolein initiating and maintaining the convection in thisevent. Convection developed around 0200 UTC andformed into a mesoscale area of deep convectionthat remained nearly stationary through 1200 UTC(Fig. 3). Only a very weak cold pool and outflowboundary developed as a result of the convection.For more observational details of this event, thereader is directed to the case study by Glass et al.(2001).
3. MODEL CONFIGURATION
The simulations presented herein were producedusing version 2.0.3.1 of the advanced research WRFmodel (details available online at wrf-model.org).Simulations were carried out for the 24-h period0000 UTC 7 May to 0000 UTC 8 May 2000 witha nested grid as shown in Fig. 4. The horizontalgrid spacing was 9 km on the outer grid and 3 kmon the inner grid, with 39 levels in the vertical. Cu-mulus convection was parameterized using the Kain-Fritsch scheme on domain 1, while convection wasexplicitly resolved on domain 2. Other details of the
Figure 3: Composite radar reflectivity (dBZ) at (a)0600, (b) 0900, and (c) 1200 UTC 7 May 2000. Thethick line in panel (b) will be used for a cross section inFig. 7.
Table 1: Design of WRF version 2.0.3.1 numericalmodel experiment. Multiple entries indicate differentconfigurations for domains 1 and 2. See Fig. 4 for do-main locations. Technical descriptions of these parame-terizations are available online at wrf-model.org.
model configuration are shown in Table 1. The suiteof parameterizations was chosen to resemble thoseused for real-time forecasts at the National Cen-ter for Atmospheric Research during the summersof 2003–2005. As such, this model configuration issimilar to one that has demonstrated some successin near-real-time applications. However, given thatthe model initialization time is only a few hours be-fore the onjset of convection in this study, the re-sults presented herein should probably be considereda “simulation” rather than a “forecast” that couldhave been utilized in real-time.
4. RESULTS
4.1 Overall structure of convection and
precipitation
The model suc-cessfully produces a backbuilding/quasi-stationaryMCS which replicates many of the features of theobserved system (Fig. 5). The model also succedsin producing a region of extreme rainfall amounts,the location and distribution of which is also remark-ably similar to the observed rainfall (Fig. 6). Themodel underestimates the total rainfall amount; themaximum simulated rainfall is 257.6 mm, which issomewhat less than the observed maximum of 309mm. However, given the challenges of predictingground-accumulated rainfall when using microphys-ical parameterizations (e.g., Gilmore et al. 2004)and the remarkable amount of rain that fell in thisevent, this can probably be considered a successfulresult. While the convective region of the MCS iswell-represented in the simulation, the model doesnot create the region of stratiform rain (with embed-
Figure 4: Location of model domains 1 and 2.
ded convection) that extends eastward into Illinoisin the observations.
When observed in the vertical, the model isalso fairly accurate in replicating the convectivestructure of this system. In the observations, across-section through the region of active convec-tion demonstrates the backbuilding nature of thisMCS (Fig. 7). There are two primary cells at 0907UTC, with both bringing the 40-dBZ contour up toapproximately 9 km. The southeastern cell (cell 1)has passed its mature phase and is decreasing in in-tensity, while the cell 2 (to the northwest of cell 1)is still intensifying and has a maximum in reflectiv-ity extending from approximately 2 to 5 km. Twonew cells, which will eventually intensify and ma-ture, are beginning to organize to the left of themature cells in the cross-section. The model resultsare quite similar, with the simulated 40-dbZ contouralso reaching up to approximately 9 km, and theactive cells having maximum reflectivities of 50–55dBZ (Fig. 8). The observed backbuilding behaviorin the observations is also represented in the simu-lation. As time progresses from panel (a) to panel(c) in Fig. 8, the eastern cell (cell 1) decays whilethe western cell (cell 2) strengthens. By 0930 UTC(Fig. 8c), the weak cell that had appeared on thevery left edge (cell 3) of the figure has begun to in-tensify. The size of the cells appears to correspondwell with the observations, though the distance be-tween the simulated convective cells appears to besomewhat greater than observed. The cells appearto be, on average, around 10 km across, which is nota scale that is well-resolved with the current modelconfiguration (i.e., the cells are only about 3 times aslong as the model grid spacing). However, prelimi-nary results with grid spacing of 1 km also show cellswith similar size and spacing, suggesting that the
a) Simulated reflectivity
0600 UTC 7 May 2000
b) Simulated reflectivity
0900 UTC 7 May 2000
c) Simulated reflectivity
1200 UTC 7 May 2000
Figure 5: Simulated composite reflectivity (dBZ) on do-main 3 at (a) 0600, (b) 0900, and (c) 1200 UTC 7 May2000. The portion of the domain shown is the same asthat shown in Fig 3 for comparison. The thick line inpanel (b) will be used for a cross section in Fig. 8.
Model accumulated precipitation
0000-1800 UTC 7 May 2000
Figure 6: Model accumulated precipitation (mm) on do-main 3 for the period 0000–1800 UTC 7 May 2000. Forcomparison with Fig. 2, recall that 1 in ≈ 25.4 mm, sothe 102.4 mm (black) contour is approximately equal tothe 4 in (blue) contour in Fig. 2.
12
Figure 7: Reflectivity cross-section from the KLSX radarat 0907 UTC 7 May through the line noted in Fig. 3b.The scale on the vertical axis is km. Each tick mark onthe horizontal axis is approximately 1 km; the span ofthe horizontal axis is approximately 131 km. Numbersrefer to individual convective cells discussed in text.
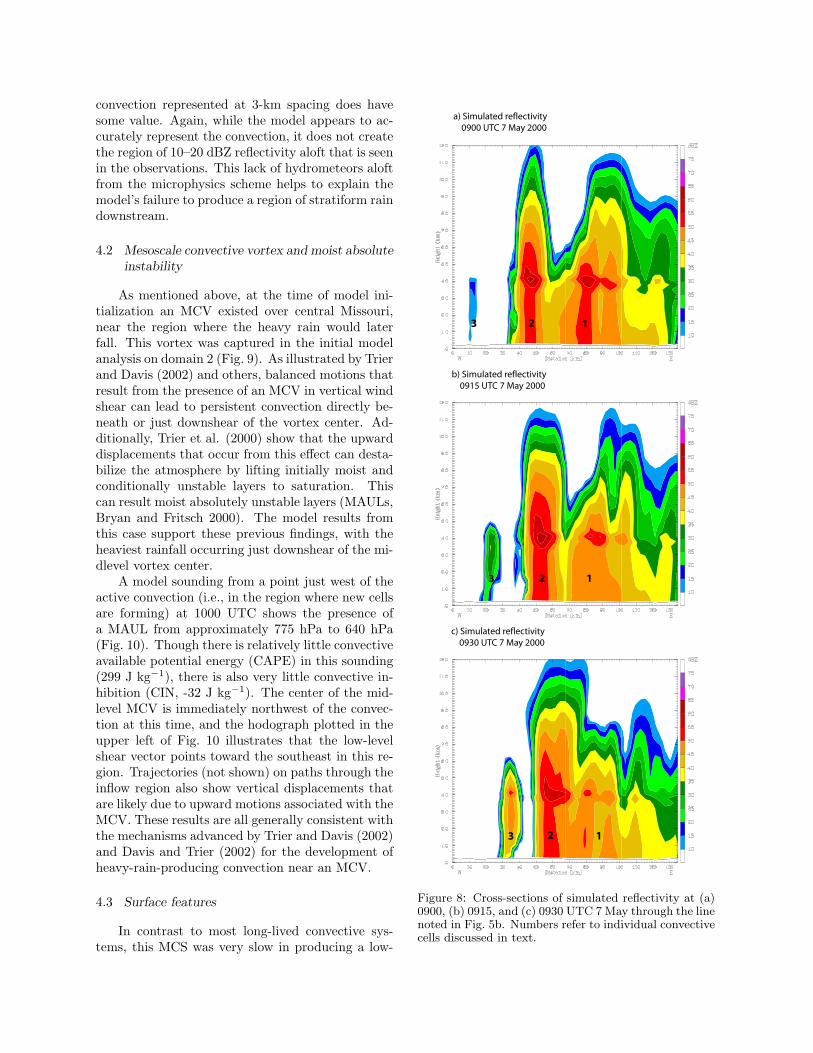
convection represented at 3-km spacing does havesome value. Again, while the model appears to ac-curately represent the convection, it does not createthe region of 10–20 dBZ reflectivity aloft that is seenin the observations. This lack of hydrometeors aloftfrom the microphysics scheme helps to explain themodel’s failure to produce a region of stratiform raindownstream.
4.2 Mesoscale convective vortex and moist absolute
instability
As mentioned above, at the time of model ini-tialization an MCV existed over central Missouri,near the region where the heavy rain would laterfall. This vortex was captured in the initial modelanalysis on domain 2 (Fig. 9). As illustrated by Trierand Davis (2002) and others, balanced motions thatresult from the presence of an MCV in vertical windshear can lead to persistent convection directly be-neath or just downshear of the vortex center. Ad-ditionally, Trier et al. (2000) show that the upwarddisplacements that occur from this effect can desta-bilize the atmosphere by lifting initially moist andconditionally unstable layers to saturation. Thiscan result moist absolutely unstable layers (MAULs,Bryan and Fritsch 2000). The model results fromthis case support these previous findings, with theheaviest rainfall occurring just downshear of the mi-dlevel vortex center.
A model sounding from a point just west of theactive convection (i.e., in the region where new cellsare forming) at 1000 UTC shows the presence ofa MAUL from approximately 775 hPa to 640 hPa(Fig. 10). Though there is relatively little convectiveavailable potential energy (CAPE) in this sounding(299 J kg−1), there is also very little convective in-hibition (CIN, -32 J kg−1). The center of the mid-level MCV is immediately northwest of the convec-tion at this time, and the hodograph plotted in theupper left of Fig. 10 illustrates that the low-levelshear vector points toward the southeast in this re-gion. Trajectories (not shown) on paths through theinflow region also show vertical displacements thatare likely due to upward motions associated with theMCV. These results are all generally consistent withthe mechanisms advanced by Trier and Davis (2002)and Davis and Trier (2002) for the development ofheavy-rain-producing convection near an MCV.
4.3 Surface features
In contrast to most long-lived convective sys-tems, this MCS was very slow in producing a low-
a) Simulated reflectivity
0900 UTC 7 May 2000
123
2
b) Simulated reflectivity
0915 UTC 7 May 2000
3 1
c) Simulated reflectivity
0930 UTC 7 May 2000
2 13
Figure 8: Cross-sections of simulated reflectivity at (a)0900, (b) 0915, and (c) 0930 UTC 7 May through the linenoted in Fig. 5b. Numbers refer to individual convectivecells discussed in text.
500-hPa potential vorticity
0000 UTC 7 May 2000
Figure 9: Potential vorticity (shaded, contours every 1PVU), geopotential height (contoured every 10 m), andwinds (long barb = 5 m s−1) on domain 2 at 500 hPafor the model initial analysis at 0000 UTC 7 May 2000.
Model sounding at 38.33N, 91.62W
1000 UTC 7 May 2000
Figure 10: Model skew-T log p diagram from 1000 UTC7 May 2000 at 38.33◦N latitude, 91.62◦W longitude (justwest of the active convection).
10-m virtual potential temperature and winds
Sea-level pressure
1000 UTC 7 May 2000
Figure 11: Virtual potential temperature at 10-m AGL(color contours every 1 K), sea-level pressure (contoursevery 1 hPa) and 10 m AGL winds at 1000 UTC 7 May2000. Wind barbs are plotted at every tenth model gridpoint. The portion of domain 2 displayed is the same asthat in Fig. 5.
level cold pool and outflow boundary. Convectionrepeatedly developed in certain areas for severalhours before a discernable mesoscale outflow bound-ary was evident in the model output; by 1000 UTC,when the model had already produced over 200 mmof rain, the “cold pool” at the surface was only ap-proximately 2 K cooler than the surrounding areas(Fig. 11). The divergence field near the surface atthis time paints a similar picture, with only storm-scale maxima and minima in divergence at 1000UTC (Fig. 12a). Finally, by 1200 UTC the con-vergence signature indicative of a mesoscale outflowboundary develops, though the convection begins toweaken only a few hours later (Fig. 12b). Again,while these features may not be well-resolved at amodel grid spacing of 3 km, preliminary results with1-km grid spacing show similar results.
The high relative humidity below 640 hPa(Fig. 10) in the vicinity of the convection limits theevaporation of raindrops and as such inhibits the de-velopment of a well-defined cold pool (while increas-ing the precipitation efficiency). While the absenceof a strong cold pool certainly contributes to theslow system motion observed in this case, traditionaltheories for the maintenance of mesoscale deep con-vection (e.g., Rotunno et al. 1988) rely on the lift-ing provided by convectively-generated cold pools.
a) 0.5 km divergence and winds
1000 UTC 7 May 2000
b) 0.5 km divergence and winds
1200 UTC 7 May 2000
Figure 12: Divergence (color contours every 30× 10−5
s−1) and winds at 0.5 km AGL for (a) 1000 UTC and(b) 1200 UTC 7 May 2000. Wind barbs are plotted atevery tenth model grid point.
However, in this case the convection is long-livedwithout the benefit of strong cold-pool lifting. Itis unclear whether the mechanisms associated withthe MCV and the weak cold pool are solely sufficientfor maintaining the convection or whether other asyet unidentified mechanisms also play a role. Fur-ther work on this and other cases will investigatethis issue further.
5. CONCLUSIONS
Results from WRF model simulations of theextreme-rain-producing MCS on 7 May 2000 arepresented herein. The primary findings are sum-marized as follows:
• The WRF model, in a configuration with fewmodifications, is able to successfully replicatethe backbuilding, quasistationary area of con-vection that occurred in this event. Thoughthe precipitation forecast underestimated theobserved rainfall amounts, many of the fea-tures of the convection were well represented.
• The effects of a mesoscale convective vortexon the convection in this event are generallyconsistent with mechanisms proposed in pastobservational and modeling studies.
• Despite the absence of a well-defined cold pooland outflow boundary, deep convection re-peatedly develops and is maintained over east-central Missouri in the simulations.
Ongoing work is aimed at looking more closelyat the mechanisms for initiating and maintainingbackbuilding convection. In future efforts, it ishoped that long-lived quasi-stationary convectioncan be simulated in an idealized framework to fur-ther understand these difficult-to-predict systemsthat can produce extreme rainfall and have signifi-cant societal impacts.
6. ACKNOWLEDGEMENTS
WSR-88D data presented herein was obtainedfrom the National Climatic Data Center. Comput-ing resources were provided by the National Centerfor Atmospheric Research, which is sponsored by theNational Science Foundation. The authors wouldlike to thank Drs. Jason Knievel and George Bryanfor discussions regarding this work and assistancein using the WRF model. This research was sup-ported by National Science Foundation Grant ATM-0500061.
7. REFERENCES
Bryan, G. H. and J. M. Fritsch, 2000: Moist absoluteinstability: The sixth static stability state. Bull.
Amer. Meteor. Soc., 81, 1207–1230.
Davis, C. A. and S. B. Trier, 2002: Cloud-resolving sim-ulations of mesoscale vortex intensification and itseffect on a serial mesoscale convective system. Mon.
Wea. Rev., 130, 2839–2858.
Fritsch, J. M. and R. E. Carbone, 2004: Improvingquantitative precipitation forecasts in the warm sea-son: A USWRP research and development strategy.Bull. Amer. Meteor. Soc., 85, 955-965.
Gilmore, M. S. J. M. Straka, and E. N. Rasmussen,2004: Precipitation uncertainty due to variationsin precipitation particle parameters within a simplemicrophysics scheme. Mon. Wea. Rev., 132, 2610–2627.
Glass, F. H. J. P. Gagan, and J. T. Moore, 2001: Theextreme east-central Missouri flash flood of 6–7 May2000. Preprints, Symp. on Precipitation Extremes:
Prediction, Impacts, and Responses, Albuquerque,NM, Amer. Meteor. Soc., 174–179.
Maddox, R. A., C. F. Chappell, and L. R. Hoxit, 1979:Synoptic and meso-α scale aspects of flash floodevents. Bull. Amer. Meteor. Soc., 60, 115–123.
Rotunno, R. J. B. Klemp, and M. L. Weisman, 1988: Atheory for strong long-lived squall lines. J. Atmos.
Sci., 61, 361–382.
Schumacher, R. S., and R. H. Johnson, 2005: Orga-nization and environmental properties of extreme-rain-producing mesoscale convective systems. Mon.
Wea. Rev., 133, 961–976.
Trier, S. B. C. A. Davis, and W. C. Skamarock, 2000:Long-lived mesoconvective vortices and their envi-ronment. Part II: Induced thermodynamic destabi-lization in idealized simulations. Mon. Wea. Rev.,128, 3396–3412.
Trier, S. B. and Davis, C. A. 2002: Influence of balancedmotions on heavy precipitation within a long-livedconvectively generated vortex. Mon. Wea. Rev.,130, 877–899.


![Quasi-stationary Distributions: A Bibliography · Quasi-stationary Distributions - A Bibliography 7 Wu [452] Yong [455] 4.4 Semi-Markov and Markov-renewal processes Arjas and Nummelin](https://static.documents.pub/doc/80x56/5fdd934608ecf337e27068ed/quasi-stationary-distributions-a-bibliography-quasi-stationary-distributions-.jpg)


