Jjjgggggdrfgygfyhgfh The research for this Background Paper was made possible by CPRC core funding from the United Kingdom's Department for International Development (DFID). What is Chronic Poverty? The distinguishing feature of chronic poverty is extended duration in absolute poverty. Therefore, chronically poor people always, or usually, live below a poverty line, which is normally defined in terms of a money indicator (e.g. consumption, income, etc.), but could also be defined in terms of wider or subjective aspects of deprivation. This is different from the transitorily poor, who move in and out of poverty, or only occasionally fall below the poverty line. www.chronicpoverty.org Background Paper for the Chronic Poverty Report 2008-09 Poverty Reduction Strategy Review Country Case: Nicaragua Steve Wiggins April 2007
Transcript
Jjjgggggdrfgygfyhgfh
The research for this Background Paper was made possible by CPRC core funding from the United Kingdom's Department for International Development (DFID).
What is Chronic Poverty?
The distinguishing feature of chronic poverty is extended duration in absolute poverty.
Therefore, chronically poor people always, or usually, live below a poverty line, which is normally defined in terms of a money indicator (e.g. consumption, income, etc.), but could also be defined in terms of wider or subjective aspects of deprivation.
This is different from the transitorily poor, who move in and out of poverty, or only occasionally fall below the poverty line.
www.chronicpoverty.org
Background Paper for the Chronic Poverty Report 2008-09
Poverty Reduction Strategy Review
Country Case: Nicaragua
Steve Wiggins
April 2007
Poverty Reduction Strategy Review- Country Case Nicaragua
2
Abbreviations BID Inter-American Development Bank Banco Interamericano de Desarrollo
C$ Córdoba, nacional currency Córdoba
ERCERP Poverty Reduction Strategy Estrategia Reforzada de Crecimiento Económico y Reducción de Pobreza
FISE Emergency Fund for Social Investment
Fondo de Inversión Social de Emergencia
FSLN Sandinista Front for Nacional Liberation
Frente Sandinista de Liberación Nacional
HIPC Highly Indebted Poor Countries Iniciativa Reforzada para Países Pobres Muy Endeudados
k thousand mil
LSMS/ EMNV
Living Standards Measurement Survey
Encuesta de Medición del Nivel de Vida
M million millón
MAGFOR Ministry of Agricultura and Forestry Ministerio Agropecuario y Forestal
PND National Development Plan Plan Nacional de Desarrollo
PND-O National Development Plan - Operative
Plan Nacional de Desarrollo - Operativo
PRS Poverty Reduction Strategy Estrategia de Reducción de la Pobreza
RPS Social Protection Network Red de Protección Social
US$ US dollar Dólar estadounidense
Acknowledgements
The research for this Background Paper was made possible by CPRC core funding from the United Kingdom's Department for International Development (DFID).
Author
Steve Wiggins is a Research Fellow in the Rural Policy and Governance Group at the Overseas Development Institute (ODI), London, UK.
Poverty Reduction Strategy Review- Country Case Nicaragua
5
Summary Are policies to reduce chronic poverty articulated in poverty reduction strategies (PRS) actually implemented in practice, and with what results? This study review the literature to address this question in the case of Nicaragua.
Nicaragua is an interesting case: as one of the most highly indebted countries in the world, the offer of debt relief in return for formulating and implementing a PRS was eagerly accepted. Subsequently the country has enjoyed at least three advantages: substantial debt relief was granted in 2004, aid flows have been large, and ⎯ unlike some developing countries, and indeed Nicaragua itself twenty years ago ⎯ the nation is both at peace and politically stable. If a PRS was going to make difference, then, it should have done so in Nicaragua.
Poverty in Nicaragua
In 2005 46% of Nicaraguans were living in poverty, and almost 15% in extreme poverty. Progress in reducing poverty has been limited: the equivalent figures in 1993 were 50% and 19%. More worryingly, most of the reduction seen in those dozen years happened before 1998, and since then any reductions are so small as to be statistically insignificant. So little progress has been made that, thanks to population growth, the numbers living in poverty rose between 1993 and 2005. There was, however, a slight fall in the numbers living in extreme poverty.
Rural area experience much higher rates of poverty than urban, so that although the majority of Nicaraguans live in urban areas, fully 65% of all the poor, and 80% of the extremely poor, were living in rural areas in 2005.
Analyses of data from the Living Standards Measurement Surveys of households in 1998 and 2001 show much poverty churning: only 27% of the population were persistently or chronically poor over those three years, although that figure rises to 43% for the rural areas. Poverty correlates highly with low education levels, large families and dependence upon agriculture for work.
Poverty rates are higher in remote areas. The majority of those chronically poor between 1998 and 2001 were found in the north, north-west or south-west of the country ⎯ areas distant from the capital and difficult to access.
The poor face many hazards, ranging from covariant risks such as falling commodity prices for their crops, drought, flooding, tropical storms and hurricanes; as well as the more idiosyncratic threats form poor health, disability, accident, crime, addiction and violence. There is little to protect them from these.
Nicaragua is a country of high inequality: in 2001 the Gini coefficient of the distribution of incomes was 0.55, putting Nicaragua amongst the world’s least equal distributions of income. In rural areas there are correspondingly high concentrations
Poverty Reduction Strategy Review- Country Case Nicaragua
6
of ownership of land and cattle, despite the country having ample areas of land for its still relatively small population (just over 5 millions).
Poverty reduction strategies
Given the very high external debt, when HIPC was announced Nicaragua was keen to qualify. It thus produced its first PRS paper in 2001 (Estrategia Reforzada de Crecimiento Económico y Reducción de Pobreza). This, in common with other first-generation poverty reduction papers, tended to stress the social dimensions of poverty reduction and offered little detail on economic policy. It was, however, soon supplanted. The new government that entered in 2002 wanted its own plan which it duly produced in 2002 (Plan Nacional de Desarrollo), with more detail added in a 2004 version (Plan Nacional de Dessarrollo – Operativo). This, the National Development Plan (PND-O) for 2005–09, has in effect been accepted as the second generation poverty reduction strategy. It remains to be seen how far this will be accepted by the government that took over in early 2007, but it has been the plan for the last four years.
The PND-O sets out three overall goals:
• To generate employment and sustainable economic growth;
• To increase exports and investments; and,
• To increase incomes to reduce poverty.
To be reached by:
• Creating the conditions to encourage private investment, In particular, foreign direct investment that not only brings capital but also expertise in organising competitive value chains linked to world markets will be attracted;
• Increasing exports, given the restricted size of the domestic market; and, above all,
• Raising the competitiveness of the economy. In particular, the PND-O emphasises the role of industrial clusters capable of generating economies of agglomeration.
As a poverty reduction strategy, the PND-O relies heavily on creating the highest possible rate of economic growth. It does not explicitly set out to make that growth favour the poor, but rather relies on trickle-down effects to distribute benefits to the poor. That may mean them migrating to participate. It also means that they need to be educated and healthy.
Poverty Reduction Strategy Review- Country Case Nicaragua
7
Hence another component of the Plan is to double spending on education, accompanied by reforms to make schools more accountable to parents and local government. There is also a large budget to expand health services, and in particular to tackle infant and maternal mortality.
Finally there are plans to expand programmes for social protection, above all those transferring resources to children living in poverty to ensure their early health and nutrition, and that they subsequently attend school.
How well do these strategies correspond to needs?
Economically the best on fast growth is ambitious. Since macroeconomic stability was re-established in 1994 the economy has grown, but only slowly. In 2003 GDP per capita in real term was still well below the level reached in 1960.
How well do these strategies correspond to needs?
Economically, going for fast growth is ambitious. Since macroeconomic stability was re-established in 1994 the economy has grown, but only slowly. In 2003 GDP per capita in real term was still well below the level reached in 1960. If liberal market policies pursued within a stable macro-economic framework ⎯ the conditions that have applied since 1994 or so ⎯ have not produced a faster rate of growth, what in the PRS is going to make a difference? Logically, there must be a missing element necessary for faster growth, even if it is not known. It is not clear that the PRS contains novel measures that might do the trick.
It is hard to assess this economic strategy, owing to lack of evidence on how the economy works. A more explicitly prop-poor strategy would emphasise developing smallholder farming, but quite apart from investments in physical infrastructure, that would require concerted efforts to solve failures in factor markets ⎯ above all in access to credit, and it is not obvious that state agencies can do this, or leastways not effectively and economically. Hence comparing alternative economic strategies is largely a matter for conjecture.
A 2001 review of specific programmes for production found that many suffered from offering high levels of benefits, in some cases assets probably beyond the ability of poor households to manage, to a restricted number of beneficiaries with inadequate targeting. Elite capture was more or less encouraged by programme design. Coverage of potential clients was limited. Monitoring and evaluation was largely absent: little was known about impact.
The road to growth that creates jobs and incomes for the poor to any substantial degree is not clear in the specific circumstances of Nicaragua. We lack the evidence that would support a more informed programming, and we have not learned enough
Poverty Reduction Strategy Review- Country Case Nicaragua
8
about what works and fails from the many initiatives that have been tried over the last two or three decades.
For social investments, the major failing is little attention to pre-school children, especially those aged 6 to 24 months, the most vulnerable of all. Efforts to put this right are still small-scale. The best-known response, the Social Protection Network (RPS), transfers cash to poor household on condition that infants undergo health centre checks, and that school-age children attend school. Evaluations of the pilot of this have been highly positive, but the programme is still to be implemented at scale.
Funds for education were skewed towards buildings, rather than recurrent costs. This was also seen in health provision: apparently part of a pathology of over-investment seen in Nicaragua. Education strategy stresses extending coverage, but pays little attention to the demand for schooling ⎯ a critical problem for the poor who cannot afford the costs of uniforms and textbooks, and often cannot afford not have their children helping out at home or on the farm.
Matter are better in health than education. It is probably no coincidence that Nicaragua has very poor indicators of education compared to countries of similar economic development, but health indices that are better than might be expected ⎯ and which have improved in the last fifteen or so years.
Outcomes and experiences
The overall outcome is clear: since 1993 there has been little progress in reducing poverty. And there are no signs that things are picking up: with next to no improvement in poverty visible since 1998, one can only conclude that it is unlikely that progress will be made unless something changes.
It would be unfair to blame public policy and action for all of this: external events can derail the best efforts, and in a market-based economy there is much that it is difficult for public action to change ⎯ at least in the short term. Hurricane Mitch in 1998 and the fall in the price of coffee that began in that year have clearly done the poor no favours. But it seems that the lack of reduction in poverty can hardly be blamed on these factors; while there have been forces working in the other direction ⎯ economic growth, even if slow, the remittances from the rising numbers of emigrants, substantial debt relief, and copious flows of aid.
To cap it all, since 2001 there has been a Poverty Reduction Strategy in place: by 2005 some of the additional efforts to reduce poverty should have paid off. All things considered, it is hard to avoid the conclusion that too many public programmes have been ineffective in translating public spending ⎯ and a slowly rising average output per capita ⎯ into poverty reduction.
Poverty Reduction Strategy Review- Country Case Nicaragua
9
So what do we know about public programmes and their shortcomings? The 2001 Review of 79 public programmes across sectors draws attention to several generic problems. Some have been mentioned already: benefits set too high, low coverage, inadequate targeting, and elite capture.
In addition, much programming is based on household analyses that underplay the fate of particular individuals within households, above all infants and young mothers.
Projects and programmes proliferate, with overlap and duplication rife. Different projects often offer benefits different in type and degree, so that in implementation there is no consistent policy. Resources are thus wasted, with little attempt to compare the different models used to find the most effective and economical.
The penchant for investing in new facilities was rampant ⎯ partly since politicians, public officials and donors are keen to leave tangible monuments to their efforts; partly since the government is good at construction and has a specialised agency, FISE, with considerable experience and reputation for this; and partly since donors will usually fund capital investments, but not recurrent costs.
There is a chronic tendency towards short-term policies and projects that lack continuity. In part this arises from a political system that sees a new government enter every five years, set in a context of personalised leadership that makes each new president and ministers keen to have their own programmes, so that on-going initiatives are typically ditched.
Finally, and perhaps most damaging of all, the review noted that monitoring and evaluation was ‘extremely weak’. Information is not usually collected and even when it is, it is often not shared with other agencies or the public. Consequently there is little accountability of agencies and officials to citizens, and above too little learning is taking place. This is a crying shame: the one advantage of the plethora of initiatives funded variously by government, donors and NGOs is that there is no lack of different experiences from which to learn.
In conclusion
It seems the policies, projects and programmes of the public sector are having little impact on poverty. This is not for lack of resources: if all the donor funds were sent directly to the poor, every poor person would get around US$300 a year.
In large part, the problem has to be ineffective public policy and programmes, set within a context of an economy that grows too slowly to generate jobs and incomes sufficient to offer substantial improvements to the work force in anything less than the long term.
The failings set out in the previous section are all plausible explanations for failure, especially if most or all of the concerns and criticisms are warranted: in combination
Poverty Reduction Strategy Review- Country Case Nicaragua
10
the flaws, however minor some may be, would become substantial and surely sufficient to explain the lack of impact. If so, the implication is clear: correct the failings. In the reports of consultants and other observers there are many words of good advice for more effective action to reduce poverty in Nicaragua? Here is an attempt, just three points, thus:
1. Learn from experience. Nicaragua is a veritable laboratory of projects to reduce poverty: there must be the opportunity to learn from this. It should be possible to identify successes that inspire: a useful antidote to diagnoses of problems and weaknesses that create the impression that failure is the norm.
2. Learning is a pre-condition to the next lesson: be prepared for something longer than the short haul. Few success stories in development are overnight transformations: most are the result of sustained efforts, often with considerable adaptation to initial ideas before the programme works well. Government, donors and NGOs need to stick with their programmes longer. But there is no point in persisting with bad ideas. Hence we need the learning to understand better what is worth keeping, what can be improved and what needs to be replaced.
3. Simplicity and clarity of strategy and policy. Lack of this means each agency with funds has to define its own policies, leading to the profusion of overlapping and competing initiatives. Not all policy can be made simple, but in each sector there are central principles that can be set out. How can we ensure that policies are not simple-but-wrong? We are back to the principle of learning again.
Poverty Reduction Strategy Review- Country Case Nicaragua
11
1 Introduction Are policies to reduce chronic poverty articulated in poverty reduction strategies (PRS) actually implemented in practice, and with what results?
Nicaragua is an interesting case: as one of the most highly indebted countries in the world, the offer of debt relief in return for formulating and implementing a PRS was eagerly accepted. Subsequently the country has enjoyed at least three advantages: substantial debt relief was granted in 2004, aid flows have been large, and ⎯ unlike some developing countries, and indeed Nicaragua itself twenty years ago ⎯ the nation is both at peace and politically stable. Its membership of the Central American Free Trade Association with quite good economic growth in some of the neighbouring countries may be another advantage. If a PRS was going to make difference, then, it should have done so in Nicaragua.
The study has been carried out largely by reviewing the literature, supplemented by some personal knowledge of the country. Much of what is planned in Nicaragua is quite well documented, as might be imagined in a country where so many public sector investments are funded by donors. What is less well recorded, and herein lies a weakness in this paper, is the outcome of the many projects and programmes to reduce poverty. To anticipate one of the conclusions, the opportunity to learn from experience is not being grasped in Nicaragua.
The rest of the paper consists first of a section that sets out what is known about poverty in Nicaragua, largely on the basis of data from the Living Standards Measurement Surveys carried out in 1993, 1998, 2001 and 2005. Poverty reduction strategies and policies are then set out. Their outcomes and experiences are reviewed in a subsequent section, before conclusions with some brief proposals for improvement are offered.
2 Poverty in Nicaragua Chronic poverty is endemic and persistent in Nicaragua. During the last 40 years the country has seen sweeping political changes with marked differences in policies both for economic growth and for poverty reduction. Although the evidence is incomplete, poverty has remained high throughout ⎯ never less than 40% of the population ⎯ and remains obstinately so at present.
2.1 Rates of poverty Not much is known for sure about poverty in the 1980s: there was a survey in 1985, but Dijkstra (2000) questions the method used at a time when so many prices were distorted. Subsequently there have been four rounds of household surveys, Living
Poverty Reduction Strategy Review- Country Case Nicaragua
12
Standards Measurement Surveys (LSMS), in 1993, 1998, 2001 and 2005 that have obtained information on incomes and consumption from a nationally representative sample of six thousand or more households.
The 1985 survey reported a national head count of 43% of the population living below a monthly income of US$60. The data for the subsequent LSMS appear in Tables 2.1 and 2.2. Box 2.1 reports the poverty lines used: extreme poverty is defined by the cost of meeting food requirements, overall poverty by this plus another 41–42% to cover other basic needs.
Box 2.1: Measuring poverty
For 1998 the extreme poverty line was determined by computing the annual cost to buy a bundle of food that provides 2,187 Kcal/day, giving a per capita annual extreme poverty line of C$2,489 or US$237. The general poverty line is the extreme poverty line plus an additional amount for the share dedicated to non-food consumption, based on that recorded for households consuming food worth C$2,489 a person, 41.1%. This gives an overall poverty line of C$4,223 (C$2,489 for food plus C$1,734 for non-food) or US$402 per year in 1998.
To generate the 2001 extreme poverty line, the cost of the same bundle of food was computed using new prices. The extreme poverty line for 2001 was C$2,691 or US$202. For the non-food items in 2001, the same amount used in the 1998 estimation is updated using the change in the consumer price index for the same period of time (42.2 percent). The general poverty line in 2001 was C$5,157 (C$2,691 for food plus C$2,466 for non-food) or US$386 per year.
The 1993 poverty lines were estimated on a similar basis of extreme poverty based on food needs, and general poverty on that plus an addition.
Source: Adapted from World Bank 2003
The incidence of poverty, the headcount figure, having risen from the 1985 estimate of 43% to reach 50% in 1993, then fell to reach 46% in 2005. If the 1985 figure was accurate, then still 20 years later poverty had not been brought down to the previous level. There has, however, been some improvement since the early 1990s, but hardly rapid progress. Indeed, statistically it is hard to prove any improvement at all between 1998 and 2005.
Poverty Reduction Strategy Review- Country Case Nicaragua
13
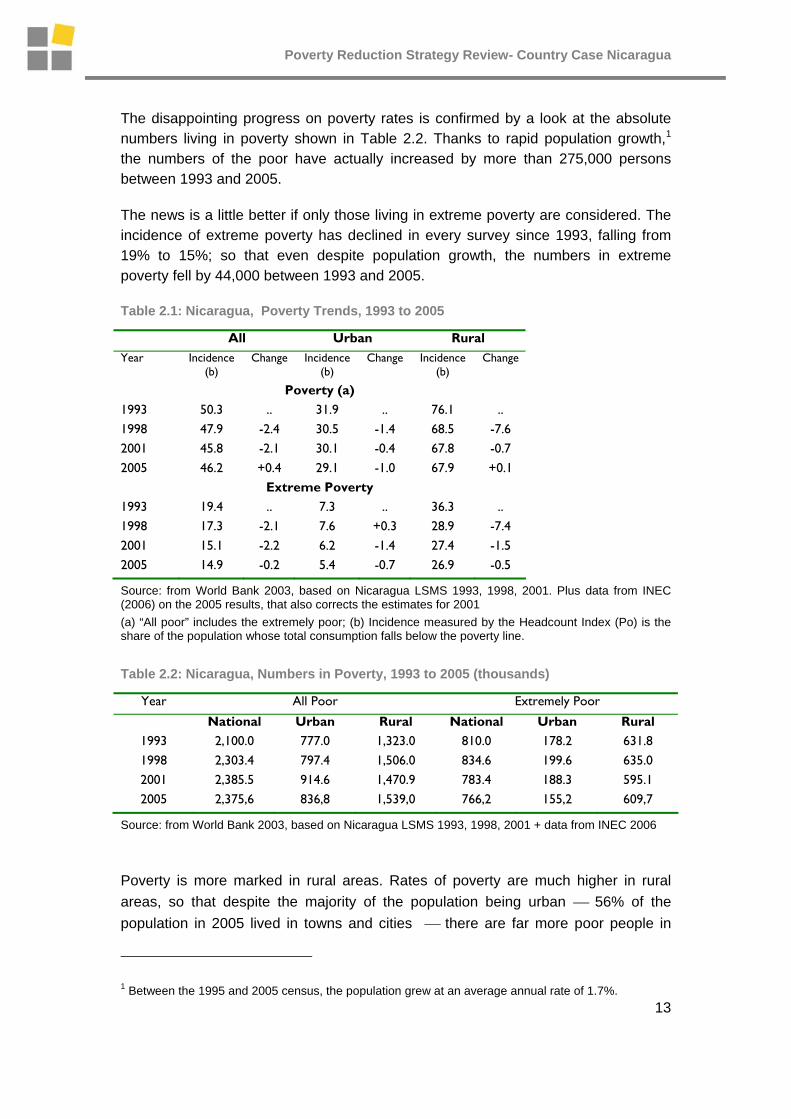
The disappointing progress on poverty rates is confirmed by a look at the absolute numbers living in poverty shown in Table 2.2. Thanks to rapid population growth,1 the numbers of the poor have actually increased by more than 275,000 persons between 1993 and 2005.
The news is a little better if only those living in extreme poverty are considered. The incidence of extreme poverty has declined in every survey since 1993, falling from 19% to 15%; so that even despite population growth, the numbers in extreme poverty fell by 44,000 between 1993 and 2005.
Table 2.1: Nicaragua, Poverty Trends, 1993 to 2005
Source: from World Bank 2003, based on Nicaragua LSMS 1993, 1998, 2001. Plus data from INEC (2006) on the 2005 results, that also corrects the estimates for 2001 (a) “All poor” includes the extremely poor; (b) Incidence measured by the Headcount Index (Po) is the share of the population whose total consumption falls below the poverty line.
Table 2.2: Nicaragua, Numbers in Poverty, 1993 to 2005 (thousands)
Source: from World Bank 2003, based on Nicaragua LSMS 1993, 1998, 2001 + data from INEC 2006
Poverty is more marked in rural areas. Rates of poverty are much higher in rural areas, so that despite the majority of the population being urban ⎯ 56% of the population in 2005 lived in towns and cities ⎯ there are far more poor people in
1 Between the 1995 and 2005 census, the population grew at an average annual rate of 1.7%.
Poverty Reduction Strategy Review- Country Case Nicaragua
14
rural areas than urban areas. In 2005 65% of all the poor were found in the countryside. The rural-urban divide is even more pronounced for extreme poverty. Rural rates of extreme poverty are four times or more than those seen for urban areas; of the 766,000 persons estimated to live in extreme poverty in 2005, 80% were living in rural areas. This implies that poverty is not just more prevalent in rural areas compared to urban, it is deeper as well.
The rural-urban divide, however, is narrowing somewhat: between 1993 and 2005 there was more progress in reducing rural poverty, both overall and extreme, than urban poverty. That said, in the last part of this period, between 2001 and 2005, the trend was the reverse with reductions in urban poverty rates, but much less in rural areas.
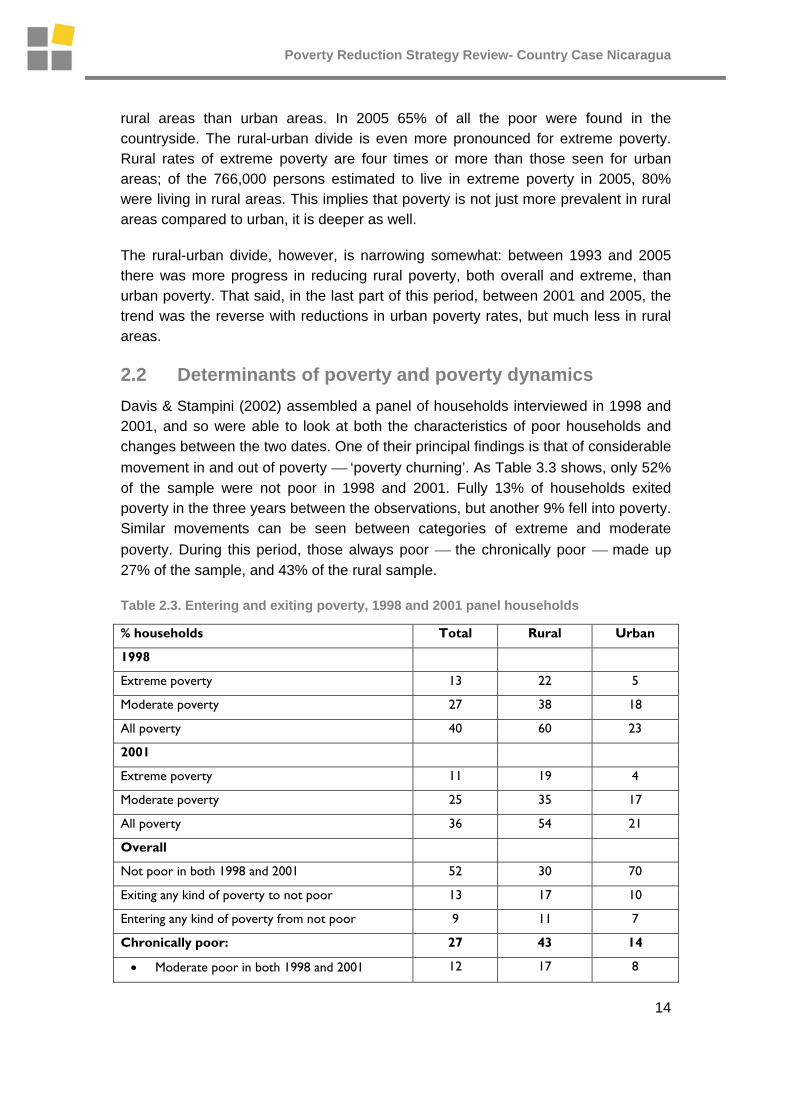
2.2 Determinants of poverty and poverty dynamics Davis & Stampini (2002) assembled a panel of households interviewed in 1998 and 2001, and so were able to look at both the characteristics of poor households and changes between the two dates. One of their principal findings is that of considerable movement in and out of poverty ⎯ ‘poverty churning’. As Table 3.3 shows, only 52% of the sample were not poor in 1998 and 2001. Fully 13% of households exited poverty in the three years between the observations, but another 9% fell into poverty. Similar movements can be seen between categories of extreme and moderate poverty. During this period, those always poor ⎯ the chronically poor ⎯ made up 27% of the sample, and 43% of the rural sample.
Table 2.3. Entering and exiting poverty, 1998 and 2001 panel households
% households Total Rural Urban
1998
Extreme poverty 13 22 5
Moderate poverty 27 38 18
All poverty 40 60 23
2001
Extreme poverty 11 19 4
Moderate poverty 25 35 17
All poverty 36 54 21
Overall
Not poor in both 1998 and 2001 52 30 70
Exiting any kind of poverty to not poor 13 17 10
Entering any kind of poverty from not poor 9 11 7
Chronically poor: 27 43 14
• Moderate poor in both 1998 and 2001 12 17 8
Poverty Reduction Strategy Review- Country Case Nicaragua
15
• Exiting extreme poverty to moderate poverty 5 9 2
• Entering extreme poverty from moderate poverty
4 7 2
• Extreme poor in both 1998 and 2001 6 10 2
Number of observations 2,800 1,273 1,527
Source: Table 4, Davis & Stampini 2002, with chronically poor added
Figure 2.1 shows the changes in poverty status between 1998 and 2001, summarised for major groups of households: those not poor in 1998 and 2001, those who escaped poverty, those who sank into poverty, and those who were poor in both years, the chronically poor.
Figure 2.1: Nicaragua, poverty status 1998 and 2001
Never Poor
Exits from Poverty
Entrants to Poverty
Chronically Poor
All households Rural households
Source: LSMS 1998 and 2001, sample of 3,015 households
The observed movements in poverty status were associated with people changing occupations, either their main or subsidiary activities; and, in rural areas, with changes in access to land. The extent of poverty churning confirms the vision of poverty that emerges from detailed studies of the poor in other countries and contexts: that poverty is a condition that those with marginal livelihoods may experience, rather than an enduring state associated with a particular social group, ‘the poor’.2 Those vulnerable to poverty in Nicaragua clearly frequently change jobs to improve their position.
So what makes the difference between being poor or not? Davis & Stampini (2002) summarise their findings for the rural poor as follows:
2 A point made strongly by Bastiaensen, de Herdt & D’Exelle (2005) when examining poverty reduction in parts of the Cameroon and Nicaragua.
Poverty Reduction Strategy Review- Country Case Nicaragua
16
Thus, rural households escaping or exiting poverty tend to have the following characteristics — smaller family size, higher levels of education, more participation in non-agricultural wage labor and non-agricultural businesses, and less participation in farming or agricultural wage labor.
Households in extreme poverty over the two periods have the highest family sizes, the lowest level of education, the worst dwelling characteristics, the highest dependency on farm agricultural activities and off-farm agricultural wage labor, and the least participation in non-agricultural wage labor.
(9, paragraphing added)
Escaping poverty in rural areas, their analysis suggests, means getting a job off the land. It is not just those with no land working mainly as farm labourers who are very likely to be poor: some of the poorest households have very small farms but the only jobs they get are as labourers on other people’s farms. Having land may help, but it has to be of a certain size: a small plot does not seem to help much.
This should not be taken to imply that farming is a route to poverty: not all farmers are poor. On the contrary, there are plenty of rich farmers in Nicaragua. What matters, as Davis & Stampini (2002) stress, are the conditions under which people farm: their access to markets, credit, and technical assistance.
Another view of rurality and farming being linked to poverty comes from the analysis of Deininger et al. (2003) using the 1998 LSMS data plus data from a Ministry of Agriculture (MAGFOR) survey of 1995. Table 2.4 shows their findings.
This confirms the divide between urban and rural areas: per capita incomes and expenditures are, on average, more than twice as high in urban compared to rural areas. In the rural areas as a whole, the median ⎯ a more informative measure when distributions are skewed ⎯ expenditure per capita is just C$3,691: below the poverty line for 1998 of C$4,200. Within the rural areas, those households mainly engaged in farming are notably worse off than those with non-farm occupations, and both means and medians of income and expenditure for those in farming fall below the poverty line.
The single clearest correlate of incomes in this data set is education: while household heads in urban areas typically have nearly 6 years schooling, those in rural areas have less than 3 years. And within rural areas, those engaged in farming have the lowest average attendance at school ⎯ two years or less ⎯ and rates of illiteracy of 44% or more.
Table 2.4. Characteristics of the rural and urban population in Nicaragua, 1998
All Urban Rural Rural by "type"
Agriculture Non-agriculture
Poverty Reduction Strategy Review- Country Case Nicaragua
17
Expenditure and income Worker Self-emp. Worker Self-emp.
Per capita expenditure 8,257 10,656 5,073 4,271 5,115 5,174 6,156
Per capita expenditure (median)
5,226 6,919 3,691 3,307 3,506 4,452 5,026
Per capita income 8,762 11,857 4,653 2,757 4,044 6,654 5,596
Population share 57.1% 42.9% 16.9% 34.0% 27.1% 22.0%
Total population (expanded) 4,174,591
Source: Deininger et al. (2003), Table 1, computations from1998 LSMS and MAGFOR Survey.
The importance of education is confirmed by data from the 2001 and 1998 LSMS. Figure 2.2 illustrates the differences seen in education for four groups of households surveyed in both 1998 and 2001. Across the groups, the chronically poor have the lowest levels of education, the never poor the highest.
Figure 2.2: Education levels in Nicaragua, 1998 and 2001, by poverty group
Poverty Reduction Strategy Review- Country Case Nicaragua
18
0.00
1.00
2.00
3.00
4.00
5.00
6.00
7.00
8.00
All Never Poor Exits from
Poverty
Entrants to
Poverty
Chronically
Poor
Yea
rs E
duca
tion
, Av
Adu
lt
1998
2001
Source: LSMS 1998 and 2001, sample of 3.015 households nationwide Note: Chronically poor are those who were poor in both 1998 and 2001
What is known about urban poverty? The Davis & Stampini analysis has less significant results when trying to explain the causes of poverty amongst urban households in the sample. Here it seems that having more education and more business assets raises incomes, as does having a smaller household size and living in Managua.
A revealing insight comes from yet more World Bank analysis (2003) of the LSMS data that decomposes changes in poverty by changes in wealth, inequality and food prices between 1998 and 2001. The results appear in Table 2.5. This suggests that the main factor reducing poverty overall has been a small reduction in income inequality, while those reducing extreme poverty have been movements in food prices that have made basic foods relatively cheaper.
Table 2.5: Decomposing the influences on poverty reduction
Poverty Reduction Strategy Review- Country Case Nicaragua
19
Source: Box 1.2 in World Bank 2003. U/R = urban-rural ratio
The same World Bank analysis also highlights the parlous circumstances of youth in Nicaragua. Amongst the 21% of the population aged 15 to 24 years, 49% live in poverty and 30% in extreme poverty. Rates of unemployment (and not studying either) run at 25%. For young females, poverty and unemployment seem to be associated with high rates of teenage pregnancy, the highest in Latin America (World Bank 2003).
2.3 The location of poverty A World Bank study of rural poverty (2005), also drawing on the LSMS data, looks at the geography of poverty. They found that living in remote locations tends to increase the likelihood of being poor. Access to paved roads, to shops, schools and health centres tended to be better for the non-poor compared to the poor.
No surprises here: but then the team assessed the ‘economic dynamism’ of different areas based on natural resources, access to markets and infrastructure, and drought risks, to produce Map 2.1. It seems that economic dynamism is closely associated with proximity to the main urban centres. According to this analysis, many of the poor are located within the higher potential zones, notwithstanding the correlation of distance from the main centres and increasing rates of poverty. About half the extreme poor live within the quarter of Nicaragua within four hours drive of Managua. Generally distance from Managua sees increasingly extensive land use and higher rates of poverty; but not that many poor since population density falls quickly as well.
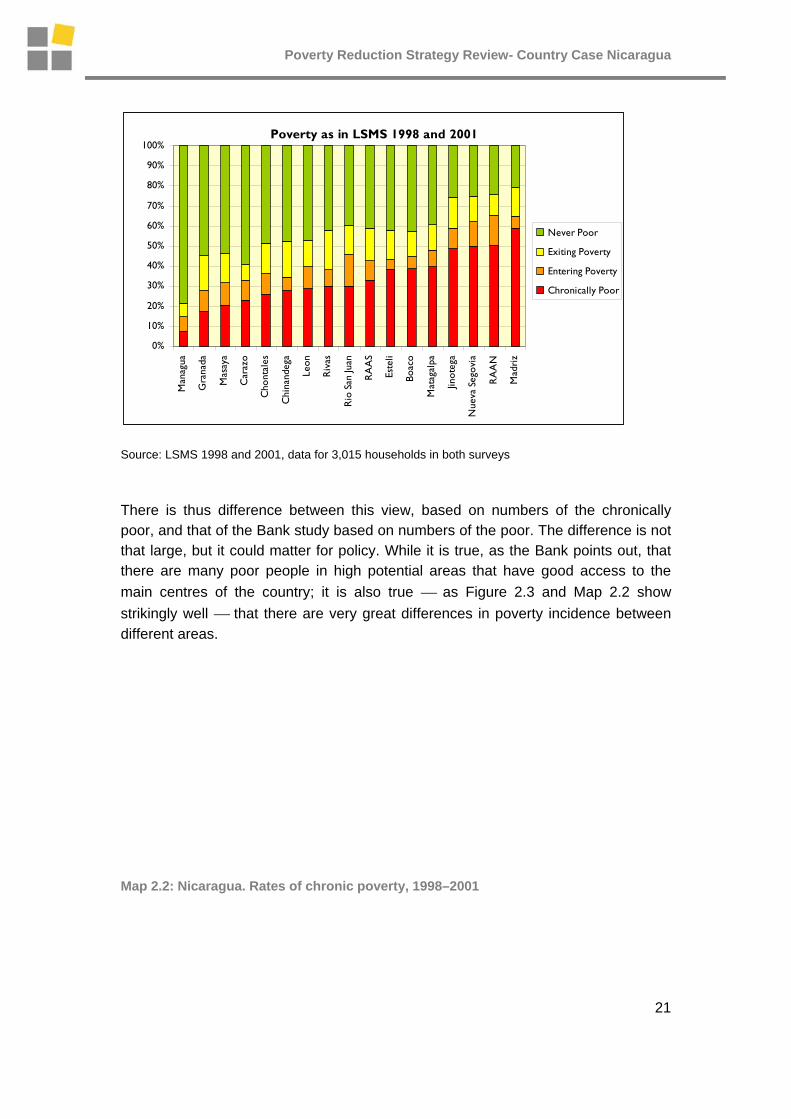
But it is possible to construct a somewhat different picture by looking at rates of chronic poverty, in terms of those households measured as being poor in both the 1998 and 2001 LSM surveys. As Figure 2.3 shows, the rates of chronic poverty by Departamento vary from less than 10% for Managua to over 50% for Madriz.
Poverty Reduction Strategy Review- Country Case Nicaragua
20
Mapping these produces Map 3.2. the image is striking: rates of chronic poverty are notably low for Managua and the areas close to the capital. Conversely, they are high, very high, for most of the north and west of the country, above all the mountainous north and the north-western lowlands.
Map 2.1: Zones of Economic Dynamism, All of Nicaragua
Source: World Bank 2005
But unlike the World Bank report of 2005, the sample of households that appeared in both the LSMS of 1998 and 2001 shows that the absolute numbers of chronically poor are concentrated in the northern and north-western Departments, or other remote areas. No less than 53% of the chronically poor live in seven territories: Madriz, Nueva Segovia, Jinotega, RAAN, RAAS, Río San Juan and Matagalpa ⎯ see Table 2.6. In contrast, the central areas of Managua and the three small Departments to the south of the capital (shaded in blue and green on the map) contain barely 16% of the chronically poor.
Figure 2.3: Nicaragua. Rates of chronic poverty in 1998-2001
Medium DynamismLow Dynamism
High Dynamism
Dry Zone
Nicaragua: Economic Dynamism
Poverty Reduction Strategy Review- Country Case Nicaragua
21
Poverty as in LSMS 1998 and 2001
0%
10%
20%
30%
40%
50%
60%
70%
80%
90%
100%
Man
agua
Gra
nada
Mas
aya
Car
azo
Cho
ntal
es
Chi
nand
ega
Leon
Riv
as
Rio
San
Juan
RA
AS
Este
li
Boac
o
Mat
agal
pa
Jinot
ega
Nue
va S
egov
ia
RA
AN
Mad
riz
Never Poor
Exiting Poverty
Entering Poverty
Chronically Poor
Source: LSMS 1998 and 2001, data for 3,015 households in both surveys
There is thus difference between this view, based on numbers of the chronically poor, and that of the Bank study based on numbers of the poor. The difference is not that large, but it could matter for policy. While it is true, as the Bank points out, that there are many poor people in high potential areas that have good access to the main centres of the country; it is also true ⎯ as Figure 2.3 and Map 2.2 show strikingly well ⎯ that there are very great differences in poverty incidence between different areas.
Map 2.2: Nicaragua. Rates of chronic poverty, 1998–2001
Poverty Reduction Strategy Review- Country Case Nicaragua
22
CP, % All CP, % Departamentos
<10% 6.7% Managua
10-25% 9.2% Granada, Masaya, Carazo
26 to 30% 31.8% Chontales, Chinandega, Leon, Rivas, Rio San Juan RAAS
31 to 40% 22.5% Esteli, Boaco, Matagalpa
45%> 29.8% Jinotega, Nueva Segovia, RAAN, Madriz Source: Computed from data from the LSMS of 1998 and 2001
RAAN
RAAS
Jin N Seg
Man
Rivas RSJ
León
Chin
Boaco
Mata
Car
Est
Mad
Chon Gra
Mas
Poverty Reduction Strategy Review- Country Case Nicaragua
23
Table 2.6: Numbers of chronically poor, LSMS of 1998 and 2001
Chr
onic
ally
Poo
r ho
useh
olds
Tot
al h
ouse
hold
s
% in
sam
ple
% p
opul
atio
n,
Cen
sus
1995
Cor
rect
ion
fact
or
Cor
rect
ed C
P
%
Matagalpa 86 216 7.2 8.8 1.23 106 12.6%
Jinotega 70 144 4.8 5.9 1.24 86 10.4%
Chinandega 63 226 7.5 8.0 1.07 67 8.0%
Leon 71 246 8.2 7.7 0.94 67 8.0%
Raan 70 139 4.6 4.4 0.95 67 8.0%
Raas 63 190 6.3 6.2 0.98 62 7.4%
Managua 29 394 13.1 25.1 1.92 56 6.7%
Nueva Segovia 62 124 4.1 3.4 0.83 51 6.1%
Esteli 57 148 4.9 4.0 0.81 46 5.6%
Madriz 79 134 4.4 2.5 0.56 44 5.3%
Boaco 52 134 4.4 3.1 0.70 36 4.3%
Masaya 50 243 8.1 5.5 0.68 34 4.1%
Rivas 45 150 5.0 3.2 0.64 29 3.5%
Chontales 36 138 4.6 3.3 0.72 26 3.1%
Carazo 36 155 5.1 3.4 0.66 24 2.9%
Granada 26 151 5.0 3.6 0.72 19 2.2%
Rio San Juan 25 83 2.8 1.6 0.58 15 1.7%
Total 920 3015 100 100 835 100%
Sources and Notes: The first three columns record households observed in the 1998 and 2001 LSMS. The fourth column shows the distribution of the population at the 1995 Census. Since this differs from the distribution of the sample as shown in column 3, to get a better estimate of the true numbers in the national population the observed numbers of chronically poor need to be adjusted by a correction factor reflecting the difference between the distribution of the population and that of the sample. A corrected estimate of chronically poor households thus appears in column 6, with the percentage of the chronically poor in each Departamento as a fraction of the national total in column 7.
2.4 Social capital and poverty The Bank team also drew on a separate data set: the results of participatory exercises in 56 communities in eight Departments run by UNAG and its Programa Campesino a Campesino (Farmer-to-Farmer). This looks social organisation and capital to identify three types of community: entrepreneurial and thriving, managing resist crisis; and unable to resist crisis, see Box 2.2. Interesting as this vision is, especially since it comes from the people consulted, what is not clear is whether the
Poverty Reduction Strategy Review- Country Case Nicaragua
24
entrepreneurial communities owe their economic success to their greater social capital or whether the social capital is the product of economic success.
Social capital could well be an independent variable. Enríquez (2000) studied the impacts of structural adjustment on four farming communities in two different areas in 1996–97. The four communities had fared differently under structural adjustment, but those that had prospered had managed to replace the previous support of the state in credit and technical assistance by similar support from NGOs.3 The NGOs in turn had been contacted by local associations who formed a welcome conduit for NGO operations. So social capital clearly helped in this case.
But it was not the only factor: the most prosperous of the communities produced milk and could take advantage of the opportunities to ship cheese to El Salvador. Two of the other communities had the misfortune to be engaged in cotton production that suffered from falling cotton prices in the 1990s to the point where the crop had all but ceased to be planted by the end of the decade.
Box 2.2: Social capital and resistance to crises
Communities not resistant to crisis:
Most households in these communities generally have not been able to cope with crisis. Many are located in areas with low agricultural potential and limited access to infrastructure and services. The quantity and quality of household assets in these communities are limited and education levels are low. Households live almost exclusively by production of basic grains (maize, beans) on small plots, selling their labor, and harvest/sale of firewood. The communities are in a relative state of economic stagnation and neglect. The level of social organization is weak, and this prevents them from making progress in marketing their products or improving basic services.
Communities resisting crisis:
Most households in these communities have managed to develop some capacity to cope with crisis. That capacity is reflected in their ongoing search for alternatives to the different problems they face. Their dynamism is more closely linked to social organization than to productive organization. These communities have achieved a good level of development of their human and social capital, guaranteeing their progress toward ongoing economic and social initiatives. Community members have
3 Not all communities benefited from the NGOs, or at least, not in production: one community received training on soil conservation and reforestation. Valuable as this may have been, it did not generate incomes.
Poverty Reduction Strategy Review- Country Case Nicaragua
25
several trades or occupations (such as farmer, builder, carpenter, or owner-operator of a small business), and have diversified their income sources. Because of these diversified activities, the community can support non-agricultural employment.
Most households in these communities are more economically and socially dynamic than the others. This dynamism is directly related to the development of their human and social capital, which facilitates an ongoing process of social and productive innovation. These communities have developed their management and organizational capacity. Local organizations revolve around social and economic activities, such as business, micro-credit and intermediation facilities, and cooperatives. Households make intensive use of all their assets. These communities are committed to the diversification of production and income. They are successful in agricultural production and also engage in other activities, such as tourism, crafts, and trade. They look for ways to extend agricultural production during the dry season by using irrigation systems. They have the capacity to save, invest, and generate employment. They maintain relations with NGOs and local and national authorities, but also have a high degree of financial independence.
Source: World Bank, 2005
2.5 Risk and vulnerability While the upswings of poverty churning offer some hope for the poor, the downswings remind us that the poor face hazards. Box 2.3 sets out some of those faced.
Box 2.3: The main hazards faced by the poor
Idiosyncratic Natural Economic
Illness
Accident
Disability
Violence
Theft
Plant pests and diseases, animal ill-health
Drought
Floods
Hurricanes and tropical
Falling commodity prices on international markets
Poverty Reduction Strategy Review- Country Case Nicaragua
26
Addiction storms
Source: Largely from World Bank 2003
Hazards may be differentiated by the speed with which they arise and the threat they imply. Some happen with little or no warning and are capable of inflicting severe damage; others arise less suddenly and give more time for adaptation. Where there is some time before the full impact of the hazard is felt, there may be more scope for mitigation.
For example, the fall of coffee prices between 1998 and 2001 by more than 60% fed through to more poverty for small farmers growing the crop. But, reports the World Bank (2003), the impacts were not as severe as might be feared given that between 1998 and 2001 almost one quarter of rural households had some involvement with coffee. For those who stayed primarily in coffee, the effects were grave: falls in consumption of 16% on average, with increased poverty and setbacks for children’s education and nutrition. But only 8% of households neither entered nor left the sector. The key point seems to be mobility and the capacity to switch the focus of livelihoods. Those that could and did change escaped the worst effects; those that could or did not were hit hard. (World Bank 2003)
Otherwise the shocks tend to result in marginal households reducing consumption and disposing of the few assets they have.
Looking at vulnerability, a 2001 study (Government of Nicaragua 2001) drew on data from the 1998 LSMS, the 1998 Demographic & Health Survey and qualitative assessments to construct the profile shown n Table 2.7. This stresses the health risks faced by some groups, above all young children and women in reproductive ages: poverty is seen as a key factor.
Poverty Reduction Strategy Review- Country Case Nicaragua
27
Table 2.7: Main risks faced by different groups in Nicaragua
Age Group / Number of Poor People
Type of Risk Indicator of Risk Share of Population at Risk Number of people at Risk (1998)
Malnutrition (0-5) any type 31% (P) 171,000 children
Anemia (12-59 months old) 2000 29% (P+NP) 230,000 children
Vit. A deficiency age (12-59 months old) 2000 9% (P+NP) 74,000 children
Do not receive early child development services 95% 0-3 yr olds (P+NP) 55% 4-6 yr olds (P+NP)
462,000} population figures 337,000} for year 2000
Frequent diarrhea (0-6) 22% (P) 119,000 children
0-6 years Ext Poor: 213,000 pers. Poor Not Ext: 333,000 pers. Poor: 546,000 pers.
Risks of children 0-6 yrs.
Frequent respiratory illness (0-6) 26% (P) 141,000 children
Not in school 21.3% (P) 95,000 children
Because of: physical access
5% (P) 22,000 children
7-12 years Ext. Poor: 174,000 pers. Poor Not Ext: 274,000 pers. Poor: 447,000 pers.
Risks of children 7-12 yrs
cost 11% (P) 48,000 children
Not in school 61% (P) 230,000 youths
Because of: physical access
5% (P) 18,000 youths
13-18 years Ext. Poor: 142,000 pers. Poor Not Ext. 236,000 pers. Poor: 378,000 pers.
Risks of youths 13-18 yrs
cost 22% (P) 83,000 youths
Unemployment 13.9% of EAP (P) 89,000 persons
Underemployment: work <40 hrs. and wish more 5.5% of EAP (P) 30,000 persons
Persons sustained by each poor worker 3.16 (P)
15-59 years Ext. Poor: 269,000 pers. Poor Not Ext: 558,000 pers.
Low and Unstable Income
Low skills: less than 3rd grade (Census) no school 24.5%, + 1-3 years school 23.1% (P+NP)
1,464,000 persons
Poverty Reduction Strategy Review- Country Case Nicaragua
28
Poor: 827,000 pers.
Low Access to capital credit constrained rural households 38% (P+NP) 148,000 rural households
Environmental Risks and Natural Incidence of storms, floods, earthquakes and volcanic activity Direct: US$ 20 MM per year
Poverty Reduction Strategy Review- Country Case Nicaragua
29
Disasters GDP decline: 2% per year for 8 years. Deaths: 3-10 thousand persons Directly affected: 50-900 thousand .persons. Indirectly affected: 5 million persons
Personal and social risks Domestic Violence Physical and sexual against women
29% women 15-49 (P+NP) 295,000 women
Geographic isolation and Social Exclusion
Social fragmentation 72% (P+NP) 3,476,000 persons
Source: Government of Nicaragua, SETEC 2001
Poverty Reduction Strategy Review- Country Case Nicaragua
30
2.6 Inequality As Table 2.4 shows, the median of national consumption in 1998 was C$5,226, and mean incomes were far more. Against a poverty line of C$4,222, an even distribution of incomes would have left few in poverty. In reality, fully 48% of the population were estimated to live in poverty that year.
Table 2.8 reports the Gini coefficients4 calculated from the sample households in the 1998 and 2001 rounds of the LSMS, plus the consumption coefficients for 2005. Regarding incomes, the national figures show coefficients of 53.6 and 55.1 for 1998 and 200: very high levels internationally, exceeded only by a few other Latin America countries such as Guatemala and Brazil, and by South Africa. Concentration of land and cattle is also very high.
There are some signs, however, that measured by consumption inequality is slowly diminishing and in both urban and rural areas.
It is surprising to see how little the redistribution undertaken by the FSLN governments of the 1980s has affected inequality. For example, the 1998 LSMS shows that two-thirds of Nicaragua’s farms were under 5 mz, accounting for just 5% of the land: large farms of 50 mz or more represented just 10% of farms, but control 75% of agricultural land. This was slightly less unequal than the situation in the 1970s, but not by very much. Indeed, in this sample, 38% of rural households were landless ⎯more or less the same fraction as before the revolution. (Corral & Reardon 2001)
Table 2.8: Inequality in incomes and assets
Gini coefficients
1998 2001 2005
National 45.2 43.1 40
Urban 43.9 41.4 38
Consumption
Rural 37.2 34.7 34
National 53.6 55.1
Urban 52.6 54.3
Income
Rural 47.8 48.3
Total owned land Rural 87.7 84.5
Cattle Rural 93.2 91.8
Sources: LSMS, from World Bank 2003, Davis & Stampini 2002; 2005 data from INEC 2006
4 Perfect equality would give a score of 0: complete inequality would be a score of 100.
Poverty Reduction Strategy Review- Country Case Nicaragua
31
2.7 Poverty, dimensions and causes: what has not been mentioned
The conditions that create poverty are complicated and complex. There are several other issues that have not been mentioned so far, including:
• Discrimination ⎯ few mentions in the literature, with the major exception of gender, see below. Pronounced ethnic and linguistic differences arise mainly in the remote Atlantic region, where there are significant communities of indigenous people such as the Miskito, and, on the coast, settlements of English-speaking people of African origin ⎯ the descendants of escaped slaves from the Caribbean islands. To what extent poverty amongst them arises from their ethnic and linguistic characteristics, or can be attributed to the wider problems of people living in locations remote from national centres is not clear;
• Gender ⎯ females suffer marked disadvantages in access to property and in labour markets. In a macho society they are also vulnerable to male violence; and
• Disability ⎯ in the papers reviewed this issue was not raised. Most data sources for Nicaragua do not seem to record this.
An additional consideration is the effects of international conditions and relations. Nicaragua can be seen as a country chronically disadvantaged in its relations to the rest of the world: a small country that finds it difficult to define its own policies without the sanction of the Bank and the Fund, deeply indebted even if a large part of the former burden has been relieved, and dependent largely on primary exports that face fluctuating and declining prices. On the other hand, Nicaragua has had the benefit of unusually large flows of aid and is now receiving large-scale remittances. Controversy surround the official line on trade liberalisation and regional agreements such as CAFTA: critics argue that any arrangements that allow liberalised imports will undercut national production. Further consideration of this is beyond the scope of this essay.
In the past analyses of poverty in Latin America have emphasised the dependent nature of external relations and the role of economies as producers of primary commodities ⎯ analyses that reached their zenith with the dependency theory of development. This saw that countries on the periphery of the capitalist world economy would suffer processes of active under-development through relations with the centre. The theory was largely discredited, in part by the simple observation that some countries on the periphery have clearly been able to grow while integrating into global markets ⎯ Nicaragua’s neighbour, Costa Rica would be an example ⎯ and that those countries that have tried to pursue more autarkic economic policies have generally seen their economies stagnate and decline.
Poverty Reduction Strategy Review- Country Case Nicaragua
32
3 Poverty Reduction Strategies in Nicaragua and the chronically poor
3.1 Background: Poverty Reduction Strategies in Nicaragua Nicaragua, as a highly indebted country anxious to qualify for the relief of HIPCII, was quick to draw up its Poverty Reduction Strategy (PRS). This, called the ‘Strengthened growth and poverty reduction strategy, 2001–05’, (ERCERP, to use the Spanish acronym), was accepted by the IMF and World Bank in September 2001. Although there was substantial effort to consult with diverse groups, the process has been criticised as too short and insufficient.
The ERCERP is based on an analysis of poverty, a key element of which is a map of extreme poverty that shows the highest rates in the interior of the country and on the Atlantic coast.
The strategy proposed ten goals: one refers to reducing the rate of poverty, while the rest, with the single exception of an environmental objective, are concerned with education, health and access to water and sanitation. To achieve these, the strategy proposes four pillars, thus:
• Economic growth on a broad base, with structural reform;
• More and better investment in human capital;
• Better protection of vulnerable groups; and,
• Good governance and institutional development.
It also includes three cross-cutting themes:
• Reducing ecological vulnerability;
• Providing social equity; and,
• Decentralising government.
Investments in poverty reduction costing the equivalent to 14% of GDP a year are set out.
Implementation of the strategy would be accompanied by public sector reforms, including better systems to control public expenditure, to supervise banking, and to decentralise some central government funding and additional decision-making authority to municipalities.
In content, the ERCERP is more concerned with social than economic policy. The goals are closely linked to the Millennium Development Goals (MDG): in as much as more of the MDG refer to social dimensions of development than to economic, there is thus a certain bias
Poverty Reduction Strategy Review- Country Case Nicaragua
33
towards the social sectors. More telling is that the Paper provides much more detail on social programmes than on those for economic growth.
Priorities for economic growth are to generate more growth and employment in rural areas, putting underused resources, including labour, to work. To achieve this, distortions to prices and costs will be removed, investments made in physical infrastructure and human capital, and better technology will be promoted. Coffee, tourism, textiles and clothing, and forest products are seen as sectors with good potential.
In early 2002, just a few months after the ERCERP was accepted by the IMF and the World Bank, the new government of President Bolaños entered. This administration barely recognised the strategy, seeing it as the work of the previous government, and very soon began work on a national development plan (PND ⎯ Plan Nacional de Desarrollo) that was launched in late 2002.
Again there was some public consultation, but one criticised for lack of interaction both with civil society as well as between the planning team and the rest of government. According to one observer, the public consultation was launched more as a marketing campaign than as an invitation to debate.
The first version of the PND was criticised for lack of detail in its proposals. In reply, a more detailed version was prepared as the National Development Plan – Operative 2005–09 (PND-Operativo) and eventually published in September 2004.
There was the idea that this would in effect become a second round PRS, but in 2005 a special document to constitute a second poverty reduction strategy was drafted and subsequently approved by the Bank and Fund. This appears to be the PND-O, perhaps slightly re-packaged. It is rarely referred to, whereas the PND-O was regarded as the plan during the time of the Bolaños administration.
It remains to be seen at the time of writing in early 2007 the plans of the administration of President Ortega that took office in January 2007; although given the considerable political differences between the Liberal parties that supported Enrique Bolaños and the Sandinista Front of Daniel Ortega, a new and different plans is to be expected.
• The PND-O sets out three overall goals, thus:
• To generate employment and sustainable economic growth;
• To increase exports and investments; and,
• To increase incomes to reduce poverty.
To reach these, it proposes the following strategies:
Poverty Reduction Strategy Review- Country Case Nicaragua
34
• To create the conditions to encourage private investment, In particular, to attract foreign direct investment that not only brings capital but also expertise in organising competitive value chains linked to world markets;
• Increase exports, given the restricted size of the domestic market; and, above all,
• Raise the competitiveness of the economy. In particular, the PND-O emphasises the role of industrial clusters capable of generating economies of agglomeration.
For rural development, the Plan recognises the importance of addressing questions of access to credit, and of establishing secure property rights to land.
It divides the rural population in four groups according to their access to resources, namely: well-off producers; medium-scale producers; poor households with potential; and the extremely poor. In proposing different measures for the different groups, for extremely poor households it offers direct transfers both of production supports, such as the improved seeds distributed under the ‘pound-for-pound’ scheme, as well as spending on health and education of children.
Debate on the PND-O ensued on the following points, amongst others:
• Much depends on private investments: how much will this be forthcoming, especially from domestic sources? There are less risky options for domestic capital, not least in lending funds to the government;5
• The concept of clusters used in the Plan seems to be less one of clusters, than of economic enclaves with heavy investments by large companies.6 It remains to be seen how much such investments will have links to the rest of the economy, and especially to small enterprises;
• Poverty is to be relieved mainly by ‘trickle-down’ effects: this implies that some of the poor be prepared to migrate to where work is to be had, and that they are sufficiently healthy and skilled to be able to participate. With respect to these latter conditions, it is worrying to see that the social investments proposed are not fully funded; and,
• The sufficiency of the institutional reforms proposed. Even if some important reforms have been started, they have still to touch the more sensitive and difficult areas such as taxation and justice.
5 During 2000–04 the fiscal deficit ran at 10.5% on average, financed in part by internal borrowing. 6 There seems to have been confusion between economies of scale and those of agglomeration. Clusters work by allowing many relatively small enterprises that do not have economies of scale to take advantage of economies of agglomeration thanks to physical proximity and the development of close relations amongst them that that are better seen as networks rather than contracts.
Poverty Reduction Strategy Review- Country Case Nicaragua
35
3.2 Policies to address chronic poverty The category of chronically poor is not commonly recognised in Nicaragua. Instead the poverty data from the living standards surveys (EMNV) are reported in terms of poverty and extreme poverty. Although some of the chronically poor are also extremely poor ⎯ some 15% out of 27% in the 1998–2001 (see Table 2.3), the two categories are distinct. Since the category and term7 are not used, it is no surprise that there are no specific initiatives to address chronic poverty. Hence the following will look at policies to alleviate poverty, whether or not the focus is on all the poor, the extremely poor or those in chronic poverty.
The review is largely restricted to looking at the proposals of the PND-O since this remains the Poverty Reduction Strategy de facto, and since the new government has not yet published a draft of its plans.
The PND-O can be read as offering the following elements for poverty reduction:
• First and foremost, economic growth to create jobs and higher incomes. There are no great concessions to notions of making growth pro-poor: instead the emphasis is on achieving the highest rate of growth possible, in the belief that the faster the growth the more will trickle down in terms of jobs and business opportunities to the poor;
• Spending on public education and health, and reforms in these sectors. The Plan proposes a doubling of spending on education, and transferring the administration of schools to the municipalities with a view to making schools accountable to parents and the local citizenry. For health, there is a large budget ⎯ almost half as much larger than that for education ⎯ with more than half the funds destined to fight infant and maternal mortality, and most of the rest for extending the provision of services, with more decentralised administration; and,
• Social protection, above the expansion of programmes to provide transfers, nutrition and health services to under-fives living in poverty, and transfers and education to children aged 6 to 13 years living in poverty. These would appear to be an expansion of the Social Protection Network (RPS) described below.
The remainder of this chapter assesses these approaches to poverty reduction.
3.2.1 Economic growth
This is the more difficult aspect to assess. At least two major questions arise, namely: will the economic strategy deliver accelerated growth? And, will that growth help reduce poverty? The answers to these questions need to be compared against what might have happened had the economic approach been more focused on ensuring that growth immediately and
7 I have not seen ‘chronic poverty’ translated into Spanish. If it were it might be ‘pobreza persistente’ or something similar.
Poverty Reduction Strategy Review- Country Case Nicaragua
36
directly benefited the poor. These are not easy questions to answer, other than at a very general, and not particularly helpful, level. But an attempt must be made.
Can the strategy deliver growth? The economic history of Nicaragua over the last 40 or more years is remarkably uneven, see Figure 3.1. The country has seen times when the average GDP per person has been rising rapidly ⎯ as in the 1960s, to times of rapid decline ⎯ as in the late 1980s and early 1990s, to the current situation of slow growth. The dilemma faced by the last two administrations of Presidents Alemán, 1997–01, and Bolaños 2002–06, has been how to accelerate growth.
Figure 3.1: Nicaragua: Gross Domestic Product, 1960 to 2003
GDP (constant 2000 US$)GDP per capita (constant 2000 US$)
Source: World Development Indicators 2005, World Bank
The slow growth of the economy seems to be related to slow growth of productivity and of capital’s contribution, see World Bank 2004. The data on capital are odd: in recent years rates of capital formation are very high, 30% or more while savings rates are much lower at less than 10%. The difference does not seem to arise from large-scale inflows of investment funds: it may be related to large amounts of aid.
Whatever the reason, the pertinent question is, if liberal market policies pursued within a stable macro-economic framework ⎯ the conditions that have applied since 1994 or so ⎯ have not produced a faster rate of growth, what in the PRS is going to make a difference? Logically, there must be a missing element necessary for faster growth, even if it is not known. It is not clear that the PRS contains novel measures that might do the trick.
The exception to this might be rights to land. Currently the majority of farmers do not have a valid legal title to the land they work: but how much that prevents them from investing or accessing formal credit is a moot point.
Would such growth reduce poverty? Economic growth will cut income poverty, but the question is by how much and in what ways. The strategy would likely see a expansion of production in enterprises owned by the wealthy:
Poverty Reduction Strategy Review- Country Case Nicaragua
37
the main transmission to the poor would presumably be by the creation of unskilled jobs in those enterprises, and through secondary effects ⎯ as those with higher incomes spend their additional earnings on goods and services produced by the poor. I have not yet seen any formal assessment, based on empirical evidence ⎯ or any other evidence for that matter ⎯ of how strong those links might be.
It is easy for commentators to dismiss the extent to which job creation and links might help the poor. One could imagine that success in attracting foreign investors in export sectors such as cash crops, fisheries and forestry might see them bring in capital-intensive techniques that create few manual and unskilled jobs: but equally in a country with low wages, especially in rural areas, it would be illogical not to look for labour-intensive ways to produce. It is similarly anybody’s guess in the absence of evidence as to how much of any additional income generated, whether in the hands of the poor or not, would then be spent in ways that would create jobs and incomes for the poor.
Are there alternative roads to growth that cuts poverty? There are alternative economic strategies, above all those that would look to stimulate those enterprises in which the poor work either as owner-operators or as employees. The prime candidate is smallholder farming, given how many of the poor have access to some land ⎯ and how many could have if there were some modest attempt to increase such access.
Stimulating these enterprises would require not only investments in physical infrastructure ⎯ rural access roads, electricity supplies, etc., but also finding ways to overcome market failures, above all in access to loans; as well as to remedy deficiencies in literacy, numeracy and other basic capabilities and skills for those many amongst the poor who got little education ⎯ see Table 2.4. The agenda is challenging and raises some vexed questions, above all on how to provide access to financial services that is effective, economic and sustainable.
How much more impact this would have on poverty per unit of resources, and how feasible it might be given the capacity of the public agencies is largely a matter for conjecture.
A frustration is that many agencies, including numerous NGOs, are working on parts of this agenda on a small-scale in localised programmes ⎯ micro-credit projects, for example, abound. Few of these experiences are evaluated formally and rigorously: rarely are they documented on public record. There is, as far as I am aware, no formal or informal forum that allows systematic learning from these diverse experiences.
Programmes to stimulate production by the poor A 2001 review of development programmes (Government of Nicaragua 2001) was scathing about some of the projects that addressed low incomes and unemployment:
Of the 14 projects reviewed, three stand out both in terms of their total resources and scope for reform:
Poverty Reduction Strategy Review- Country Case Nicaragua
38
• Program for Agricultural Reactivation (Programa de Reactivacion Agroalimentaria). This program provides input and infrastructure support to 220,000 small and medium farmers in 91 municipalities. Activities include rehabilitation of rural roads, support to the marketing chain (rural markets, slaughterhouses and warehouses), small irrigation works, soil conservation, reforestation and training/technology transfer. Planned investments sum to $10 million per year over the next 3 years. The program data base presents no information about targeting methods, application of entry and exit criteria for beneficiaries, nor any measurement of program results.
• Program for Development Poles (KRII-Polos de Desarrollo ). This program includes planned investments of $6.4 million per year over the coming five years, for the delivery of machinery and equipment to agricultural cooperatives, which in turn would sell machinery services to their affiliates. The program data base has no information regarding entry and exit criteria for beneficiaries, nor information about the nature of the market failure that might justify a program that competes with private initiative.
• Program for the Repopulation and Genetic Improvement of Cattle Herds (Programa de Repoblamiento y Mejoramiento Genetico de la Ganaderia ). This program will invest $8.5 million over the next three years to deliver 10-25 heifers and a bull as a loan in kind to each beneficiary. The herd is to be lent for a period of 5 years, and the beneficiary is to pay with half of the calves born during that period. Although the program has national coverage, the program data base identifies no explicit system for beneficiary selection. In 1999, the program benefited 1073 farmers, with a mean transfer value of $6937. Given the magnitude of the transfer, the program is most likely to serve medium scale farmers: it is beyond the management capacities of the poor, and program benefits are attractive for capture by the non poor.
Only one program out of the 14 was identified as appropriately addressing the risk at hand for poor families – Municipal markets (Mercados Municipales). This project ($1.3 million in 2000) targets poor municipalities and provides a public good for these municipalities to improve the marketing chain for local products.
Thus we typically see programmes that offer benefits that exceed the absorption capacity of many of the poor ⎯ four programmes offered benefits of US$1,000 per household or more; inadequately targeted, with no exit strategy: an open invitation to elite capture. Coverage seems to run at most to 50k persons where 360k are needy. In most cases, there was no monitoring of programmes, little was known on impacts.
The review commented:
The projects in this sample appear to be the result of an accumulation of partial solutions to observed problems, without benefit of a broader analysis of the needs of the specific vulnerabilities of rural households, and the most cost effective mechanisms to address them.
Poverty Reduction Strategy Review- Country Case Nicaragua
39
One could add that in all three of these featured cases ⎯ as well as many other rural development programmes ⎯ the response to the lack of capital and assets amongst the poor is to provide investment goods directly to a fortunate few. This, unfortunately, fits only too well with the politics of patronage.
In a rather unsatisfactory conclusion, the road to growth that creates jobs and incomes for the poor to any substantial degree is not clear in the specific circumstances of Nicaragua. We lack the evidence that would support a more informed programming, and we have not learned enough about what works and fails from the many initiatives that have been tried over the last two or three decades.
3.2.2 Investing in people
Since the state is the main supplier of education, health and nutrition services; and since there is a stronger consensus on the basic ingredients that should be on offer to citizens, it is easier to assess public efforts in this area.
The 2001 review is highly instructive in its review of programmes in this area, systematically comparing the needs set out in Table 2.8 to the content of the initiatives reviewed.
The major failing noted was that there was so little attention to pre-school children, and above all to those aged 6 to 24 months, the most vulnerable of all. There are efforts to remedy this, but they are still on a small scale. One well-known response is a conditional cash transfer programme, the Social Protection Network (RPS) ⎯ see Box 3.1.
Funds for education were skewed towards buildings, and away from recurrent costs. This was also seen in health provision: apparently part of a pathology of over-investment seen in Nicaragua.8
Otherwise in education the focus seen in the poverty reduction strategy was towards creating facilities and extending coverage, with little attention to the demand for schooling. The review cites 300k poor children and youth of school age not attending, of whom 130k report cost as the obstacle. Put otherwise, amongst the extremely poor in 1998, one third of those aged 7 to 12 were not attending, and two-thirds of those aged 13 to 18 years were absent from school (Regalia 2000). The RPS to its credit confronts the demand side head on.
8 The same phenomenon was seen in the 1980s under the Sandinista government where in the first few years of the government the ready availability of funds from sympathetic governments led to over-investment in new ventures that far outstripped the ability of the state to cover operating costs.
Poverty Reduction Strategy Review- Country Case Nicaragua
40
In general, while sheer physical access to facilities is an obstacle for some of the poor, especially in remote areas; the more important issues lie with demand for services ⎯ the poor often being dissuaded from using what is on offer since there are significant costs involved, and the quality of the services, especially in the more remote areas.
Matters are better in health than education (World Bank 2004). It is probably no coincidence that Nicaragua has very poor indicators of education compared to countries of similar economic development, but health indices that are better than might be expected ⎯ and which have improved in the last fifteen or so years.
Box 3.1 Social Protection Network (RPS ⎯ Red de Protección Social)
The RPS began as a pilot in 2000 with Inter-American Bank Funding. It is a conditional cash transfer programme, modelled very much on the experience of Oportunidades/Progresa in Mexico. As Maluccio & Flores (2005) report
… several Latin American countries have introduced conditional cash transfer programs that integrate investment in human capital with access to a social safety net. The primary objective of these programs is to generate a sustained decrease in poverty in some of the most disadvantaged areas. And their basic premise is that a major cause of the intergenerational transmission of poverty is the inability of poor households to invest in the human capital of their children.
RPS provides cash transfers for up to 3 years to households, with payments made to mothers or the person caring for the children, on condition that young children attend clinics regularly to monitor their growth and health, and that children of school age attend school. Table 3.1 outlines the main benefits provided. The programme is posited on poor families not being willing to use health and education services on offer, in large part owing to direct costs ⎯ schooling may be free, but uniforms, exercise books and the like are not ⎯ and opportunity costs of child labour. Hence the payments to the poor households to alter the calculus and make it worthwhile to use the services.
Table 3.1 Nicaraguan RPS eligibility and benefits in Phase I
Eligibility Food security, health, and nutrition
Education
Geographic targeting
All households All households with children ages 7–13 who have not yet completed fourth grade of primary school
Demand-side benefits Monetary transfers
Bono alimentario (food security transfer) C$2,880 per household per year (US$224)
Bono escolar (school attendance transfer) C$1,440 per household per year (US$112) Mochila escolar (school supplies
Poverty Reduction Strategy Review- Country Case Nicaragua
41
transfer) C$275 per child beginning of school year (US$21)
Supply-side benefits Services provided and monetary transfers
Health education workshops every 2 months Child growth and monitoring Monthly: Newborn to 2-year-olds; Every 2 months: 2- to 5-year-olds Provision of antiparasite medicine, vitamins, and iron supplements Vaccinations (newborn to 5-year-olds)
Bono a la oferta (teacher transfer) C$80 per child per year given to teacher/school (US$6)
Source: Table 2.1, Maluccio & Flores 2005
The programme is not entirely focused on household demand: it has been necessary to provide additional funds to schools and health posts.
The RPS targets the poorest. In the pilot phases most of the targeting was geographic. Targeting began by selecting Madriz and Matagalpa Departments, on the grounds that they had high incidence of poverty ⎯ 80% of population poor, c 50% extremely so,9 had reasonable coverage of health and education facilities, and were readily accessible. Of the 20 municipalities in the two Departments, all six that had participated in the MPP planning described above in conjunction with FISE were selected.10 These 6 were not necessarily the very poorest, but rates of poverty in their rural areas were well above national rates. Within these municipalities, 42 census comarcas ⎯ units of 100 households ⎯ were adopted as high priority, on the basis of an index of poverty composed of family size, access to piped water and latrines, and illiteracy.
Although the original idea was universal coverage, it was then decided to exclude some clearly well-off households ⎯ about 6% ⎯ since they had clear signs of wealth. Overall leakage to non-poor was probably no more than 15% of households, with perhaps 5% excluded who should have been included. Quite good, but:
Despite these (quantitative) findings that the program was well targeted, there was substantial confusion at the local level about the beneficiary selection process (Adato & Roopnaraine 2004), raising the possibility of community tension as the result of excluding some families. (Maluccio & Flores 2005)
From the outset, a determined attempt to assess the impact of the programme was made, with IFPRI contracted to evaluate the RPS. Their evaluation,11 published in 2005, was highly positive, the main points being:
Poverty Reduction Strategy Review- Country Case Nicaragua
42
• RPS had positive effects across the board, with effects often higher for the extremely poor, so reducing inequality;
• Total spending per capita in client households was up by 18%, and most spent on food, with some increase in education spending as well. The increase in spending on food was worth US$50 per capita a year;
• School enrolment up by 13% points overall, and by 20% points on current attendance of the target groups. The number of children aged 7–13 working fell by 5.6% points;
• Average increase of 16% points in participation of under-three’s in VPCD, a health care programme. Also participation of 3–5 year-olds rose. Effects amongst poor households were higher;
• Vaccination rates rose 30% points in intervention and control areas at a time when they were falling in other rural areas; and,
• Nutrition gains: 5.5% points fall in stunting, more than 1.7 times faster than the national rate of improvement 1998 for 2001. But despite distributing iron supplements, no fall in rates of anaemia or rise in haemoglobin levels.
Compliance with conditions was good: about 10% of clients were penalised at some stage for failure, but only 1% were expelled for repeated failures or lying.
The RPS pilot was implemented at a time when there was an economic downturn as coffee prices fell hitting Madriz and Matagalpa hard since coffee was one of main activities in the areas. The RPS seems to have acted as a safety net to offset the impact of the downturn.
Given such a good report, the RPS was expanded in 2002 with double the original budget. In Phase II a few additions and changes were made:
• Health care was spread to additional households members, including pre-natal services for pregnant, vaccinations for 6–8 year olds, preventive health care for adolescents and all women over 20 years;
• The supply-side of the programme was lengthened to five years, rather than the three previously;
• Transfer size reduced by one third to save funds; and,
• Implementation was switched from FISE to the Ministry for Families (MiFamilia).
So far, so good. One the main questions is whether such a programme is affordable.
Poverty Reduction Strategy Review- Country Case Nicaragua
43
Both Regalia (2000) and Vermehren (2002) are sanguine. A pure transfers programme, designed to bring all the extremely poor up the cut-off with moderate poverty, might cost US$50M a year plus another 15–20% for administration ⎯ around 2.2% of GDP. A schools programme for the very poor, that paid around US$55 a year to keep children at school ⎯ their opportunity cost in child labour ⎯ would cost another US$46M.
These numbers look high, but they can be compared to some 41 programmes that cost in all some US$100M a year, but which Regalia considers poorly targeted and ineffective. Vermehren reckons that extending coverage to all the extremely poor households in Nicaragua would cost no more one third of current spending on social safety nets, and since that since several of these lacked focus or evidence of success,12 there was ample scope to switch funding to the RPS.
4 Outcomes and experiences As section 2 shows, the overall outcome is clear: since 1993 there has been little progress in reducing poverty. And there are no signs that things are picking up: with next to no improvement in poverty visible since 1998, one can only conclude that it is unlikely that progress will be made unless something changes.
It would be unfair to blame public policy and action for all of this: external events can derail the best efforts, and in a market-based economy there is much that it is difficult for public action to change ⎯ at least in the short term. Are there, then, any mitigating factors that might explain failure to reduce poverty?
Candidates include the effects of 1998’s Hurricane Mitch that presumably would have had a greater proportionate impact on the assets of poor people than rich ⎯ the poor tend to have flimsier housing, or live in areas more prone to flooding and landslides. The price of coffee, one of the few export crops commonly grown by smallholders, plummeted from a high in 1998 of almost US$5,000 a tonne to reach US$1,150 by 2002 ⎯ see Figure 4.1. Could this explain things? But, according to Deininger et al. (2003) only 4% of agricultural producers produced coffee in 1998. Even accounting for those linked to these farms as agricultural labourers in the coffee harvests, or in processing and transport, it is hard to imagine the impact could have been quite so profound. Moreover, in the seven years between the 1998 and 2005 surveys, some of those hit hard would have found other ways to make a living.
There may be some mitigating circumstances, but then again there have been forces pushing in the other direction: since 1998 the economy has grown, albeit weakly, there has
Poverty Reduction Strategy Review- Country Case Nicaragua
44
been increasing emigration and a corresponding rise in remittances, and substantial debt relief was granted under HIPC II in 2004.
To cap it all, since 2001 there has been a Poverty Reduction Strategy in place: by 2005 some of the additional efforts to reduce poverty should have paid off. All things considered, it is hard to avoid the conclusion that too many public programmes have been ineffective in translating public spending ⎯ and a slowly rising average output per capita ⎯ into poverty reduction. So what do we know about public programmes and their shortcomings?
Figure 4.1: Nicaragua, prices of export crops, 1961 to 2004
Source: FAOSTAT data on export earnings in constant US$ (2000) divided by volume to derive a unit price Note: Vertical scale is logged to allow several products to be seen on the same chart. The actual movements in prices are thus greater than they appear.
4.1 Public programmes: the weaknesses The 2001 Review (Government of Nicaragua 2001), that covered a wide range of sectors, draws attention to several generic problems that affect many of the 79 programmes reviewed.
First, in some cases the benefits delivered to participants in the programmes were out of all proportion to what the state can afford and what the poor could absorb. Housing programmes gave some people US$2k, a resettlement programme cost US$27k per beneficiary family, and others delivered no less than 25 cattle. With benefits on this scale, coverage was necessarily small. Worse, the incentive for local elites to capture the benefits was high, a problem excerbated by inadequate targeting of programmes to the poor, the next point.
Second, targeting was weak, with a marked preference for simple geographical targeting that leaves programmes prey to local elites:
Poverty Reduction Strategy Review- Country Case Nicaragua
45
Most projects revealed shortcomings in the identification, characterization and quantification of potential beneficiaries to be targeted. Projects with easily identifiable beneficiaries, such as those serving the immediate victims of Hurricane Mitch, or those combining use of the poverty map with personal or household characteristics (young children, children of school age, houses with dirt floors), are more likely to reach their intended beneficiaries. Among programs that lack criteria to verify beneficiary eligibility (some rural development and housing programs), or exit criteria to terminate benefits (food distribution programs, food for work, temporary employment programs), significant leakage of benefits is most probable. (Government of Nicaragua 2001)
How bad can targeting be? According to Regalia writing in 2000, there were no less than 41 different food programmes in operation, costing fully US$100M a year ⎯ remember Nicaragua had less than 5M inhabitants at the time ⎯ but very badly targeted:
Only 3.05% of households received food aid since 1993; 37% of the beneficiary households belonged to the bottom quintile, and 20% to the second quintile of the consumption distribution in 1998, while 28% were among the top two quintiles. (Regalia 2000)
Third, closely related to targeting is a problem of analysis. The PRS made much use of poverty maps based on the LSMS. The approach taken by the 2001 review, that looks at individual as well as household risks, reminds us of the weaknesses of insights based on household surveys. Although not inevitable, household surveys tend to focus attention on households, rather than groups defined by age and sex. It is thus not so surprising that pre-school children have not had the priority that they deserve given the risks they face, and given that we know that a poor start in life does so much to transmit poverty from one generation to the next.
Fourth, efficiency was impaired by the proliferation of programmes that duplicated and overlapped each other’s efforts.
…the programs include 8 different models of primary health care, 3 programs provide identical school backpacks, 5 programs construct school infrastructure, 3 programs deliver teacher training, and the rural development programs employ 13 different approaches … (Government of Nicaragua 2001)
In similar vein, Regalia (2000) notes:
In Nicaragua there is no real social protection system in place. There is a plethora of programs, financed by different sources: Government, FISE, NGOs, and international donors. Programs often overlap, are poorly coordinated, lack adequate supervision and are poorly targeted. As result they do not fully realize their potential impact. …
The different projects often conferred different benefits in type and degree, so that in implementation there was no consistent policy. Resources were thus wasted, and there was little attempt to compare the different models used to find the most effective and economical;
Poverty Reduction Strategy Review- Country Case Nicaragua
46
Fifth, the penchant for investing in new facilities was rampant. Why so? Part of the answer is surely the familiar desire of politicians ⎯ public officials and donors as well ⎯ to leave tangible monuments to their efforts in clear view of the electorate. This instinct is exacerbated when populism and patronage are common features of the political system. Another element, paradoxically, is competence: the government is quite good at putting up new schools and has an agency skilled in this, the Social Emergency Fund (FISE) ⎯ see Box 4.1. And part of the blame lies with the donors who so often will fund what they see as capital investments, but not provide operating funds. Hence we arrive at the following nonsense: why repair a school with the ministry budget, if you can get a donor to fund a new one?
… the GON has little incentive to maintain current infrastructure, rather than to use those funds as counterpart funds for new loans. Each dollar diverted away from maintenance can be leveraged to bring in nine new dollars of infrastructure loans. So instead of maintaining infrastructure, there is an incentive to rebuild it instead — FISE has received requests to rebuild schools that they rebuilt six years ago. (Government of Nicaragua 2001)
Box 4.1: Emergency Social Investment Fund (FISE ⎯ Fondo de Inversión Social de Emergencia)
Set up in 1990 with the backing of USAID,13 FISE was designed to offset any harm to the poor caused by structural adjustment. Strong measures were taken in the early 1990s to counter the hyper-inflation of the late 1980s, to divest state enterprises, and to reduce public spending. These took place at a time when thousands of combatants were demobilised and looking for work.
In the beginning FISE mainly created temporary jobs for demobilised soldiers and retrenched state employees repairing physical infrastructure, an important task following the neglect during the strife of the late 1980s. But after 1992 it focusef on social infrastructure and became effective in building and repairing schools.
In the mid 1990s concerns were raised about maintenance that forced a move towards setting up funds to maintain the works with user committees playing a prominent role. It also spurred grass roots planning through Participatory Micro-Planning (Micro Planificación Participativa ⎯ MPP), as municipalities drew up 3-year investment plans, moves linked to decentralisation. FISE itself became more decentralised in its management. These changes took time to feed through,
Poverty Reduction Strategy Review- Country Case Nicaragua
47
interrupted by the 1996 elections and the need to cope with the 1998 Hurricane Mitch that devastated the country. But by mid 2000 60 out of 150 municipios had prepared their own plans using MPP ⎯ with FISE expected to fund about 24% of the costs. In this way FISE moved from being a school builder ⎯ by 1996 most of the old schools had been repaired ⎯ to a capacity builder with local government.
More recently FISE has been an implementing agency for the Social Protection Network (RPS) described in Box 3.1.
FISE has a reputation as a professional and effective body. An independent state agency, it sets its own pay scales, offering roughly double the levels of central government, more than most NGOs, and on a par with the best the private sector offers. In June 2000 it employed 210 persons, including 140 professionals. Staffing has been remarkably stable: the first president served from inception to January 2002.
But there are questions about how much employment it has generated: from the data in the LSMS surveys it seems that less than 0.2% of the population benefited from FISE jobs between 1993 and 1998 (Regalia 2000).
Questions surround the role of FISE. It was meant to be temporary to deal with a crisis expected to be short term. But given the slow rate of growth of the Nicaraguan economy in the 1990s and early 2000s, and the corresponding failure to reduce poverty more than marginally, the need for emergency assistance has persisted. Besides, in a country where so many government agencies have limited capacity and at best perform modestly, who would close down one agency that is capable and has a track record of getting things done?
A possible role for FISE is that of a public sector implementing body, leaving ministries to plan and regulate. But since the late 1990s FISE has been planning its own programme, using a combination of targeting through the poverty maps based in LSMS data, and through local level planning with the municipalities. There is the danger that when it comes to planning health and education facilities, the criteria used by FISE are inadequate ⎯ as applies, for example when health planning does not consider epidemiology.
It has also been effective in providing support for the local authorities: indeed, FISE funds can represent one third to one half of the municipal budgets. But there also other agencies charged with developing local capacity: Dijkstra (2004) notes no less than seven donor programmes in this field.
Source: Most of the information in this section is taken from Dijkstra 2004.
Poverty Reduction Strategy Review- Country Case Nicaragua
48
Sixth, there is a chronic tendency towards short-term policies and projects that lack continuity. In part this arises from the political system in which every five years there is a new administration led by a president who despite party affiliation is seen very much as the leader who has to put their personal stamp on government. Hence much of what the previous government did is jettisoned in favour of a set of new initiatives that bear the personal imprint of the president and ministers.
Seventh, and perhaps most damaging of all, the review noted that monitoring and evaluation was ‘extremely weak’. On social protection programmes Regalia (2000) comments:
Unfortunately for most of these programs evaluation systems are not in place. This is the main reason why the tendency is toward adding new programs rather than eliminating older ones, given that their efficacy can hardly be assessed.
Information is not usually collected and even when it is, it is often not shared with other agencies or the public. The consequences are that there is little accountability of agencies and officials to citizens, and above all there is little learning taking place. As mentioned before, this is a crying shame: the one advantage of the plethora of initiatives funded variously by government, donors and NGOs is that there is no lack of different experiences from which to learn.
In addition to these points it is easy to add a familiar litany of shortcomings in the public administration: inadequate organisation of public agencies and too little co-ordination between them, lack of transparency in decision-making, politicisation of budget allocations and senior appointments, and too little participation by citizens and civil society in planning ⎯ see, for example, Báez Lacayo 2006.
5 Conclusion In brief, it seems the policies, projects and programmes of the public sector are having little impact on poverty.
Is this, at base, just a problem of resources? As in any developing country, resources are scarce, but for Nicaragua the problem is not acute. The government spends around 15 to 17% of GDP (2000 to 2003): not a huge amount, but not that small either for a developing country. Aid receipts are large, an average of over US$700M a year 2000–03. If all the aid funds were spent on the 46% of the population of 5.1M (2005) living in poverty, there would almost US$300 a person to spend ⎯ or around US$1,500 for a household of five persons. Given that most of the poor have some income, an additional US$300 would take the great majority of them above the dollar-a-day poverty line.
Consequently a large part of the problem has to be ineffective public policy and programmes, set within a context of an economy that grows too slowly to generate jobs and incomes sufficient to offer substantial improvements to the work force in anything less than the long term.
Poverty Reduction Strategy Review- Country Case Nicaragua
49
The inescapable conclusion is that the poverty reduction strategies of Nicaragua have made little or no difference to poverty. Why not?
For some the answers lie in the failure to adopt more radical approaches: in a country of marked inequality, little has been done to redistribute assets or incomes. Nicaragua has faithfully or slavishly, depending on your point of view, pursued economic liberalisation as recommended by the Bank and the Fund. For the critics, liberalisation was only ever going to allow the rich to prosper, and often at the expense of the poor.
Such critiques may explain the failure of the economy to grow faster, or to transform the lives of the poor. But that is not exactly what we have to explain here: we are concerned not with transformation, but with why even modest improvements of the lives of the poor have not been achieved. Surely, even against an unpromising context, it should have been possible to cut the 1998 incidence of poverty of 48% by something more than the statistically insignificant margin of 1.6 percentage points by 2005?
An alternative hypothesis would attribute at least part of the blame on the ineffective use of the resources assigned to poverty programmes since the first PRS was formulated in 2001. The failings set out in the previous section are all plausible explanations for failure, especially if most or all of the concerns and criticisms are warranted: in combination the flaws, however minor some may be, would become substantial and surely sufficient to explain the lack of impact. If so, the implications are clear: correct the failings.
This is hardly novel advice: in countries so heavily dependent on foreign aid as Nicaragua the shelves of public offices are stacked with reports by consultants both national and international setting out remedial measures that indisputably would make a difference were they implemented. In many cases, the reports have indeed become the basis of funded programmes to carry out the corrections indicated. In 2006, for example, Fajardo (2006) listed no less than seven different programmes, funded by four donors, to improve the system of public sector finances.
Is it possible to distil the many words of good advice on how to make public efforts to reduce poverty in Nicaragua more effective? Here is an attempt, just three points, thus:
1 Learn from experience. Nicaragua is a veritable laboratory of projects to reduce poverty: there must be the opportunity to learn from this. Officials in charge of programmes sometimes do not even know about similar experiences in other parts of the country, especially when implemented by another agency.14 One attraction of learning is that it should be possible to identify successes that inspire: a useful antidote to the consultancy missions that usually diagnose problems and weaknesses creating the impression that failure is the norm.
2 Learning is a pre-condition to the next lesson: be prepared for something longer than the short haul. Few success stories in development are overnight transformations: most are the result of sustained efforts, often with considerable
Poverty Reduction Strategy Review- Country Case Nicaragua
50
adaptation to initial ideas before the programme works well. Government, donors and NGOs need to stick with their programmes longer. But there is no point in persisting with bad ideas. Hence we need the learning to understand better what is worth keeping, what can be improved, and what needs to be replaced. Learning, by the way, would go part of the way to correct short-termism. In the absence of evidence of success, the temptation to pour energies and resources into new initiatives is great. If, on the other hand, a programme generates regular updates on progress,15 then there is something to engage the imagination of decision-makers without rushing into new initiatives.
3 Simplicity and clarity of strategy and policy. Sometimes it is argued that the reason for so many different overlapping, duplicating, and competing initiatives in the same sector lies with ill-defined policy that means that each agency with funds has to define its own policies. The same problem surely contributes to the rapid turn-over of projects. Not all policy can be made simple, but in each sector there are central principles that can be set. How can we ensure that policies are not simple-but-wrong? We are back to the principle of learning again.
Poverty Reduction Strategy Review- Country Case Nicaragua
51
6 References Báez Lacayo, Linda, 2006, Nicaragua: Análisis Institucional del Sector Rural No Agropecuario, Informe (Borrador Final), Octubre 2006
Corral, Leonardo & Tom Reardon, 2001, ‘Rural nonfarm incomes in Nicaragua’, World Development, 29 (3), 427–442
Davis, Benjamin & Marco Stampini, 2002, ‘Pathways towards prosperity in rural Nicaragua; or why households drop in and out of poverty, and some policy suggestions on how to keep them out’, Paper, Nov 2002
Deininger, Klaus, Eduardo Zegarra & Isabel Lavadenz, 2003, ‘Determinants and impacts of rural land market activity: evidence from Nicaragua’, World Development, 31 (8), 1385–1404
Dijkstra, A. Geske, 2004, ‘Governance for sustainable poverty reduction: the Social Fund in Nicaragua’, Public Administration & Development, 24, 197–211
Enríquez, Laura J., 2000, ‘The varying impact of structural adjustment on Nicaragua’s small farmers’, European Review of Latin American and Caribbean Studies, 69, 47–68
Fajardo U, Raúl, 2006, ‘Evaluación de la gestión financiera pública del Prorural’, Informe al ASDI, Mayo 2006
Government of Nicaragua. Technical Secretariat of the Presidency (SETEC), 2001, A review of selected poverty programs of Nicaragua’s Poverty Reduction Strategy Portfolio, Managua, May 2001
Instituto Nacional de Estadísticas y Censos (INEC), 2006, Principales Resultados. Indicadores Básicos de Pobreza. Encuesta de Medición de Nivel de Vida 2005, 12 Dic. 2005, Managua
Lacayo, Carlos, 2006, Red de Protección Social, Nicaragua, Policy Brief 3, Inter-Regional Inequality Facility, Overseas Development Institute, London
Nigenda, Gustavo & Luz María González-Robledo, 2005, ‘Lessons offered by Latin American cash transfer programmes, Mexico’s Oportunidades and Nicaragua’s SPN. Implications for African countries’, DFID Health Systems Resource Centre
Regalia, Ferdinando, 2000, ‘An Assessment of Poverty and Safety Nets in Nicaragua’, Report for the Inter-American Development Bank, May 17, 2000
Poverty Reduction Strategy Review- Country Case Nicaragua
52
Vermehren, Andrea, 2002, ‘Nicaragua Social Investment Fund. Conditional cash transfers a new avenue for social funds?’, Social Funds Innovation Update, 2 (2), 02 Feb 2002, World Bank
World Bank, 2003, ‘Nicaragua poverty assessment. Raising welfare and reducing vulnerability’, Report No. 26128-NI, December 23, 2003, Central America Department, Latin America and the Caribbean Region, World Bank, Washington DC
World Bank, 2004, ‘Nicaragua Development Policy Review. Sustaining broad-based growth’ Report 29115–NI, World Bank, Washington DC, December 2004
World Bank, 2005, ‘Drivers of Sustainable Rural Growth and Poverty Reduction in Central America: Nicaragua Country Case Study’, Gray Cover Report No. 31193-NI, Washington, D.C..