22

BACT FOR CARBON CAPTURE AND SEQUESTRATION
FPC TX addresses the potential to capture GHG emissions that are emitted from Carbon
Capture and Sequestration (CCS) candidate sources associated with the 2012 Expansion
Project listed below (plant names in parenthesis):
14 cracking furnaces (Olefins Expansion)
4 PDH Reactors (Olefins Expansion)
4 steam boilers (Olefins Expansion)
2 combined cycle gas-fired turbines (Gas Turbines)
2 regenerative thermal oxidizers (LDPE)
The EPA five step top down BACT evaluation for this potential control technology options is
provided in this Appendix. As shown in that analysis, CCS is not only not commercially
available, not technically feasible but also economically unreasonable. Therefore, it is not
included as a BACT option for any of the emissions sources associated with the 2012
Expansion Project.
STEP 1: IDENTIFY ALL AVAILABLE CONTROL TECHNOLOGIES 6.1.1
The emerging carbon capture and sequestration (CCS) technologies generally consist of
processes that separate CO2 from combustion or process flue gas (capture component), the
compression and transport component, and then injection into geologic formations such as oil
and gas reservoirs, unmineable coal seams, and underground saline formations (sequestration
component). These three components of CCS are addressed separately below:
Carbon Capture:
Of the emerging CO2 capture technologies that have been identified, only amine absorption is
currently commercially used for state-of-the-art CO2 separation processes. The U.S.
Department of Energy’s National Energy Technology Laboratory (DOE-NETL) provides the
following brief description of state-of-the-art post-combustion CO2 capture technology and
related implementation challenges. Although the DOE-NETL discussions focus on CCS
application at combustion units in electrical generation service, elements of this discussion are
applicable when discussing the application of CCS to sources in the chemical manufacturing
industry. The following excerpts from DOE-NETL Information Portal illustrate some of the many
challenges, but not all, that are present in applying available CO2 Capture technologies at
combustion and process sources located at chemical manufacturing plants.
…In the future, emerging R&D will provide numerous cost-effective technologies for
capturing CO2 from power plants. At present, however, state-of-the-art technologies for
existing power plants are essentially limited to amine absorbents. Such amines are used
extensively in the petroleum refining and natural gas processing industries… Amine solvents
are effective at absorbing CO2 from power plant exhaust streams—about 90 percent
removal—but the highly energy-intensive process of regenerating the solvents decreases
plant electricity output…1
In its CCS information portal, the DOE-NETL adds:
…Separating CO2 from flue gas streams is challenging for several reasons:
CO2 is present at dilute concentrations (13-15 volume percent in coal-fired systems
and 3-4 volume percent in gas-fired turbines) and at low pressure (15-25 pounds per
square inch absolute [psia]), which dictates that a high volume of gas be treated.
Trace impurities (particulate matter, sulfur dioxide, nitrogen oxides) in the flue gas
can degrade sorbents and reduce the effectiveness of certain CO2 capture
processes.
It should be noted that the majority of the candidate CCS source vent streams (previously listed
in this section) are dilute in CO2 concentration and contain impurities such as PM, NOX and SO2,
thus increasing the challenge of CO2 separation for the Point Comfort expansion project.
1 DOE-NETL, Carbon Sequestration: FAQ Information Portal,
http://extsearch1.netl.doe.gov/search?q=cache:e0yvzjAh22cJ:www.netl.doe.gov/technologies/carbon_seq/FAQs/tech-status.html+emerging+R%26D&access=p&output=xml_no_dtd&ie=UTF-8&client=default_frontend&site=default_collection&proxystylesheet=default_frontend&oe=ISO-8859-1 (last visited July 26, 2012).
Compression and Transport:
The compression aspect of this component of CCS will represent a significant cost and
additional environmental impact because of the energy required to provide the amount of
compression needed. This is supported by DOE-NETL who states that:
Compressing captured or separated CO2 from atmospheric pressure to pipeline
pressure (about 2,000 psia) represents a large auxiliary power load on the overall
plant system…2
If CO2 capture and compression can be achieved at a process or combustion source, it would
need to be routed to a geologic formation capable of long-term storage (sequestration). The
long-term storage potential for a formation is a function of the volumetric capacity of a geologic
formation and CO2 trapping mechanisms within the formation, including dissolution in brine,
reactions with minerals to form solid carbonates, and/or adsorption in porous rock. The DOE-
NETL describes the geologic formations that could potentially serve as CO2 storage sites and
their associated technical challenges as follows:
Geologic carbon dioxide (CO2) storage involves the injection of supercritical CO2 into
deep geologic formations (injection zones) overlain by competent sealing formations and
geologic traps that will prevent the CO2 from escaping. Current research and field
studies are focused on developing better understanding of 11 major types of geologic
storage reservoir classes, each having their own unique opportunities and challenges.
Understanding these different storage classes provides insight into how the systems
influence fluids flow within these systems today, and how CO2 in geologic storage would
be anticipated to flow in the future. The different storage formation classes include:
deltaic, coal/shale, fluvial, alluvial, strandplain, turbidite, eolian, lacustrine, clastic shelf,
carbonate shallow shelf, and reef. Basaltic interflow zones are also being considered as
potential reservoirs. These storage reservoirs contain fluids that may include natural
gas, oil, or saline water; any of which may impact CO2 storage differently…3
2 Id. 3 DOE-NETL, Carbon Sequestration: Geologic Storage Focus Area,
http://www.netl.doe.gov/technologies/carbon_seq/corerd/storage.html (last visited July 26, 2012)
Therefore, as can be seen from the DOE-NETL Information Portal, CCS as a whole cannot be
considered a commercial available, technically feasible option for the combustion and process
vent emissions sources under review in the FPC TX proposed expansion. FPC TX’s expansion
project generates flue gas streams that contain CO2 in dilute concentrations and the project is
not located in an acceptable geological storage location. Even so, FPC TX provides even
further and more detailed evaluation to address all 5 steps of the EPA BACT analysis.
STEP 2: ELIMINATE TECHNICALLY INFEASIBLE OPTIONS 6.1.2
Although, as described above, CCS should not be considered an available control technology,
in this section, FPC-TX addresses, in more detail, the potential feasibility of implementing CCS
technology as BACT for GHG emissions from the proposed expansion project GHG emission
sources. The feasibility issues are different for each component of CCS technology (i.e.,
capture; compression and transport; and storage). Therefore, technical feasibility of each
component is addressed separately below.
6.1.2.1 CO2 Capture
Though amine absorption technology for CO2 capture has routinely been applied to processes
in the petroleum refining and natural gas processing industries it has not been applied to
process vents at chemical manufacturing plants.
The Obama Administration’s Interagency Task Force on Carbon Capture and Storage, in its
recently completed report on the current status of development of CCS systems for power
plants, states that carbon capture could be used on combustion units. However, the following
discussion on carbon capture technology availability for high volume vent streams and large
combustion unit shows that carbon capture is not commercially available for application.
Large commercial applications, such as the expansion project sources, present even more
difficult application of carbon capture, in part, due to the additional variability in flow volumes as
typically experienced in chemical plants. Therefore, the discussion related to power plants also
shows that of CO2 capture for chemical process combustion and process vent stream are not
commercially available.
Current technologies could be used to capture CO2 from new and existing fossil energy
power plants; however, they are not ready for widespread implementation primarily because
they have not been demonstrated at the scale necessary to establish confidence for power
plant application. Since the CO2 capture capacities used in current industrial processes are
generally much smaller than the capacity required for the purposes of GHG emissions
mitigation at a typical power plant, there is considerable uncertainty associated with
capacities at volumes necessary for commercial deployment.4
In its current CCS research program plans (which focus on power plant application), the DOE-
NETL confirms that commercial CO2 capture technology for large-scale combustion units (e.g.,
power plants) is not yet available and suggests that it may not be available until at least 2020:
The overall objective of the Carbon Sequestration Program is to develop and advance
CCS technologies that will be ready for widespread commercial deployment by 2020.
To accomplish widespread deployment, four program goals have been established:
(1) Develop technologies that can separate, capture, transport, and store CO2 using
either direct or indirect systems that result in a less than 10 percent increase in the
cost of energy by 2015;
(2) Develop technologies that will support industries’ ability to predict CO2 storage
capacity in geologic formations to within ±30 percent by 2015;
(3) Develop technologies to demonstrate that 99 percent of injected CO2 remains in
the injection zones by 2015;
(4) Complete Best Practices Manuals (BPMs) for site selection, characterization, site
operations, and closure practices by 2020. Only by accomplishing these goals will
CCS technologies be ready for safe, effective commercial deployment both
domestically and abroad beginning in 2020 and through the next several decades.5A
To corroborate that commercial availability of CO2 capture technology for large-scale
combustion (power plant) projects will not occur for several more years, Alstom, one of the
major developers of commercial CO2 capture technology using post-combustion amine
4 Report of the Interagency Task Force on Carbon Capture and Storage at 50 (Aug. 2010). 5 DOE-NETL, Carbon Sequestration Program: Technical Program Plan, at 10 (Feb. 2011).

absorption, post-combustion chilled ammonia absorption, and oxy-combustion, states on its web
site that its CO2 capture technology will become commercially available in 2015.6 However, it
should be noted that in committing to this timeframe, the company does not indicate whether
such technology will be available for CO2 emissions generated from chemical plant sources, like
those included in the Point Comfort expansion project.
6.1.2.2 CO2 Compression and Transport
Notwithstanding the fact that the above discussion demonstrates that the carbon capture
component of CCS is not commercial available for chemical plant combustion and process
vents, FPC TX provides the following discussion concerning technical feasibility. This
discussion further supports that the compression and transport component of CCS may be
technically feasible but, as explained later, the cost evaluation shows that it is not economically
reasonable. Therefore, CCS is not BACT for the 2012 Expansion Project.
Even if it is assumed that CO2 capture could feasibly be achieved for the proposed project, the
high-volume CO2 stream generated would need to be compressed and transported to a facility
capable of storing it. There are potential geologic storage sites in Texas, Louisiana, and
Mississippi to which CO2 could be transported if a pipeline was available or constructed to
transport to the sequestration sites. The map found at the end of this Appendix identifies
potential CO2 pipelines. Please note that some of these CO2 pipelines are for the purpose of
delivering CO2 to Enhanced Oil Recovery (EOR) sites .7
A pipeline for EOR is not a feasible option for providing CO2 sequestration because, for the
EOR process, the injected CO2 is purposefully injected into a formation which will allow CO2
migration through the formation to the surface in order to, at the same time, force oil to the
surface. As oil is forced to the surface, CO2 is also forced to the surface. So in the EOR
process, CO2 is not isolated or sequestered or retained below the surface. In addition, while
6 Alstom, Alstom’s Carbon Capture Technology Commercially “Ready to Go” by 2015, Nov.30, 2010,
http://www.alstom.com/australia/news-and-events/pr/ccs2015/ (last visited July.26, 2012). 7 Susan Hovorka, University of Texas at Austin, Bureau of Economic Geology, Gulf Coast Carbon Center, New
Developments: Solved and Unsolved Questions Regarding Geologic Sequestration of CO2 as a Greenhouse Gas
Reduction Method (GCCC Digital Publication #08-13) at slide 4 (Apr. 2008), available at:
http://www.beg.utexas.edu/gccc/forum/codexdownloadpdf.php?ID=100(last visited July 26, 2012).
there may be a market for CO2 for EOR projects, current demand for EOR pipelines cannot be
guaranteed to remain steady for the life of the proposed project. EOR projects are driven by the
recovery of oil and will end when the cost of oil recovery is no longer financially viable.
Therefore, in addition to not actually sequestering the CO2, the long -term viability of EOR as a
use of the captured CO2 is not assured. Therefore, EOR pipelines are eliminated as technically
feasible sequestration option.
The closest site that is currently being field-tested to demonstrate its capacity for potential large-
scale geological storage/sequestration of CO2 is the Southwest Regional Partnership (SWP) on
Carbon Sequestration’s Scurry Area Canyon Reef Operators (SACROC) test site, which is
located in Scurry County, Texas approximately 439 miles away (distance estimated using
shortest feasible pipeline pathway from Point Comfort to SACROC site). See the map at the
end of this Appendix for the test site location. There is no pipeline available to deliver the CO2
associated with this project to the SACROC test site. Therefore, assuming that this site is
eventually demonstrated to be capable of indefinitely storing/sequestering a substantial portion
of the large volume of CO2 generated by the proposed project, a 439 mile-long, 20-inch
diameter pipeline would need to be constructed to transport the large volume of high-pressure
CO2 from the plant to the storage facility which is infeasible.
6.1.2.3 CO2 Sequestration
Even if it is assumed that CO2 capture and compression could feasibly be achieved for the
proposed project and that the CO2 could be transported economically, the feasibility of CCS
technology would still depend on the availability of a suitable pipeline or sequestration site as
addressed in Step 4 of the BACT analysis. The suitability of potential storage sites is a function
of volumetric capacity of their geologic formations, CO2 trapping mechanisms within formations
(including dissolution in brine, reactions with minerals to form solid carbonates, and/or
adsorption in porous rock), and potential environmental impacts resulting from injection of CO2
into the formations. Potential environmental impacts resulting from CO2 injection that still
require assessment before CCS technology can be considered feasible include:
Uncertainty concerning the significance of dissolution of CO2 into brine,
Risks of brine displacement resulting from large-scale CO2 injection, including a
pressure leakage risk for brine into underground drinking water sources and/or surface
water,

Risks to fresh water as a result of leakage of CO2, including the possibility for damage to
the biosphere, underground drinking water sources, and/or surface water,8 and
Potential effects on wildlife.
Potentially suitable storage sites exist in Texas, Louisiana, and Mississippi. EPA has identified
an EOR pipeline located within 10 miles of the proposed project. However, as discussed in this
document such EOR sites are not actual sequestration sites. Other potentially suitable storage
sites with the potential for actual sequestration have not yet been technically demonstrated with
respect to all of the suitability factors described above. In comparison, the closest site that is
currently being field-tested to demonstrate its capacity for geological storage of the volume of
CO2 that would be generated by the proposed power unit, i.e., SWP’s SACROC test site, is
located in Scurry County, Texas approximately 439 miles away (via pipeline routing). It should
be noted that, based on the suitability factors described above, currently the suitability of the
SACROC site or any other test site to store a substantial portion of the large volume of CO2
generated by the proposed project has yet to be fully demonstrated.
STEP 3: RANK REMAINING CONTROL TECHNOLOGIES 6.1.3
As documented above, implementation of CCS technology for the FPC TX expansion emission
sources is not currently commercially available or feasible for both technical and economic
reasons. Even so, FPC TX will provide detailed economic and impacts analyses in Step 4
which provides further documentation for eliminating this option as a control Technology to be
evaluated for the GHG emission sources associated with the FPC TX expansion.
STEP 4: EVALUATE MOST EFFECTIVE CONTROLS AND DOCUMENT RESULTS 6.1.4
6.1.4.1 Additional Environmental Impacts and Considerations
There are a number of other environmental and operational issues related to the installation and
operation of CCS that must also be considered in this evaluation. First, operation of CCS
capture and compression equipment would require substantial additional electric power. For
example, operation of carbon capture equipment at a typical natural gas fired combined cycle
8 Id.
plant is estimated to reduce the net energy efficiency of the plant from approximately 50%
(based on the fuel higher heating value (HHV)) to approximately 42.7% (based on fuel HHV).9
To provide the amount of reliable electricity needed to power a capture system, FPC TX would
need to significantly expand the scope of the utility plant expansion proposed with this project to
install one or more additional electric generating units, which are sources of conventional (non-
GHG) and GHG air pollutants themselves. To put these additional power requirements in
perspective, gas-fired electric generating units typically emit more than 100,000 tons CO2e/yr
and would themselves, require a PSD permit for GHGs in addition to non-GHG pollutants.
FPC TX would need to construct a pipeline that is estimated to be at least 439 miles in length to
transport captured GHGs to the nearest potential sequestration site (SACROC site).
Constructing a pipeline of this magnitude would require procurement of right-of-ways which can
be a lengthy and potentially difficult undertaking. Pipeline construction would also require
extensive planning, environmental studies and possible mitigation of environmental impacts
from pipeline construction. Therefore, in addition to being costly, the transportation of GHGs for
this project would potentially result in negative impacts and disturbance to the environment in
the pipeline right-of-way.
Finally, implementation of CCS for the 2012 Expansion Project poses several operational and
business concerns. Not withstanding that EOR is not a feasible sequestration option, any sale
of CO2 material to either a pipeline entity or to a storage facility (EOR) would be made under
contractual terms. FPC TX is in the primary business of selling commodity and specialty
chemicals; the sale of CO2 would be a secondary product. The GHG sources that would be tied
into a CCS system must be periodically taken out of service for maintenance or other reasons to
ensure maximum yield of primary product from the production unit, thereby temporary
eliminating or reducing the supply of CO2 to the buyer. FPC TX has identified contractual issues
relating to the sale of CO2 that conflict directly with existing contracts relating to the sale of
primary products. For this reason, FPC TX believes that the sale of CO2 from the Point Comfort
expansion sources poses an unacceptable business conflict and as such, revenues from
transportation of CO2 to EOR sites are not guaranteed.
9 US Department of Energy, National Energy Technology Laboratory, “Costs and Performance Baseline For Fossil
Energy Plants, Volume 1 - Bituminous Coal and Natural Gas to Energy”, Revision 2, November 2010
6.1.4.2 CCS Cost Evaluation
Based on the reasons provided above, FPC TX believes that CCS technology should be
eliminated from further consideration as a potential feasible control technology for purposes of
this BACT analysis. Furthermore, the Congressional Budget Office’s June 2012 document
entitled Federal Efforts to Reduce the Cost of Capturing and Storing Carbon Dioxide states that
“average capital costs for a CCS-equipped plant would be 76 percent higher than those for a
conventional plant.”10 Even so, to address possible questions that the public or the EPA may
have concerning the relative costs of implementing hypothetical CCS systems, FPC TX has
estimated such costs on a site-specific basis.
For the cost evaluation, FPC TX considered all plants project (Olefins Expansion, LDPE plant
and gas turbines) associated the expansion GHG emission sources for which CCS is
considered technically feasible, for purposes of this analysis, even though separate permits are
requested for each plant. These GHG emissions sources include the following emission units
(respective plant names/permit applications shown in parenthesis):
14 cracking furnaces (Olefins Expansion)
4 PDH Reactors (Olefins Expansion)
4 steam boilers (Olefins Expansion)
2 combined cycle gas-fired turbines (Gas Turbines)
2 regenerative thermal oxidizers (LDPE Plant)
FPC TX’s site-specific cost estimate assumed that an amine based scrubbing system and
associated compressors would be used. While not fully proven on gas-fired turbine flue gas or
process heater exhaust, amine based scrubbing systems are the most mature technology
potentially available for CCS. To determine the capital cost of the amine scrubbing system and
associated compressors for the FPC TX project, FPC TX used cost information from a DOE-
NETL study from 2010 as a benchmark and scaled the cost based on the actual FPC TX
capacity and stream characteristics, as described below.
FPC TX stream will require additional gas conditioning and equipment capacity to meet
specifications for final sale because 10 Federal Efforts to Reduce the Cost of Capturing and Storing Carbon Dioxide, Page 7 (June 2012).

o FPC TX’s combined exhaust streams from CCS candidate sources has an
annual average CO2 concentration of 4.19% by volume versus the DOE-NETL
IGCC gas turbine example with a CO2 concentration of 6.3% by volume
o FPC TX’s proposed annual CO2 to be recovered from CCS candidate sources is
3,541,796 tons/yr, versus the DOE-NETL example with less than half of this
much CO2
FPC TX will require thousands of feet of gas in plant gathering system piping to collect
vent gas from the variety of CO2 emission points located in different operating units
across the Point Comfort site.
FPC TX estimated that over 8,500 linear feet of ductwork would be necessary to
route the exhaust streams together to a common capture and compression
system
Additional electricity is required to power the capture and compression system
o FPC TX’s site-specific cost estimate included the cost for extra power assuming
that power would be purchased from electric utility providers at a market rate
The following costs were not included in the cost estimated so the actual cost is expected to be
much higher than the cost reported here. Costs of obtaining rights of way for construction of a
pipeline were not included in the site-specific cost estimate. Also it should be noted also that
the liability and property issues related to underground CO2 storage have not been fully
resolved. CCS cost estimates provided by DOE-NETL did not include an escalation factor to
account for increasing costs as available sequestration sites begin to fill up or the ongoing
monitoring costs associated with a sequestration project.
The CCS system site-specific cost estimate is presented on Tables 6-1 through 6-7 at the end
of this Appendix. These tables include an option to transport and store CO2 at the SACROC
sequestration site (“Sequestration Option”). In addition, although EOR does not actually provide
sequestration, at the request of EPA, the cost estimate includes an option for transport and sale
of CO2 to the nearest potential EOR site (“EOR Option”).
For the sequestration option, the total CCS system capital and operating costs are estimated at
over 8 billion dollars for the 30 year project period, which is more than four times the total Point
Comfort expansion project capital cost (total estimated capital cost is 2 billion dollars). For the
EOR option, the net costs (total capital and operating costs minus an assumed EOR revenue)
are estimated at over 4.8 billion dollars for the 30 year project period, which is 245% of the total
Point Comfort expansion project capital cost (total estimated capital cost is 2 billion dollars).
Increasing the capital cost of the expansion project by imposing CCS would render this project
economically unviable.
As discussed above, CCS was determined to be not commercially available and not technically
feasible; therefore, a detailed examination of the energy, environmental, and economic impacts
of CCS is not required for this application. However, at the request of EPA Region 6, FPC-TX
included the estimated costs for implementation of CCS which are presented in Tables 6-1
through 6-7. As discussed above these costs show that CCS is not commercially available, not
technically feasible but also economically unreasonable. Therefore, it is not included as BACT
for the FPC TX expansion.
STEP 5: SELECT BACT 6.1.5
As demonstrated in Steps 2 and 4 of the BACT review, CCS is not only not commercially
available, not technically feasible but also economically unreasonable. Therefore, it is not
included as BACT for the FPC TX expansion.
6.1.5.1 CCS in Other GHG Permits
FPC TX searched GHG permits issued by EPA Region 6 and other states. Only one permit
included the use of CCS, the Indiana Gasification, LLC (IG) project, permit no. 147-30464-
00060 issued by the Indiana Department of Environmental Management (IDEM). The IG project
proposes the construction of a coal gasification power plant that will produce liquefied carbon
dioxide which will be compressed and piped several hundred miles to EOR facilities in the Gulf
Coast region.
This project differs significantly from the Point Comfort expansion in most technical aspects, but
it should also be noted that IG has secured federal loan guarantees and potentially state tax
credits to make the project, including application of CCS, economically viable. Furthermore, on
page 154 of 181 of the PSD/TV Permit, Step 4 of the GHG BACT evaluation for the acid gas
removal units (the primary GHG emission vents) state that:

IG will not begin construction of this facility without a fully financed project agreement for
the pipeline that provides for the pipeline to be in place and ready to receive liquefied
CO2 at the point when pipeline quality CO2 is available.
This statement provides evidence that the project, including application of CCS, hinges on the
approval and contracts for a new CO2 pipeline. It is clear from the following quote from the
Indiana permit application that installation of CCS was not justified for this project as BACT.
The GHG BACT evaluation for the proposed IG plant concludes that “Based on the technically
feasibility analysis in Step 2, there are no viable control technologies for the control of GHG
emissions from the acid gas recovery unit vent.” This is consistent with the results of FPC TX’s
BACT analysis of CCS for the Point Comfort Expansion project.
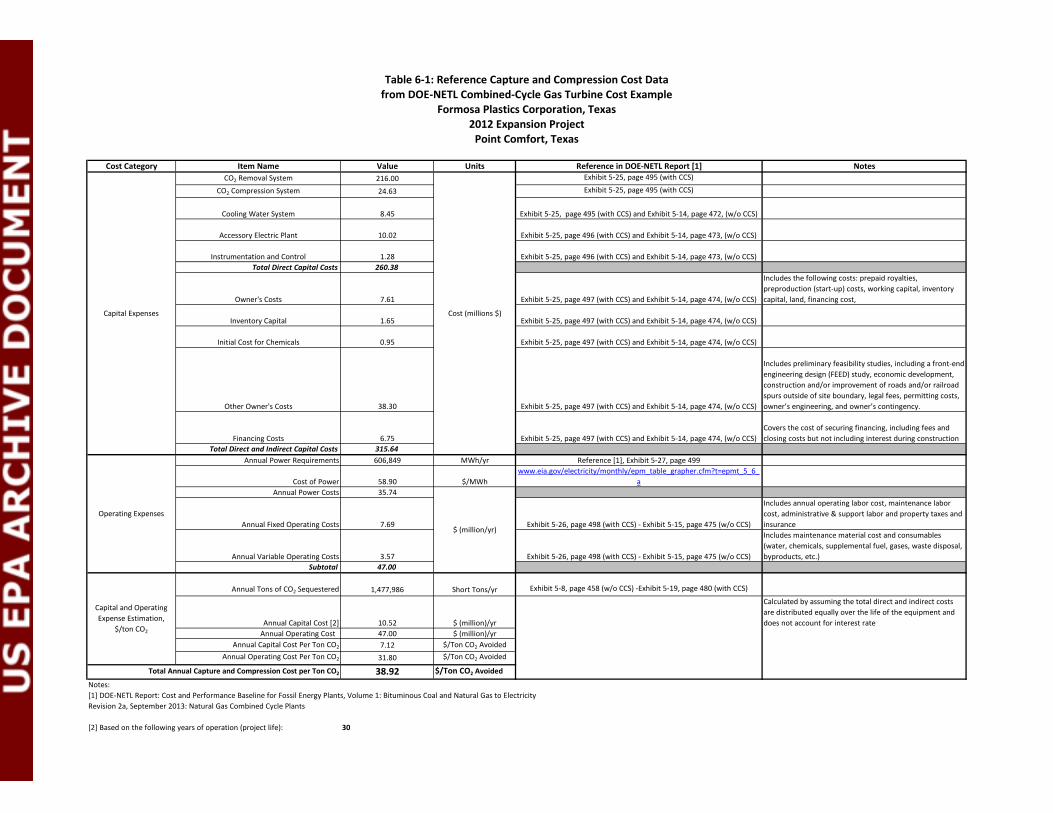
Cost Category Item Name Value Units Reference in DOE‐NETL Report [1] NotesCO2 Removal System 216.00 Exhibit 5‐25, page 495 (with CCS)
CO2 Compression System 24.63 Exhibit 5‐25, page 495 (with CCS)
Cooling Water System 8.45 Exhibit 5‐25, page 495 (with CCS) and Exhibit 5‐14, page 472, (w/o CCS)
Accessory Electric Plant 10.02 Exhibit 5‐25, page 496 (with CCS) and Exhibit 5‐14, page 473, (w/o CCS)
Instrumentation and Control 1.28 Exhibit 5‐25, page 496 (with CCS) and Exhibit 5‐14, page 473, (w/o CCS)Total Direct Capital Costs 260.38
Owner's Costs 7.61 Exhibit 5‐25, page 497 (with CCS) and Exhibit 5‐14, page 474, (w/o CCS)
Includes the following costs: prepaid royalties, preproduction (start‐up) costs, working capital, inventory capital, land, financing cost,
Inventory Capital 1.65 Exhibit 5‐25, page 497 (with CCS) and Exhibit 5‐14, page 474, (w/o CCS)
Initial Cost for Chemicals 0.95 Exhibit 5‐25, page 497 (with CCS) and Exhibit 5‐14, page 474, (w/o CCS)
Other Owner's Costs 38.30 Exhibit 5‐25, page 497 (with CCS) and Exhibit 5‐14, page 474, (w/o CCS)
Includes preliminary feasibility studies, including a front‐end engineering design (FEED) study, economic development, construction and/or improvement of roads and/or railroad spurs outside of site boundary, legal fees, permitting costs, owner’s engineering, and owner’s contingency.
Financing Costs 6.75 Exhibit 5‐25, page 497 (with CCS) and Exhibit 5‐14, page 474, (w/o CCS)Covers the cost of securing financing, including fees and closing costs but not including interest during construction
Total Direct and Indirect Capital Costs 315.64Annual Power Requirements 606,849 MWh/yr Reference [1], Exhibit 5‐27, page 499
Cost of Power 58.90 $/MWhwww.eia.gov/electricity/monthly/epm_table_grapher.cfm?t=epmt_5_6_
aAnnual Power Costs 35.74
Annual Fixed Operating Costs 7.69 Exhibit 5‐26, page 498 (with CCS) ‐ Exhibit 5‐15, page 475 (w/o CCS)
Includes annual operating labor cost, maintenance labor cost, administrative & support labor and property taxes and insurance
Annual Variable Operating Costs 3.57 Exhibit 5‐26, page 498 (with CCS) ‐ Exhibit 5‐15, page 475 (w/o CCS)
Includes maintenance material cost and consumables (water, chemicals, supplemental fuel, gases, waste disposal, byproducts, etc.)
Subtotal 47.00
Annual Tons of CO2 Sequestered 1,477,986 Short Tons/yr Exhibit 5‐8, page 458 (w/o CCS) ‐Exhibit 5‐19, page 480 (with CCS)
Annual Capital Cost [2] 10.52 $ (million)/yr
Calculated by assuming the total direct and indirect costs are distributed equally over the life of the equipment and does not account for interest rate
Annual Operating Cost 47.00 $ (million)/yrAnnual Capital Cost Per Ton CO2 7.12 $/Ton CO2 Avoided
Annual Operating Cost Per Ton CO2 31.80 $/Ton CO2 Avoided
Total Annual Capture and Compression Cost per Ton CO2 38.92 $/Ton CO2 Avoided
Notes:[1] DOE‐NETL Report: Cost and Performance Baseline for Fossil Energy Plants, Volume 1: Bituminous Coal and Natural Gas to ElectricityRevision 2a, September 2013: Natural Gas Combined Cycle Plants
[2] Based on the following years of operation (project life): 30
Table 6‐1: Reference Capture and Compression Cost Datafrom DOE‐NETL Combined‐Cycle Gas Turbine Cost Example
Formosa Plastics Corporation, Texas2012 Expansion ProjectPoint Comfort, Texas
Capital Expenses
Operating Expenses
Cost (millions $)
$ (million/yr)
Capital and Operating Expense Estimation,
$/ton CO2

Candidate CCS Unit TypeExhaust Stream Volumetric Flow Rate, All
Units of this Type [1] (acfm)CO2 Concentration in Exhaust (vol%) [2]
CO2 Volumetric Flow Rate (acfm) [3]
Pyrolysis Furnaces 847,800 6.18 52,400PDH Unit Reactors 189,900 4.6 8,700Steam Boilers 610,500 4.9 29,900
Combustion Turbines 1,429,900 3.3 47,200RTOs 226,100 0.10 200TOTAL 3,304,200 4.19 138,400
Notes:[1] Expected annual average flow rate for this group of unit types.[2] Expected annual average CO2 concentration in the exhaust gas stream.
[3] CO2 volumetric flow rate calculated as follows: exhaust stream vol flow rate (acfm) x CO2 concentration in exhaust (vol %) / 100
Table 6‐2: Candidate CCS Source Exhaust Stream CO2 Concentrations and Flow Rates, by Unit Type
Formosa Plastics Corporation, Texas2012 Expansion ProjectPoint Comfort, Texas
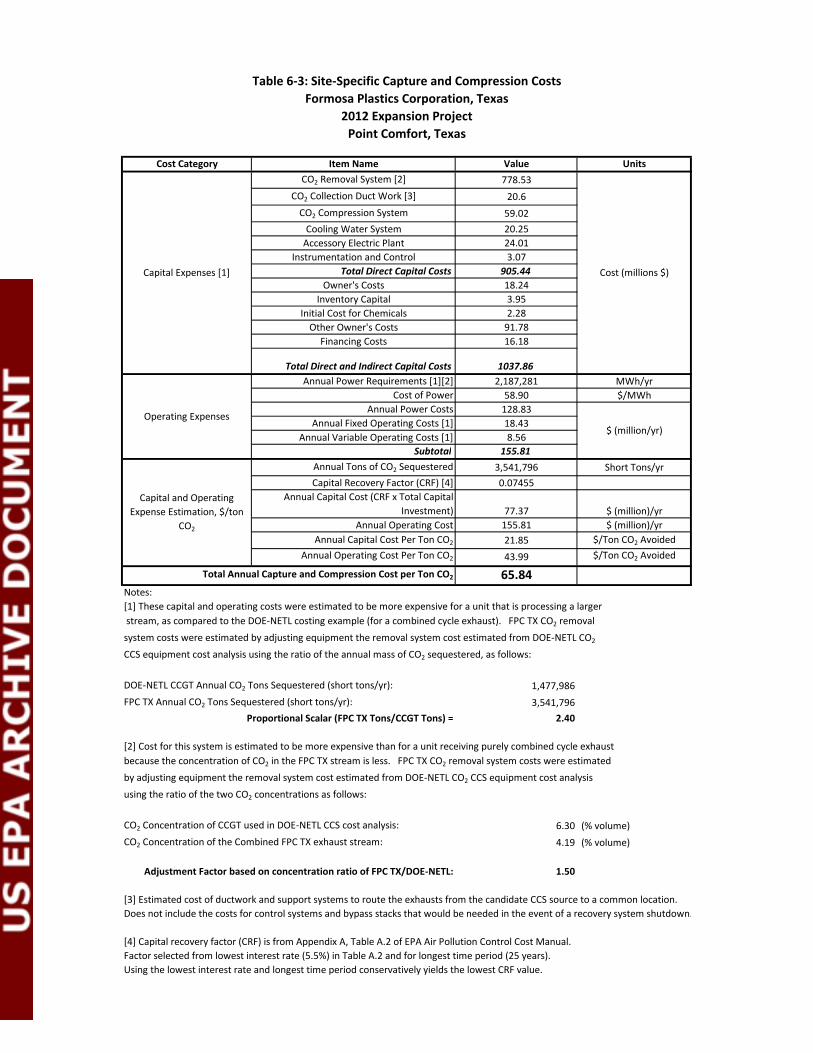
Cost Category Item Name Value UnitsCO2 Removal System [2] 778.53
CO2 Collection Duct Work [3] 20.6CO2 Compression System 59.02Cooling Water System 20.25Accessory Electric Plant 24.01
Instrumentation and Control 3.07Total Direct Capital Costs 905.44
Owner's Costs 18.24Inventory Capital 3.95
Initial Cost for Chemicals 2.28Other Owner's Costs 91.78
Financing Costs 16.18
Total Direct and Indirect Capital Costs 1037.86Annual Power Requirements [1][2] 2,187,281 MWh/yr
Cost of Power 58.90 $/MWhAnnual Power Costs 128.83
Annual Fixed Operating Costs [1] 18.43Annual Variable Operating Costs [1] 8.56
Subtotal 155.81Annual Tons of CO2 Sequestered 3,541,796 Short Tons/yrCapital Recovery Factor (CRF) [4] 0.07455
Annual Capital Cost (CRF x Total Capital Investment) 77.37 $ (million)/yr
Annual Operating Cost 155.81 $ (million)/yrAnnual Capital Cost Per Ton CO2 21.85 $/Ton CO2 Avoided
Annual Operating Cost Per Ton CO2 43.99 $/Ton CO2 Avoided
Total Annual Capture and Compression Cost per Ton CO2 65.84Notes:[1] These capital and operating costs were estimated to be more expensive for a unit that is processing a larger stream, as compared to the DOE‐NETL costing example (for a combined cycle exhaust). FPC TX CO2 removal
system costs were estimated by adjusting equipment the removal system cost estimated from DOE‐NETL CO2
CCS equipment cost analysis using the ratio of the annual mass of CO2 sequestered, as follows:
DOE‐NETL CCGT Annual CO2 Tons Sequestered (short tons/yr): 1,477,986FPC TX Annual CO2 Tons Sequestered (short tons/yr): 3,541,796
Proportional Scalar (FPC TX Tons/CCGT Tons) = 2.40
[2] Cost for this system is estimated to be more expensive than for a unit receiving purely combined cycle exhaust because the concentration of CO2 in the FPC TX stream is less. FPC TX CO2 removal system costs were estimated
by adjusting equipment the removal system cost estimated from DOE‐NETL CO2 CCS equipment cost analysis
using the ratio of the two CO2 concentrations as follows:
CO2 Concentration of CCGT used in DOE‐NETL CCS cost analysis: 6.30 (% volume)CO2 Concentration of the Combined FPC TX exhaust stream: 4.19 (% volume)
Adjustment Factor based on concentration ratio of FPC TX/DOE‐NETL: 1.50
[3] Estimated cost of ductwork and support systems to route the exhausts from the candidate CCS source to a common location.Does not include the costs for control systems and bypass stacks that would be needed in the event of a recovery system shutdown.
[4] Capital recovery factor (CRF) is from Appendix A, Table A.2 of EPA Air Pollution Control Cost Manual.Factor selected from lowest interest rate (5.5%) in Table A.2 and for longest time period (25 years).Using the lowest interest rate and longest time period conservatively yields the lowest CRF value.
Capital and Operating Expense Estimation, $/ton
CO2
Table 6‐3: Site‐Specific Capture and Compression CostsFormosa Plastics Corporation, Texas
2012 Expansion ProjectPoint Comfort, Texas
Capital Expenses [1] Cost (millions $)
Operating Expenses$ (million/yr)
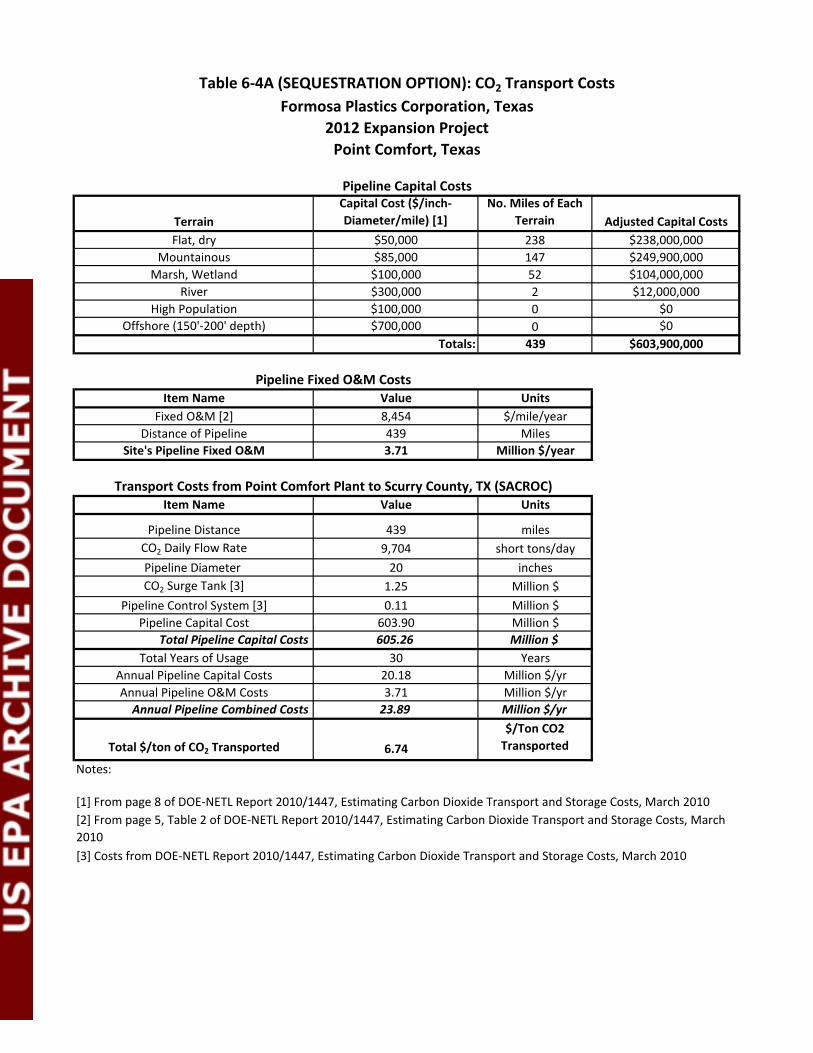
TerrainCapital Cost ($/inch‐Diameter/mile) [1]
No. Miles of Each Terrain Adjusted Capital Costs
Flat, dry $50,000 238 $238,000,000Mountainous $85,000 147 $249,900,000
Marsh, Wetland $100,000 52 $104,000,000River $300,000 2 $12,000,000
High Population $100,000 0 $0Offshore (150'‐200' depth) $700,000 0 $0
Totals: 439 $603,900,000
Item Name Value UnitsFixed O&M [2] 8,454 $/mile/year
Distance of Pipeline 439 MilesSite's Pipeline Fixed O&M 3.71 Million $/year
Item Name Value Units
Pipeline Distance 439 milesCO2 Daily Flow Rate 9,704 short tons/dayPipeline Diameter 20 inchesCO2 Surge Tank [3] 1.25 Million $
Pipeline Control System [3] 0.11 Million $Pipeline Capital Cost 603.90 Million $
Total Pipeline Capital Costs 605.26 Million $Total Years of Usage 30 Years
Annual Pipeline Capital Costs 20.18 Million $/yrAnnual Pipeline O&M Costs 3.71 Million $/yrAnnual Pipeline Combined Costs 23.89 Million $/yr
Total $/ton of CO2 Transported 6.74$/Ton CO2 Transported
Notes:
Table 6‐4A (SEQUESTRATION OPTION): CO2 Transport CostsFormosa Plastics Corporation, Texas
2012 Expansion ProjectPoint Comfort, Texas
[1] From page 8 of DOE‐NETL Report 2010/1447, Estimating Carbon Dioxide Transport and Storage Costs, March 2010[2] From page 5, Table 2 of DOE‐NETL Report 2010/1447, Estimating Carbon Dioxide Transport and Storage Costs, March 2010[3] Costs from DOE‐NETL Report 2010/1447, Estimating Carbon Dioxide Transport and Storage Costs, March 2010
Pipeline Fixed O&M Costs
Pipeline Capital Costs
Transport Costs from Point Comfort Plant to Scurry County, TX (SACROC)

TerrainCapital Cost ($/inch‐Diameter/mile) [1]
No. Miles of Each Terrain Adjusted Capital Costs
Flat, dry $50,000 0 $0Mountainous $85,000 0 $0
Marsh, Wetland $100,000 10 $20,000,000River $300,000 0 $0
High Population $100,000 0 $0Offshore (150'‐200' depth) $700,000 0 $0
Totals: 10 $20,000,000
Item Name Value UnitsFixed O&M [2] 8,454 $/mile/year
Distance of Pipeline 10 MilesSite's Pipeline Fixed O&M 0.085 Million $/year
Item Name Value Units
Pipeline Distance 10 milesCO2 Daily Flow Rate 9,704 short tons/dayPipeline Diameter 20 inchesCO2 Surge Tank [3] 1.25 Million $
Pipeline Control System [3] 0.11 Million $Pipeline Capital Cost 20.00 Million $
Total Pipeline Capital Costs 21.36 Million $Total Years of Usage 30 Years
Annual Pipeline Capital Costs 0.71 Million $/yrAnnual Pipeline O&M Costs 0.08 Million $/yr
Annual Pipeline Combined Costs 0.80 Million $/yrNotes:
Pipeline Fixed O&M Costs
Table 6‐4B (EOR OPTION): CO2 Transport Costs to EOR SiteFormosa Plastics Corporation, Texas
2012 Expansion ProjectPoint Comfort, Texas
Pipeline Capital Costs
Transport Costs from Point Comfort Plant to Potential Jackson County EOR Site
[1] From page 8 of DOE‐NETL Report 2010/1447, Estimating Carbon Dioxide Transport and Storage Costs, March 2010[2] From page 5, Table 2 of DOE‐NETL Report 2010/1447, Estimating Carbon Dioxide Transport and Storage Costs, March 2010
[3] Costs from DOE‐NETL Report 2010/1447, Estimating Carbon Dioxide Transport and Storage Costs, March 2010
As stated in Section 6.1.2.2 of Appendix C (BACT Analysis for CCS), a pipeline for EOR is not a feasible option for providing CO2
sequestration (e.g., pollution control option) because the injected CO2 is purposefully injected into a formation which will allow CO2 migration through the formation to the surface.
Although FPC TX does not consider EOR a sequestration option, at the request of EPA this cost evaluation for transporting the captured CO2 to the nearest potential EOR site is being provided. The nearest potential EOR site is located approximately 10 pipeline miles north of the Point Comfort facility.
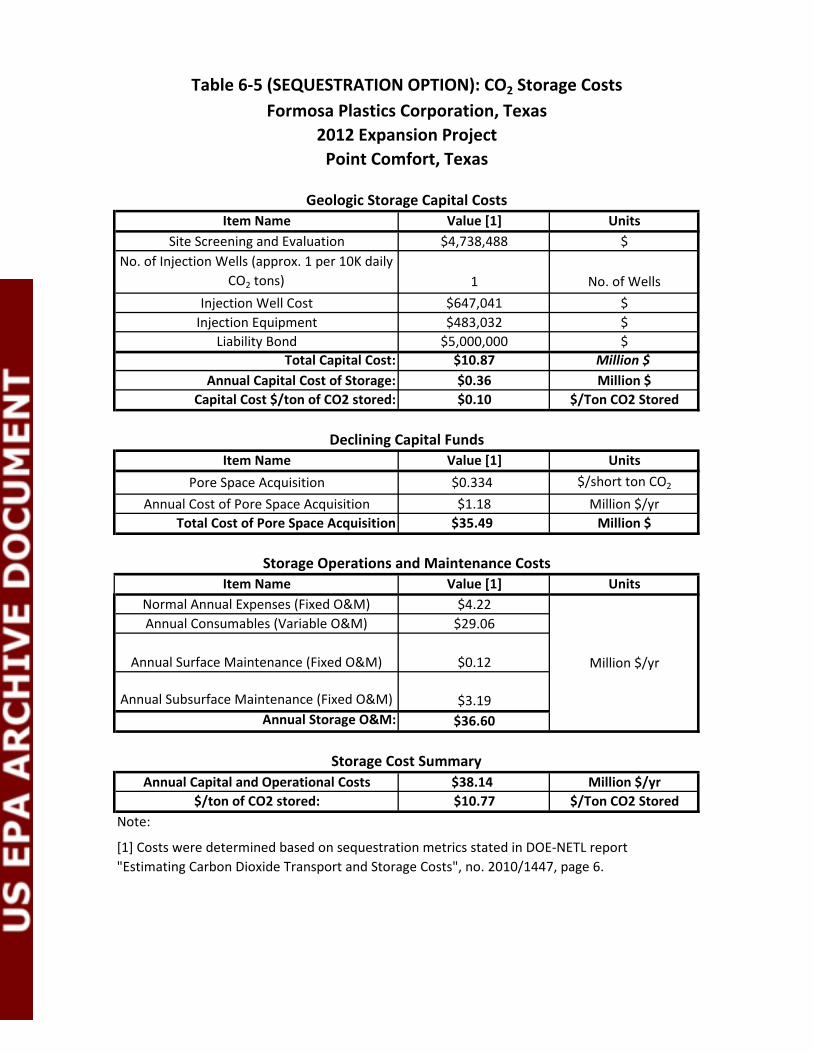
Item Name Value [1] UnitsSite Screening and Evaluation $4,738,488 $
No. of Injection Wells (approx. 1 per 10K daily CO2 tons) 1 No. of Wells
Injection Well Cost $647,041 $Injection Equipment $483,032 $
Liability Bond $5,000,000 $Total Capital Cost: $10.87 Million $
Annual Capital Cost of Storage: $0.36 Million $Capital Cost $/ton of CO2 stored: $0.10 $/Ton CO2 Stored
Item Name Value [1] UnitsPore Space Acquisition $0.334 $/short ton CO2
Annual Cost of Pore Space Acquisition $1.18 Million $/yrTotal Cost of Pore Space Acquisition $35.49 Million $
Item Name Value [1] UnitsNormal Annual Expenses (Fixed O&M) $4.22Annual Consumables (Variable O&M) $29.06
Annual Surface Maintenance (Fixed O&M) $0.12
Annual Subsurface Maintenance (Fixed O&M) $3.19Annual Storage O&M: $36.60
Annual Capital and Operational Costs $38.14 Million $/yr$/ton of CO2 stored: $10.77 $/Ton CO2 Stored
Note:
Table 6‐5 (SEQUESTRATION OPTION): CO2 Storage CostsFormosa Plastics Corporation, Texas
2012 Expansion ProjectPoint Comfort, Texas
[1] Costs were determined based on sequestration metrics stated in DOE‐NETL report "Estimating Carbon Dioxide Transport and Storage Costs", no. 2010/1447, page 6.
Million $/yr
Storage Cost Summary
Storage Operations and Maintenance Costs
Geologic Storage Capital Costs
Declining Capital Funds

Summary of Costs for Comparison to Expansion Project Capital Cost:
Cost Type Annual Cost (Million $/yr)Total Cost (Millions
$) [1]Carbon Dioxide Capture and Compression
System Capital Costs 77.37 2,321Carbon Dioxide Capture and Compression
System Operating Costs 155.81 4,674Capital Cost for Transport to
Sequestration Site 20.18 605.3Operating Costs for Transport to
Sequestration Site 3.71 111.3Storage Costs 38.14 1,144
8,857
2,000
443%Notes:[1] Operating Costs for 30 year project life.
Summary of Cost per Ton CO2 Sequestered:Cost Type $/Ton of CO2 Sequestered
Carbon Dioxide Capture and Compression System 65.84
Transport to SACROC 6.74Storage 10.77
Total $/Ton CO2: 83.35
Capital Cost of 2012 Expansion Project =
Costs for Carbon Capture, Compression and Transport to Sequestration Site (% of Expansion Project Capital Cost) =
Table 6‐6 (SEQUESTRATION OPTION): Cost Summary for Carbon Capture, Compression, Transportation and Sequestration in Scurry County, Texas
Formosa Plastics Corporation, Texas2012 Expansion ProjectPoint Comfort, Texas
Total Capital and Operating Cost =
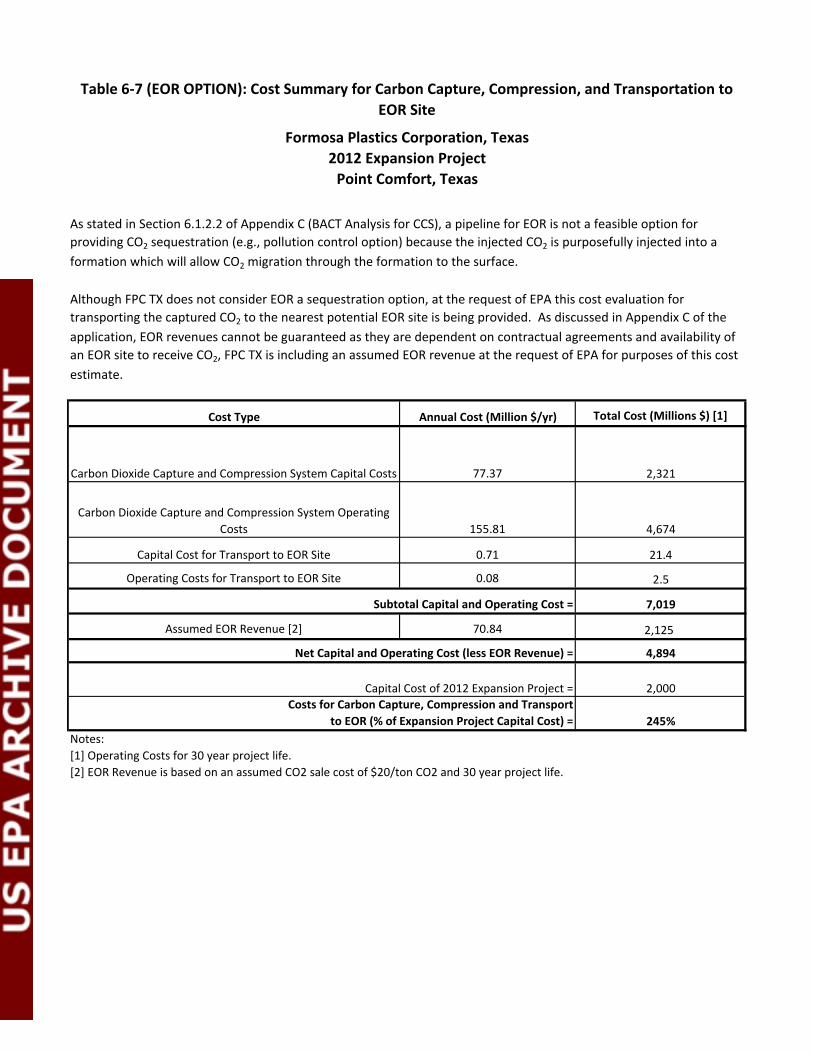
Cost Type Annual Cost (Million $/yr) Total Cost (Millions $) [1]
Carbon Dioxide Capture and Compression System Capital Costs 77.37 2,321
Carbon Dioxide Capture and Compression System Operating Costs 155.81 4,674
Capital Cost for Transport to EOR Site 0.71 21.4
Operating Costs for Transport to EOR Site 0.08 2.5
7,019
Assumed EOR Revenue [2] 70.84 2,125
4,894
2,000
245%Notes:[1] Operating Costs for 30 year project life.[2] EOR Revenue is based on an assumed CO2 sale cost of $20/ton CO2 and 30 year project life.
Subtotal Capital and Operating Cost =
Net Capital and Operating Cost (less EOR Revenue) =
Capital Cost of 2012 Expansion Project =Costs for Carbon Capture, Compression and Transport
to EOR (% of Expansion Project Capital Cost) =
Table 6‐7 (EOR OPTION): Cost Summary for Carbon Capture, Compression, and Transportation to EOR Site
Formosa Plastics Corporation, Texas2012 Expansion ProjectPoint Comfort, Texas
As stated in Section 6.1.2.2 of Appendix C (BACT Analysis for CCS), a pipeline for EOR is not a feasible option for providing CO2 sequestration (e.g., pollution control option) because the injected CO2 is purposefully injected into a formation which will allow CO2 migration through the formation to the surface.
Although FPC TX does not consider EOR a sequestration option, at the request of EPA this cost evaluation for transporting the captured CO2 to the nearest potential EOR site is being provided. As discussed in Appendix C of the application, EOR revenues cannot be guaranteed as they are dependent on contractual agreements and availability of an EOR site to receive CO2, FPC TX is including an assumed EOR revenue at the request of EPA for purposes of this cost estimate.


