Bacteria Contamination of Surface Waters Due to Livestock Grazing in the Stanislaus National Forest, California Lindsey Myers, staff biologist Central Sierra Environmental Resource Center P.O. Box 396, Twain Harte, CA 95383 Jeffrey Kane, M.S. May 20, 2010 Abstract — Surface waters were tested for pathogenic bacteria indicators (i.e., E. coli, total coliform bacteria, and fecal coliform bacteria) within commercial cattle grazing allotments in the Stanislaus National Forest. Water samples were collected from one control/ungrazed stream site and at four grazed stream sites before cattle grazing began and during the period when livestock were present. Fecal coliform concentrations were compared to regulatory water quality standards adopted by the State of California. Results showed that individual and average concentrations of fecal coliform bacteria in surface waters were below regulatory thresholds at the ungrazed site and at the grazed sites before cattle arrived. Shortly after cattle were released to graze, fecal coliform concentrations were much higher, and in places exceeded state standards. The increase in mean concentration of fecal coliform at each grazed site was significant (p < 0.05), but there was no significant difference at the control site. Total coliform bacteria and E. coli concentrations showed the same pattern. The violations of state water quality standards persisted throughout the summer grazing period, with more than 40 documented violations of state water quality standards. Key words: water, Stanislaus National Forest, cattle, livestock grazing, bacteria Introduction The Stanislaus National Forest (“Stanislaus NF”) is located in the Sierra Nevada of California, just north of Yosemite National Park. The Stanislaus NF is popular for outdoor recreation, 1 and the Stanislaus and Tuolumne River watershed provides about three million acre-feet of water storage for recreation, agriculture, domestic supply, and other uses. 2, 3 The U.S. Forest Service issues permits allowing commercial livestock grazing on certain lands in the Stanislaus NF. In recent years, there has been concern about the effects of livestock grazing on watersheds, wildlife, recreation, and other resources. 4 Previous studies have documented water quality degradation in the Sierra Nevada, including the Stanislaus NF, linked to domestic livestock such as cattle and pack animals. 5 The current study was undertaken to analyze water quality in representative areas exposed to cattle grazing and to compare sampling results with pertinent water quality standards established by the State of California.
Transcript
Bacteria Contamination of Surface Waters Due to Livestock Grazing in the Stanislaus National Forest, California
Lindsey Myers, staff biologist
Central Sierra Environmental Resource Center P.O. Box 396, Twain Harte, CA 95383
Jeffrey Kane, M.S.
May 20, 2010
Abstract — Surface waters were tested for pathogenic bacteria indicators (i.e., E. coli, total coliform bacteria, and fecal coliform bacteria) within commercial cattle grazing allotments in the Stanislaus National Forest. Water samples were collected from one control/ungrazed stream site and at four grazed stream sites before cattle grazing began and during the period when livestock were present. Fecal coliform concentrations were compared to regulatory water quality standards adopted by the State of California. Results showed that individual and average concentrations of fecal coliform bacteria in surface waters were below regulatory thresholds at the ungrazed site and at the grazed sites before cattle arrived. Shortly after cattle were released to graze, fecal coliform concentrations were much higher, and in places exceeded state standards. The increase in mean concentration of fecal coliform at each grazed site was significant (p < 0.05), but there was no significant difference at the control site. Total coliform bacteria and E. coli concentrations showed the same pattern. The violations of state water quality standards persisted throughout the summer grazing period, with more than 40 documented violations of state water quality standards. Key words: water, Stanislaus National Forest, cattle, livestock grazing, bacteria
Introduction The Stanislaus National Forest (“Stanislaus NF”) is located in the Sierra Nevada of California, just north of Yosemite National Park. The Stanislaus NF is popular for outdoor recreation,1 and the Stanislaus and Tuolumne River watershed provides about three million acre-feet of water storage for recreation, agriculture, domestic supply, and other uses.2, 3 The U.S. Forest Service issues permits allowing commercial livestock grazing on certain lands in the Stanislaus NF. In recent years, there has been concern about the effects of livestock grazing on watersheds, wildlife, recreation, and other resources.4 Previous studies have documented water quality degradation in the Sierra Nevada, including the Stanislaus NF, linked to domestic livestock such as cattle and pack animals.5 The current study was undertaken to analyze water quality in representative areas exposed to cattle grazing and to compare sampling results with pertinent water quality standards established by the State of California.
2
Methods Field Site Selection Five sites were selected in areas frequented by commercial cattle grazing within the Stanislaus NF. The sites are typical of grazed areas throughout the forest. The sites are also open for and use by the public for recreational and other purposes Recent Forest Service environmental documentation states that grazing within each livestock allotment that includes the five sites is required to comply with certain “best management practices” (“BMPs”) and other provisions in grazing permits to ensure compliance with water quality standards. The California Regional Water Quality Board, Central Valley Region, designated “water contact recreation” as among the beneficial uses of streams at each site. One control site that was not subject to cattle grazing (the “ungrazed” site) was also tested. The sites are described below. Table 1 provides location (i.e., latitude, longitude) coordinates for each site, using datum NAD 83. A vicinity map8 and maps of each sample location are included in appendix 7. Lower Round Meadow – sample site: 1,932 meters (6,338 feet) elevation Samples were collected from a tributary stream of Bell Creek, where it flows through Lower Round Meadow (which is within the Bell Meadow/Bear Lake Range Allotment). Bell Creek is entirely within the Tuolumne River watershed and flows into the Tuolumne River via the Clavey River. Nine “before” grazing water samples were collected between May 27, 2009 and July 1, 2009. Grazing was first observed in the meadow on July 9, 2009. Seven “after livestock arrival” grazing water samples were collected between July 9, 2009 and July 28, 2009. Grazing continued in this allotment until September 22, 2009, but cows were not visibly present in the Lower Round Meadow area after the end of July. Upper Fiddlers Green Meadow – sample site: 1,966 meters (6,450 feet) elevation Samples were collected at the lower end of Upper Fiddlers Green Meadow from a tributary stream of Herring Creek (which is within the Herring Creek Range Allotment). Herring Creek is entirely within the Stanislaus River watershed and flows into the South Fork of the Stanislaus River. Eight “before” grazing water samples were collected between June 11, 2009 and July 9, 2009. Grazing was first observed in the meadow on July 16, 2009. Six “after livestock arrival” grazing water samples were collected between July 16, 2009 and August 13, 2009. Grazing continued in the overall allotment until October 1, 2009, however cows were not visibly present in the Fiddlers Green area after early August. Bull Run – sample site: 2,022 meters (6,634 feet) elevation Samples were collected below Bull Run Meadow from a major tributary of Cow Creek (which is within the Herring Creek Range Allotment). Cow Creek is entirely within the Stanislaus River watershed and flows into the Lower Middle Fork of the Stanislaus River. Seven water samples were collected “before” grazing occurred in the sample area. Those seven samples were collected between June 9, 2009 and July 1, 2009. Grazing was first observed in the surrounding stringer meadows on July 9, 2009. Seven “after livestock arrival” grazing water samples were collected between July 9, 2009 and August 13, 2009. Grazing continued in this allotment until October 1, 2009.
3
Barn Meadow - June 11 – July 1, 2009 sample site: 2,346 meters (7,697 feet) elevation BM1 - July 9 – August 5, 2009 sample site: 2,244 meters (7,362 feet) elevation BM2 - July 16, – August 5, 2009 sample site: 2,273 meters (7,458 feet) elevation Samples were collected below Barn Meadow from a tributary stream to Niagara Creek (which is within the Long Valley/Eagle Meadow Range Allotment). Niagara Creek is entirely within the Stanislaus River watershed and flows into Donnell Lake via the Middle Fork of the Stanislaus River. Seven “before” grazing water samples were collected at the Barn Meadow site between June 11, 2009 and July 1, 2009. However, flows receded at the original Barn Meadow sample site so that there was not adequate flow for sampling as of July 9, 2009; accordingly the sample site was moved further downstream to a new sample site with flowing water. Grazing was first observed in the immediate Barn Meadow area on July 9, 2009. Seven “after livestock arrival” grazing water samples were collected at the new site between July 9, 2009 and August 5, 2009 (site ID –BM1). A second new sample site (site ID –BM2) located above BM1 was selected on July 16, 2009; BM2 was more representative of the original sample site. Six “after livestock arrival” grazing water samples were collected at this new site between July 16, 2009 and August 5, 2009. The BM1 and BM2 samples were collected from two separate tributaries to Niagara Creek. Cattle grazing continued in this allotment until October 15, 2009. Rose Creek – sample site: 1,145 meters (3,756 feet) elevation Samples were collected from Rose Creek in an area accessed by Forest Service Road 3N59Y (which spurs off road 4N16). Rose Creek is entirely within the Stanislaus River watershed and flows into the Lower Middle Fork of the Stanislaus River. Cows were already present at the time of the first visit. Accordingly, no “before” grazing samples were collected at this site. Five water samples were collected “after cattle arrival” during a period when grazing was occurring. Those samples were collected between August 27, 2009 and September 23, 2009. Cows were visibly present in the general area near the sample site for samples one through four. Cows were not visibly present anywhere in the area for the last sample collected on September 23, 2009. Cows were reportedly removed from the allotment for the end of the season, prior to October 1, 2009. Bourland Creek (control site, not grazed) – July 14, 2009 sample site: 2,266 meters (7,433 feet) elevations July 24, 2009 – August 28, 2009 sample site: 2,225 meters (7,299 feet) elevation Samples were collected below Bourland Meadow from Bourland Creek. Bourland Meadow lies within a designated research natural area (RNA). While instances of livestock grazing trespass into the RNA have been documented by CSERC in past years, no livestock grazing is lawfully authorized within the Bourland Meadow area. No visible grazing use occurred within the RNA or within Bourland Meadow during the duration of this project. Bourland Creek is entirely within the Tuolumne River watershed and flows into the Tuolumne River via the Clavey River. Six water quality samples were taken between July 14, 2009 and August 28, 2009 (covering the same general time period when the “after cattle arrival” grazing samples were taken at Barn, Bull, Fiddlers Green, and Lower Round Meadow. Flows at the original sample site below Bourland Meadow had receded by July 24, 2009; on that date the sample site was moved a short distance downstream to a new location on Bourland Creek that had adequate flows for sampling.
4
Table 1. List of water sample sites (lat/long datum NAD 83). Site name county latitude longitude Barn Meadow (sampled 6/11/09 – 7/1/09) Tuolumne 38.290347 -119.859456 Barn Meadow 1 (sampled 7/9/09 – 8/5/09) Tuolumne 38.29764167 -119.86468611 Barn Meadow 2 (sampled 7/16/09 – 8/5/09) Tuolumne 38.29252616 -119.86239033 Bull Run Meadow Tuolumne 38.249194 -119.963692 Upper Fiddlers Green Meadow Tuolumne 38.22421197 -119.96850279 Lower Round Meadow Tuolumne 38.158772 -119.956986 Rose Creek Tuolumne 38.14194962 -120.19911384 Bourland Meadow (7/14/09 sample) Tuolumne 38.11022202 -119.91178488 Bourland Meadow (sampled 7/24 – 8/28/09) Tuolumne 38.10920712 -119.91242115 Field Water Collection A Quality Assurance Project Plan (QAPP) was prepared for this water-monitoring project and all procedures specified in the QAPP were followed.6 Water samples that were collected for bacteriological testing were collected while wearing sterile gloves and collected in sample bottles sterilized and provided by AquaLab Water Analysis (which has ELAP certification). The bacteriological samples were collected before any other work was performed at the site. The sterilized Nalgene bottles hold 125mL of liquid. They were filled to 100 mL with sample water taken directly from flowing water approximately 0.1 m below the surface. The sample containers were marked with a unique 3-digit identifying number with an indelible marker so that the markings would not “run” or otherwise become illegible when collecting the sample. The collection date, time and samplers’ names were recorded on the field datasheets (QAPP Appendix B),6 which are retained at the CSERC office; they are also recorded on the Chain-of-Custody (QAPP Appendix C)6 form that was transmitted to AquaLab along with each sample. No sampling bottles were contaminated during sampling or transit. All water samples collected for bacteriological analyses were delivered to AquaLab within six hours from the time the samples were collected. The sample bottles were placed in Zip-loc plastic bags (to avoid potential contamination from the ice water) on ice in a cooler until delivered into the custody of AquaLab. While collecting the water samples, the relative flow of the stream being sampled was recorded on a field datasheet along with other observations about the sample area (see Appendix 2). Laboratory Analyses Water samples were delivered to AquaLab in Twain Harte, CA, a State-certified analytical laboratory. All water samples were tested for E. coli, total coliform, and fecal coliform bacteria within the 6-hour holding time specified in the QAPP, using Multiple Tube Fermentation (Most Probable Number/100 mL). The detection limit using this method of analysis is two fecal
5
coliform organisms/100 mL of water. The detection maximum using this method of analysis is 1,600 fecal coliform organism/100 mL of water. A copy of AquaLab’s Quality Assurance SOP for Multiple Tube Fermentation is on file at the CSERC office and included in appendix 5. The analytical methods utilized by this laboratory are specified in Standard Methods For the Examination of Water and Wastewater (19th Edition). Data Analysis The bacteria results were compared to the relevant water quality standards contained in the Central Valley Regional Water Quality Control Board’s Water Quality Control Plan for the Sacramento and San Joaquin River Basins (“Basin Plan”)7. Water contact recreation is a designated beneficial use of the receiving waters included in this study. To protect that beneficial use, the Basin Plan specifies (in part) the following numeric objectives (i.e., standards):
In waters designated for contact recreation (REC-1), the fecal coliform concentration based on a minimum of not less than five samples for any 30-day period shall not exceed a geometric mean of 200/100 ml, nor shall more than ten percent of the total number of samples taken during any 30-day period exceed 400/100 ml. (Basin Plan at III-3)
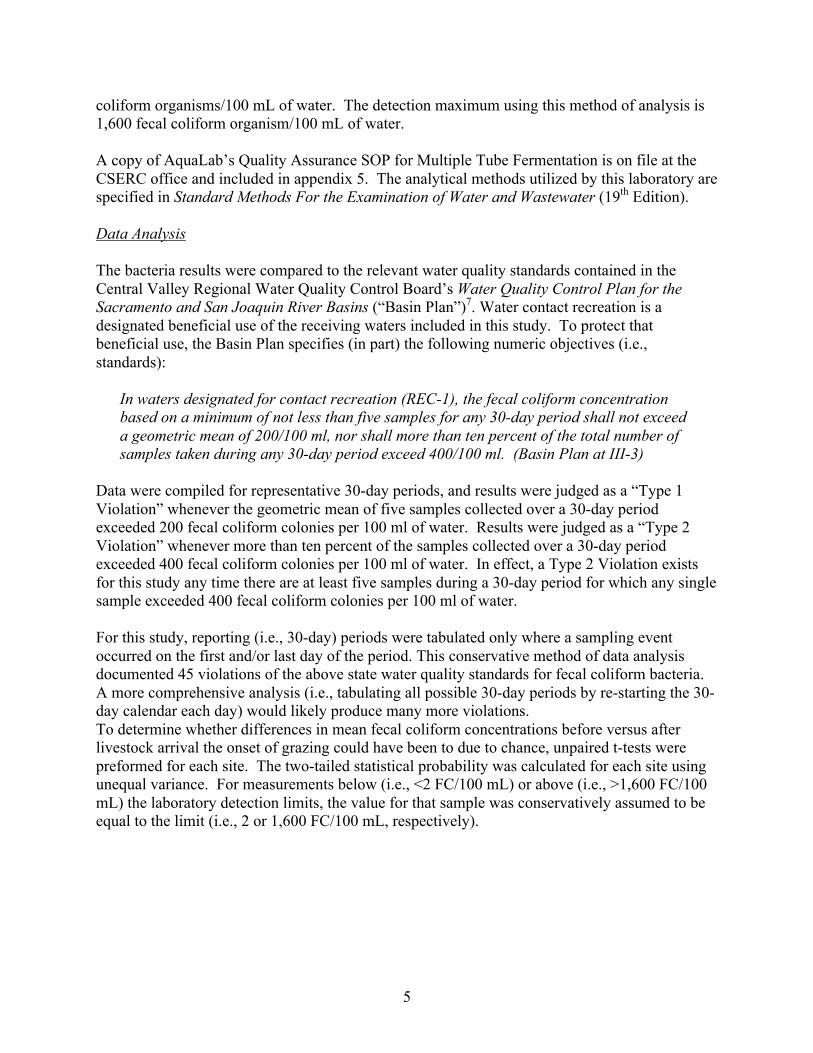
Data were compiled for representative 30-day periods, and results were judged as a “Type 1 Violation” whenever the geometric mean of five samples collected over a 30-day period exceeded 200 fecal coliform colonies per 100 ml of water. Results were judged as a “Type 2 Violation” whenever more than ten percent of the samples collected over a 30-day period exceeded 400 fecal coliform colonies per 100 ml of water. In effect, a Type 2 Violation exists for this study any time there are at least five samples during a 30-day period for which any single sample exceeded 400 fecal coliform colonies per 100 ml of water. For this study, reporting (i.e., 30-day) periods were tabulated only where a sampling event occurred on the first and/or last day of the period. This conservative method of data analysis documented 45 violations of the above state water quality standards for fecal coliform bacteria. A more comprehensive analysis (i.e., tabulating all possible 30-day periods by re-starting the 30-day calendar each day) would likely produce many more violations. To determine whether differences in mean fecal coliform concentrations before versus after livestock arrival the onset of grazing could have been to due to chance, unpaired t-tests were preformed for each site. The two-tailed statistical probability was calculated for each site using unequal variance. For measurements below (i.e., <2 FC/100 mL) or above (i.e., >1,600 FC/100 mL) the laboratory detection limits, the value for that sample was conservatively assumed to be equal to the limit (i.e., 2 or 1,600 FC/100 mL, respectively).
6
Results Comparison to State Standards Below are tables that provide results for each of the 45 documented violations of state water quality standards. Violation #1 (Type 1 Violation) — Site: Barn Meadow 1 30-day period: July 2, 2009 – July 31, 2009
Date FC / 100ml 7/9/09 300 7/16/09 300 7/21/09 240 7/23/09 300 7/28/09 300 7/28/09 >1600 7/31/09 500
Geo Mean 397 Violation #2 (Type 1 Violation) — Site: Barn Meadow 1 30-day period: July 9, 2009 – August 7, 2009
Date FC / 100ml 7/9/09 300 7/16/09 300 7/21/09 240 7/23/09 300 7/28/09 300 7/28/09 >1600 7/31/09 500 8/5/09 170
Geo Mean 357 Violation #3* (Type 2 Violation) — Site: Barn Meadow 1 30-day period: July 1, 2009 – July 30, 2009
Date FC / 100ml 7/1/09 2 7/9/09 300 7/16/09 300 7/21/09 240 7/23/09 300 7/28/09 300 7/28/09* >1600
7
Violation #4* (Type 2 Violation) — Site: Barn Meadow 1 30-day period: July 9, 2009 – August 7, 2009
Date FC / 100ml 7/9/09 300 7/16/09 300 7/21/09 240 7/23/09 300 7/28/09 300 7/28/09* >1600 7/31/09* 500 8/5/09 240
Violation #5* (Type 2 Violation) — Site: Barn Meadow 1 30-day period: July 16, 2009 – August 14, 2009
Date FC / 100ml 7/16/09 300 7/21/09 240 7/23/09 300 7/28/09 300 7/28/09* >1600 7/31/09* 500 8/5/09 240
Violation #6* (Type 2 Violation) — Site: Barn Meadow 1 30-day period: July 21, 2009 – August 19, 2009
Date FC / 100ml 7/21/09 240 7/23/09 300 7/28/09 300 7/28/09* >1600 7/31/09* 500 8/5/09 240
Violation #7* (Type 2 Violation) — Site: Barn Meadow 1 30-day period: July 23, 2009 – August 21, 2009
Date FC / 100ml 7/23/09 300 7/28/09 300 7/28/09* >1600 7/31/09* 500 8/5/09 240
8
Violation #8 (Type 1 Violation) — Site: Barn Meadow 2 30-day period: July 16, 2009 – August 14, 2009
Date FC / 100ml 7/16/09 500 7/21/09 240 7/23/09 220 7/28/09 500 7/28/09 170 7/31/09 300 8/5/09 240
Geo Mean 287 Violation #9* (Type 2 Violation) — Site: Barn Meadow 2 30-day period: June 25, 2009 – July 24, 2009
Date FC / 100ml 6/25/09 <2 7/1/09 2 7/16/09* 500 7/21/09 240 7/23/09 220
Violation #10* (Type 2 Violation) — Site: Barn Meadow 2 30-day period: July 1, 2009 – July 30, 2009
Date FC / 100ml 7/1/09 2 7/16/09* 500 7/21/09 240 7/23/09 220 7/28/09* 500 7/28/09 170
Violation #11* (Type 2 Violation) — Site: Barn Meadow 2 30-day period: July 16, 2009 – August 14, 2009
Date FC / 100ml 7/16/09* 500 7/21/09 240 7/23/09 220 7/28/09* 500 7/28/09 170 7/31/09 300 8/5/09 240
9
Violation #12* (Type 2 Violation) — Site: Barn Meadow 2 30-day period: July 21, 2009 – August 19, 2009
Date FC / 100ml 7/21/09 240 7/23/09 220 7/28/09* 500 7/28/09 170 7/31/09 300 8/5/09 240
Violation #13* (Type 2 Violation) — Site: Barn Meadow 2 30-day period: July 23, 2009 – August 21, 2009
Date FC / 100ml 7/23/09 220 7/28/09* 500 7/28/09 170 7/31/09 300 8/5/09 240
Violation #14* (Type 2 Violation) — Site: Bull Run Meadow 30-day period: July 1, 2009 – July 30, 2009
Date FC / 100ml 7/1/09 30 7/9/09 300 7/16/09 70 7/21/09 170 7/23/09 80 7/28/09* 500
Violation #15* (Type 2 Violation) — Site: Bull Run Meadow 30-day period: July 9, 2009 – August 7, 2009
Date FC / 100ml 7/9/09 300 7/16/09 70 7/21/09 170 7/23/09 80 7/28/09* 500 7/28/09 170 8/5/09 4 8/5/09 11
10
Violation #16* (Type 2 Violation) — Site: Bull Run Meadow 30-day period: July 16, 2009 – August 14, 2009
Date FC / 100ml 7/16/09 70 7/21/09 170 7/23/09 80 7/28/09* 500 7/28/09 170 8/5/09 4 8/5/09 11 8/13/09 70
Violation #17* (Type 2 Violation) — Site: Bull Run Meadow 30-day period: July 21, 2009 – August 19, 2009
Date FC / 100ml 7/21/09 170 7/23/09 80 7/28/09* 500 7/28/09 170 8/5/09 4 8/5/09 11 8/13/09 70
Violation #18* (Type 2 Violation) — Site: Bull Run Meadow 30-day period: July 23, 2009 – August 21, 2009
Date FC / 100ml 7/23/09 80 7/28/09* 500 7/28/09 170 8/5/09 4 8/5/09 11 8/13/09 70
Violation #19* (Type 2 Violation) — Site: Bull Run Meadow 30-day period: July 28, 2009 – August 26, 2009
Date FC / 100ml 7/28/09* 500 7/28/09 170 8/5/09 4 8/5/09 11 8/13/09 70
11
Violation #20 (Type 1 Violation) — Site: Upper Fiddlers Green Meadow 30-day period: July 14, 2009 – August 12, 2009
Date FC / 100ml 7/16/09 80 7/21/09 300 7/21/09 130 7/23/09 80 7/28/09 >1600 7/31/09 170
Geo Mean 202 Violation #21* (Type 2 Violation) — Site: Upper Fiddlers Green Meadow 30-day period: July 1, 2009 – July 30, 2009
Date FC / 100ml 7/1/09 23 7/9/09 23 7/16/09 80 7/21/09 300 7/21/09 130 7/23/09 80 7/28/09* >1600
Violation #22* (Type 2 Violation) — Site: Upper Fiddlers Green Meadow 30-day period: July 9, 2009 – August 7, 2009
Date FC / 100ml 7/9/09 23 7/16/09 80 7/21/09 300 7/21/09 130 7/23/09 80 7/28/09* >1600 7/31/09 170
12
Violation #23* (Type 2 Violation) — Site: Upper Fiddlers Green Meadow 30-day period: July 16, 2009 – August 14, 2009
Date FC / 100ml 7/16/09 80 7/21/09 300 7/21/09 130 7/23/09 80 7/28/09* >1600 7/31/09 170 8/13/09 30
Violation #24* (Type 2 Violation) — Site: Upper Fiddlers Green Meadow 30-day period: July 21, 2009 – August 19, 2009
Date FC / 100ml 7/21/09 300 7/21/09 130 7/23/09 80 7/28/09* >1600 7/31/09 170 8/13/09 30
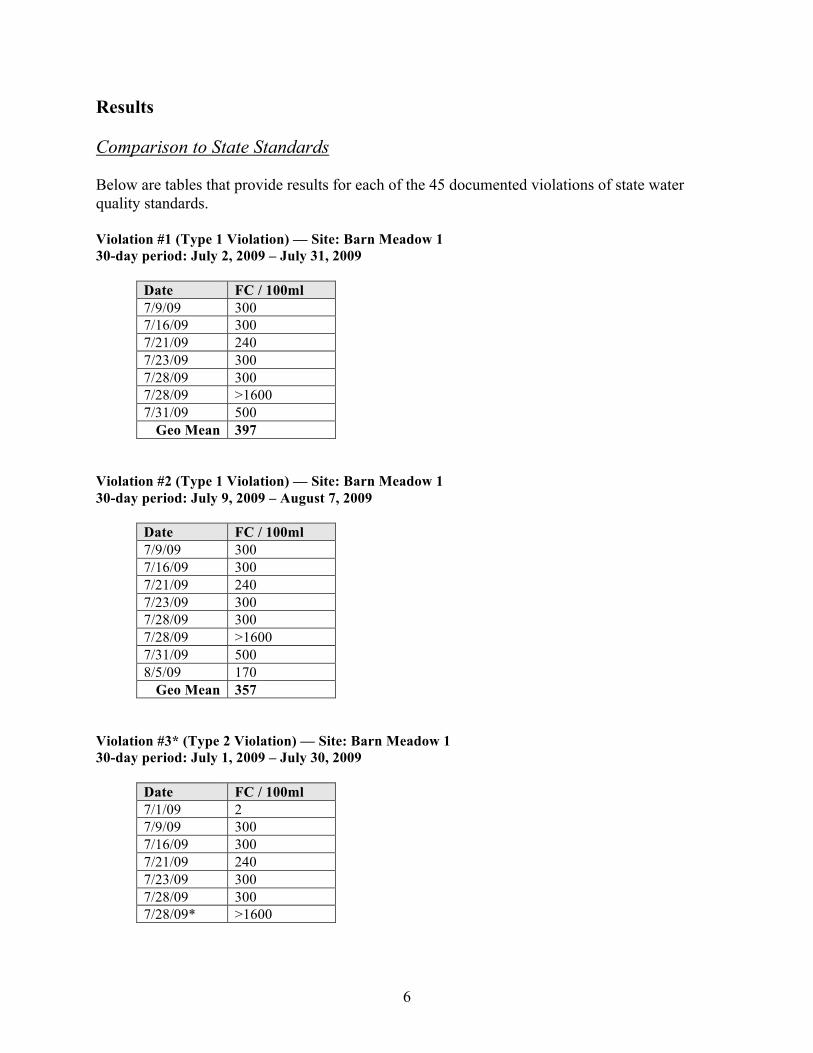
Violation #25 (Type 1 Violation) — Site: Lower Round Meadow 30-day period: June 25, 2009 – July 24, 2009
Violation #37* (Type 2 Violation) — Site: Lower Round Meadow 30-day period: July 1, 2009 – July 30, 2009
Date FC / 100ml 7/1/09 80 7/9/09* 900 7/14/09* 900 7/16/09* 500 7/21/09 300 7/23/09 300 7/23/09 300 7/24/09* 900
Violation #38* (Type 2 Violation) — Site: Lower Round Meadow 30-day period: July 9, 2009 – August 7, 2009
Date FC / 100ml 7/9/09* 900 7/14/09* 900 7/16/09* 500 7/21/09 300 7/23/09 300 7/23/09 300 7/24/09* 900 7/28/09 300
17
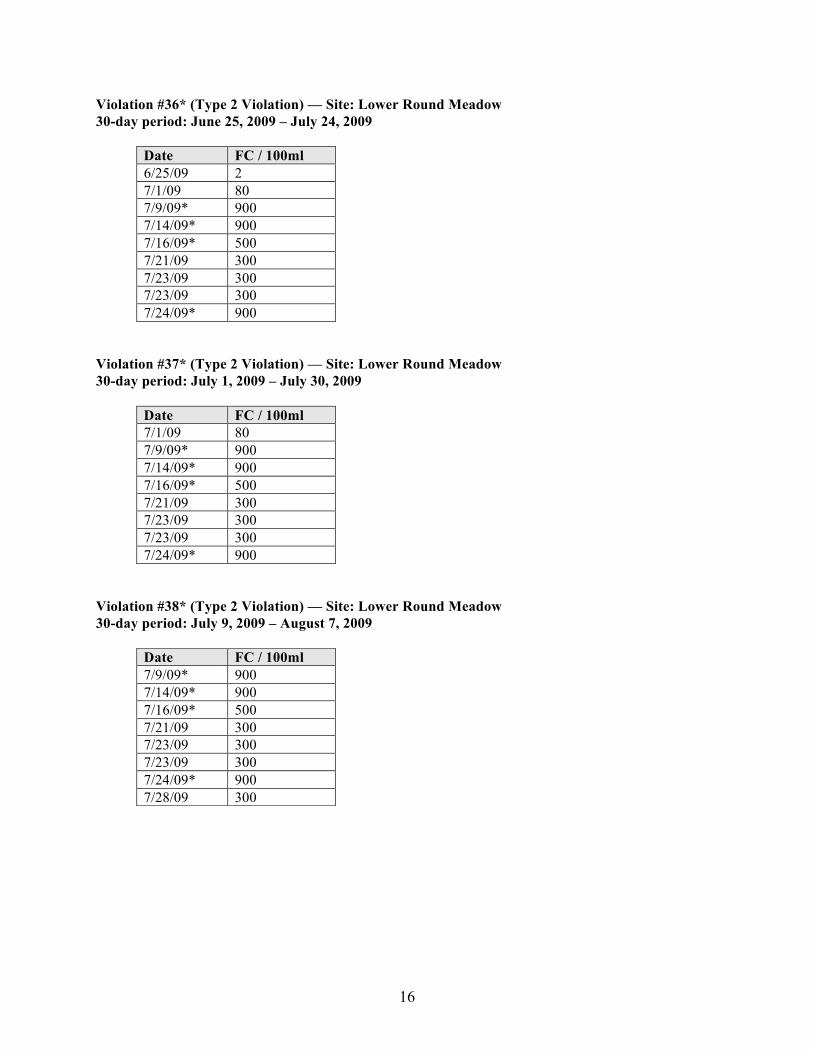
Violation #39* (Type 2 Violation) — Site: Lower Round Meadow 30-day period: July 14, 2009 – August 12, 2009
Violation #40* (Type 2 Violation) — Site: Lower Round Meadow 30-day period: July 16, 2009 – August 14, 2009
Violation #41* (Type 2 Violation) — Site: Lower Round Meadow 30-day period: July 21, 2009 – August 19, 2009
Violation #42 (Type 1 Violation) — Site: Rose Creek 30-day period: August 27, 2009 – September 25, 2009
Date FC / 100ml 8/27/09 300 9/4/09 900 9/8/09 >1600 9/8/09 >1600 9/17/09 500 9/23/09 220
Geo Mean 651
Date FC / 100ml 7/14/09* 900 7/16/09* 500 7/21/09 300 7/23/09 300 7/23/09 300 7/24/09* 900 7/28/09 300
Date FC / 100ml 7/16/09* 500 7/21/09 300 7/23/09 300 7/23/09 300 7/24/09* 900 7/28/09 300
Date FC / 100ml 7/21/09 300 7/23/09 300 7/23/09 300 7/24/09* 900 7/28/09 300
18
Violation #43 (Type 1 Violation) — Site: Rose Creek 30-day period: September 4 – October 3, 2009
Date FC / 100ml 9/4/09 900 9/8/09 >1600 9/8/09 >1600 9/17/09 500 9/23/09 220
Geo Mean 760 Violation #44* (Type 2 Violation) — Site: Rose Creek 30-day period: August 27, 2009 – September 25, 2009
Date FC / 100ml 8/27/09 300 9/4/09* 900 9/8/09* >1600 9/8/09* >1600 9/17/09* 500 9/23/09 220
Violation #45* (Type 2 Violation) — Site: Rose Creek 30-day period: September 4, 2009 – October 3, 2009
Date FC / 100ml 9/4/09* 900 9/8/09* >1600 9/8/09* >1600 9/17/09* 500 9/23/09 220
19
Comparison of Data From Control to Livestock Presence There was a rapid rise in the fecal coliform concentration immediately after commencement of cattle grazing at all four main sample sites (i.e., where samples were collected “before” grazing and “after livestock arrival” when grazing was taking place in the sample vicinity). At Lower Round Meadow, the mean (average) fecal coliform count prior to livestock presence was 13, whereas after cows arrived, every result was 300 or higher, with a mean (average) result of 550 (n = 8; geometric mean = 483). At Upper Fiddlers Green, the highest fecal coliform count prior to cattle being present was 23. Once cattle arrived, results ranged from 80 to >1600, and the mean (average) result was more than 340 (n = 7; geometric mean = 202). At Bull Run, the highest fecal coliform count prior to livestock entry was 30. After livestock arrived, the mean (average) result was more than 140 (n = 10; geometric mean = 76), with two samples of 300 or higher. At Barn Meadow, fecal coliform levels were 8 bacteria colonies or fewer per 100 ml of water before livestock arrived. In the 15 subsequent samples collected after grazing commenced, the fecal coliform counts ranged from 170 to >1600. The mean (average) of fecal coliform results collected after livestock arrived at Barn Meadow was more than 460 at site #BM1, and more than 300 at site #BM2. The geometric means of samples collected during grazing were 357 and 287, respectively.
20
Figure 1 (upper chart) depicts the results for mean fecal coliform concentrations (for the four sites discussed above) “before grazing” and “after livestock arrived “at the site:
Figure 1 (lower chart) depicts the mean fecal coliform conentration “before grazing” only, by site:
Figure 1. The bar charts above show mean fecal coliform concentrations “before” (control) and “after” commencement of grazing (upper chart), and “before grazing” only (lower chart). Error bars are the 95% confidence intervals for each mean (including, on the upper chart, all samples at Upper Fiddlers Green Meadow after grazing). Note the more than one order of magnitude difference in scale between the y-axes of the two charts.
Note: The LRM samples were taken from stream-fed water as it passed through Lower Round Meadow. The stream joined with Bell Creek a short distance below the meadow. After the Bull Run sample site, this stream had the next highest streamflow when sampling began. The relative flow was noted to diminish throughout the duration of the study (see Appendix 1). CSERC staff often observed livestock within or in the local general area of Lower Round Meadow; correspondingly, this sample site had consistently high fecal coliform results.
22
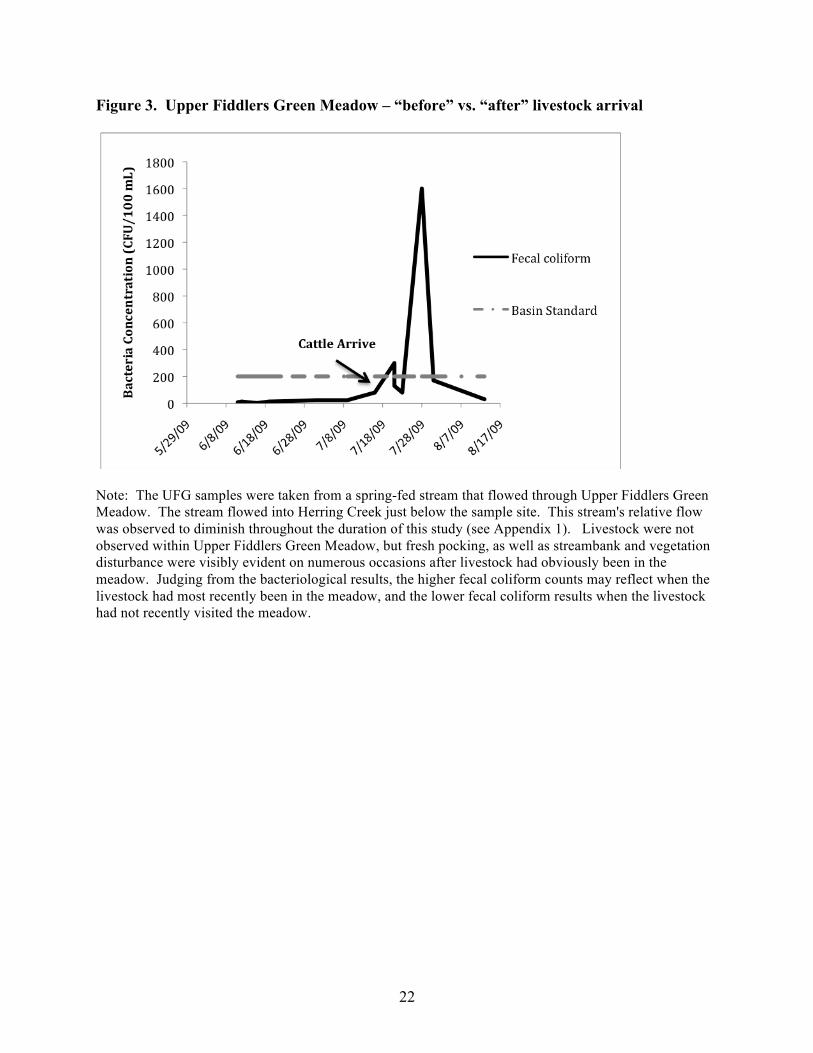
Figure 3. Upper Fiddlers Green Meadow – “before” vs. “after” livestock arrival
Note: The UFG samples were taken from a spring-fed stream that flowed through Upper Fiddlers Green Meadow. The stream flowed into Herring Creek just below the sample site. This stream's relative flow was observed to diminish throughout the duration of this study (see Appendix 1). Livestock were not observed within Upper Fiddlers Green Meadow, but fresh pocking, as well as streambank and vegetation disturbance were visibly evident on numerous occasions after livestock had obviously been in the meadow. Judging from the bacteriological results, the higher fecal coliform counts may reflect when the livestock had most recently been in the meadow, and the lower fecal coliform results when the livestock had not recently visited the meadow.
23
Figure 4. Bull Run Meadow – “before” vs. “after” livestock arrival
Note: The Bull Run sample site at Cow Creek had the highest amount of discharge of all waters sampled. Cow Creek also experienced the least amount of flow reduction relative to the first sample taken (see Appendix 1), due to a number of seeps and springs located above the sample site that flowed directly into Cow Creek. Livestock periodically left the Bull Run Meadow drainage basin to move to a separate meadow area near a site where a wildlife photo-detection station was maintained by CSERC staff. Then, after a few days the livestock moved back down into the Bull Run Meadow complex again. The higher fecal coliform sample results may reflect periods when the livestock were spending time directly within the Bull Run Meadow complex. Conversely, the lower fecal coliform results may reflect periods when the livestock were not actively present and grazing within the Bull Run Meadow complex.
24
Figure 5. BM1 – “before” vs. “after” livestock arrival
Figure 6. BM2 – “before” vs. “after” livestock arrival
Note: These charts document the rise in fecal coliform concentration after the arrival of livestock. The original Barn Meadow sample site was fed by melting snowpack, which resulted in the sample site becoming dry before livestock were released into the site. The downstream sample sites BM1 and BM2 were fed by seeps and springs below the original BM sample site. The relative flows at BM1 and BM2 were gradually diminished throughout the duration of the project (see Appendix 1). CSERC staff often observed livestock in the general vicinity of BM1 (Figure 2. upper graph) and/or BM2 (Figure 3. lower graph); both sample sites had consistently high fecal coliform results after the arrival of livestock.
25
Rose Creek Sample Site At the Rose Creek site, water sampling on five days of the summer grazing season revealed consistent violations of water quality standards. The geometric mean of fecal coliform bacteria detected in six water quality samples (one sample was a duplicate) at Rose Creek was 641, the highest level of contamination detected by this study. (The Rose Creek site is not included in Figure 1 because no samples were collected there prior to the onset of grazing. Cows were already present at Rose Creek at the time of the first visit.) Ungrazed Control Site In comparison to the significant increase in fecal coliform colonies quantified at the streams with grazing once livestock were present, the fecal coliform concentration at Bourland Meadow (the control site for the four grazing use sites) remained consistently low and within standard limits throughout the same time period that the grazed samples were being collected. Eight water samples collected at Bourland Meadow produced concentration results ranging from <2 to a high of 17. The geometric mean of fecal coliform results from Bourland Meadow was 4. As noted previously, Bourland Meadow is managed as a Research Natural Area that does not have any permitted livestock grazing. Otherwise, the stream at Bourland Meadow experienced the same weather conditions, exposure to wildlife use, dispersed recreation, and other environmental influences as the four sample streams that experienced violations of water quality standards.
26
Figure 7. Rose Creek – Cattle Present
Note: The RC samples were taken from stream and spring/seep-fed water within the creek where the relative flow remained steady. Cows were already present at the time of the first visit. Accordingly, no “before” grazing samples were collected at this site.
mL)
27
Figure 8. BoM – Control Site (no grazing)
Note: The Bourland Meadow samples were taken from the headwaters of Bourland Creek, which is fed by seeps and springs along with melting snow. The relative flow at this sample site was also noted to diminish throughout the duration of this study (see Appendix 1).
28
Tributary Spring to Rose Creek Supplemental water sampling was also performed separately on a tributary spring to Rose Creek where the surrounding area had been heavily grazed and disturbed by cattle. An “above” and “below” sample was collected to provide a comparison. The “below” sample was collected first, at a point approximately 100 feet below the source of the spring, in an area with considerable evidence of grazing; then the “above” sample was collected upstream, close to where the water flowed out of the ground. The sampling revealed that the “below” sample in the grazed area along this tributary spring to Rose Creek had a fecal coliform concentration of 300/100 mL, while the “above” sample at the source of the spring had a fecal coliform concentration of 4/100 mL. This comparison illustrates the impacts to water quality where livestock are allowed unrestricted access to springs, seeps, and wetlands. Weather The weather was stable throughout the sampling period. Winter snows had melted prior to sample collections. Only one storm capable of producing runoff (a thunderstorm) occurred during the course of this study, and that storm occurred on June 3, 2009, before cattle arrived for grazing. Thus, the substantial increases in bacteria concentrations documented in surface waters after the arrival of livestock could not have been caused, even in part, by inputs from overland or storm runoff.
29
Statistical Analyses The statistical analysis of fecal coliform concentrations before and after livestock arrival, the onset of grazing is summarized in Table 2. With only one exception, t-tests showed that the mean concentration of fecal coliform bacteria was significantly higher (p < 0.05) at all sites after the onset of grazing. The only exception was at Upper Fiddlers Green Meadow, which can be explained. All of the results during grazing at Upper Fiddlers Green (range 30 to >1,600) were higher than the highest measurement before grazing (i.e., 23 FC/100 mL). One of the samples collected after the onset of grazing at Upper Fiddlers Green had a fecal coliform concentration >1,600 colonies/100 mL. This caused the standard deviation at this site after the onset of grazing to exceed the mean. Thus, the mean before and after livestock arrival concentrations at this site were not significantly different based on the t-tests, even though they differed by an order of magnitude (i.e., 13 vs. 341 FC/100 mL, respectively). If the 1,600 FC/100 mL result is excluded from the calculation, then the before/after difference was highly significant at this site as well (p < 0.028). For the purposes here (i.e., assessing whether the higher mean after the onset of grazing could have been due to chance), this latter comparison is appropriate, because the sample that was >1,600 FC/100 mL contributed to an even greater difference in the means, which supports the hypothesis that fecal coliform concentrations increased significantly when cows were present. In all cases, the mean concentrations of fecal coliform bacteria after the onset of grazing were one or two orders of magnitude higher than before grazing. These t-tests demonstrate that these differences were statistically significant, and therefore unlikely to have occurred due to random chance. Stream name cows n mean std dev p Barn Meadow Before 7 4 3 Barn Meadow After arrival 15 392 352 0.001 Bull Run Meadow Before 8 12 8 Bull Run Meadow After arrival 10 141 156 0.028 Upper Fiddlers Green Mdw Before 8 13 8 Upper Fiddlers Green Mdw After arrival 7 (6) 341 (132) 562 (95) 0.17 (0.028) Lower Round Meadow Before 10 13 25 Lower Round Meadow After arrival 8 550 298 0.001 Bourland Meadow Before 8 6 6 Rose Creek After arrival 6 853 624
Table 2. Summary statistics reflect fecal coliform concentration at each site before and after the onset of grazing. Note that the standard deviation at Upper Fiddlers Green Meadow for all “after” grazing samples exceeded the mean, due to one result >1,600 FC/100 mL. Data for the calculations excluding that measurement are included in parentheses. Legend: “cows” = grazing status (i.e., results from before vs. after presence of cows); “n” = the number of samples; “std dev” = standard deviation.
30
Supplemental Concern: Turbidity While collecting the water samples for bacteriological analysis, turbidity samples were also collected. The water quality violations tied to turbidity are discussed in Appendix 6. Conclusion The results presented here document more than forty individual violations of California’s regulatory water quality standards for bacteria within range allotments where water sampling was performed during the 2009 summer/fall season. The 45 individual violations prove a failure of Best Management Practices to comply with state water quality standards. Statistical analysis confirmed that the increases in bacteria concentrations during grazing are highly significant when compared to pre-grazing levels. This study documents that BMPs applied by the Stanislaus NF are insufficient to meet state water quality standards, and that significant pollution of surface waters is resulting from cattle grazing permitted on National Forest System lands. Further, the levels and methods of livestock grazing in the sampled areas are not unlike practices throughout the Stanislaus NF and other public lands where livestock grazing occurs in the Sierra Nevada. These findings confirm earlier studies5 indicating that widespread pollution of surface waters is occurring due to livestock grazing on National Forest System lands in the Sierra Nevada, and demonstrate the need for: (1) changes in any permissible livestock grazing activities to eliminate or reduce contamination of surface waters, (2) increased monitoring to assess compliance with water quality standards, and (3) elimination of grazing in areas where traditional livestock management techniques such as fencing and herding have not assured compliance with water quality standards.
Bacteria in Backcountry Lakes and Streams in the Sierra Nevada Mountains: A 5-Year Study. Wilderness and Environmental Medicine, 19:82-90
6. Myers, L. 2009. Surface Water Ambient Monitoring Project in the Stanislaus National
Forest Quality Assurance Project Plan (QAPP). Central Sierra Environmental Resource Center (CSERC). Twain Harte, CA. August 2009. See: http://www.cserc.org/main/news/news_briefs/2010-5.html
7. State of California. 2007. Water Quality Control Plan for the Sacramento and San Joaquin
River Basins. California Regional Water Quality Control Board, Central Valley Region, Sacramento, CA. October 2007. Available at: http://www.waterboards.ca.gov/centralvalley/water_issues/basin_plans/sacsjr.pdf
8. USDA 2006. Environmental Assessment; Stanislaus National Forest Rangeland Allotment
Phase I; Forest Service, Stanislaus National Forest, Sonora, CA. (Project Map) http://www.fs.fed.us/r5/stanislaus/projects/
32
Appendices 1. Bacteria/NTU/Relative Flow Data Results (in table format)
1. Lower Round Meadow (LRM) 2. Upper Fiddlers Green (UFG) 3. Bull Run (BR) 4. Barn Meadow (BM) 5. Rose Creek (RC) 6. Bourland Meadow (BoM)
2. Field datasheets 3. Copies of Bacteria Results from Laboratory/Chain-of-Custody forms
1. Vicinity Area Map7 2. LRM – Google Earth image 3. Bell Meadow/Bear Lake Allotment7 4. UFG – Google Earth image 5. BR – Google Earth image 6. Herring Creek Allotment7 7. BM – Google Earth image 8. Long Valley/Eagle Meadow Allotment7 9. RC – Google Earth image 10. TRC “above”/ “below” – Google Earth image 11. BoM – Google Earth image
See the accompanying disk for Appendices 2. – 5. and 7. See below for Appendices 1., 6. and 7.1 Appendix 1. Summary (in table format) of total coliform, fecal coliform, E.coli, turbidity and relative flow for each site sampled. Appendix 2. Field datasheets for each sample taken for this study, datasheets include: observations about the weather and stream, pH, specific conductance, water temperature, time the bacteria sample was collected, any unusual observations, and pictures of the sample site. Appendix 3. Copy of the Chain of Custody forms that went with the water samples to AquaLab. The results for total coliform, fecal coliform, E. coli, and turbidity were recorded on this form by lab personnel. Appendix 4. Copy of CSERC’s Quality Assurance Project Plan for this study, includes project description, problem statement, sampling process design, quality control, etcetera. The QAPP can also be viewed at: http://www.cserc.org/main/news/news_briefs/2010-5.html Appendix 5. Copy of AquaLab’s Quality Assurance Plan for Multiple Tube Fermentation.
33
Appendix 6. Water quality concerns tied to turbidity samples taken while sampling for bacteria contamination. Appendix 7. Contains a vicinity map, and maps for each sample site (and the legal description of the sample locations). ACKNOWLEDGMENTS The author would like to thank Cathy Behee and the staff at AquaLab for ensuring that short holding times were met for all laboratory analyses; Julia Stephens, Rebecca Cremeen and Tracy Knopf for assistance with field collections; Erick Burres of the State of California’s Clean Water Team for providing technical advice for the QAPP; the High Sierra Hikers Association for contributing funds to help defray equipment and lab costs; and John Buckley of CSERC for critical review of the manuscript.
34
Appendix 1. Bacteria/NTU/Relative Flow Data Results (in table format) 1. Lower Round Meadow (LRM) Before Livestock Sample # Date Total col. Fecal col. E. coli NTU Relative Flow 1) 5/27/09 14 2 2 0.54 Medium 2) 5/28/09 7 2 2 0.39 Medium Duplicate 5/28/09 7 <2 <2 - Medium 3) 6/1/09 80 4 <2 0.59 Med/Low 4) 6/2/09 30 30 30 0.49 Med/Low 5)* 6/4/09 70 2 2 0.72 Medium 6) 6/12/09 14 <2 <2 0.78 Med/Low 7) 6/19/09 17 2 2 0.19 Low 8) 6/25/09 11 2 2 1.3 Low/Very Low 9) 7/1/09 220 80 80 1.2 Low/Very Low *Thunderstorm with rain night before sample After Livestock Arrival Sample # Date Total col. Fecal col. E. coli NTU Relative Flow 1) 7/9/09 900 900 900 3.05 Very Low 2) 7/14/09 900 900 900 2.1 Very Low 3) 7/16/09 500 500 500 2.0 Very Low 4) 7/21/09 300 300 170 2.9 Very Low 5) 7/23/09 500 300 300 3.9 Very Low 6) 7/23/09 300 300 300 3.9 Very Low 7) 7/24/09 900 900 140 4.1 Very Low 8) 7/28/09 300 300 300 4.1 Very Low Sample Date Total col. Fecal col. E. coli Field blank 7/16/09 <2 <2 <2 Summary of sample location: These samples were taken from a tributary stream of Bell Creek, where it flows through Lower Round Meadow (which is within the Bell Meadow/Bear Lake Rangeland Allotment). Bell Creek is entirely within the Tuolumne River watershed, and flows into the Tuolumne River via the Clavey River.
35
2. Upper Fiddlers Green (UFG) Before Livestock Sample # Date Total col. Fecal col. E. coli NTU Relative Flow 1) 6/11/09 300 8 8 0.44 Med/Low 2) 6/12/09 50 13 13 0.35 Med/Low 3) 6/15/09 140 4 4 1.3 Med/Low 4) 6/16/09 50 2 2 0.32 Med/Low 5) 6/19/09 130 13 13 1.3 Med/Low 6) 6/25/09 30 17 17 0.48 Med/Low 7) 7/1/09 280 23 23 0.63 Low 8) 7/9/09 220 23 23 0.78 Low After Livestock Arrival Sample # Date Total col. Fecal col. E. coli NTU Relative Flow 1) 7/16/09 >1600 80 80 1.6 Low 2) 7/21/09 >1600 300 170 1.4 Low Duplicate 7/21/09 >1600 130 80 1.8 Low 3) 7/23/09 >1600 80 80 0.98 Low 4) 7/28/09 >1600 >1600 240 0.99 Low 5) 7/31/09 >1600 170 170 1.0 Very Low 6) 8/13/09 >1600 30 30 1.8 Very Low Sample Date Total col. Fecal col. E. coli Field blank 7/28/09 <2 <2 <2 Summary of sample location: These samples were taken below Upper Fiddlers Green Meadow from a tributary stream of Herring Creek (which is within the Herring Creek Rangeland allotment). Herring Creek is entirely within the Stanislaus River watershed, and flows into the South Fork of the Stanislaus River.
36
3. Bull Run (BR) Before Livestock Sample # Date Total col. Fecal col. E. coli NTU Relative Flow 1) 6/9/09 110 8 8 1.5 Medium 2) 6/11/09 50 8 4 1.5 Medium 3) 6/12/09 70 7 7 1.6 Medium 4) 6/15/09 70 8 8 0.33 Medium 5) 6/16/09 27 11 7 2.1 Medium Duplicate 6/16/09 17 11 4 0.26 Medium 6) 6/25/09 17 11 11 1.6 Medium 7) 7/1/09 70 30 30 1.4 Med/Low After Livestock Arrival Sample # Date Total col. Fecal col. E. coli NTU Relative Flow 1) 7/9/09 300 300 300 1.58 Med/Low 2) 7/16/09 90 70 70 2.0 Med/Low 3) 7/21/09 170 170 110 5.2 Med/Low 4) 7/23/09 130 80 50 1.6 Med/Low 5) 7/28/09 1600 500 500 3.1 Med/Low Duplicate 7/28/09 300 170 130 3.2 Med/Low 6) 8/5/09 22 4 2 1.2 Med/Low Duplicate 8/5/09 30 11 11 1.3 Med/Low 7) 8/13/09 70 70 70 1.1 Med/Low 8) 8/28/09 50 30 30 1.4 Med/Low Sample Date Total col. Fecal col. E. coli Field blank 8/5/09 <2 <2 <2 Summary of sample location: These samples were taken below Bull Run Meadow from a major tributary of Cow Creek (which is within the Herring Creek Rangeland Allotment). Cow Creek is entirely within the Stanislaus River watershed, and flows into the Lower Middle Fork of the Stanislaus River.
37
4. Barn Meadow (BM) Before Livestock Sample # Date Total col. Fecal col. E. coli NTU Relative Flow 1) 6/11/09 500 2 2 0.23 Medium 2) 6/12/09 300 4 4 0.21 Medium 3) 6/15/09 500 8 4 0.19 Med/Low 4) 6/16/09 500 7 7 0.22 Med/Low 5) 6/19/09 900 2 2 0.33 Low 6) 6/25/09 >1600 <2 <2 0.35 Low 7) 7/1/09 >1600 2 2 0.29 Very Low/Low Original sample site dry 7/9/09, moved sample downstream. (BM1) After livestock Arrival Sample # Date Total col. Fecal col. E. coli NTU Relative Flow 1) 7/9/09 300 300 240 2.43 Low 2) 7/16/09 500 300 300 2.8 Low 3) 7/21/09 240 240 130 2.5 Very Low/Low 4) 7/23/09 500 300 300 3.0 Very Low/Low 5) 7/28/09 500 300 300 2.8 Very Low/Low Duplicate 7/28/09 >1600 >1600 500 3.5 Very Low/Low 6) 7/31/09 500 500 240 2.5 Very Low 7) 8/5/09 500 170 110 8.7 Very Low 2nd new site, more representative of original site located above BM1. (BM2) Sample # Date Total col. Fecal col. E. coli NTU Relative Flow 1) 7/16/09 500 500 500 1.8 Low 2) 7/21/09 240 240 240 1.6 Very Low/Low 3) 7/23/09 500 220 220 1.0 Very Low/Low 4) 7/28/09 1600 500 300 1.0 Very Low/Low 5) 7/31/09 170 170 170 1.0 Very Low/Low Duplicate 7/31/09 300 300 300 1.1 Very Low/Low 6) 8/5/09 300 240 130 0.96 Very Low Sample Date Total col. Fecal col. E. coli Field blank 7/16/09 <2 <2 <2 Summary of sample location: These samples were taken below Barn Meadow from a tributary stream of Niagara Creek (which is within the Long Valley/Eagle Meadow Rangeland Allotment). Niagara Creek is entirely within the Stanislaus River watershed, and flows into Donnel Lake via the Middle Fork of the Stanislaus River.
38
5. Rose Creek (RC)* Livestock Present Sample # Date Total col. Fecal col. E. coli NTU Relative Flow 1) 8/27/09 500 300 300 1.1 Low 2) 9/4/09 900 900 900 1.2 Low 3) 9/8/09 >1600 >1600 >1600 4.0 Low Duplicate 9/8/09 >1600 >1600 500 4.0 Low 4) 9/17/09 500 500 300 1.3 Low 5) 9/23/09 500 220 220 1.3 Low *Early season/before grazing sample were not collected for this sample site. Sample Date Total col. Fecal col. E. coli Field blank 9/4//09 <2 <2 <2 Summary of site location: These samples were taken from Rose Creek, accessed by Forest Service Road 4N16. Rose Creek is entirely within the Stanislaus River watershed, and flows into the Lower Middle Fork of the Stanislaus River. “Below” and “above” livestock disturbance samples of tributary seep to RC* Sample # Date Total col. Fecal col. E. coli NTU Relative Flow Above 9/4/09 30 4 4 1.4 Low Below 9/4/09 300 300 300 4.5 Very Low *The “above” sample was taken at the source of the seep, the “below” samples was taken approximately 100 feet below the source of the seep in an area that had been intensively grazed and disturbed by cattle.
39
6. Control Site: Bourland Meadow (BoM) Research Natural Meadow, Not Grazed Sample # Date Total col. Fecal col. E. coli NTU Relative Flow 1) 7/14/09 4 <2 <2 0.42 Low 2)* 7/24/09 2 <2 <2 0.55 Very Low Duplicate 7/24/09 110 13 2 0.49 Very Low 3) 7/31/09 70 17 17 0.52 Very Low Duplicate 7/31/09 23 8 8 0.52 Very Low 4) 8/5/09 11 <2 <2 0.66 Very Low 5) 8/13/09 4 <2 <2 0.52 Very Low 6) 8/28/09 130 <2 <2 0.45 Very Low *Original sample site dry 7/24/09, moved sample site downstream. Summary of sample location: Theses samples were taken below Bourland Meadow from the headwaters of Bourland Creek (which is not included in a rangeland allotment and thus should not have any livestock grazing). Bourland Creek is entirely within the Tuolumne River watershed, and flows into the Tuolumne River via the Clavey River.
40
Appendix 6. Supplemental Concern: Turbidity While collecting the water samples for bacteriological analysis, turbidity samples were also collected in separate bottles and taken to AquaLab for turbidity testing. Turbidity samples were taken at each sample location: BM, BM1, BM2, BR, UFG, LRM, BoM, and RC (see Appendix 1 for individual NTU data). The turbidity results were compared to the relevant water quality standard contained in the Central Valley Regional Water Quality Control Board’s Water Quality Control Plan for the Sacramento and San Joaquin River Basins (“Basin Plan”).6
Turbidity – Waters shall be free of changes in turbidity that cause nuisance or adversely affect beneficial uses. Increase in turbidity attributable to controllable water quality factors shall not exceed the following limits:
• Where natural turbidity is between 0 and 5 Nephelometric Turbidity Units
(NTUs), increases shall not exceed 1 NTU. (Basin Plan at III-9)
Summary of NTU results: LRM – Turbidity was measured nine times before livestock were present. The results ranged from 0.19 to 1.3 with an average NTU of 0.68. Turbidity was sampled eight times after livestock was present in the local area. The results ranged from 2.0 to 4.1 with an average NTU of 3.26. The turbidity sampled at LRM after livestock was present increased an average of more than 2.5 NTUs compared to the turbidity measured before the arrival of livestock. Further, six of those samples taken after the arrival of livestock were more than 1 NTU higher than the highest sample collected before the arrival of livestock. UFG – Turbidity was measured eight times before livestock were present in the local area of the sample site. The results ranged from 0.35 to 1.3 with an average NTU of 0.7. Turbidity was sampled seven times after livestock was present. The results ranged from 0.98 to 1.8 with an average NTU of 1.37. The turbidity sampled at this site increased an average of 0.67 NTU after the arrival of livestock. BR – Turbidity was measured eight times before livestock arrival at this sample site. The results ranged from 0.26 to 1.6 NTU with an average NTU of 1.29. Turbidity was sampled ten times after livestock was present in the local area. The results ranged from 1.1 to 5.2 with an average of NTU of 2.17. The turbidity sampled at BR after livestock were present increased an average of almost 1 NTU compared to the turbidity measured before the arrival of livestock. Further, three of those samples taken after the arrival of livestock were more than 1 NTU higher than the highest sample collected before the arrival of livestock. BM1 – Turbidity was measured seven times before livestock arrival at this sample site. The results ranged from 0.23 to 0.35 with an average NTU of 0.26. Turbidity was sampled eight times at BM1 after livestock were present in the local area. The results ranged from 2.5 to 8.7
41
with an average NTU of 3.53. The turbidity sampled at BM1 after livestock arrival increased an average of more than 3 NTUs compared to the turbidity measured before livestock at BM. Further, all eight of the samples taken at BM1 (after livestock arrival) were more than 1 NTU above those samples taken at BM (before livestock). BM 2– Turbidity was sampled seven times at BM2 after livestock were present in the local area. The results ranged from 0.18 to 1.8 with an average NTU of 1.21. The turbidity sampled at BM2 after livestock arrival increased an average of almost 1 NTU compared to the turbidity measured at BM before livestock were present. Further, two of those samples taken at BM2 (after livestock arrival) were more than 1 NTU higher than those sampled at BM (before livestock arrival). RC – No before livestock sample were collected, so no comparison is possible. BoM (Control Site) – Turbidity was measured eight times during the same time period that the “after livestock arrival” samples were being collected at LRM, UFG, BR, BM1, and BM2. The turbidity ranged from 0.42 to 0.66 with an average NTU of 0.52.
♦ The turbidity data collected further confirms a failure of the U.S. Forest Service’s BMPs to comply with state water quality standards and lends extra evidence that substantial changes in BMPs are needed.


![Ch6 Aseptic Technique “Contamination of microorganisms (bacteria, mycoplasma, yeast, fungus) remains a major problem in tissue culture” [see Table 19-1]](https://static.documents.pub/doc/80x56/56649f1b5503460f94c30ee9/ch6-aseptic-technique-contamination-of-microorganisms-bacteria-mycoplasma.jpg)


