51
UPTEC X 12 009 Examensarbete 30 hp Juni 2012 Bacterial Sortase A as a drug target Caroline Larsson

UPTEC X 12 009
Examensarbete 30 hpJuni 2012
Bacterial Sortase A as a drug target
Caroline Larsson

Molecular Biotechnology Programme
Uppsala University School of Engineering
UPTEC X 12 009 Date of issue 2012-06
Author
Caroline Larsson
Title (English)
Bacterial Sortase A as a drug target
Title (Swedish)
Abstract Sortase A is a housekeeping enzyme of Gram-positive bacteria that catalyses the anchoring of surface proteins to the bacterial peptidoglycan. The enzyme works to establish an interaction between bacteria and host cells and is essential for pathogenesis. This makes Sortase A a potential suitable target for inhibition, in order to treat bacterial infections. In this degree project Sortase A from Staphylococcus aureus was explored and potential inhibitors were investigated by performing enzyme activity and bacterial binding assays. A robust FRET assay was developed and optimized for a recombinant version of the enzyme and serves as a good starting point for studying inhibition.
Keywords Antibiotic resistance, Sortase A, Staphylococcus aureus, Gram-positive bacteria, inhibition, FRET assay, fibronectin-binding
Supervisors
Ian Henderson Medivir AB
Scientific reviewer
Helena Danielsson Uppsala University
Project name
Sponsors
Language
English
Security
ISSN 1401-2138
Classification
Supplementary bibliographical information Pages
49
Biology Education Centre Biomedical Center Husargatan 3 Uppsala
Box 592 S-75124 Uppsala Tel +46 (0)18 4710000 Fax +46 (0)18 471 4687


Bacterial Sortase A as a drug target
Caroline Larsson
Populärvetenskaplig sammanfattning
Antibiotikaresistens är ett aktuellt och växande folkhälsoproblem idag. Ett konstant behov av nya
behandlingar för infektioner orsakade av antibiotikaresistenta bakterier innebär starka påfrestningar för
sjukvården.
Mekanismen bakom antibiotika är att selektivt reducera bakteriernas tillväxt på olika sätt. Detta påverkar
det selektiva trycket hos bakterierna, vilket leder till att resistens utvecklas. För att det ska vara möjligt att
behandla bakterieinfektioner mer långsiktigt och undvika det selektiva trycket är nya tillvägagångssätt
nödvändiga.
För att en infektion ska kunna utvecklas krävs en interaktion mellan bakeriecellerna och värdcellerna.
Gram-positiva bakterier har en speciell mekanism för att denna interaktion ska kunna ske. Sortas A är ett
konserverat enzym hos dessa bakterier som ansvarar för denna mekanism. Enzymet katalyserar en
reaktion som fäster ytproteiner till peptidoglykanet hos bakterierna. På så sätt blir interaktionen med andra
celler möjlig och genom inhibiering av Sortas A hoppas man att det ska bli möjligt att behandla
infektioner som orsakats av Gram-positiva bakterier.
Projektet går ut på att nå en ökad förståelse av enzymet och på så sätt möjliggöra inhiberingsstudier. För
att kunna studera enzymet har ett aktivitetsprotokoll etablerats samt metoder för inbindning och
inmärkning av bakterierna undersökts. Genom utnyttjadet av dessa metoder har potentiella inhibitorer
analyserats.
Examensarbete 30 hp
Civilingenjörsprogrammet Molekylär Bioteknik
Uppsala Universitet 2012


Contents 1 Introduction ..................................................................................................................................... 7
1.1 Gram-positive bacteria ............................................................................................................ 7
1.2 Sortase A .................................................................................................................................. 8
1.3 The project .............................................................................................................................. 9
1.3.1 The FRET assay................................................................................................................. 9
1.3.2 The fibronectin-binding assay ....................................................................................... 10
1.3.3 Labeling of bacterial cells .............................................................................................. 10
1.3.4 The aim of the study ...................................................................................................... 10
2 Materials ........................................................................................................................................ 11
2.1 Biological materials ............................................................................................................... 11
2.2 Reagents ................................................................................................................................ 11
2.3 Consumables ......................................................................................................................... 12
2.4 Systems .................................................................................................................................. 12
2.5 Programs ............................................................................................................................... 12
3 Methods ........................................................................................................................................ 13
3.1 The FRET assay ...................................................................................................................... 13
3.2 Mass spectrometry ................................................................................................................ 14
3.3 The fibronectin-binding assay ............................................................................................... 14
3.4 Labeling of bacterial cells ...................................................................................................... 15
3.5 Inhibitors ............................................................................................................................... 15
4 Results ........................................................................................................................................... 18
4.1 The FRET assay ...................................................................................................................... 18
4.1.1 Enzyme .......................................................................................................................... 18
4.1.2 Buffer conditions ........................................................................................................... 18
4.1.3 Mutant ........................................................................................................................... 19
4.1.4 Triglycine substrate ....................................................................................................... 20
4.1.5 Abz/Dnp-substrate ........................................................................................................ 21
4.2 Mass spectrometry ................................................................................................................ 23
4.3 The fibronectin-binding assay ............................................................................................... 25
4.4 Labeling of bacterial cells ...................................................................................................... 27
4.5 Inhibitors ............................................................................................................................... 29
4.5.1 HMB ............................................................................................................................... 29

4.5.2 MV079877, MV079874 ................................................................................................. 30
4.5.3 MV080057 ..................................................................................................................... 32
4.5.4 NEM, MV080100 ........................................................................................................... 33
5 Discussion ...................................................................................................................................... 35
5.1 Assays .................................................................................................................................... 35
5.2 Inhibitors ............................................................................................................................... 36
5.3 Future perspectives ............................................................................................................... 37
6 References ..................................................................................................................................... 38
7 Appendix ........................................................................................................................................ 40
7.1 Constructs .............................................................................................................................. 40
7.2 Michaelis-Menten theory ...................................................................................................... 42
7.3 Fluorescence .......................................................................................................................... 43
7.4 Inner filter effect ................................................................................................................... 43
7.5 Structures .............................................................................................................................. 44
7.6 Mass spectrometry ................................................................................................................ 45
7.7 Analyzing the results ............................................................................................................. 47
7.7.1 Rates of the reaction ..................................................................................................... 47
7.7.2 Absorbance .................................................................................................................... 47
7.8 GraphPad Prism ..................................................................................................................... 48

7
1 Introduction
Bacterial infections have been treated with antibiotics since the year 1932 following the discovery of
penicillin by Sir Alexander Fleming in 1928 (2). The general mechanism of all antibiotics is that they
affect the growth of bacteria although in different ways and by preventing the bacteria spreading
they limit the progression of infections (2). The action of penicillin, for example, is to inhibit bacterial
growth by affecting the formation of peptidoglycans thus destabilizing the bacterial cell wall (8).
As antibiotics affect bacterial growth they become a target of selective pressure, i.e. when exposed
to antibiotics the bacteria eventually develop resistance against the compound (2). This resistance
can appear as a result of random mutations or through resistance gene exchange between bacteria,
and once resistance is formed the antibiotic can no longer be used to treat the infection (2).
Infections caused by antibiotic resistant bacteria are a major health issue worldwide, causing
increased mortality and significant economical strain on healthcare (3). To reduce the risk of
developing more resistant bacterial strains new treatments, that do not affect bacterial cell growth,
have to be discovered. One possible approach that potentially lowers the risk of affecting the
selective pressure is to inhibit the interaction between bacteria and host cells (7).
1.1 Gram-positive bacteria
Bacteria are classified into two groups; Gram-positive and Gram-negative bacteria. These differ
structurally due to their characteristic cell wall disposition, e.g. Gram-positive bacteria are
surrounded by a cell wall containing about 90 % of a peptidoglycan layer while Gram-negative
bacteria have a very thin layer of peptidoglycan (2).
Staphylococcus aureus (S. aureus) is a common Gram-positive bacterial species which is part of the
normal skin flora and nasal passages in humans (7). These bacteria are major causes of infections in
the human bloodstream, the respiratory tract, on the skin and in the soft tissue that can lead to
conditions like toxic shock syndrome, meningitis and impetigo (11). In addition, S. aureus was one of
the first bacteria to acquire resistance against penicillin (4).
Infections caused by Staphylococcus aureus resistant to the penicillin-related antibiotic Methicillin
(Methicillin resistant Staphylococcus aureus (MRSA)) are a widespread health problem. Every year
MRSA causes more than one million hospital-acquired infections and more than 90 000 Americans
are infected by potentially deadly MRSA infections (14). Therefore, there is a great need for new
bacterial infection treatments that have a lower risk of causing additional problems of resistance.

8
In order for an infection to develop and for the bacteria to be pathogenic, they need to interact with
the cells of the host. Gram-positive bacteria mediate this interaction via a special mechanism
involving anchoring of proteins present at the cell membrane to the peptidoglycan. These proteins
are believed to be essential for the survival of the bacteria during infection (11). A housekeeping
enzyme called Sortase A is responsible for this mechanism and might be a suitable target for
inhibition in order to prevent the bacterial infection to develop (13).
1.2 Sortase A
Sortase A is a 206-amino acid cysteine transpeptidase with an N-terminal transmembrane region
(13). It catalyzes a transpeptidation reaction and anchors surface proteins to the peptidoglycan of
the bacteria. The reaction occurs in two steps and is dependent upon two substrates. The primary
step of the reaction is that the cysteine residue in the active site of the enzyme performs a
nucleophilic attack at the peptide bond between the threonine and the glycine residue of a
conserved C-terminal motif LPXTG (where X is any amino acid) of surface proteins at the cell
membrane (13). This results in the formation of an acyl-enzyme intermediate that is covalently
attached to the peptidoglycan through the second step of the reaction (5). The second step involves
the carboxyl group of the threonine being linked to the amino group of the cell wall cross bridge, i.e.
the five glycine stretch (Gly5) motif, which is the second substrate (1). In this way the C-terminal
domain of the surface proteins of the bacteria are covalently attached to the peptidoglycan, which
enables adherence of the bacteria to host cells and tissue (Figure 1).
An important group of surface proteins are called adhesins, a name that refers to their role in
bacterial adhesion to host cells and tissue, which is also important for acquisition of nutrients,
avoidance of host immune response and necessary for the progression of the infection (14). It has
Figure 1: Transpeptidation reaction. The two step transpeptidation reaction catalyzed by the Sortase A anchoring the surface proteins to the peptidoglycan is illustrated.
9
been shown that bacteria carrying mutant variants of Sortase A fail to infect their host (9), which
supports the idea that inhibition of this enzyme might be used to treat Gram-positive bacterial
infections.
There are a number of isoforms of Sortase enzymes; Sortase A and Sortase B are two of these that
are both present in the bacterial species Staphylococcus aureus. Sortase A is the most studied
isoform and is conserved among all Gram-positive bacteria (12), which makes it a very interesting
pharmaceutical target (3). By blocking the function of Sortase A and in that way preventing the
anchoring of surface proteins to the peptidoglycan, it might be possible to treat infections caused by
antibiotic resistant bacteria, which would result in a great advancement within healthcare.
Inhibition
By inhibiting the function of this enzyme it would be possible to target bacterial virulence without
targeting its viability directly. By inhibiting bacterial virulence it might be possible to treat infections
with less selective pressure and therefore with a potentially decreased risk of resistance
development.
1.3 The project
The objective of the project is to investigate Sortase A in order to be able to study potential inhibitors
with the aim of preventing the transpeptidation reaction taking place on the bacterial cell wall.
To be able to investigate the activity of the enzyme and its potential inhibitors, different approaches
were investigated. A primary activity assay was optimized for a recombinant version of the enzyme, a
secondary binding assay was performed to monitor the binding of bacterial cells and an experiment
involving endogenous labeling of the bacterial cells was investigated.
1.3.1 The FRET assay
Sortase A requires two substrates in order to perform a complete reaction. These substrates are the
surface protein-containing LPXTG-motif and the pentaglycine cross bridge of the peptidoglycan. In
order to mimic the in vivo reaction, a Gly3 peptide and the peptide Abz-Leu-Pro-Glu-Thr-Gly-
Lys(Dnp)-NH2 were used as substrates. This made it possible to perform activity studies on the
enzyme using a Fluorescence resonance energy transfer (FRET) assay.
The Abz/Dnp-peptide is a self-quenched fluorescent peptide containing a fluorophore and a
quencher, where the Abz is the fluorophore and Dnp is the quencher. FRET occurs when the
absorbance spectrum of the quencher overlaps with the emission spectrum of the fluorophore.
When the fluorophore absorbs a photon it settles into an excited state. This excitation is transferred
in a quantum mechanical resonance process from the fluorophore to the quencher where it is

10
generally dissipated as heat. The efficiency of this transfer is highly sensitive to distance and at
distances of more than a few tens of Ångströms is effectively zero. Thus when the peptide is cleaved
the FRET quenching is abolished and the fluorescent emission of the Abz is observed. In that way, the
fluorescence signal is proportional to the extent of the cleavage reaction and can be measured in
order to investigate the activity of the enzyme.
1.3.2 The fibronectin-binding assay
To be able to investigate the enzyme in its natural environment and to study the interaction of the
bacterial cells a secondary binding assay was performed. Adhesins, such as fibronectin-binding
proteins, are among the surface proteins that the enzyme anchors to the peptidoglycan (10). Thus
the function of the Sortase A enzyme may be investigated by using a fibronectin-binding assay.
1.3.3 Labeling of bacterial cells
An assay, involving incubation of the entire bacterial cell together with the Abz/Dnp substrate, was
investigated. The idea was that as the enzyme cleaves the substrate and anchors the fluorophore to
the peptidoglycan, the bacterial cell gets fluorescently labeled. In that way the function of the
enzyme in its natural environment can be investigated by measuring the fluorescence of the cells.
1.3.4 The aim of the study
The aim of the project is to screen for inhibitors of the Sortase A that potentially can be used to treat
infections caused by Gram-positive bacteria. It is of great interest to find a potent inhibitor with low
IC50 value which affects the enzyme specifically without affecting the growth of the bacteria. That
would mean a huge advantage for the healthcare, when it comes to bacterial infections, which today
is dependent upon antibiotics.

11
2 Materials
2.1 Biological materials
The Newman strain of Staphylococcus aureus was received from Professor Hanne Ingmer at the
Department of Veterinary Disease Biology at the University of Copenhagen. The bacteria were grown
on Tryptic Soy Agar plates and in Tryptic Soy Broth (see Reagents). The Sortase A enzyme as well as
the mutant was received from Glareh Askarieh at the department of Pharmacology and Molecular
Sciences (PMS) at Medivir AB (Appendix 7.1).
2.2 Reagents
Trizma® hydrochloride solution (Tris) at 1 M (pH 7.40), sodium chloride (NaCl), calcium chloride
(CaCl2), triglycine peptide (Gly3), tetraglycine peptide (Gly4), pentaglycine peptide (Gly5) and HEPES
buffer solution at 1 M (pH 5.50) was purchased from Sigma-Aldrich®. The glycine peptides were all
diluted in a Tris-buffer (see Buffers), but to different final stock concentrations due to difficulties of
dissolving the longer glycine peptides. Triglycine was diluted to a final stock concentration of 100
mM, while tetraglycine was diluted to 10 mM and pentaglycine to 1 mM. Dimethyl sulfoxide (DMSO)
was purchased from Carlo Erba Reagents and was used in order to dissolve the substrate and the
different compounds (see Inhibitors). Bacterial Sortase Substrate I (Dabcyl-LPETG-Edans), II (Dabcyl-
QALPETGEE-Edans) and III (Abz-Leu-Pro-Glu-Thr-Gly-Lys(Dnp)-NH2) were purchased from AnaSpec
(Fremont, CA). The substrates were dissolved in DMSO to a stock solution with a concentration of 10
mM. 25 % Glutaraldehyde in water was purchased from Sigma-Aldrich®. Crystal violet was purchased
from Mereck (Certistain®) and was diluted to a concentration of 12.5 g/l in solution containing water
and 10 % of ethanol (99.7 % of ethanol was purchased from Solveco AB). Phosphate-Buffered Saline,
Dulbecco’s PBS (×1), was purchased from PAA Laboratories GmbH. BBL™ Trypticase™ Soy Broth (TSB)
and Tryptic Soy Agar (TSA) were purchased from BD. The TSB was prepared by dissolving 30 g of the
powder in one liter water and the solution was autoclaved at 121°C for 15 min. The water used was
received from the Millipore Milli-Q (Q-POD®). 1 mg/ml of Human Plasma Fibronectin Purified Protein
was purchased from Millipore™. Acetonitrile was purchased from Fisher Scientific and Bovine Serum
Albumin (BSA) was purchased from BioLabs. AnalaR NORMAPUR 99.7 % n-heptane was purchased
from VWR.
Inhibitors
MV079874 (Chembridge) was purschased from Chembridge. MV079877 (DMMA) was synthesized by
Lourdes Salvador Oden at the department of Medicinal Chemistry at Medivir AB. MV080057 was
purchased from Akos Screening Library. MV080100, 4-(Hydroxymercuri) benzoic acid sodium salt
(HMB), Kanamycin, Pepstatin A, Bestatin hydrochloride, Chymostatin, Phosphoramidon disodium,

12
trans-epoxysuccinyl-L-leuculamido-(4-guanidino) butane (E-64), Leupeptin hemisulfate, N-
ethylmaleimide (NEM), Benzaimidine Hydrochloride, 4-(2-Aminoethyl) benzenesulfonyl fluoride
hydrochloride (AEBSF), Antipain dihydrochloride, 6-Aminocaproic acid, Soybean Trypsin Inhibitor
(SBTI) and Aprotinin were all purchased from Sigma-Aldrich®.
All the compounds were dissolved in DMSO to a final concentration of 10 mM, except the MV080057
and the 4-(Hydroxymercuri) benzoic acid sodium salt. The MV080057 was dissolved as 1 mg in 150 µl
of Acetonitrile, 20 µl of DMSO and 20 µl of Heptane, then diluted 1:10 in 50/50 of Acetonitrile and
DMSO. In that way the stock of MV080057 had a concentration of 1.32 mM. The 4-(Hydroxymercuri)
benzoic acid sodium salt was diluted in water to a concentration of 10 mM.
2.3 Consumables
White 96-well plates used for the primary assay were purchased from Thermo Fisher Scientific. Clear
flat-bottomed 96-well plates used to measure the absorbance were purchased from Sigma-Aldrich®.
Flat bottomed 96-well plates, Tissue Culture Test Plate 96 F, used for the secondary assay were
purchased from TPP Techno Plastic products AG. Fibronectin coated flat bottomed 96-well plates, BD
BioCoat™ Cellware HUMAN FIBRONECTIN 96-well MULTIWELL™, was purchased from BD.
Plastibrand® microcentrifuge tubes 1.5 ml (Eppendorf tubes) was purchased from Sigma-Aldrich®.
Reaction tubes of 15 and 50 ml were purchased from SARSTEDT AG & Co.
2.4 Systems
The fluorescence was measured in the Ascent Fluoroskan FL from Thermo Labsystems. The
absorbance was measured in the Varioskan Flash from Thermo Scientific. The optical density was
measured in the Ultraspec 10 from Amersham Biosciences. The centrifugation was performed in
Heraeus Biofuge pico from DJB Labcare. The plate reader used to measure the absorbance of the
bacterial cultures was from Molecular Devices.
2.5 Programs
The programs used to analyze the results were GraphPad Prism 5 (version 5.01) from GraphPad
Software, Inc. and ChemDraw Ultra (version 12.0.2) from CambridgeSoft.

13
3 Methods
3.1 The FRET assay
The enzyme assay was originally taken from the literature and was optimized for the recombinant
version of the enzyme (6).
Buffers
Two buffers with different buffer agents were used in the activity assay. The buffer agents were a
Trizma hydrochloride solution and a Hepes buffer solution. The two buffers contained 50 mM of the
buffer agent, 150 mM of sodium chloride (NaCl) and 5 mM of calcium chloride (CaCl2). They were
prepared by adjusting the pH to 7.5 and by performing a sterile filtration.
Method
By investigating the dependence of the different components in the assay on the activity of the
enzyme the assay was optimized for the recombinant version of the enzyme. The general assay was
performed in white 96-well plates in the buffer containing Hepes as the buffer agent with 25 µM of
Abz/Dnp-substrate in DMSO, 5 mM of Gly3 in Tris-buffer and 1/4000 dilution of the enzyme. The
activity was measured in the Ascent Fluoroskan FL at 320 nm excitation and 420 nm emission
wavelengths as an increase in fluorescence every minute for one hour. The reason to why these
wavelengths were used was because 320 nm is the wavelength where you find the maximum
excitation, and at 420 nm the maximum emission, for the Abz/Dnp substrate. The results from the
Ascent Fluoroskan FL were analyzed using GraphPad Prism 5.
The different components of the assay were investigated by modifying this protocol in different ways
and investigating the effect on the activity of the enzyme. Performing a titration curve, diluting the
enzyme a hundred times followed by doubling dilutions across one row of the 96-well plate, and by
plotting the fluorescence response of the reaction against time, the appropriate dilution of the
enzyme was determined. Appropriate concentrations of the substrates were determined in a similar
way as the substrates were titrated from 100 µM and down by doubling dilutions in the assay buffer
and by investigating the fluorescence response. The appropriate concentrations were determined by
calculating the rate of the reactions and by plotting the rate against the concentrations of the
substrate.
Inhibitors were investigated in the same way as the substrates, by performing a titration from 100
µM and down, and by investigating the effect of the concentration of the compound on the activity
of the enzyme. The inhibition was analyzed by plotting the logarithmic inhibitor concentration

14
against the rate of the reaction and then fitting to one of equations 7, 8 or 9 (Appendix 7.8) as
appropriate.
3.2 Mass spectrometry
In order to determine the mass of the enzyme and to confirm that the catalysis was as expected, a
sample from an activity assay was analyzed using mass spectrometry. A transpeptidation reaction
was performed in Tris-buffer with 25 µM Abz-Dnp-substrate and 5 mM of Gly3. The fluorescence was
measured in presence and in absence of the enzyme in the Ascent Fluoroskan FL for one hour as
before. The samples from the experiments were collected and analyzed using mass spectrometry at
the department of Analytical Chemistry at Medivir AB.
3.3 The fibronectin-binding assay
The protocol for the fibronectin-binding assay was originally taken from the literature where similar
experiments had been performed (10).
Method
Two different approaches were tested. The plates with the fibronectin used in the assay were either
purchased or coated in house.
Coating the plates
A flat bottomed 96-well plate was coated with fibronectin by loading 50 µl of 25 µg/ml of Human
Plasma Fibronectin Purified Protein diluted in PBS to the wells. The plate was incubated at 4°C for 24
hours in order to let the fibronectin bind to the bottom of the wells. The next day the wells were
washed with 150 µl of PBS and the remaining binding sites were blocked using 150 µl of 1% of 10
mg/ml of Bovine Serum Albumin (BSA) diluted in PBS. The plate was incubated at room temperature
for 30 min. After the incubation the plate was washed three times using 150 µl of PBS gently in each
well.
The binding assay
The Newman strain of the Staphylococcus aureus was grown in TSB at 37˚C to mid-log phase (OD600 =
0.5). The culture was split into 5 ml aliquots and test compound or control treatment was added. A
0.65 ml cell suspension was removed from the aliquots every 30 min for 2 h following the addition of
test compound. The cell suspensions were pelleted by centrifugation at 10.000 × g for 5 min and the
pellets were stored in -20˚C overnight. The next day the pellets were resuspended in 0.65 ml of PBS
and transferred in 100 µl aliquots into individual wells of a fibronectin coated flat bottomed 96-well
plates (either the BD BioCoat™ Cellware HUMAN FIBRONECTIN 96-well MULTIWELL™ or the coated
plate from the protocol above). After incubating the plate for 2 h in 37˚C the cell suspension was

15
removed and the wells were washed with 150 µl PBS carefully. The bound cells were then fixed by
adding 100 µl of 2 % glutaraldehyde and by incubating the plate for 30 min in room temperature.
After incubation the wells were washed again by carefully adding 150 µl of PBS. The cells were
stained for 15 min by using 100 µl of crystal violet dye (12.5 g/l). After staining the wells were
washed again with 150 µl of PBS three times and the plate was covered with aluminium foil. The
plate was left to dry overnight at 37˚C. The absorbance of the dry plate at 562 nm was measured the
next day by using the plate reader. The results were analysed using GraphPrism 5 by plotting the
absorbance against the growth time of the cultures. In that way it was possible to compare any
differences in binding of the cells to the fibronectin due to differences in treatment and in cell
growth.
3.4 Labeling of bacterial cells
The Newman strain of Staphylococcus aureus were grown to mid-log phase (OD600 = 0.5) and eight
aliquots of 1.5 ml each were transferred to individual Eppendorf tubes. The cells were pelleted by
centrifugation at 10.000 × g for 3 min and resuspended in PBS. 25 µM of the substrate or the same
amount of DMSO was added to each aliquot and 100 µl of the cultures were transferred to the wells
of one row each of a white 96-well plate. The plate was read in the Ascent every minute for one hour
at excitation and emission wavelengths of 320 and 420 nm. The contents of the wells of each row
were collected to individual Eppendorf tubes and by centrifugation at 10.000 × g for 2 min followed
by the addition of 1.2 ml PBS; the bacterial cells were washed three times. Finally the pellets were
resuspended in 100 µl of PBS and transferred to one well each of a white 96-well plate. The plate was
read in the Ascent Fluoroskan FL as a single reading at the same wavelengths as before. The
fluorescence of the control was compared to the fluorescence of the samples theoretically labelled
with the substrate in order to investigate the function of the enzyme.
3.5 Inhibitors
Five different compounds, previously described as inhibitors for Sortase A, were investigated (10, 11
and 15). These compounds were called MV079874 (Chembridge), MV079877 (DMMA), MV080057,
MV080100 and 4-(hydroxymercuri) benzoic acid sodium salt (HMB) (Table 1). The structures of the
compounds are presented in Appendix 7.5. The inhibitors were studied in the primary and the
secondary assay, as described above. The results from the primary assay were analyzed by
calculating the rates of the reactions and plotting the rate against the logarithmic concentration of
the inhibitor (Appendix 7.7.1).

16
Table 1: Previously described Sortase A inhibitors investigated
NAME CHEMICAL NAME
MV079874 (Z)-3-methyl-1-phenyl-4-(((2,4,6-tribromophenyl) amino) methylene)-1H-pyrazole-5(4H)-thione
MV079877 (Z)-3-(2,5-dimethoxyphenyl)-2-(4-methoxyphenyl) acrylonitrile
MV080057 (Z)-3-methyl-1-phenyl-4-(((4-((Z)-phenyldiazenyl)phenyl)amino)methylene)-1H-pyrazole-5(4H)-thione
MV080100 (Z)-3-methyl-4-(((4-nitrophenyl)amino)methylene)-1-phenyl-1H-pyrazole-5(4H)-thione
HMB 4-(Hydroxymercuri) benzoic acid sodium salt
A panel of thirteen protease inhibitors was also investigated as inhibitors for the Sortase A in the
primary assay (Table 2).
Table 2: Panel of protease inhibitors
NAME TYPE OF INHIBITOR MECHANISM
Pepstatin A Aspartic protease Reversible
Bestatin hydrochloride Metalloprotease Reversible
Chymostatin Serine and cysteine protease Reversible
Phosphoramidon disodium Metalloprotease Reversible
E-64 Cysteine protease Irreversible
Leupeptin hemisulfate Serine and thiol protease Reversible
N-ethylmaleimide (NEM) Cysteine protease Irreversible
Benzamidine hydrochloride Serine protease Reversible
4-(2-Aminoethyl) benzenesulfonyl fluoride hydrochloride (AEBSF)
Serine protease Irreversible
Antipain dihydrochloride Serine and cysteine proteases Reversible
6-aminocaproic acid Chymotrypsin Reversible
Soybean trypsin inhibitor (SBTI) Serine protease Reversible
Aprotinin Serine protease Reversible
The reason why proteases were investigated as inhibitor for the transpeptidase is because proteases
and transpeptidases work via very similar mechanisms, especially when it comes to creating the acyl-

17
enzyme intermediate. The main difference between the mechanisms is that proteases use water to
cleave the intermediate while the transpeptidases uses an N-terminus of a peptide. Due to the
similarities in mechanism it is likely that a protease inhibitor would inhibit a transpeptidase as well.
Investigating the panel of protease inhibitors the initial and final rates of the reactions obtained from
the fluorescence measurement was calculated. The average rates of the controls were calculated and
a percentage difference in the rates of the inhibitors compared to this value was calculated. By
plotting the percentage difference in activity for the different inhibitors the potential inhibition was
visualized.
Absorbance measurement
Some of the compounds were very colorful in strong yellow and orange colors. This indicated that
there might be a risk of the molecules interfering in the FRET assay due to potential absorbance at
the wavelengths used in the activity assay (Appendix 7.7.2). In order to investigate this phenomenon
and to make sure that the compounds did not interfere in the assay, the compounds were diluted in
Hepes buffer and the absorbance of the samples was measured in the Varioskan Flash at the
wavelengths of interest. The results from the absorbance measurement of the inhibitor were plotted
against the logarithmic concentration and compared to the absorbance of the control or investigated
by calculating the percentage transmittance (Appendix 7.7.2).
Growth inhibition
Inhibition of the growth of the bacteria by the compounds was investigated by studying the growth
in presence of the compounds at different concentrations. The growth was investigated over a
period of time by measuring the absorbance of the cultures continuously. A compound known to
inhibit the bacterial growth, Kanamycin, was used as a control in these experiments.

18
4 Results
4.1 The FRET assay
The enzyme assay was optimized for the recombinant version of the enzyme using the previously
described assay as a starting point (6). The assay was originally performed in a Tris-buffer with an
Abz/Dnp-peptide concentration of 25 M and a triglycine concentration of 5 mM.
4.1.1 Enzyme
An appropriate dilution of the enzyme was established to be 1/4000 by varying the enzyme
concentration and by comparing the differences in the fluorescence response between the reactions
with different amounts of enzyme (Figure 2 and 3). The dilution was determined as it resulted in a
linear signal with low noise over time.
Figure 2: Fluorescence signal. Graphical representation of the results received from the Ascent Fluoroskan FL. The
enzyme is double diluted from right to left starting at a dilution of 1/100.
4.1.2 Buffer conditions
Optimal buffer conditions were established by investigating the dependence of the different
components and conditions on the activity of the enzyme.
Buffer agent
When changing the Trizma hydrochloride to Hepes as the buffer agent no change in the activity of
the enzyme was recorded (Figure 3 and 4). Since Tris is an amine-based solution, which absorbs CO2
from the atmosphere, it will lose its buffer capacity over time. Therefore, Hepes was preferred as the
buffer agent in the activity assays from this point.

19
pH
Preparing eleven different pH buffers ranging from 4.0 to 9.0 and by performing activity assays in
these buffers in parallel, the dependence of the pH on the activity of the enzyme was investigated.
The results showed that no pH generated as good activity as the buffer with pH 7.5 and this pH was
concluded to be the optimum for the assay.
Reducing agent
The dependence of a reducing agent in the buffer on the activity of the enzyme was investigated. The
reducing agent was dithiothreitol (DTT) and the results showed this had no effect on the activity.
Therefore, DTT was determined to be an advantageous ingredient in the buffer in order to keep the
cysteine in the active site of the enzyme from oxidation.
4.1.3 Mutant
Investigating the activity of the Sortase A
mutant, no activity was recorded for any of
the dilutions of the protein as expected
(Figure 5). Since the mutant was produced by
replacing the cysteine residue in the active
site with alanine this proves the importance
of the cysteine and its function for the activity
of the enzyme (Appendix 7.1).
Figure 3: Activity assay with Tris-buffer. Results from activity assay using different concentrations of the enzyme in Tris-buffer.
Figure 4: Activity assay with Hepes-buffer. The same experiment as in Figure 3 was performed but Hepes was used as the buffer agent.
Figure 5: Activity assay of the Sortase A mutant. No activity was monitored when investigating different concentrations of the enzyme mutant.

20
4.1.4 Triglycine substrate
Through the titration curve of the triglycine the appropriate concentration of the substrate and the
kinetic parameters were investigated. By plotting the final rates of the reaction against the
concentration of the substrate the Michaelis-Menten kinetics was studied (Figure 6) (Appendix 7.2
and 7.7.1). Analyzing the results in GraphPrism using the Equation 5 of Appendix 7.8 the constant,
KM, was determined to be 23 µM.
Since triglycine is not involved in the step of the reaction that is measured in the FRET assay as the
activity of the enzyme it is crucial that this substrate does not limit the transpeptidation reaction. In
that way it is desirable to have a concentration that is high above the KM and as the triglycine is not
fluorescent there is no risk that it will interfere in the assay. Therefore, it is advantageous to have a
large amount of this substrate and the concentration initially used for the substrate (5 mM) was
determined to be appropriate.
Alternative substrates
Differences in activity of the enzyme using different glycine substrates were investigated. The
peptides investigated were tetraglycine (Gly4) and pentaglycine (Gly5) and the Vmax-values of the
peptides were determined (Table 3).
Figure 6: Michaelis-Menten curve. The rate of the reaction for different concentrations of triglycine was analyzed and a KM of 23 µM was calculated.

21
Table 3: The maximum velocities
Vmax (µM)
Triglycine 4.9 ± 0.4
Tetraglycine 4.2 ± 1.0
Pentaglycine 4.2 ± 0.3
According to the results neither of the longer glycine peptides seemed to improve the activity of the
enzyme significantly. Due to economic advantages as wells as problems of dissolving the tetra- and
the pentaglycine, the triglycine was therefore used in further studies.
4.1.5 Abz/Dnp-substrate
The appropriate concentration of the Abz/Dnp-substrate was determined and an inner filter effect
was investigated by performing the titration curve. A concentration of 25 µM was determined to be
appropriate by investigating the activity for substrate concentration ranging from 50 nM to 100 µM
causing a linear signal with low noise (Figure 7).
Figure 7: Activity assay varying the Abz/Dnp-substrate concentration. Activity of the enzyme using different concentrations of the Abz/Dnp-substrate was investigated.
Due to the characteristic properties of this substrate an inner filter effect had to be investigated as
well before determining the concentration to use in the assay (Appendix 7.4).
Inner filter effect
The inner filter effect was investigated by plotting the rate of the reaction against the substrate
concentration and by investigating the linearity of the results (Figure 8) (Appendix 7.7.1).

22
Figure 8: Inner filter effect of the Abz/Dnp-substrate. Interference in the assay of the
substrate at high concentrations was investigated by plotting the rate against the
concentration.
An inner filter effect for the Abz/Dnp-peptide had previously been observed by Kruger et al. who
derived a KM of 5.5 mM for this substrate in an HPLC based assay (6; Figure 2). In that way a substrate
concentration low enough to avoid problems of this phenomenon in the assay had to be used. Due to
limitations in the substrate concentration the highest concentration investigated in this project was
100 µM and the results from Kruger et al. were used as a reference (6) (Figure 8). In this experiment
a substrate concentration of 25 µM resulted in a linear response indicating that this concentration
will not cause interference in the assay due to absorbance. Therefore, as a complement to the results
of the fluorescence response (Figure 7), this concentration was presented as being appropriate to
use in the activity assay.
Alternative substrates
In the literature two different fluorophore/quencher substrates, in addition to the Abz/Dnp-
substrate, have been used. These were the Dabcyl-LPETG-Edans and Dabcyl-QALPETGEE-Edans
peptides. They were investigated as alternatives for the Abz/Dnp-peptide but the activity was
reduced. The Abz/Dnp-substrate was therefore kept as the FRET-substrate in further studies.
23
4.2 Mass spectrometry
By analyzing the enzyme and the products from the transpeptidation reaction using mass
spectrometry the mass of the enzyme was determined and its function was confirmed. The results
from the mass spectrometry are presented in the Appendix 7.6.
The mass of the enzyme was determined to be 17 678 Da by analyzing the enzyme and investigating
the spectrum obtained (Appendix 7.6, Figure 33).
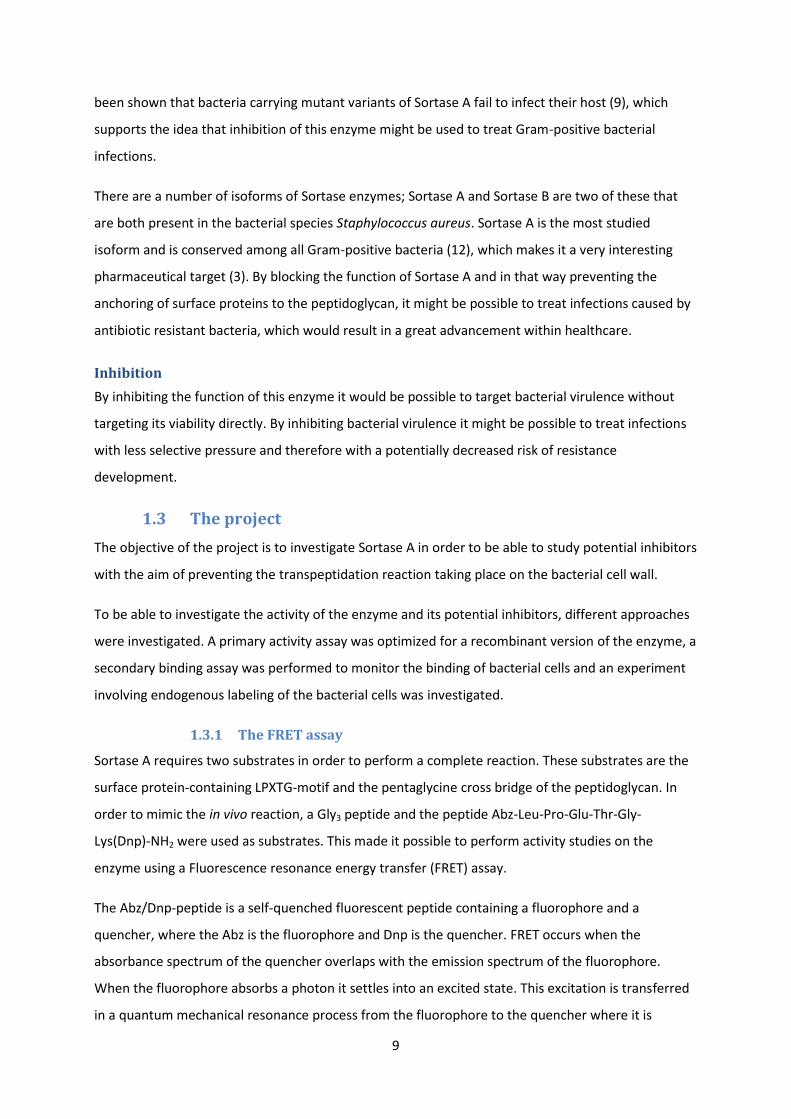
The results received from the Ascent Fluoroskan FL of the reaction performed in order to investigate
the function of the enzyme are shown in Figure 9.
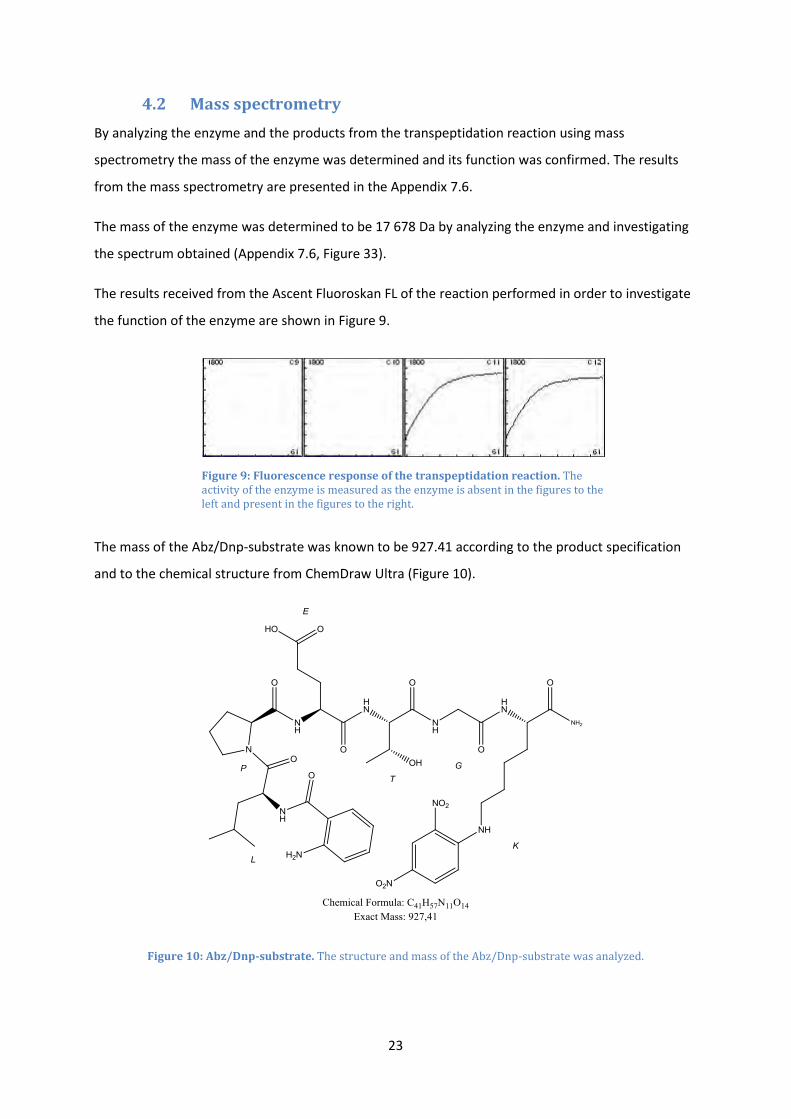
The mass of the Abz/Dnp-substrate was known to be 927.41 according to the product specification
and to the chemical structure from ChemDraw Ultra (Figure 10).
Figure 10: Abz/Dnp-substrate. The structure and mass of the Abz/Dnp-substrate was analyzed.
Figure 9: Fluorescence response of the transpeptidation reaction. The activity of the enzyme is measured as the enzyme is absent in the figures to the left and present in the figures to the right.

24
The known mass was used as a reference when analyzing the substrate in the mass spectrometry. In
the spectrum two peaks are present, one peak at 928 and one at 696 (Appenxid 7.6, Figure 34). As
the protein is analyzed as a positive ion the peak at 928 represents the substrate and a hydrogen ion,
(the mass of one proton is 1.0073 Da). The second peak in the spectrum is results from
fragmentation of the substrate and is located at a distance of 232 m/z from the peak of the Abz/Dnp-
peptide, indicating loss of the Abz-L.
The formation of the transpeptidation product was confirmed by comparing the obtained- and the
expected mass. The expected mass was 748.34 for the cleavage product analyzed in ChemDraw Ultra
(Figure 11).
Figure 11: Abz-LPETGGG. The structure and mass of the transpeptidation product was investigated.
Again, two main peaks at a distance of 232 m/z apart were present in the results from the mass
spectrometry (Appendix 7.6, Figure 35). The peaks were located at 749 and 517 and the conclusion is
that the peak at 749 represents the transpeptidation product and a hydrogen ion. The second peak is
the result of the fragmentation identified above.

25
4.3 The fibronectin-binding assay
The binding assay is based on the fact that there will be an increased binding to fibronectin as the
untreated bacteria are growing. An inhibitor would affect the Sortase A in such a way that when the
bacteria are growing they will not have the fibronectin-binding proteins on the surface and will not
be able to bind to the fibronectin at the bottom of the wells. By investigating treated and untreated
samples over time and by investigating differences in binding to the fibronectin the idea is that it
would be possible to study an inhibition.
The assay turned out to be difficult to handle as the results varied a lot. Before it is possible to
investigate the inhibition of the enzyme it is crucial that a successful assay for the untreated sample
is developed. Figure 12 indicates that the binding increases over time but the variance is large.
Some experiments indicated that it might be possible to use the assay in order to investigate the
inhibition as the binding of the cultures increased with time and as the overall binding was lower for
the treated than for the untreated samples (Figure 13).
Figure 12: Fibronectin-binding assay. The binding to fibronectin for an untreated sample was measured and seemed to increase with the time of growth.
Figure 13: Fibronectin-binding assay for MV079877. The compound seemed to inhibit the binding of the cells to fibronectin as the absorbance is lower than for the untreated culture.

26
Unfortunately, further investigation of the assay using potential inhibitors again showed a high
variance in results and no trend in the difference between the control and the sample with inhibitor
was recorded (Figure 14). Also the results for the control do not increase uniformly with respect to
increased time of growth.
Figure 14: Fibronectin binding assay for MV079877. When investigating four different
concentrations of DMMA a lot of variance was monitored and no trend between treated and
untreated cells was detected.
With the aim of reaching a more robust assay the protocol was adjusted in a number of different
ways. The adjustments involved a more careful pipetting technique, an increased number of washing
steps, finishing the protocol in one day instead of freezing the samples overnight and dissolving the
crystal violet in ethanol before measuring the absorbance in the end of the protocol. The coating of
the plate was another adjustment done in order to investigate the effect of different concentrations
of the fibronectin on the results of the assay. Unfortunately, no adjustments indicated that a robust
enough protocol was achieved. The reason for this might be that a binding between the bacteria and
the fibronectin might not be strong enough to persist throughout the protocol of the assay. If the
binding is disrupted the results will be unreliable and the assay cannot be used in order to investigate
inhibitors.
To be able to use this protocol it is therefore crucial that the assay is adjusted in a way that makes it
more robust and sensitive. It is of great importance that the risk of the binding being disrupted and
the results being misleading is reduced.

27
4.4 Labeling of bacterial cells
No increase in fluorescence was monitored when performing the experiment of labeling the bacterial
cells using the Abz/Dnp-substrate and measuring the fluorescence during the incubation with the
substrate (Figure 15). This might have to do with the incubation not being long enough for an
increase to be recorded or with the increase being too low to monitor during the time of the
incubation.
Figure 15: Fluorescence signal during incubation. The activity was measured
during the incubation of bacteria and Abz/Dnp-substrate but no increase in
fluorescence was identified.
No increase in fluorescence and no overall trend of a difference in fluorescence between the control
and the samples were obvious. In figure 15 it looks like the fluorescence is decreasing over time. The
reason to this might be because the cells are sinking to the bottom of the wells as the time passes
which causes the fluorescence signal to decrease.
By investigating the labeling of the cells in the experiment above by measuring the fluorescence of
the samples in the end of the assay and by taking the mean of the replicates the result was that the
fluorescence of the bacteria incubated with substrate was slightly higher than the control sample
(Table 4).
Table 4: Results from the labeling experiment.
Fluorescence
Control 7.5 ± 0.3
25 µM of substrate 9.3 ± 0.8

28
As the fluorescence of the cells incubated with the substrate is slightly higher it might indicate that
the bacterial cells have been labeled but since the difference in fluorescence signal is so small it is
hard to know whether the difference is significant or not. Therefore, at this point, the assay is not
robust enough to use in order to investigate potential inhibition.

29
4.5 Inhibitors
According to the study no inhibitor turned out to be a candidate for treating bacterial infections.
4.5.1 HMB
The experiments on the compound 4-(hydroxymercuri) benzoic acid sodium salt (HMB) showed that
it was a high-affinity inhibitor for the Sortase A. According to previous reports on the compound the
IC50 of was 119.5 µM (10). The compound was investigated using the FRET assay and data was fitted
to equation 8 and 9. The value of Ki turned out to be below the detection level of the experiment and
was calculated to be approximately zero and the IC50 was calculated to 84.9 nM (Figure 16)
(Appendix 7.2). The results therefore suggest that the compound is an even more potent inhibitor
than previously reported.
Figure 16: Inhibition of Sortase A by HMB. High-affinity inhibition of Sortase A
by 4-(hydroxymercuri) benzoic acid sodium salt was detected.
Because of the high-affinity inhibition of the compound it was used in further experiments with
potential inhibitors as a positive control. It could not be used to a greater extent than as a control
due to the compound strongly reducing the bacterial growth (Figure 17).

30
Both 4-(Hydroxymercuri) benzoic acid sodium salt and N-ethylmaleimide are general cysteine
protease inhibitors and are therefore toxic to all cell types.
4.5.2 MV079877, MV079874
Both the compound MV079877 (DMMA) and the MV079874 (Chembridge) was previously described
in the literature as effective inhibitors for the enzyme (11 and 15). The inhibitor concentration
required to reduce the enzyme activity to 50 % (IC50) was reported to be 9.14 µM (11) for the
MV079877 and 0.30 µM (14) for the MV079874. Unfortunately, an inhibition was not detected using
the developed primary assay and the compounds turned out to cause problems in the activity assay.
Including the compounds in the activity assay using the 4-(Hydroxymercuri) benzoic acid sodium salt
(HMB) as a control, potential inhibition was studied but no inhibition was found (Figure 18).
Figure 18: Inhibition of Sortase A by MV079874 and MV079877. The inhibition of enzyme activity was measured using HMB as a control. No inhibition was detected.
Figure 17: Growth inhibition in presence of HMB and NEM. The growth of the bacteria in presence of HMB and NEM was analyzed and the compounds turned out to inhibit the growth significantly.

31
The compounds were colored and to make sure that the compounds did not interfere in the assay
the absorbance at the wavelengths of 320 and 420 nm was measured (Figure 19 and 20) (Appendix
7.7.2).
The results show that both compounds at high concentrations have a higher absorbance than the
control. This causes interference in the assay and a reduction in fluorescence might be due to
absorbance rather than inhibition of the enzyme.
Investigating the inhibition of the bacterial growth of MV079874 (Chembridge) and MV079877
(DMMA) over time the compounds show a low level of inhibition at high concentrations (Figure 21).
Figure 19: Absorbance at 320 nm. The absorbance of MV079874 and MV079877 at 320 nm was significantly higher than the absorbance of the control.
Figure 20: Absorbance at 420 nm. The absorbance of MV079874 and MV079877 at 420 nm was higher than the control.

32
Figure 21: Growth inhibition in presence of MV079874 and MV079877. The growth of
bacteria in presence of MV079874 and MV079877 was measured and the growth inhibition
turned out to be low.
The absorbance is low for the highest concentrations of the compounds which is explained to be due
to the absorbance of the molecules. At high concentrations the absorbance will initially be high
causing the growth of the cultures to be limited. Kanamycin is used as a control and as the results
show it strongly inhibits the bacterial growth.
The MV079874 was reported from the department of Medicinal Chemistry at Medivir AB to be
unstable in both DMSO and acetonitrile which may explain the lack of activity. Because of instability
the compound is not suited for these types of studies. Therefore, due to the instability of the
MV078974 and to the absorbance and high values of IC50 observed, MV079874 and MV079877 are
not good candidates for inhibition of Sortase A.
4.5.3 MV080057
A compound called MV080057 was previously reported as an inhibitor for the enzyme (14). It was
tested in the assay (Figure 22) and the data fitted to equation 7.
Figure 22: Inhibition of MV080057. The inhibition of MV080057 was investigated using HMB as a control and the compound seemed to inhibit the enzyme.

33
The Ki for MV080057 was calculated to be 22.6 µM but, as for the MV079874 and MV079877, the
color of the compound indicated that there might be problems with the absorbance of the molecule
interfering in the assay. Therefore, the absorbance of the compound was measured and the
percentage transmittance was calculated (Appendix 7.7.2). In that way the transmittance was
compared with the activity in order to investigate whether the decrease in fluorescence response
presented above was due absorbance rather than actual inhibition (Figure 23).
According to the results both the graph representing the percentage transmittance and the activity
follows the same pattern and the decrease in activity seems to be slightly higher than the percentage
transmittance. Therefore, some of the decrease in activity seems to be due to actual inhibition but
some will be due to the absorbance of the sample.
4.5.4 NEM, MV080100
The results from investigating the panel of protease inhibitors are presented in figure 24. Only N-
ethylmaleimide (NEM) seemed to inhibit the enzyme significantly. The reaction of NEM is time
dependent which is why both the initial and the final velocities were investigated.
Percentage transmittance and activityof MV080057 at 420 nm
-8 -7 -6 -50
50
100
150Transmittance
Activity
Control
log([I])
%
Figure 23: Percentage transmittance and activity of MV080057 at 420 nm. When comparing the reduction in activity with the transmittance of MV080057 it is obvious that some of the reduction will be due to absorbance of the compound.

34
Investigating the N-ethylmaleimide further revealed that the compound was not a very potent
inhibitor for the Sortase A (Figure 25). The inhibition of NEM was investigated with a potential
inhibitor called MV080100 and by analyzing the results using equation 9 (Figure 25).
The IC50 under the conditions of this assay for MV080100 was calculated to 35.4 µM and for NEM the
value was 172.4 µM. Unfortunately, the MV080100 was colored the same problem described above
was likely to cause interference in the FRET assay. N-ethylmaleimide is a general cysteine protease
inhibitor and also inhibited the growth of the bacteria (Table 2, Figure 17).
Figure 24: Panel of thirteen protease inhibitors. Inhibition of Sortase A by thirteen different protease inhibitors was investigated. N-ethylmaleimide was the only compound that reduced the activity significantly.
Figure 25: Inhibition of NEM and MV080100. The inhibition of NEM and MV080100 was measured and analyzed. NEM did not turn out to be very potent and MV080100 did show inhibition.

35
5 Discussion
There is a great need of alternative treatments for bacterial infections due to the increased
development and spread of resistance against antibiotics. Ideally, new treatments should not cause
the level of selective pressure seen with current antibiotics and therefore reduce the risk of new
forms of resistance developing.
Sortase A might be a suitable target for preventing the progression of infections. By inhibiting the
enzyme the interaction between the bacteria and the host, crucial for infection, is prevented. Several
advantages using Sortase A as a target are known. Firstly, inhibition of the enzyme would not target
the viability of the bacteria directly. In that way the risk of the bacteria developing resistance against
the compound might be decreased. Secondly, there is no homologue of Sortase A in eukaryotes and
so selectivity may be more easily achieved. Thirdly, Sortase A is located on the outside of the
bacterial cell membrane. This makes it readily accessible to inhibitors without the need of
penetrating the cell membrane.
5.1 Assays
In this study a robust FRET assay to measure the activity of the enzyme has been developed. The
assay has been optimized for the recombinant version of the enzyme and creates a good starting
point for studies of inhibition.
A fibronectin-binding assay has been investigated but turned out to be complicated and difficult to
use in order to investigate the enzyme. Although different adjustments to the protocol were done it
was not possible to achieve a robust assay during the time of the project.
A combination of a primary and a secondary assay is needed when investigating inhibition of the
enzyme. The reason for this is that when studying inhibition using the secondary assay an inhibition
might be due to the compound affecting something else rather than the enzyme directly. A primary
assay is therefore a confirmation that the inhibition is due to the compound affecting the enzyme. At
the same time it is crucial that a secondary assay is investigated as a complement to the primary
assay. The reason for this is that the primary assay involves studies on the recombinant version of
the protein and the system is therefore not completely representative of the natural system. As the
recombinant enzyme lacks the transmembrane region there is a possibility that the truncation affects
the enzyme in a way that would cause the results of the experiments to differ from the reality. The
recombinant version is therefore a simplified model for the real system. When investigating the
enzyme in its natural environment the study is therefore more realistic when it comes to the function
and the biology of the protein.

36
An assay involving labeling of the bacterial cells using the Abz/Dnp-substrate was investigated. An
advantage using this technique, as well as using the fibronectin-binding assay, is the fact that the
studies are performed on the enzyme in its natural environment. A potential problem that might
arise in this assay is whether the substrate is able to pass the peptidoglycan and reach the enzyme or
not. Another problem is that the substrate could be exposed to other proteases that might degrade
it before reaching Sortase A. The results of the assay indicated that the cells might be labeled with
the substrate but due to the small difference between the samples and the control the assay does
not seem to be robust and sensitive enough for investigation of inhibitors.
5.2 Inhibitors
The goal was to find an inhibitor specific for Sortase A that would only affect the anchoring of the
surface proteins crucial for the progress of infection.
Working with a FRET assay it is very important to consider the risk of the compound interfering in the
assay. The chemical structure of compounds affects the ability of the molecule to be fluorescent
(Appendix 7.3). The structure and the color of the compound can therefore indicate whether this
phenomenon is expected and has to be investigated.
In order to choose inhibitors to investigate in this project an article performing a high-throughput
screening for Sortase A inhibitors was used as a reference (14). In the article the structures of three
lead compounds was changed and by investigating the effect on the differences in structure on the
activity of the compound a large number of inhibitors were discovered. A lot of the compounds from
this paper were therefore closely related structurally.
The three compounds MV079874, MV080057 and MV080100 investigated in this project were all
received from this article. It was not possible to reproduce the low IC50 values reported in the article
using the same assay. Instead, the compounds turned out to interfere in the assay.
The article does not mention the problem of the compounds being fluorescent. They claim, for
example, that the inhibition of the enzyme was increased when a nitrogen dioxide group was
removed from the compound and when conjugated double bonds were added to the ring structure.
Since this is likely to make the molecules more fluorescent it is likely that the increase in activity they
found was actually due to an increase in absorbance of the molecules (Appendix 7.3). Therefore, it is
questionable whether the phenomenon of absorbance was investigated in this article or if it was
ignored. If the absorbance was not considered the IC50 presented for the compounds are therefore
most likely false. As the structures of the compounds were related it was not a surprise to find that

37
the compounds investigated in this project were all fluorescent. This aspect is therefore very
important to consider when investigating inhibition.
5.3 Future perspectives
Even though a good activity assay was developed for the enzyme no potential candidate for treating
antibiotic resistant bacteria was found. Therefore, new potential inhibitors have to be investigated
and fluorescence of the compounds has to be considered. It might also be a good idea to develop a
complementary enzyme assay to avoid the interference of the fluorescence. Mass spectrometry or a
biosensor, like Biacore, might be good to use for this purpose. Also a robust secondary assay has to
be developed in order to be able to investigate inhibition of the enzyme in its natural environment.

38
6 References
(1) Bentley M L, Gaweska H, Kielec J M & McCafferty D G (2007) Engineering the Substrate
Specificity of Staphylococcus aureus Sortase A. The Journal of Biological Chemistry. 282:
6571-6581.
(2) Carlson K & Linder C (2008) Introduktion till Mikrobiologi – med inriktning mot
naturvetare och farmaceuter. Studentlitteratur. Pozkal, Poland.
(3) Chenna B C, Shinkre B A, King J R, Lucius A L, Narayana S V L & Velu S E (2008)
Identification of novel inhibitors of bacterial surface enzyme Staphylococcus aureus
Sortase A. Bioorganic & Medicinal Chemistry Letters. 18: 380-385.
(4) Clancy K W, Melvin J A & McCafferty D G (2010) Sortase Transpeptidases: Insights into
Mechanism, Substrate Specificity, and Inhibition. Biopolymers (Peptide Science). 94: 385-
396.
(5) Huang X, Aulabaugh A, Ding W, Kapoor B, Alksne L, Tabei K & Ellestad G (2003) Kinetic
Mechanism of Staphylococcus aureus Sortase Srt A. Biochemistry. 42: 11307-11315.
(6) Kruger R G, Dostal P & McCafferty D G (2004) Development of a high-performance liquid
chromatography assay and revision of kinetic parameters for the Staphylococcus aureus
sortase transpeptidase SrtA. Analytical Biochemistry. 326: 42-48.
(7) Maresso A W & Schneewind O (2008) Sortase as a Target of Anti-Infective Therapy.
Pharmacological Reviews. 60: 128-141.
(8) Mathews C K, Van Holde K E & Ahern K G (2000) Biochemistry. 3rd edition. Pearson
Education, Prentice Hall. Upper Saddle River, New Jersey.
(9) Mazmanian S K, Liu G, Jensen E R, Lenoy E & Schneewind O (2000) Staphylococcus
aureus sortase mutants defective in display of surface proteins and in the pathogenesis of
animal infections. Proceedings of the National Academy of Sciences of the United States
of America (PNAS). 97: 5510-5515.
(10) Oh K-B, Oh M-N, Kim J-G, Shin D-S & Shin J (2006) Inhibition of sortase-mediated
Staphylococcus aureus adhesion to fibronectin via fibronectin-binding protein by sortase
inhibitors. Applied Microbiology and Biotechnology. 70: 102-106.
(11) Oh K-B, Nam K-W, Ahn H, Shin J, Kim S & Mar W (2010)Therapeutic effect of (Z)-3-(2,5-
dimethoxyphenyl)-2-(4-methoxyphenyl) acrylonitrile (DMMA) against Staphylococcus
aureus infection in a murine model. Biochemical and Biophysical Research
Communications. 396: 440-444.

39
(12) Paterson G K & Mitchell T J (2004) The biology of Gram-positive sortase enzymes. Trends
in Microbiology. 12: 89-95.
(13) Perry A M, Ton-That H, Mazmanian S K & Schneewind O (2002) Anchoring of Surface
Proteins to the Cell Wall of Staphylococcus aureus. The Journal of Biological Chemistry.
277: 16241-16248.
(14) Suree N, Yi S W, Thieu W, Marohn M, Damoiseaux R, Chan A, Jung M E & Clubb R T
(2009) Discovery and structure-activity relationship analysis of Staphylococcus aureus
inhibitors. Bioorganic & Medicinal Chemistry. 17: 7174-7185.
(15) Williams R T & Bridges J W. (1964) Fluorescence of solutions: A review. Journal of Clinical
Pathology 17: 371-394.

40
7 Appendix
7.1 Constructs
Two constructs were used in the project, one wild-type and one mutant version of the Sortase A. The
wild-type Sortase A was truncated with a C-terminal His6-tag. The mutant was truncated with an N-
terminal His6-tag and the cysteine residue at position 184 in the active site was replaced with an
alanine residue.
Srt A truncate wild-type with C-terminal His6-Tag
QQAKPQIPKDKSKVAGYIEIPDADIKEPVYPGPATPEQLNRGVSFAEENESLDDQNISIAGHTFIDRPNYQFTNL
KAAKKGSMVYFKVGNETRKYKMTSIRDVKPTDVGVLDEQKGKDKQLTLITCDDYNEKTGVWEKRKIFVATEVKHH
HHHH
Srt A truncate Cys184Ala mutant with N-terminal His6-Tag
SHHHHHHQQAKPQIPKDKSKVAGYIEIPDADIKEPVYPGPATPEQLNRGVSFAEENESLDDQNISIAGHTFIDRP
NYQFTNLKAAKKGSMVYFKVGNETRKYKMTSIRDVKPTDVGVLDEQKGKDKQLTLITADDYNEKTGVWEKRKIFV
ATEVK
These were received from the department of Pharmacology and Molecular Sciences (PMS). The
constructs were chosen by running a blast search using the Sortase A sequence with accession code
AAD48437.1 as query. By aligning the full-length and non-redundant sequences of Staphylococcus
aureus Sortase A the sequences were compared. The alignment of the different sequences is shown
below and as the residues differing are shown in magenta it is obvious that the sequences are almost
identical. The important residues in the active site are highlighted in green and are His120, Cys184
and R197. The starting point for the constructs is indicated with orange and His-tags of six residues
were added to the N- or the C-terminal in order to facilitate the purification of the protein.

41

42
7.2 Michaelis-Menten theory
Enzymes are biological catalysts that increase the rate of a chemical reaction by lowering the energy
barrier to the reaction. The action of enzymes can be described using the Michaelis-Menten rate
equation (8).
Equation 1: Michaelis-Menten rate equation
In equation 1 the [S] represents the substrate concentration, KM is the Michaelis-Menten constant
and Vmax is the maximum velocity at high substrate concentrations (8). As shown in figure 26 the KM is
the substrate concentration when the velocity is equal to half of the maximum velocity (8).
IC50 is a measurement used to investigate the effect of an inhibitor and is the concentration of
inhibitor required to reduce the activity of the enzyme with 50 %. Another way of measuring the
effect of an inhibitor is the term Ki. Ki is related to IC50 and is a measurement of the affinity of the
inhibitor (8). A small Ki indicates a high-affinity inhibitor and a large value of the constant indicates a
low-affinity inhibitor (8).
There are different actions of inhibitors. A competitive inhibition is when the inhibitor binds the
enzyme but not to the enzyme-substrate complex. In this case the Vmax will be unchanged for the
reaction while KM will increase (8). A non-competitive inhibition is when the inhibitor binds both the
enzyme and the enzyme-substrate complex with equal affinity. In this case the KM is unchanged but
the Vmax is lowered (8).
V
𝐾𝑀
𝑉𝑚𝑎𝑥2
Vmax
[S]
Figure 26: Michaelis-Menten curve. Vmax is the maximum velocity of the reaction and KM is the substrate concentration at the velocity of Vmax/2.

43
7.3 Fluorescence
The electronic phenomenon when molecules absorbs and emits photons is important to keep in
mind when working with assays based on fluorescence changes for the substrates. The theory of this
phenomenon is that when a compound absorbs light some of the molecules will be excited as
electrons are raised to a higher energy level (15). In that way the molecule is raised from its ground
state and when returning to the ground state again the molecule will emits some of the energy as
fluorescence (15). Due to collisions with other molecules for example some of the energy is lost (15).
In that way less energy is emitted as fluorescence than the energy originally absorbed by the
molecule and the wavelength of fluorescence is longer than the wavelength of the absorbed light.
The structure of the molecules can be connected to whether the compound will be fluorescent or
not. Compounds that show fluorescence are usually aromatic or contain conjugated double bonds,
which are alternating double and single bonds (15). Molecules containing electrons that undergo
energy transitions (such as π-, mobile or delocalization electrons and lone pair electrons) are also
likely to fluorescence (15). Different substituents on a molecule can also affect the fluorescence in
different ways as they can affect the degrees of freedom of the electrons in the molecules. A
substituent group that increases the degrees of freedom for the electrons are therefore likely to
cause the compound to be more fluorescent (15).
Using a FRET assay based on measuring the activity of the enzyme as a fluorescence response it is
important that the substrate is the only molecule affecting the results. Other molecules than the
substrate emitting or absorbing electrons will interfere in the assay.
7.4 Inner filter effect
When using fluorescent substrates a phenomenon called inner filter effect might appear. This
phenomenon is the case when, at high substrate concentrations, the rate versus substrate
concentration is not linear. This is due to the fact that at increasing substrate concentrations a
significant proportion of incident or emitted light is absorbed by high concentrations of the substrate
(6). This causes an inner filter effect and the light being absorbed affects the fluorescence signal of
the reaction. Working with fluorescent substrates it is therefore crucial to investigate this
phenomenon in order to make sure that the substrate does not interfere in the FRET assay.

44
Figure 29: MV080057
7.5 Structures
Figure 27: MV079877 Figure 28: MV079874
Figure 31: 4-(hydroxymercuri) benzoic acid sodium salt.
Figure 32: N-ethylmaleimide
Figure 30: MV080100

45
7.6 Mass spectrometry
Results from the mass spectrometry are shown in figure 33-35.
Figure 33: Analysis of the enzyme.

46
Figure 34: Analysis of the Abz/Dnp-substrate.
Figure 35: Analysis of the products from the transpeptidation reaction.

47
7.7 Analyzing the results
7.7.1 Rates of the reaction
The rate of the reaction was calculated as the slope of the fluorescence response over time using
equation 2.
∑ ̅ ̅
∑ ̅
Equation 2: Rate of the reaction.
In this equation the values y are the fluorescence response and the x-values are the time. Using the built
in function SLOPE in Excel the slope of the linear regression line through the chosen data points was
calculated.
Normally the initial rates of the reaction are investigated but when investigating the triglycine the final
rates were used. The reason for this is that at low concentrations of this substrate the rate of the
reaction will not be zero due to hydrolysis of the acyl-enzyme intermediate by water.
7.7.2 Absorbance
Absorbance of light at a wavelength of 420 nm makes a solution yellow. Since this is the maximum
emission wavelength of the Abz/Dnp-substrate used in the FRET assay, yellow solutions have a risk of
interfering in the assay. Therefore, the absorbance of colored compounds has to be investigated.
Absorbance is the logarithmic difference between the light falling on a sample and the light leaving the
sample.
Equation 3: Absorbance
Transmittance is another measurement of the fraction of light passing through a sample. This term was
used in order to investigate whether the decrease in fluorescence was due to absorbance of the
molecule or to actual inhibition. Investigating the effect of the absorbance on the activity measured in
the Ascent the percentage transmittances of the samples were calculated. This was done by normalizing
the values using the absorbance measurement of the control as a reference point of 100 % activity. The

48
value of the control was subtracted from the values of the samples and the remaining values were used
to calculate the percentage transmittance according to equation 4.
Equation 4: Transmittance
Dividing the value of the samples with the value of the control the rates of the samples were normalized
and a percentage activity was received. The results were investigated by plotting the percentage activity
and the percentage transmittance against the logarithmic concentration of the compound in the same
graph.
7.8 GraphPad Prism
Different functions of the GraphPad Prism were used in order to analyze the results from the different
experiments and to obtain kinetic information.
When investigating the inner filter effect the general Michaelis-Menten equation (Equation 1). When
studying the different triglycine concentrations a modification of the Michaelis-Menten equation was
made (Equation 5).
Equation 5: Michaelis-Menten rate equation plus a constant
The reason to why the Michaelis-Menten rate equation is modified by the addition of a constant is since,
at low glycine concentrations, the fluorescence signal will be higher than zero due to hydrolysis of the
acyl-enzyme intermediate by water.
Competitive inhibition is generally investigated by using equation 6 to calculate the rate of the reaction.
Equation 6: Competitive inhibition
When investigating competitive inhibition in GraphPad Prism a function called ‘Log Competitive
Inhibition’ was used.

49
Equation 7: Log Competitive inhibition
This equation represents the equation for competitive inhibition described above but where the inhibitor
concentration is converted to a logarithmic scale due to the wide range of concentrations. Using this
equation the total inhibitor concentration is approximated being equal to the free inhibitor
concentration. This is a valid approximation as long as the concentration of inhibitor being bound to the
enzyme is so small compared to the free fraction.
As the total inhibitor concentration cannot be approximated to be equal to the free inhibitor, i.e. when
the enzyme-inhibitor complex is at a high proportion and cannot be ignored, equation 7 cannot be used.
Then a more complicated equation has to be used in order to calculate the rates of the reaction
(equation 8).
√
2
Equation 8: Inhibition without approximation of total [I]
Where
When investigating the concentration of a compound needed in order to reduce the activity of enzyme
to 50 %, IC50, equation 9 was used.
Equation 9: IC50


