European Journal of Advanced Research in Biological and Life Sciences Vol. 5 No. 1, 2017 ISSN 2056-5984 Progressive Academic Publishing, UK Page 63 www.idpublications.org BACTERIOLOGICAL LEVELS IN WATER DISTRIBUTED BY KEWASCO Mutai Norah Chepkemoi Lecturer, School Of Biological and Physical Sciences Moi University, KENYA ABSTRACT Availability of safe and portable water may not be easy due to inadequate control, operation and maintenance of the water distribution system in developing countries. This study was conducted to ascertain whether water supplied by Kericho Water and Sanitation Company (KEWASCO) is safe for human consumption or not. Bacteriological parameter analysed was: E. coli. Samples were collected three times during the months of January, February and March from four stations namely, rivers feeding into the treatment plants, treatment plants (treated water), consumer terminals and dumpsite leachate. LST-MUG method was employed for detecting E.coli. E.coli tested negative in the first and second test in all stations while it tested positive in the third test in only two stations. The water which tested positive with E.coli from the consumer points was an indication that the water systems should be inspected to determine the cause. Sampling and inspection should continue until consecutive samples comply with the standards in the guidelines. The measure of E.coli was, however, within the water quality standards for municipal piped water and therefore fit for drinking. It is suggested that further research that focus on more resistant microorganisms, such as bacterio-phages and/or bacterial spores be done. Keywords: Water portability, bacteriological load, E-coli. INTRODUCTION Distribution of safe, potable water by Kericho Water and Sanitation Company (KEWASCO) may not be easy due to inadequate control, operation and maintenance of the water distribution system, especially in developing countries (Serageldin, 1994).Thus, the quality of drinking water can deteriorate significantly between the treatment plant and the consumers’ taps. Water utilities experience microbial problems in their distribution system that cannot be attributed to either operating or disinfection practices. Drinking water distribution systems provide a habitat for microorganisms that are sustained by both organic and inorganic nutrients present in the pipe and/or the conveyed water. Excessive microbial activity can lead to deterioration of the water in the aesthetic terms of colour, taste and odour. It may also interfere with the methods used to monitor such parameters of health significance as faecal coliform (FC) count, viral and helminthic ratio and biochemical oxygen demand percentage. Lack of information on the deterioration of water quality within a distribution system due to contamination intrusion exposes the consumers to effects stemming from these contaminants. This poses a great risk of such water-related diseases as cholera and typhoid to the consumers (Wilson, 1945). Water distribution systems need to be safeguarded against pollutants, an end that can only be attained by surveillance. These pollutants can be identified using bacteriological and physico- chemical parameters and include organic and inorganic materials. Major organic pollutants majorly found within water distribution systems include bacteria, viruses and parasites. The
Transcript
European Journal of Advanced Research in Biological and Life Sciences Vol. 5 No. 1, 2017 ISSN 2056-5984
Progressive Academic Publishing, UK Page 63 www.idpublications.org
BACTERIOLOGICAL LEVELS IN WATER DISTRIBUTED BY
KEWASCO
Mutai Norah Chepkemoi
Lecturer, School Of Biological and Physical Sciences
Moi University, KENYA
ABSTRACT
Availability of safe and portable water may not be easy due to inadequate control, operation
and maintenance of the water distribution system in developing countries. This study was
conducted to ascertain whether water supplied by Kericho Water and Sanitation Company
(KEWASCO) is safe for human consumption or not. Bacteriological parameter analysed was:
E. coli. Samples were collected three times during the months of January, February and
March from four stations namely, rivers feeding into the treatment plants, treatment plants
(treated water), consumer terminals and dumpsite leachate. LST-MUG method was
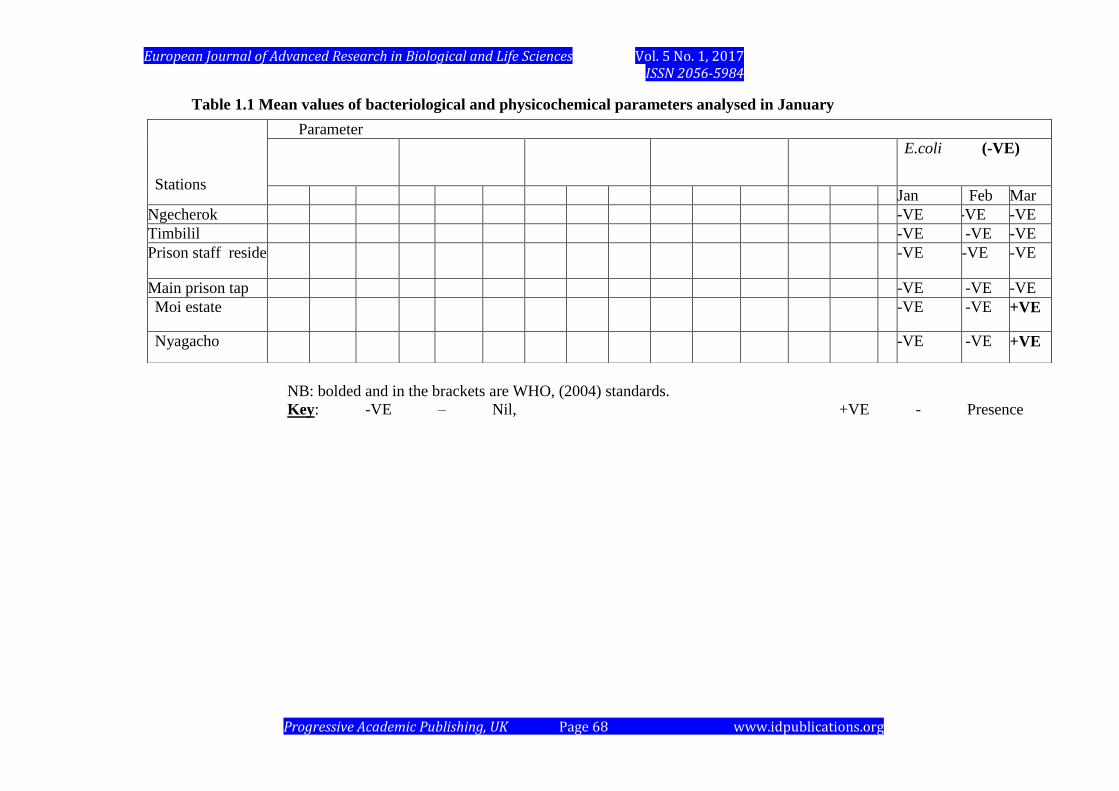
employed for detecting E.coli. E.coli tested negative in the first and second test in all
stations while it tested positive in the third test in only two stations. The water which tested
positive with E.coli from the consumer points was an indication that the water systems should
be inspected to determine the cause. Sampling and inspection should continue until
consecutive samples comply with the standards in the guidelines. The measure of E.coli was,
however, within the water quality standards for municipal piped water and therefore fit for
drinking. It is suggested that further research that focus on more resistant microorganisms,
such as bacterio-phages and/or bacterial spores be done.
Keywords: Water portability, bacteriological load, E-coli.
INTRODUCTION
Distribution of safe, potable water by Kericho Water and Sanitation Company (KEWASCO)
may not be easy due to inadequate control, operation and maintenance of the water
distribution system, especially in developing countries (Serageldin, 1994).Thus, the quality of
drinking water can deteriorate significantly between the treatment plant and the consumers’
taps. Water utilities experience microbial problems in their distribution system that cannot be
attributed to either operating or disinfection practices. Drinking water distribution systems
provide a habitat for microorganisms that are sustained by both organic and inorganic
nutrients present in the pipe and/or the conveyed water. Excessive microbial activity can lead
to deterioration of the water in the aesthetic terms of colour, taste and odour. It may also
interfere with the methods used to monitor such parameters of health significance as faecal
coliform (FC) count, viral and helminthic ratio and biochemical oxygen demand percentage.
Lack of information on the deterioration of water quality within a distribution system due to
contamination intrusion exposes the consumers to effects stemming from these contaminants.
This poses a great risk of such water-related diseases as cholera and typhoid to the consumers
(Wilson, 1945).
Water distribution systems need to be safeguarded against pollutants, an end that can only be
attained by surveillance. These pollutants can be identified using bacteriological and physico-
chemical parameters and include organic and inorganic materials. Major organic pollutants
majorly found within water distribution systems include bacteria, viruses and parasites. The
European Journal of Advanced Research in Biological and Life Sciences Vol. 5 No. 1, 2017 ISSN 2056-5984
Progressive Academic Publishing, UK Page 64 www.idpublications.org
most useful indicators of faecal contamination are thermotolerant coliforms such as E. coli,
Salmonella spp and Shigella spp as they are directly related to the presence of faecal
contamination hence to the risk of disease. Bacteriological contamination poses the greatest
threat to the health of the consumers. Viral and helminthic parasites may also be present in
water, though these are less frequent and more difficult to identify in a given water sample
Statement of the Problem
World health organization has set standards torching on virtually every sphere of life and
standard on water portability is no exception. Drinking water need to be free of harmful
impurities such as bacteria. Water distributed by water authorities for domestic consumption
should meet such standard, domesticated to Kenya context by Kenya bureau of standards.
The purpose of this study was to analyze the portability of water distributed by KEWASCO
in terms of bacteriological load
Objectives of the study
The objective of this study was to determine bacteriological parameter at consumer points of
water distributed by Kericho Water and Sewarages Company.
LITERATURE REVIEW
The earliest precursor of pollution generated by life forms would have been a natural function
of existence. The attendant consequences on viability and population levels fell within the
sphere of natural selection. These would have included the demise of a population locally or
ultimately, species extinction. Processes that were untenable would have resulted in a new
balance brought about by changes and adaptations. At the extremes, for any form of life,
consideration of pollution is superseded by that of survival (Chatwell, 1989).
For humankind, the factor of technology is a distinguishing and critical consideration, both as
an enabler and an additional source of byproducts. Short of survival, human concerns include
the range from quality of life to health hazards. Since science holds experimental
demonstration to be definitive, modern treatment of toxicity or environmental harm involves
defining a level at which an effect is observable (Bartone et al., 1994).
The raw water will go through some processes in water treatment plant such as coagulation or
flocculation, sedimentation, filtration, stabilization, fluoridation, chlorination and finally
before allowing water to be used in the residential area, water will be tested for a few
contaminants again. This is to ensure that the drinking water distributed is safe to be
consumed by the public.
Mwangi et al. (2010) found out that E. coli MPN index per 100 ml ranged between 43- >
1100 against WHO standards. The bacteriological quality of the water as indicated by the
total and faecal coliform counts exceeded the standard (0 cfu per 100 ml) for portable water.
In general, the bacteriological quality of the water was unacceptable as it may pose risk to
consumers if not treated. The poor quality indicated possible contamination with human or
animal waste that could have been contributed by inadequate physical infrastructure,
especially heavy reliance on pit latrines and weak solid waste management mechanisms.
Lack of functioning solid and liquid waste management system in the rapidly growing urban
European Journal of Advanced Research in Biological and Life Sciences Vol. 5 No. 1, 2017 ISSN 2056-5984
Progressive Academic Publishing, UK Page 65 www.idpublications.org
centre represents a possible and significant source of pollutants, which may find their way
into water resources.
Although the WHO guidelines placed a lot of emphasis first and foremost on the
microbiological safety of drinking water supplies, more than half of the world’s population is
still exposed to water that is not free from pathogenic organisms. This has resulted in
infectious diseases that ultimately lead to increased mortality rates in the population (WHO,
2003).
The current study recorded a general decrease in TDS, conductivity, and total alkalinity from
January to March for all sampling points possibly because of dilution effect as a result of
heavy rain experienced in March. Mwangi et al. (2010) noted that conductivity ranged
between 0.07 to 0.85 and 0- 180 EC mS/cm during wet and dry seasons, respectively. These
values were, however, not in agreement with the results reported in the current study that
ranged from 35 – 70 µs.
The corresponding TDS ranged between 21- 62.40 and 0-123 mg/L during wet and dry
seasons as observed by Mwangi et al. (2010) which again were higher than the values
obtained in the present study that ranged from 16- 30 mg/L. This could be due to as a result
of inorganic fertilizers used by farmers. In another study, Akunga (2004) reported mean
measurements for electrical conductivity to be 39.95µS for four private man-made reservoirs
in the central part of Kericho count conducted between November 2001 and March 2002.
This value was in close agreement with the values obtained in the present research.
The conductivity of rivers in the United States generally ranges from 50 to 1500 µmhos/cm.
Studies of inland fresh waters indicate that streams supporting good mixed fisheries have a
range between 150 and 500 µhos/cm. Conductivity outside this range could indicate that the
water is not suitable for certain species of fish or macro invertebrates. Industrial waters can
range as high as 10,000 µmhos/cm (APHA, 1992). The values reported in most rivers in USA
were comparable to the values reported in this current study which ranged from 35-70 µs.
This means majority of the stations recorded values which were 50 µs and above.
Fafioye and Adebanjo (2013) in their study reported several mean physico-chemical
parameters of Azikwe River water samples in Nigeria were: pH-7.75 ± 0.3, alkalinity (mg/L)