Stimulable and Spontaneous Bioluminescence in the Marine Dinoflagellates, Pyrodinium bahamense, Gonyaulaxpolyedra, and Pyrocystis lunula W. H. BI GGLEY, E. S WI FT,R.J. BUCHANAN, and H. H. SELIGER From the McCoUum-Pratt Institute and the Department of Biology,and the Chesapeake Bay Institute, The Johns Hopkins University, Baltimore, Maryland 21218. Dr. Swift's present address is Graduate School of Oceanography, University of Rhode Island, King~ton, Rhode Island 02881. Dr. Buchanan's present address is Department of Civil Engineering, Univer- sity of Washington, Seattle, Washington 98105 ABSTRACT P. bahamense, G. polyedra, and P. lunula exhibit interspecies differ- ences in stimulable and spontaneous bioluminescence. For each species the total number of photons that can be emitted upon mechanical stimulation is a con- stant, regardless of the time during scotophase at which stimulation occurs. Ratios of stimulable bioluminescence per organism during scotophase and photo- phase are as high as 950:1 for laboratory cultures and have been observed as high as 4000: 1 for natural populations of P. bahamense. Spontaneous emission in darkness shows flashing as well as low-level continuous emission. Natural popu- lations of P. bahamense, placed in darkness during natural photophase, exhibit a dual character to their stimulable bioluminescence. Mechanical stimulation techniques are described for rapid and reproducible stimulation of biolumines- cence. INTRODUCTION In previous papers dealing with the natural rhythms of bioluminescence of the tropical marine dinoflagellate Pyrodinium bahamense (Seliger et al., 1962; Taylor et al., 1966; Seliger and McElroy, 1968), both the shapes of the daily stimulable bioluminescence curves and the night-to-day ratios of stimulable bioluminescence differed markedly from the results reported by Hastings and Sweeney (1957, 1958, 1959), Sweeney and Hastings (1957, 1958, 1960), and Sweeney et al. (1959) for laboratory cultures of a different species, Gonyaulax polyedra. 96 The Journal of General Physiology on December 21, 2018 jgp.rupress.org Downloaded from http://doi.org/10.1085/jgp.54.1.96 Published Online: 1 July, 1969 | Supp Info:
Transcript
Stimulable and Spontaneous
Bioluminescence in the Marine
Dinoflagellates, Pyrodinium bahamense, Gonyaulax polyedra, and Pyrocystis lunula
W. H. BI G G L E Y , E. S WI F T , R . J . B U C H A N A N , and H. H. S E L I G E R
From the McCoUum-Pratt Institute and the Department of Biology, and the Chesapeake Bay Institute, The Johns Hopkins University, Baltimore, Maryland 21218. Dr. Swift's present address is Graduate School of Oceanography, University of Rhode Island, King~ton, Rhode Island 02881. Dr. Buchanan's present address is Department of Civil Engineering, Univer- sity of Washington, Seattle, Washington 98105
ABSTRACT P. bahamense, G. polyedra, and P. lunula exhibit interspecies differ- ences in stimulable and spontaneous bioluminescence. For each species the total number of photons that can be emitted upon mechanical stimulation is a con- stant, regardless of the time during scotophase at which stimulation occurs. Ratios of stimulable bioluminescence per organism during scotophase and photo- phase are as high as 950:1 for laboratory cultures and have been observed as high as 4000: 1 for natural populations of P. bahamense. Spontaneous emission in darkness shows flashing as well as low-level continuous emission. Natural popu- lations of P. bahamense, placed in darkness during natural photophase, exhibit a dual character to their stimulable bioluminescence. Mechanical stimulation techniques are described for rapid and reproducible stimulation of biolumines- cence.
I N T R O D U C T I O N
In previous papers deal ing wi th the na tura l rhy thms of bioluminescence of the tropical mar ine dinoflagellate Pyrodinium bahamense (Seliger et al., 1962; Tay lo r et al., 1966; Seliger and McElroy, 1968), both the shapes of the dai ly st imulable bioluminescence curves and the night- to-day ratios of s t imulable bioluminescence differed marked ly from the results reported by Hast ings and Sweeney (1957, 1958, 1959), Sweeney and Hastings (1957, 1958, 1960), and Sweeney et al. (1959) for laboratory cultures of a different species, Gonyaulax polyedra.
96
The Journal of General Physiology
on December 21, 2018jgp.rupress.org Downloaded from http://doi.org/10.1085/jgp.54.1.96Published Online: 1 July, 1969 | Supp Info:
W . H . BIOGLEY E T A L . Stimulable and Spontaneous Bioluminescenee 97
We therefore established unialgal laboratory cultures of P. bahamense and G. polyedra, as well as a third nonmotile species, Pyrocystis lunula, and developed precise mechanical stimulation and light measurement techniques. We have made a comparative study of the bioluminescence of these three species under identical conditions of laboratory culture as well as of the bioluminescence of natural populations of P. bahamense. The present paper describes our tech- niques and the results of these comparisons.
M'ATERIALS AND METHODS i
A. Dinoflagellate Cultures
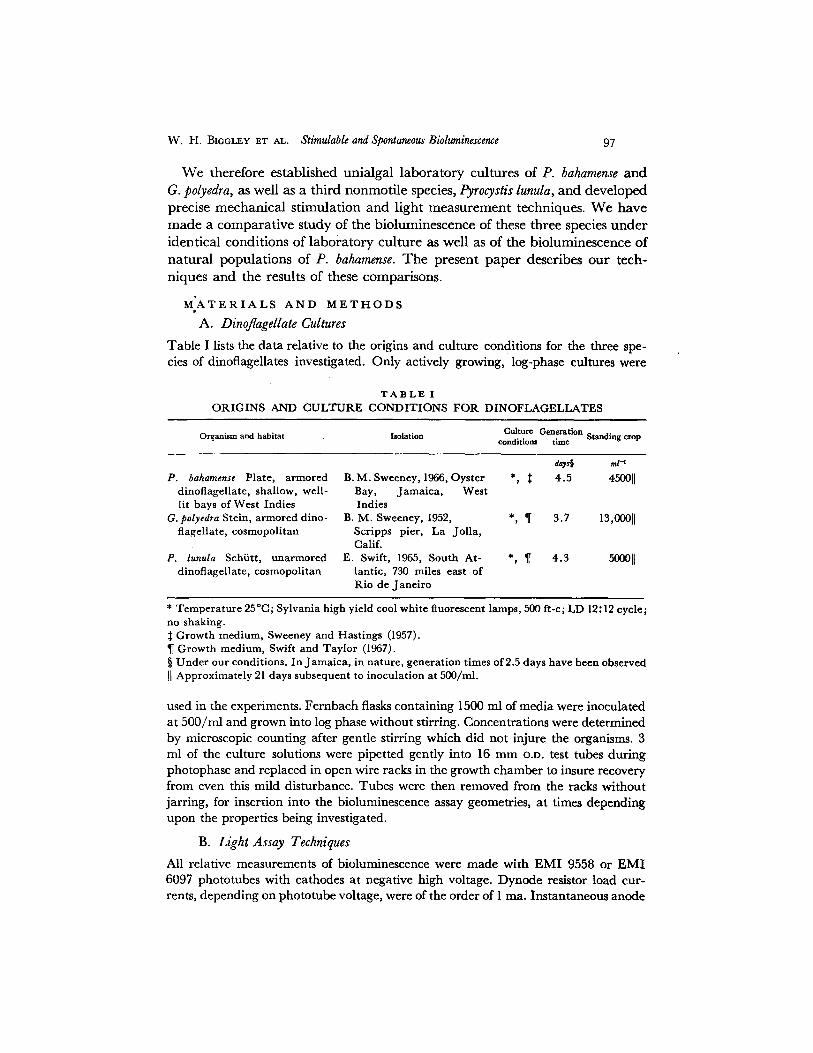
Table I lists the data relative to the origins and culture conditions for the three spe- cies of dinoflagellates investigated. Only actively growing, log-phase cultures were
T A B L E I
ORIGINS AND CULTURE CONDITIONS FOR DINOFLAGELLATES
Cul tu r e G e n e r a t i o n ~ . . O r g a n i s m and h a b i t a t Isola t ion . . . ~ t a n a m g crop
¢ondttlonll t i m e
P. bahamense Plate, armored B.M. Sweeney, 1966, Oyster *, :[: dinoflagellate, shallow, well- Bay, Jamaica, West lit bays of West Indies Indies
G. polyedra Stein, armored dino- B.M. Sweeney, 1952, *, ¶ flagellate, cosmopolitan Scripps pier, La Jolla,
Calif. P. lunula Schiitt, unarmored E. Swift, 1965, South At- *, ¶
dinoflagellate, cosmopolitan lantic, 730 miles east of Rio de Janeiro
d~s§ mt-t 4.5 450011
3.7 13,00011
4.3 50o011
* Temperature 25 °C; Sylvania high yield cool white fluorescent lamps, 500 ft-c; LD 12:12 cycle; no shaking. :~ Growth medium, Sweeney and Hastings (1957). ¶ Growth medium, Swift and Taylor (1967). § Under our conditions. In Jamaica, in nature, generation times of 2.5 days have been observed II Approximately 21 days subsequent to inoculation at 500/ml.
used in the experiments. Fernbach flasks containing 1500 ml of media were inoculated at 500/ml and grown into log phase without stirring. Concentrations were determined by microscopic counting after gentle stirring which did not injure the organisms. 3 ml of the culture solutions were pipetted gently into 16 mm O.D. test tubes during photophase and replaced in open wire racks in the growth chamber to insure recovery from even this mild disturbance. Tubes were then removed from the racks without jarring, for insertion into the bioluminescence assay geometries, at times depending upon the properties being investigated.
B. Light Assay Techniques
All relative measurements of bioluminescence were made with EMI 9558 or EMI 6097 phototubes with cathodes at negative high voltage. Dynode resistor load cur- rents, depending on phototube voltage, were of the order of 1 ma. Instantaneous anode
98 T H E J O U R N A L O F G E N E R A L P H Y S I O L O G Y • V O L U M E 5 4 " 1969
currents never exceeded 0.01 ma and more usually were below 0.001 ma. Electrom- eter DC amplifiers (Seliger et al., 1962) were used throughout in conjunction with Sanborn Model 320 recorders.
At this point we shall introduce a terminology to describe the various parameters that were measured. All three species of dinoflagellates exhibit nocturnal stimulable bioluminescence. The measurements of natural populations in Oyster Bay, Jamaica , W. I., were made with a photometer unit containing an impeller pump which stimu- lated the organisms to emit light and in addition maintained a constant flow of fresh
Anode of Phototube
O. I/J.F
t0Lt09SZ
Anode of Phototube /
(a} Chart Recorder
T S L dt Channel I
c
II MS't
l" i I
(b)
"r. Channel 2
Chart Recorder
SUSI Z Channel 1
SUSI ~ I Channel 2 (X lOOgo in )
FIGURe- 1. Schematic drawings of the feedback DC amplifiers used for measurement of dinoflageUate bioluminescence. (a) Integrating circuit with RC differentiating network at output of PC amplifier; (b) standard circuit for measuring light intensities.
organisms. Above some minimum pumping speed the observed mechanically stimulable intensity, MSI, was direcdy proportional to the concentration of dinoflagellates being pumped. In the laboratory measurements, a 3 ml volume of solution containing the organisms was either stirred or bubbled until no further bioluminescence was emitted. The total stimulable light, TSL, emitted by the sample was measured with the circuit shown in Fig. 1 a. The mechanically stimulable intensity, MSI, as a function of time was obtained with the differentiating circuit shown in Fig. 1 a. There is also a very low-intensity bioluminescence observed in darkness under conditions of no external stimulation. This spontaneous unstimulated intensity, SUSI, was measured with the circuit shown in Fig. 1 b. The phototube gain and feedback resistors were set so that the largest SUSI flashes could be recorded in recorder channel 1 without saturation, while recorder channel 9, at up to 100 times the sensitivity of channel 1 (at a level
W. H. BIGGLEY ET AL. Stimulable and Spontaneous Bioluminescence 99
where the phototube dark current was just discernible) recorded small flashes not detected in channel 1, as well as the continuous emission. In this way we could obtain SUSI flashing rates and pulse height distributions simultaneously with the continuous low-level SUSI. We also use LD 12" 12 to indicate a light-dark photoperiod of 12 hr of light (photophase) followed by 12 hr of dark (scotophase). Times during these phases will be referred to as D. or Ln. For example, De means 6 hr into the dark period. The properties of bioluminescence that were examined as well as the time periods involved are summarized in Table II.
T A B L E I I
PARAMETERS MEASURE D AND TIME PERIODS OF M E A S U R E M E N T
Property of bioluminesccncc measured Time period of meaturcment
Absolute photon emission per organism Increase of MSI and TSL in dark Constancy of MSI and TSL during dark
phase Decrease of MSI and TSL in light Entra ined rhy thm of TSL Entrained rhythm of SUSI Diphasic character of TSL
Dark recovery of TSL
D4 to D8 L n to De D1 to DI~
D6 to L6 D6 to D~o* Do through D485 Placed in dark at L6; MSI and TSL assayed
subsequently Stimulated at D6; MSI and TSL assayed subse-
quently at 5 rain intervals
* D20 means that the lights were not turned on at DI~ but that the organisms were continued in darkness for 8 more hr.
D48 means continued darkness for 36 hr past DIs.
C. Mechanical Stimulation of Organisms
The dinoflagellates were mechanically stimulated by both bubbling and stirring. The sample test tube containing 3 ml of dinoflagellates in culture medium was fixed vertically and reproducibly alongside the end-on phototube face. Stirring was accomplished with the " U " portion of a straightened Giant Gem paper clip, fitted into the rotor of an 1800 rpm motor. The U portion of the clip extended approximately two-thirds of the way into the sample and rotation produced an extremely turbulent solution. Bubbling was produced by means of a small air pump adjusted to a flow of 1.5 liters per min through a No. 15 cannula (0.137 mm I.D.), with the cannula tip extending halfway down into the sample.
D. Spontaneous Unstimulated Intensity
Samples of SUSI were measured as a thin layer (6 mm) of solution in a flat-bottomed quartz cylindrical cell (2.5 cm I.D. (inside diameter)) sitting directly on the flat face (5 cm D) of a vertically mounted phototube. The cell was covered by a hemispherical mirror to increase the efficiency of the light collection and also to retard evaporation during the measuring period (see Table II). In this way the geometry was reasonably constant for all organisms emitting within the volume.
I O 0 THE JOURNAL OF GENERAL PHYSIOLOGY • VOLUME 54 " 1969
R E S U L T S
All data are reported in absolute units of photons per second per organism for intensities (MSI, SUSI) or photons per organism for total light (TSL), based on an independent absolute calibration reported separately?
A. Experimental Precision
There are several sources of error in the determination of TSL per organism. There are (a) possible nonuniformities in organism concentrations in the culture flasks; (b) real differences in TSL per organism in any particular species, depending on the age and density of the culture, the previous light- dark history of the culture, the natural variability of the organisms them- selves, and differences among different cultures of the same species; (c) changes over long periods of time, in either spectral sensitivity or amplification factors of the phototubes used for light measurements; (d) variations in the degree of turbulence produced by the mechanical stimulation method.
For (a) we have been able to demonstrate that with gentle stirring in the 1 liter culture flasks, successive withdrawals of 1 ml samples for nficroscopic counting could be counted with a coefficient of variation s of 6 %.
For (b) we have shown that for all three species TSL is constant from ap- proximately D1 through Dn within the precision of a set of measurements made over a short time interval. The coefficient of variation of TSL for a series of 20 consecutive samples of G. polyedra was 11%.
We have followed individual cultures from the time of inoculation through log phase of growth into stationary phase, in some cases for as long as 27 days. Typical data for TSL per organism determined at D4 for all three species are shown in Table III . Since we have not yet studied the effects of intensity and the spectral quality of ambient light on the growth and bioluminescence of these organisms, we maintained our culture conditions constant so that at least the species comparisons could be made. We did verify, however, that a factor of two increase in ambient light intensity had no effect on the observed bioluminescence.
For (c) we used a hermetically sealed, radioactive light source, consisting of ~4C homogeneously incorporated into a luminescent epoxy resin. With this constant intensity light source we have been able to maintain a continuing check on our phototube sensitivities.
a Seliger, H. H. , W. H. Biggley, and E. Swift. 1969. Tota l s t imulable light emission in the mar ine dinoflagellates, Pyrodinium bahamense, Gonyaulax polyedra and Pyrocystis lunula. Photochem. Photobiol. In p re~ . 2 Defined as the s t anda rd deviat ion divided by the m e a n in per cent.
W. H. BIGGLEY ET AL. Stimulable and Spontaneous Bioluminescence io i
For (d) we verified that changes of 4-50 % in the bubbling rate or the stirring rate did not affect the T S L readings during scotophase.
B. Photoperiod-Entrained Rhythms of Nocturnal TSL per Organism
1. LABORATORY CULTURES
None of the three species exhibits exactly the same kinetics of MSI. For example the MSI of P. bahamense during photophase and subsequent to the
T A B L E I I I
EXAMPLES OF E X P E R I M E N T A L PRECISION F O R LABORATORY CULTURES T H R O U G H O U T LOG PHASE G R O W T H
T i m e after inocula-
tion
P. bahamense G. polyedra P. lunula
Cells in 3 ml TSL/cel l Cells in 3 ml TSL/cel l Ceils in 3 ml TSL/cell
TSL TSL TSL Average cell : 3.35 X l0 s Average cell : 1.17 X 10⁸ Average cell :38.9 X l0 s
Coefficient of variation : Coefficient of variation : Coefficient of variation : 17°/o 8.2°/o 19%
onset of scotophase is shown in Fig. 2. Mechanical stimulation of a population of P. bahamense results in a cumulative flash which has the same relative shape in scotophase as in photophase.
The MSI flashes of P. lunula are essentially the same as those of P. bahamense. However, as the result of mechanical stimulation, P. lunula emits a low-level continuous glow, presumably due to cell damage, which persists after me- chanical stimulation has stopped. A glow is also observed if a droplet of culture medium containing the organisms adheres to the side of the test tube and the
I 0 2 T H E J O U R N A L O F G E N E R A L P H Y S I O L O G Y • V O L U M E 54 • ] 9 6 9
solution begins to evapora te . Fo r this reason, on ly the p a p e r clip st irr ing technique , wh ich evoked the m a x i m u m initial M S I and resul ted in the least
splashing of solution to the sides of the test tubes, was used for T S L measure -
MSI P. bahomense "~.~-20-68
STIMULATION BY STIRRING
o "
o3
5: ~>
n~
1:)+5' D+O'-
D - 1 8 ' ~ l = i J 0 1 2 5 4 5 6
Seconds
D+3#
Seconds Seconds
F]om~a~ 2. Shapes of MSI flashes of P. bahamense popula- tions during the transition from photophase to seotophase. The ordinates are in relative inten- sity units for each curve. The curves are displaced vertically from one another by distances corresponding to the time during scotophase at which MSI was measured. The three vertical sections were measured at relative electronic gains of 1, 1/10, and 1/100.
men t s of P. lunula. D u r i n g p h o t o p h a s e the con t inuous g low emi t t ed as the resul t o f m e c h a n i c a l s t imula t ion p r o d u c e d a m u c h la rger con t r ibu t ion to T S L t h a n the M S I flash. W e assumed tha t this was due to in jury to the or-
W. H. BIGGLEY E,T AL. Stimglabl¢ and Spontaneous Bioluminescence zo3
ganisms. Therefore for all TSL measurements of P. lunula we arbitrarily inte- grated the light emission over the time period during which the flash decays to 10 % of its peak value. During scotophase, the glow induced by mechanical
O
w-
>=
D+3G
D+ 1 9 ' / ~
MSI G. polyedro "v'- 20 - 60
STIMULATION BY STIRRING
D+7~ "-.-
D+I2'
D+ 7'.
D÷ O' D_3 ' ,F ~ ~
o ~ ,b ,~ ~'o 2'5 ~'o ~5 ~o ~ ~o 61~"' 3 4 5 o l23k Seconds Seconds Sec~ds
FIOURE 3. Shapes of MSI flashes of G. polyedra populations during the transition from photophase to scotophase. The ordinates are in relative intensity units for each curve. The curves are displaced vertically from one another by distances corresponding to the time during scotophase at which MSI was measured. The three vertical sections were measured at relative electronic gains of 1, 1/10, and 1/100.
stimulation was negligible compared with the MSI flash and therefore the time period over which TSL was measured was not as critical.
G. polyedra does not exhibit this stimulation-induced glow. However, during photophase there are two different types of mechanically stimulable bio-
zo4 TIIE JOURNAL OF GENERAL PIIY$1OLOOY • VOLUME 54 " 1969
luminescence (Fig. 3). There is a low-level continuous MSI component which can persist for several minutes. This component is extremely sensitive to the degree of turbulence produced by the stimulation technique and is much less intense for bubbling (even under our opt imum conditions) than for stirring. Around Do + I0 min MSI flashes become apparent and the low-level con- tinuous MSI decreases. Subsequent to Do + 30 min there is no observable low-level continuous MSI, and the MSI flashes of G. polyedra have the same relative shapes as those for P. bahamense and P. lunula. However, even in
. _ , l
W
n.-
fl,. (/') Z o I.- 0 "r" rt
z
n,, Q
b . I
J I-
IO
i o e
i o 7
Io e
T S L P.bohomense
X - 1 0 - 6 7 O-STIMULATION BY BUBBLING
o • • -STIMULATION BY STIRRING ~ - - Q = r ~ , - . - ~ c J
i i i i i i i i i i i 1 i J i i i i
L 6 L s LIO Do D 2 D 4 D 6 D e
P H O T O P H A S E S C O T O P H A S E
i i , J i i i i !
Dio Dr2 Lz L 4 L 6
P H O T O P H A S E
FIOUm~ 4. Photoperiod-entrained TSL per organism for P. bahamense in absolute units of photons over a complete photoperiod.
scotophase, TSL of G. polyedra was more sensitive than that of the other two species to degree of turbulence, and TSL values obtained with paper clip stirring were consistently higher than those obtained with bubbling.
Single periods of the photoperiod-entrained rhythms of nocturnal TSL per organism in absolute units of quanta for P. bahamense, G. polyedra, and P. lunula are shown in Figs. 4-6, respectively. It should be emphasized that the data of Figs. 4-6 are repeatable during every photoperiod over the entire culture life (inoculation through stationary phase) as implied by Table III . Because of the large scotophase to photophase variations, the TSL data are plotted on a logarithmic scale. The abscissae are in hours relative to the be- ginning of scotophase or photophase, which in laboratory cultures are step functions. The scotophase is shaded. In Fig. 4, the results of bubbling and
W. H. BIOOLEY ET AL. Stimulable and Spontaneous Bioluminescence xo5
paper clip stirring for P. bahamense are plotted together since TSL was equally sensitive to either method of stimulation.
The paper clip stirring data for G. polyedra are plotted in Fig. 5 a separately from the bubbling data which are shown in Fig. 5 b. As we have described above, TSL during scotophase (D, to Dn) is the result of a large MSI flash which decreases to zero intensity within approximately 5 see (Fig. 3). Thus TSL is independent of the integration time. However, during photophase, the integration time determines the total light measured. In Fig. 5 a values of TSL per organism during photophase are shown for integration times of 5, 30, and 90 see. The large differences between bubbling and stirring TSL during photophase for G. polyedra are evident from Fig. 5 b in which for the same cul- ture, TSL per organism is plotted for bubbling periods of 120 see. Even during scotophase, TSL per organism obtained by bubbling is somewhat lower (15 %) than that obtained by stirring.
The corresponding data for stirring TSL per organism for P. lunula, shown in Fig. 6, agreed with checking experiments in which bubbling was used for stimulation, although as explained above, the bubbling data were more erratic because of splashing.
For ease of discussion, we shall list the following points: (a) The increases in TSL per organism subsequent to D 0 are extremely rapid and exponential, with doubling times of 5-8 rain for all three species. (b) Maximum values of TSL per organism are attained within 60-90 min of initiation of scotophase. (c) From D, through Dn, TSL per organism is constant within the precision of the measurements. (d) There is a small decrease in TSL per organism be- tween Dn and D,2, just before the initiation of photophase. The effect is largest for G. polyedra. (e) Subsequent to photophase, there are rapid exponen- tial decreases in TSL per organism. However, under our laboratory growth conditions, the decrease for P. bahamense (Fig. 4) is not nearly as rapid as for G. polyedra or P. lunula. The half-times for decrease of TSL per organism are 50 min for P. bahamense, 9 min for G. polyedra, and 4-5 min for P. lunula. (f) The maximum scotophase-to-photophase ratios of TSL per organism are approxi- mately 200:1 for P. bahamense and G. polyedra. For P. lunula the ratio is much larger and depends on the integration time during photophase. If we arbi- trarily integrate over the time during which the photophase flash decays to 10 % of its peak value, the ratio is 950: 1.
2. NATURAL POPULATIONS
We performed similar measurements of TSL per organism with natural popu- lations of P. bahamense, freshly removed from Oyster Bay, Jamaica, W. I. Samples taken during natural photophase were separated into two sets of test tubes. Set A was placed in total darkness one-half hour before sunset. Set B was allowed to remain in natural photoperiod. TSL per organism was meas-
zo6 T H E J O U R N A L O P G E N E R A L P H Y S I O L O G Y • V O L U M E 5 4 " I969
ured for bo th sets a t intervals th roughout the next 19 hr. W e obta ined the fol- lowing results: (a) T h e immedia te rate of increase in T S L per organism for set A (step funct ion scotophase) was greater than for set B (natural scoto-
..J h i L)
E IOe LIJ D.
U~ z 0 I-.- 0 -I-
i 0 7
U)
z <E (9 E 0
CC i 0 s LI.J O..
. J ( / )
I.-
1 0 9 --_
0
E
10 5 = i i = =
L 6 L 8 Lio PHOTOPHASE
(
(
®,.
G. po lyedra
~ - 2 0 - 6 7
STIMULATION BY STIRRING
o e e e n •
S . . - .
®
i , i i | i | i i i i | i = i | i [
I~ o D 2 D4 Ds De DIo Diz LZ L4 L6
SCOTOPHASE PHOTOPHASE
FmURE 5 a FIGURE 5. Photoperiod-entrained TSL per organism for G. poly¢dra in absolute units of photons over a complete photoperiod. (a), TSL per organism as a result of paper clip stirring. During photophase and the transition time Do to D1 light emission was integrated for 5, 30, and 90 sec as shown by the encircled numbers. The data during scotophasc represented bythe solid circles are independent of time of integration. (b), TSL per organ- ism as a result of bubbling. During photophase and the transition time Do to DI light emission was integrated for 120 sec. During scotophase the data are independent of time of integration.
phase). (b) F r o m 1 hr past sunset th roughout the scotophase, T S L per orga- nism was identical for both sets. (c) Subsequent to dawn, set B (natural photo- period) exhibited the same rapid decreases in T S L per organism as the M S I na tura l photoper iod da t a of Seliger and McEl roy (1968). (d) Set A, kept in darkness th rough D17, exhibited a very gradual decrease in T S L per organism beginning a round Du. (e) At D17, corresponding to L5 of the na tura l photo-
W . H. BXGGLEY ET AL. Stimulable and Spontaneous Bioluminescence xo7
period, set A was removed from the dark and placed in ambient sunlight. The decrease in TSL per organism was precipitous, even more rapid than observed for set B under natural photoperiod.
[ 0 9 - -
n~ 108 -- LI.I 13.
¢/~ Z 0 I-- 0 I
10 7 =
tj)
z <z (.9 n- O
,,, 10 6 ..-. EL
_.1 0'3 I--
10 5
G .polyedro
X - 1 0 - 6 7
ST IMULATION BY BUBBLING
oo 0%
do \ t t ~ l l m l l l = l s l l l l l , l ~ , l
L s L e L i0 D O D 2 D 4 D s D e Dio DI 2 L2 L 4
P H O T O P H A S E S C O T O P H A S E P H O T O P H A S E
FIGURE 5 b
3. COMPARISONS OF TSL PER ORGANISM
Circadian rhythms of TSL have been reported for G. polyedra (Hastings and Sweeney, 1957), for P. lunula (Swift, 1967), and for a heterogeneous natural population (Kelly and Katona, 1966). These rhythms were observed under constant external conditions of illumination, either continuous dim light or continued darkness, as differentiated from the photoperiod-entrained rhythms of TSL. In captured natural samples of P. bahamense kept in continued dark- ness we have observed higher values of TSL at times corresponding to "night" and lower values of TSL at times corresponding to "day." In continued darkness the magnitudes of the TSL values were damped completely after 72 hr (see also Fig. 1 of Kelly and Katona, 1966). Microscopic observation
lO8 THE JOURNAL OF GENERAL PHYSIOLOGY • VOLUME 54 " x969
showed that the damping of the TSL values was due to death of the organisms in continued darkness. Laboratory cultures of all three species grown into log phase under LD 12:12 photoperiod will be essentially killed after 72 hr of extended darkness. Laboratory cultures of P. bahamense are the most sensitive to extended darkness; they are killed within 48 hr. With this limitation placed on the observations we have verified that for laboratory cultures of P. baha-
.-1 / LI.I 0 (E L[.I 0..
O3 Z 0 I-- 0 -t- O_ I0
:E O3
Z
(.9 n- O a: I0 ILl EL
.-I O3 I--
i 0 I ° _
m
9 io _
8
E
7
I 0
S T I M U L A T I O N B Y S T I R R I N G
• @
T S L P. lunula
v - ? _ 1 - 6 7
@
i [ i i f i ! i i i i i i i i i i i i i i !
L 4 L 6 L e LIO DO D 2 D 4 D 6 D s Dio D=2 Lz L 4 Ls
P H O T O P H A S E S C O T O P H A S E P H O T O P H A S E
FiGtra~, 6. Photoperiod-entrained TSL per organism for P. lunula in absolute units of
photons over a complete photoperiod.
mense in continued darkness there are: an increase in TSL during the interval D 0 to Du, a decrease in TSL during Du to D24, an increase in TSL during D24 to D86, and a decrease in TSL during D36 to D~8, corresponding to a highly damped oscillation. For G. polyedra and P. lunula the damping is less extreme and permits the observations of TSL periodicity for an additional 24 hr. In all cases the damping is due to death of the organism. Although, as one of the reviewers has pointed out, these observations of periodicity do not extend over an appreciable length of time, we feel that this suggests the presence of an endogenous circadian rhy thm of TSL in P. baharnense.
W. I-'I BTGGLEY ET AL. Stimulable and Spontaneous Bioluminesceme xo 9
We further observed for all three species that during the time interval D12 to D1 s the dinoflagellates did not die and the rates of decrease of TSL per organism for cultures in extended darkness were markedly different than the rates of decrease of TSL per organism for cultures in normal LD 12: 12 photo- period (for these latter organisms the comparable time interval was L0 to Le). The comparisons of these two rates for all three species are shown in Fig. 7.
JO I0 ---
._J
._] LU 0 ~- 10 9 03 z 0 I - 0 -l- a_
I0 e
7
0 I0 7 ¢'r Ixl
._J
I--- i 0 6
I0 ~
-_ P. lunula ~
--=--'=~i'~.A I I G. po/.vedra
(b) r-
(a)
A /,
I ,I I I qo qz LZ L4
S c o t o p h a s e Photophase
FiougE 7.
\
- P. b a h a m e n s e
I ~ I I I I L6 Dlo Dtz Lz L 4 Lz L4 Ls L8
Scotophase Photophase Photophase
t +
- - +
t I
D~o Diz
Scotophose
a, decrease in TSL per organism for laboratory cultures of P. lunula subse- quent to initiation of photophase, compared with TSL per organism in continued dark- ness. Open triangles, photophase; solid triangles, continued darkness. 6, decrease in TSL per organism for laboratory cultures of G. polydra subsequent to initiation of photophase, compared with TSL per organism in continued darkness. Open triangles, photophase, 30 see paper clip stirring; open circles, photophase, 120 sec bubbling; solid triangles, paper clip stirring in continued darkness; solid circles, bubbling in continued darkness. c, decrease in TSL per organism for laboratory cultures of P. bahamense subsequent to initiation of photophase, compared with TSL per organism in continued darkness. + , Normal photophase, 500 ft-; open triangles, photophase, 2000 ft-; solid triangles, con- tinued darkness.
f i g THE J O U R N A L OF G E N E R A L P H Y S I O L O G Y • V O L U M E 5 4 " I969
Due to the fact that the organisms remain viable at least through Dis, the data of Fig. 7 present a valid comparison of the effect of light on the reduction of TSL. The half-times for both scotophase- and photophase-induced changes in TSL per organism for all three species under the different experimental conditions are summarized in Table IV.
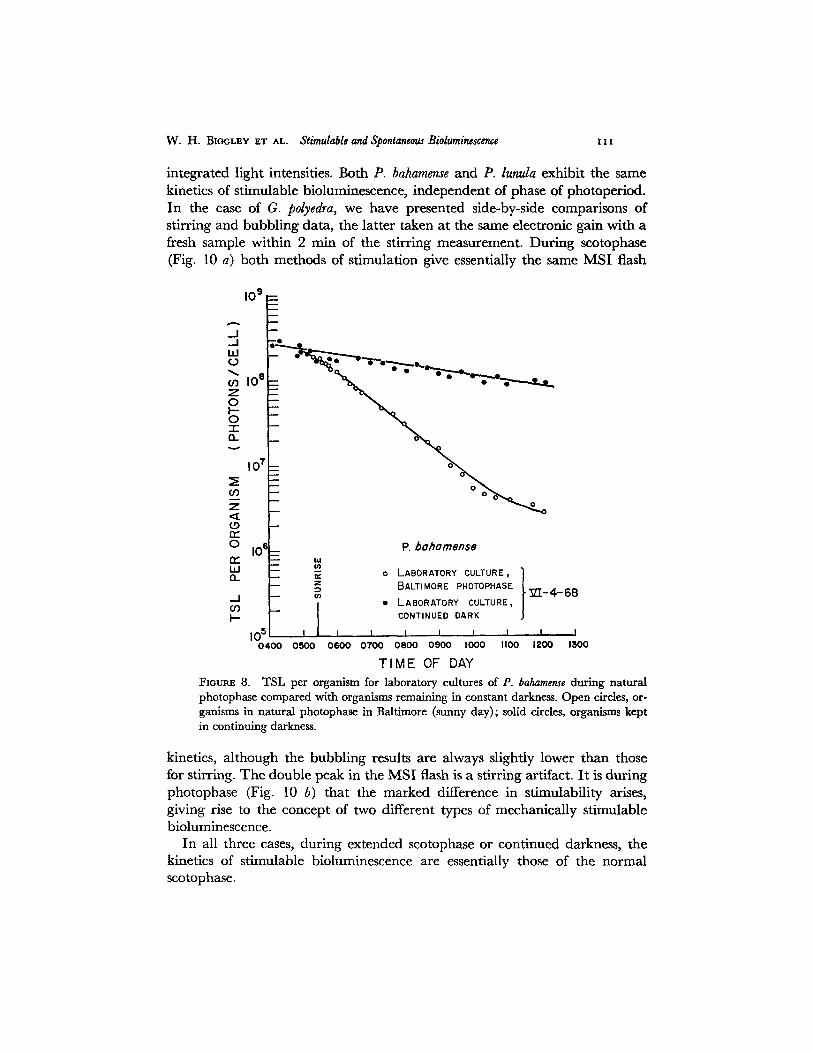
We set up a separate culture of P. bahamense in natural Baltimore photo- period (2500 ft-c at noon) in an effort to approach the spectral quality and intensity of ambient sunlight in Jamaica. As shown in Fig. 8, even under these conditions natural photophase TSL for P. bahamense remained essentially un- changed from that measured for fluorescent light photophase. We have, how-
T A B L E I V
H A L F - T I M E S F O R S C O T O P H A S E - A N D
P H O T O P H A S E - I N D U C E D C H A N G E S I N T S L
Increase in Decrease in Increase in Decrease in Decrease in Decrease in TSL subsequent TSL subsequent TSL during TSL subsequent TSL subsequent TSL subsequent to step-function to step-function natural to natural to natural to Dlz in
* L a b o r a t o r y c u l t u r e g r o w n i n n a t u r a l p h o t o p e r i o d ( B a l t i m o r e s u n l i g h t , 2500 f t -c , n o o n ) .
L a b o r a t o r y c u l t u r e g r o w n in f l u o r e s c e n t l i g h t L D 12:12 c y c l e (500 f t -c ) .
ever, been able to produce an extremely rapid decrease in TSL per organism for a laboratory culture of P. bahamense if at L 0 the culture is placed for only 10-15 min at 17 cm from a 1000 w high pressure mercury arc (5000 ft-c).
C. Kinetics of MSI in Photophase and Scotophase
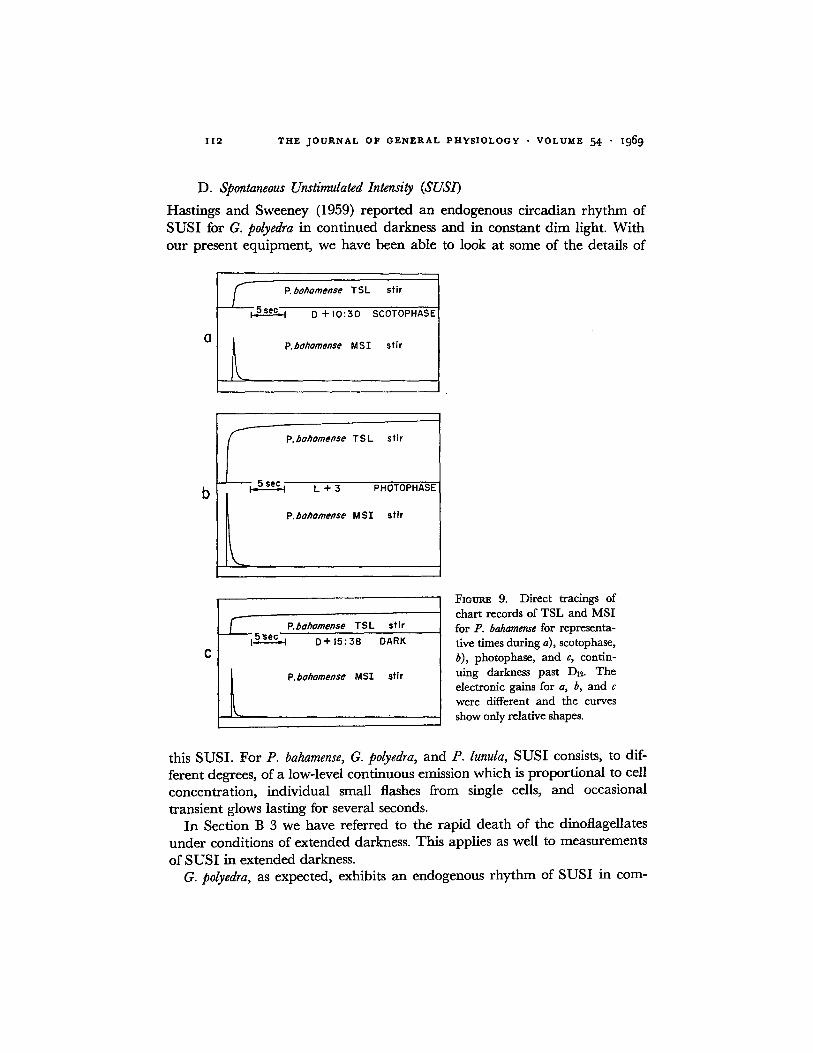
The shapes of MSI during the transition from photophase to scotophase have already been described. The question now arises as to what happens to MSI if the lights are not turned on subsequent to Du? Does the organism exhibit a gradually reduced "scotophase" MSI or are the kinetics of MSI those of "photophase"? Figs. 9 and 10 are direct tracings of curves from the chart of the two-channel recorder of Fig. 1 a, for P. bahamense and G. polyedra, respec- tively, for representative times during scotophase, photophase, and for the or- ganisms continued in the dark past Dt~. The electronic gains for measure- ments during these different time periods were quite different from one another and the curves represent only the shapes of the MSI flashes and the
W. H. BIOGLEY Er M.. Stimulable and Spontaneous Bioluminescence I I I
integrated light intensities. Both P. bahamense and P. lunula exhibit the same kinetics of stimulable bioluminescence, independent of phase of photoperiod. In the case of G. polyedra, we have presented side-by-side comparisons of stirring and bubbling data, the latter taken at the same electronic gain with a fresh sample within 2 rain of the stirring measurement. During scotophase (Fig. 10 a) both methods of stimulation give essentially the same MSI flash
10 9
g 10 7 --
n~ 0 i0 ~ P, bohomense
• " - , .
i , i " - - ~a 1 O.. - - ~: o L A B O R A T O R Y CULTURE
m z B A L T I M O R E PHOTOPHASE _ j _ ~ 3 Z I . - 4 - 6 B CO ~ • L A B O R A T O R Y CULTURE1
I-"- C O N T I N U E D D A R K
I t3 5 I I I U I I I I , ,I , v 0 4 . 0 0 0 5 0 0 0 6 0 0 0 7 0 0 0 8 0 0 0900 I000 I I 0 0 1 2 0 0 1300
T I M E OF DAY
FxougE 8. TSL per organism for laboratory cultures of P. bahamense during natural photophase compared with organisms remaining in constant darkness. Open circles, or- ganisms in natural photophase in Baltimore (sunny day); solid circles, organisms kept in continuing darkness.
kinetics, although the bubbling results are always slightly lower than those for stirring. The double peak in the MSI flash is a stirring artifact. I t is during photophase (Fig. 10 b) that the marked difference in stimulability arises, giving rise to the concept of two different types of mechanically stimulable bioluminescence.
In all three cases, during extended scotophase or continued darkness, the kinetics of stimulable bioluminescence are essentially those of the normal scotophase.
I I 2 T H E JOURNAL OF GENERAL PHYSIOLOGY • VOLUME 54 • t969
D. Spontaneous Unstimulated Intensity (SUS1)
Hastings and Sweeney (1959) reported an endogenous circadian rhythm of SUSI for G. polyedra in continued darkness and in constant dim light. With our present equipment, we have been able to look at some of the details of
___•5F.,•.• ~. bohomense TSL stir
D +10 : :30 SCOTOPHASE
b
P.bohamense TSL st ir
, 5 sec i L + :3 PHOTOPHASE
~r Rbahomense TSL stir
: ~ e c ' ~ D--~I5 ; 38" DARK
FxotmE 9. Direct tracings of chart records of TSL and MSI for P. bahamense for representa- tive times during a), scotophase, b), photophase, and c, contin- uing darkness past DI~. The electronic gains for a, b, and c were different and the curves show only relative shapes.
this SUSI. For P. bahamense, G. polyedra, and P. lunula, SUSI consists, to dif- ferent degrees, of a low-level continuous emission which is proportional to cell concentration, individual small flashes from single cells, and occasional transient glows lasting for several seconds.
In Section B 3 we have referred to the rapid death of the dinoflagellates under conditions of extended darkness. This applies as well to measurements of SUSI in extended darkness.
G. polyedra, as expected, exhibits an endogenous rhythm of SUSI in com-
W. H. BIc.oLEY ~.T ~ . Stimulable and Spontaneous Bioluminescenee i [3
plete darkness. Any periodicity in SUSI for P. bahamense or P. lunula is appar- ently so highly damped that it is not observable except for the initial scoto- phase t ime interval. Comparable da ta for SUS! for G. polyedra, P. bahamense, and P. lunula are shown in Fig. 11 a, b, and c. SUSI is plotted as the number
Cl
~_~ G.polyedro TSL stir
5sec ',: -~, O---+'~: 4-7 SCOTOPHASE
G.polyedro MSI stir
~55 G.polyedro TSL bubble
sec 1~ =I D + 1 0 : 4 8 SCOTOPHASE
L G.polyedro MS 1 bubble
t / ' / ] Reset ~ Capacitor .
1- "[ L + 4 : 0 5 PHOTOPHASE
G.polyedro TSL bubble
" ~ , 5 sec , , - - , L + 4 : 0 7 PHOTOPHASE
C f G . p o ~ e ~ o TSL stir
: S s e c D+16 :02 DARK
G..po~edro MSZ stir
G.polyedro TSL bubble "=bsec ! D + 1 6 : 0 4
G.polyedro Ms'r bubble
DARK
FIotmJz 10. Direct tracings of chart records of TSL and MSI for G. polyedra for repre- sentative times during a, scotophase, b, photophase, and c, continuing darkness past Dx~. The side-by-side stirring and bubbling curves can be compared directly. The electronic gains for a, b, and c were different and the curves show only relative shapes. In b, MSI was so small that it is not shown.
of photons per organism per second, averaged over a 5 min period, measured at 15 min intervals from D 0 through D48 (36 hr of darkness past DI~.).
SUSI for G. polyedra (Fig. I I b) is predominant ly a glow and can be divided into three parts: (a) A low-level constant port ion from Do to Dx0 where the average rate of light emission per organism is 280 photons per second; (b) a narrow peak at Dn with a ha[f-width of 100 min and a m a x i m u m intensity per organism of 1500 photons per second; (c) a subsequent decrease to in- tensities lower than (a) from Dx8 through D~8 at which t ime (a) and (b) are repeated.
II 4 THE JOURNAL OF GENERAL PHYSIOLOGY • VOLUME 54 " I969
E. Dark Recovery of Stimulable Bioluminescence
During scotophase all three species, after having been stimulated to exhaus- tion, can recover part of their initial bioluminescent capacity within a short
3000
2500
200C
150C A m ]ooc L0
50C CD O~
o
P, bahamense
o 2ooo~ I ~ tsoo / G. po lyed ra I I
P. l u n u l o
(c)
Z
O - r
o-5000
_ 4500 - O9
4000 - O3
f , , ; I T I
IO0C
Vo 6 12 18 24 50 56 42 48
HOURS IN CONTINUED DARK
FIGU~ 11. SUSI in photons per second per organism beginning at scotophase, Do, and continued in darkness through D~. a, P. bahamense. O p e n circles, total SUSI, flashes plus glow; heavy line, glow only. b, G. polyedra. O p e n triangles, flashes only; heavy line, glow only. c, P. lunula. O p e n circles, total SUSI, flashes plus glow; heavy line, glow only.
time. This process can be repeated several times, although each recovery results in progressively smaller values of TSL; this is especially true for P. lunula, presumably due to cell damage during stimulation. Recovery data are plotted for all three species in Fig. 12, as per cent of initial TSL as a function of time subsequent to stimulation. The recovery is exponential with half-
W . H . B I G O L E Y ET AL. Slimgtobl8 aM Spontaneous Bioluminescenee II 5
times of 18, 20, and 30 min for P. bahamense, G. polyedra, and P. lunula, respec- tively.
F. Spectral Intensity Effects and Phase Setting
A natural population was removed from Oyster Bay in Jamaica during natural photophase and placed in complete and continuous darkness. For the data of
I00
80 x - x - ~
60 x / x
4 0 : y "%xSe*
20 ?t t
0 I I 0 20 40 co
~ IO0 o
~ 8o o.
~ 4O
2 0
z 0 w
a~
~° I 4O
30
2O
0 20 40
O n
G. polyedra
• stimulation by stirring
x stimulation by bubbling
I I I I I I I 60 80 I00 120 140 160 180 200
MINUTES
x x X~X "*" X
X ~ X X
x xxA / .__._L_; •
P. bohomonse
= stimulation by stirring
x stimulation by bubbling f f I f I I I I I
20 40 60 80 I00 120 140 160 180 200
MINUTES
P. /unu/o
stimulation by stirring
• o _ 1 . _ _ ~ ~ - - - - - e
I I I I I I I 60 80 I00 120 140 160 180
MINUTES
200
FlouU.~ 12. Recovery of stimulable biohnninescence for G. polyedra, P. bahamense, and P. lunula. Time is measured subsequent to complete stimulation by the technique used to measure recovery.
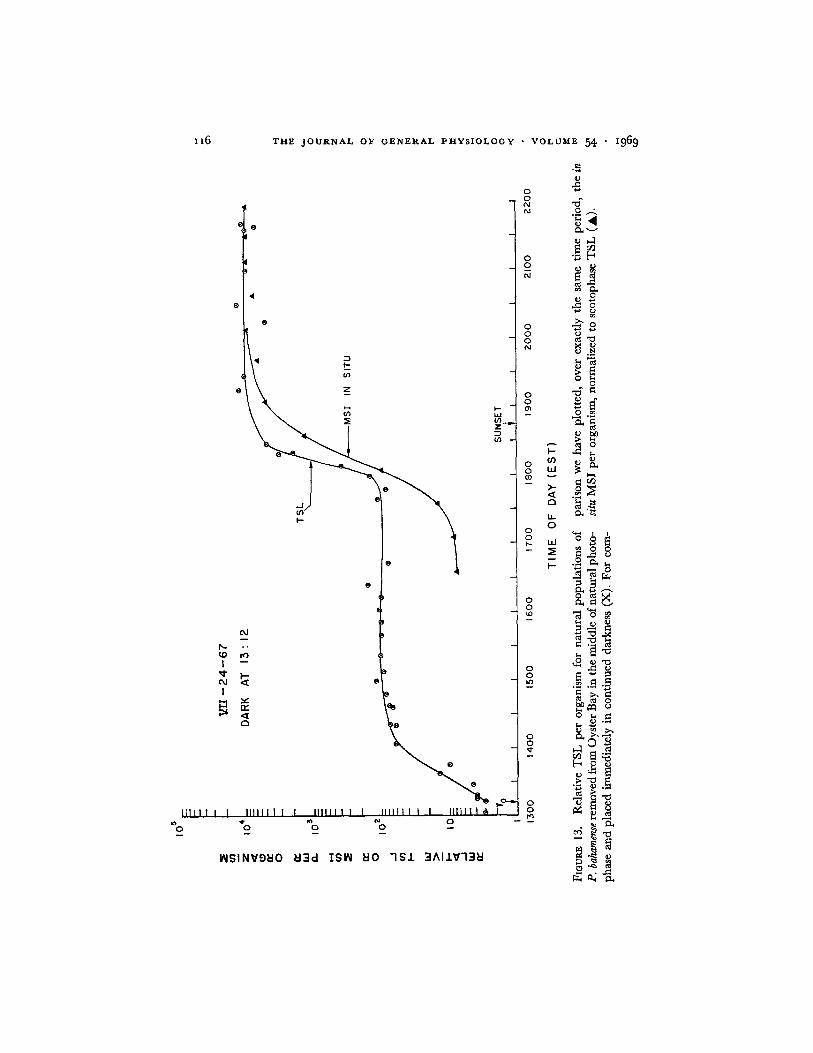
Fig. 13 (open circles), this was done at 13:12, approximately the middle of natural photophase, although the time is not critical. There was an immediate rapid increase in TSL reaching a value greater by a factor of approximately 40 within an hour, at which time a plateau was reached. The plateau was maintained until approximately the time of day at which the in situ P. baha- mense began their nocturnal increase in TSL per organism. At this time the
~6 T H E J O U R N A L O F O E N ~ I ~ A L I ~ H Y S I O L O O Y • V O L U M ~ 5 4 " ~969
f,,. / ,0
I
OJ
I
0
I . -
. .
v n "
I j ] 1 1 t I I 1111111 I | I I I l 1 1 1 I I
% "o %
SS
I l l l l l l I I I1 |1111 ~ % o
I N S I N V g ~ O ~13cI ISIN ~ 0 7 S 1 3 A I I V 7 3 ~ I
0 0
~ v
0 0
V-
0 0
0 0
0 0
~ - o
" N
O "
~ V
O , ~ O
O
O . ~
.o ~ ,~ "~' 0
0 ~ ~
W. H. BIC, GI~P.v ~.z AL. Stimulable and Spontaneous Bioluminescence II7
population confined in the dark exhibited a second rapid and exponential increase in TSL per organism, as though scotophase had just begun. For comparison the relative MSI data for the in situ bay population, obtained over the same time interval with the underwater photometers described by
,_1 --I I.LI
(,0 Z
o n- 0.
(J)
z
(p Dz 0
a.
_J or)
IO 9 - -
I0 e
I 0 7 - -
I0 I I
L 4
P bohctmense
=, g . . . -
o o o
I Y f ° l ~ ° d I I I I L e L 8 L m D O D z D 4
PH OTO PHASE SCOTO PHASE
Fxoul~ 14. TSL per organism for laboratory cultures of P. bahamense as a function of photoperiod time. The cultures were removed from the fluorescent light photophase and placed immediately in continued darkness. For comparison, we have also plotted the normal photoperiod-entrained rise in TSL per organism. Solid circles, cultures removed from photophase at Le; solid triangles, cultures removed from photophase at Lg; open circles, control removed from photophase at LI~.
Seliger and McElroy (1968), are shown as the solid triangles. The nocturnal increase in TSL per organism for the sample confined in the dark remains in phase with the natural photoperiod and thus is independent of the time during photophase at which the dinoflagellates are artifically placed in the dark.
The initial dark-induced rise is immediate. The duration of the initial plateau is dependent upon the time during natural photoperiod when the organisms are placed in the dark. In nature, the two effects cannot be sepa- rated.
The same experiments repeated with laboratory cultures of P. bahamense, placed in darkness at L6 and at L9 (Fig. 14), showed a gradual rise to a maxi- mum value of TSL per organism at D1.
I I 8 T H E J O U R N A L O F G E N E R A L P H Y S I O L O G Y • V O L U M E 5 4 " 1969
DISCUSSION
Under carefully controlled conditions of organism growth and with precisely defined stimulation and bioluminescence assay techniques, it has been pos- sible to describe and compare several characteristics of the bioluminescence of three species of dinoflagellates. These characteristics such as the changes with time of the MSI flash, the TSL per organism, and SUSI are indicative of the physiological state of the organisms and should provide a sensitive assay technique for observing the effects of physical and chemical perturbants on the organisms.
Although in nature it has been our experience that dinoflagellates are seldom maximally stimulated mechanically to emit all of their potential luminescence, we have been able to demonstrate that they can be maximally stimulated without preventing further growth of the culture. This potential for stimulable luminescence, although different for different species, is a con- stant throughout essentially the entire scotophase (D1 through Dn), in agree- ment with the data of Seliger and McElroy (1968) for natural populations of P. bahamense. The data presented are not intended primarily to demonstrate the existence of photoperiod-entrained and endogenous rhythms of bio- luminescence; for the most part these have already been established by many previous workers. Rather we have examined the detailed shapes of the bio- luminescent emissions from three species over their photoperiods as well as in extended darkness. For the photoperiod-entrained rhythm there are ex- tremely rapid increases and decreases in TSL per organism (Table IV), so that for a complete photoperiod the stimulable bioluminescence has essen- tially a square-wave shape (Figs. 4-6). These shapes are completely different from the sine wave shapes reported by previous workers. In extended dark- ness, however, the endogenous rhythm of TSL does exhibit a sine wave character as described by Hastings and Sweeney (1957), Kelly and Katona (1966), and Swift (1967). However, since extended darkness for even 19-24 hr results in permanent injury to the dinoflagellates, we have limited our comparisons to TSL to the first 6 hr (Du through D~8) of extended darkness. From the data of Fig. 7 and the last column of Table IV, it may be seen that the rates of decrease of endogenous TSL are different for the three species, over and above the fact that these rates are each significantly lower than their respective photoinhibited rates of decrease during photophase. For G. polyedra and P. lunula our laboratory photophase intensities are sufficient to achieve a maximum photoinhibition, as evidenced by the rate of decrease of TSL. For the tropical P. bahamense a much higher light intensity is required. There are two aspects of the photoinhibition during photophase that must be examined : (a) the rate of decrease of TSL should have a spectral intensity dependence; (b)
MSI (scotophase) from the data of Fig. 13 and the fact that, for P. bahamense, the
MSI (photophase)
W. H. BIGOLEY ET AL. Stimulable and Spontaneous Bioluminescence II9
ratios in nature, in Jama ica sunlight, are higher than those observed for our Scotophase TSL
laboratory cultures indicates that the Photophase TSL ratios as well should exhibit
a spectral intensity dependence. We have been able to achieve a rate of decrease in TSL per P. bahamense as
fast as that for P. lunula by placing the P. bahamense culture close to a high intensity 1000 w mercury arc for as little as 10 min at L0. However, we have also observed that transitory morphological changes in pigment distributions occur when dinoflagellates are subjected to light intensities higher than those occurring during their normal photophase. For this reason all our measure- ments with the exception of the Hg arc illumination have been performed on cultures inoculated and grown up into log phase under the same spectral intensity and photoperiod as were used in the experiments.
Since of the three species, P. bahamense is the only representative of shallow tropical waters, it is not unreasonable to believe that the light intensities of our laboratory environmental chambers and even Baltimore photophase are not sufficient to effect the rapid TSL decrease observed in Jamaica sunlight. In laboratory culture, photophase is 500 ft-c. In Jamaica, sunlight illumination is as high as 8800 ft-c.
Nothing is known at present of the mechanism by which mechanical stimu- lation triggers light emission.
As in the case of the marine bacteria, there does not appear to be any selective advantage to the bioluminescence of dinoflagellates. In nature non- luminous species are often found together with luminous species (Nordli, 1957).
The significant differences in stimulability during photophase between P. bahamense and G. polyedra, which are responsible for the bubbling vs. stirring differences shown in Fig. 5, are demonstrated in Figs. 2 and 3 as well as in Figs. 9 b and 10 b. There are also differences in degree of recovery of potential for stimulable bioluminescence among all three species (Fig. 12).
All three species show an increase in SUSI subsequent to initiation of scoto- phase. P. bahamense and P. lunula show large fluctuations in SUSI over D 0 to Du (mainly due to erratic flashing) and then decrease to low levels. Of the three species, only G. polyedra exhibits well-defined peaks in both SUSI "glow" and cell division (Sweeney and Hastings, 1958) as functions of photoperiod. The former occurs at Dn and has a half-width of only 100 rain, while the latter occurs at L1 with an even smaller half-width of 70 min. 3 For all three species the PC glow, represented by the heavy lines, is much less erratic than the flashes. For G. polyedra as contrasted with P. bahamense and P. lunula the contribution of flashes to SUSI was so small that in Fig. 11 b it is plotted separately. The second peak in SUSI glow around Dae is the expression of the circadian rhythm.
3 Unpublished data.
12o T H E J O U R N A L OF G E N E R A L P H Y S I O L O G Y • V O L U M E 54 " 1969
The distinction between glow or DC level and a large number of tiny flashes depends upon the signal-to-noise ratio of the phototube detector and the frequency response of the associated electronics. In our case the phototube dark noise was equivalent to an average dinoflagellate emission of 1.3 X l0 s photons per sec. The input RC time constant of the DC amplifier was 0.01 sec. We arbitrarily set our "recognition" of flashes to those which, during any 0.01 sec time interval, emit a number of photons equal to the average number of "noise" photons; i.e., bioluminescent flashes emitting 1300 photons within 0.01 sec. Since the mean lifetime of the decay of dinoflagellate flashes is 0.05 sec, this corresponds to flashes containing > 6500 photons. Thus under ideal conditions SUSI flashes emitting approximately 10 -5 of the scotophase MSI per organism for P. bahamense and G. polyedra and 10 -6 of the scotophase MSI per organism for P. lunula could be detected.
We have not yet examined the effects of light intensity, temperature, nutrient levels, etc. on SUSI for these species and so we cannot say with cer- tainty that neither P. bahamense nor P. lunula can be induced to synchrony. However, G. polyedra would appear to be an ideal choice with which to examine the correlation of SUSI with reproduction.
The data of Fig. 13 show an immediate increase in TSL by a factor of ap- proximately 40 which can be considered as a reversal of photoinhibition. Then at a time corresponding to the natural scotophase, there is a further increase in TSL by a factor of 100. I t is this former reversal of photoinhibition that can explain the increases and decreases in MSI in situ observed by Backus et al. (1965) during the course of a solar eclipse. It is apparent that the increases in TSL per organism shown in Figs. 13 and 14 are under photoperiodic control and that the arbitrary initiation of a dark interval during photophase, except for eliminating a relatively small photoinhibition, does not alter the phase of the expression of TSL. On the other hand, if photophase is continued past LI~ there is no observable increase in TSL.
Seliger and McElroy (1968) have demonstrated that concentrations of natural populations of P. bahamense in Oyster Bay, Jamaica, W. I., can be assayed by measurement of scotophase MSI and by inference, TSL. The pres- ent data confirm this for laboratory cultures of G. polyedra and P. lunula as well. However, since photophase MSI is strongly dependent on ambient light in- tensity, it is no longer directly related to organism concentration. Thus large- scale mapping of P. bahamense concentrations in tropical bays by MSI can be made only during the night.
Although unfortunately we have not isolated and identified the species re- sponsible, there is at least one bioluminescent plankton in Chesapeake Bay which does not exhibit a photoperiod-entrained diurnal rhy thm in stimulable bioluminescence (Seliger et al., 1961) as well as a second species which does. 4
4 Sel iger , H . H . , a n d W . G . Fas t ie . U n p u b l i s h e d d a t a .
W. H. BIGOLEY ET AL. Stimulable and Spontaneous Bioluminescence I21
Kelly and K a t o n a (1966) have repor ted a photo inhib i t ion of bioluminescence
which is rap id ly reversed by plac ing the organisms in darkness dur ing photo-
phase. T h e i r technique for measur ing bioluminescence was qui te different
f rom our own and their relative changes were several orders of m a g n i t u d e
smaller. I t is therefore difficult to c o m p a r e their results direct ly with ours.
T h e techniques and types of measurements described in this pape r should
permi t a m u c h more quant i ta t ive assay for the effects of photo inhib i t ion and
chemica l agents on the expression of the rhy thms of b ioluminescent potent ia l
t han has been avai lable heretofore. I n addi t ion we would like to emphasize
the impor t ance of the compara t ive s tudy of different species, bo th in labora-
tory cul ture and in na tura l populat ions, in view of the interspecies differences
described in this paper .
We would like to thank Mrs. C. Eisner for her invaluable assistance in the maintenance of our lab- oratory cultures and in the experimental measurements. We also thank Mr. W. Esalas for his assist- ance in several of the light inhibition measurements. This work was supported by the Division of Biology and Medicine of the Atomic Energy Comrai~- sion, Contract AT (30-1) 2802. The experiments in Jamaica, West Indies were supported under Atomic Energy Commission Contract AT (30-1) 3480 and the Office of Naval Research, Contract NR-104-848, Nonr 4010 (16). Contribution No. (560) of the McCollum-Pratt Institute, The Johns Hopkins University and Contribution No. (137) of the Chesapeake Bay Institute, The Johns Hopkins University. This paper is based in part on material presented at the Fifth International Congress on Photo- biology, Hanover, New Hampshire in August, 1968.
Received for publication 20 August 1968.
REFERENCES
BACKUS, R. H., R. C. CLARK, and A. S. WINO. 1965. Behaviour of certain marine organisms during the solar eclipse of July 20, 1963. Nature (London). 205:989.
HASTINGS, J. W., and B. M. SWEENBY. 1957. On the mechanism of temperature independence in a biological clock. Proc. Nat. Acad. Sci. U.S.A. 43:804.
HASTINGS, J. W., and B. M. SWE~.N~.Y. 1958. A persistent diurnal rhythm of luminescence in Gonyaulax polyedra. Biol. Bull. 115:440.
HASTINQS, J. W., and B. M. SWeENEY. 1959. The Gonyaulax clock. In Photoperiodism and Re- lated Phenomena in Plants and Animals. R. B. Withrow, editor. American Association for the Advancement of Science, Washington, D. C. p. 567.
KELLEY, M. G., and S. KATONA. 1966. An endogenous diurnal rhythm of bioluminescence in a natural population of dinoflagellates. Biol. Bull. 131:115.
NORDLI, E. 1957. Experimental studies on the ecology of Ceratia. Oikos. 8:200. SELmER, H. H., and W. D. McELRoY. 1968. Studies at Oyster Bay in Jamaica, W. I. I. In-
tensity patterns of bioluminescence in a natural environment. J. Mar. Res. 26:244. SELIGER, H. H., W. G. FASTIE, and W. D. McELRoY. 1961. Bioluminescence in Chesapeake
Bay. Science. 133:699. SELmER, H. H., W. G. FASTIE, W. R. TAYLOR, and W. D. McELRoY. 1962. Bioluminescence
of marine dinoflagellates. I. An underwater photometer for day and night measurements. J. Gen. Physiol. 45:1003.
SWEENEY, B. M., and J. W. HASTINGS. 1957. Characteristics of the diurnal rhythm of lumines- cence in Gonyaulax polyedra. J. Cell. Comp. Physiol. 49:115.
SWEENEY, B. M., andJ. W. HASTINCS. 1950. Rhythmic cell division in population of Gonyaulax polyedra. J. Protozool. 5:217.
I 2 2 T H E J O U R N A L O F G E N E R A L P H Y S I O L O G Y • V O L U M E 54 " :969
S W E E N E Y , B. M., and J. W. HAST:NOS. 1960. Effects of temperature upon diurnal rhythms. Cold Spring Harbor Symp. Quant. Biol. 25:87.
SWEENEY, B. M., F. T. HAxo, andJ. W. HASTINOS. 1959. Action spectra for two effects of light on luminescence in Gonyaulax polyedra. J. Gen. Physiol. 43:285.
SWIFT, E. 1967. Isolation, description, purification, nutrition and physiology of unicellular algae from the tropical Atlantic Ocean. Ph.D. Thesis. The Johns Hopkins University.
SWIFT, E., and W. R. TAYLOR. 1967. Bioluminescence and chloroplast movement in the dino- flagellate Pyrocystis lunula. J. Phycol. 3:77.
TAYLOR, W. R., H. H. SELIOER, W. G. FASTIE, and W. D. McELRoY. 1966. Biological and physical studies of a phosphorescent bay. J. Mar. Res. 24:28.