19
Management Tools & Trends 2015 By Darrell Rigby and Barbara Bilodeau
Management Tools & Trends 2015
By Darrell Rigby and Barbara Bilodeau
Darrell Rigby, a partner with Bain & Company and leader of Bain’s Global
Retail and Global Innovation practices, has conducted Bain’s Management
Tools & Trends survey since 1993. Barbara Bilodeau is the director of Bain’s
Advanced Analytics Group.
Copyright © 2015 Bain & Company, Inc. All rights reserved.
A history of Bain’s Management Tools & Trends survey
Starting in 1993, Bain & Company has surveyed executives around the world about the management tools they use and how effectively those tools have performed. The objective: to provide managers with information they need to identify and integrate tools that will improve bottom-line results, and to under-stand how global executives view their strategic challenges and priorities.
We focus on 25 tools, honing the list each year. To be included in our survey, the tools need to be relevant to senior management, topical and measurable. By tracking the tools companies are using, under what circumstances and how satisfi ed managers are with the results, we’ve been able to help them make better choices in selecting, implementing and integrating the tools to improve their performance.
With this, our 15th survey, we now have a database of more than 13,000 respondents from more than 70 countries in North America, Europe, Asia, Africa, the Middle East and Latin America, and we can systematically trace the effectiveness of management tools over the years. As part of our survey, we also ask executives for their opinions on a range of important business issues. As a result, we are able to track and report on changing management priorities.
For a full defi nition of the 25 tools, along with a bibliographical guide to resources on each one, please see the Bain & Company booklet Management Tools 2015: An Executive’s Guide on www.bain.com.
Management Tools & Trends 2015
1
It’s been a long time coming, but most economies are
emerging from the global downturn—and growing.
Executives who slogged through years of recession or
stagnation are feeling more confi dent, even exuberant—
perhaps too exuberant. Many also see disruptions and
challenges ahead. Forces such as the demographics of
emerging economies, aging populations and resource
scarcity are accelerating deep structural shifts in global
markets. And although these forces generate opportu-
nities for growth, they also unleash risks. Digital tech-
nologies, for example, give rise to new markets, but
they also bring volatility, macroeconomic shocks and
disruption: Think cyber attacks, which are now a hazard
for all companies as digital connectivity becomes the norm.
As executives grapple with a landscape increasingly
dominated by technology and change, they plan to spend
more on innovation, IT and long-term growth capabilities,
and they are embracing digital transformation tools.
Overall, Bain & Company’s 15th Management Tools &
Trends survey showed executives confi dent and upbeat—
74% said their current fi nancial performance is strong,
and 55% believe economic conditions are improving
in their industry (see Figure 1), with pharma and bio-
tech, construction and real estate, and fi nancial services
being the most optimistic sectors. Despite the challenges
ahead, 75% of respondents feel better positioned for
the future, saying their ability to adapt to change is a
signifi cant competitive advantage—the same number
as in the 2013 survey (see Figure 2). In China and
India, where the outlook for growth is strongest, con-
fi dence in the ability to adapt to change was even higher
at 88%.
Can three out of four fi rms really be poised to outperform?
Clearly, many companies have worked hard to cut costs
and improve effi ciency throughout the downturn, but
we see a signifi cant risk in 75% of respondents believing
that they have a competitive advantage relative to their
peers. Statistically, it doesn’t add up. (A more realistic
number is probably 25%.) Executives who believe that
their companies are more competitive because sales
and profits are rising in the midst of a recovery risk
making some wrong moves due to complacency.
Figure 1: The view on management trends
Our ability to adapt to change is a significant competitive advantage
Innovation is more important than cost reduction for long-term success
Our current financial performance is strongOver the next three years, our IT spending must increase as a percent of sales
Customers are less loyal to brands than they used to be
Excessive complexity is raising our costs and hindering our growth
Sustainability initiatives are improving our growth and profitability
Our management actions favor long-term results over short-term earnings
Effective mergers and acquisitions will be critical to success in our industry
The principles and passions of our founders still dominate our operating practices today
I am very concerned about the impact that a cyber attack could have on our businessIt feels like economic conditions are improving in our industry
Increased price transparency has had a major impact on our pricing strategy
Over the next three years, we will focus more on revenue growth than cost reduction
Advanced analytics are transforming our marketing strategy
We use experimentation and testing techniques proficiently
Insufficient consumer insight is hurting our performance
Our current information systems are constraining profitable growth
Our top management is unwilling to take greater risks for higher returns
We don’t have the technology capabilities required to be a leader in our industry
75%
74%
74%64%
62%
60%
59%
58%
57%
57%
55%55%
54%
52%
52%
48%
46%
42%
39%
29%
13%
9%
10%16%
19%
18%
13%
22%
22%
22%
23%24%
14%
27%
14%
24%
29%
32%
39%
56%
Agree Disagree
2
Management Tools & Trends 2015
Figure 2: Executives’ beliefs over time
Our ability to adapt to change is a significant competitive advantage
Innovation is more important than cost reduction for long-term success
Customers are less loyal to brands than they used to be
Over the next three years, our IT spending must increase as a percent of sales
Our management actions favor long-term results over short-term earnings
Excessive complexity is raising our costs and hindering our growth
Increased price transparency has had a major impact on our pricing strategy
Over the next three years, we’ll focus more on revenue growth than cost reduction
It feels like economic conditions are improving in our industry
I’m very concerned about the impact that a cyber attack could have on our business
Insufficient consumer insight is hurting our performance
Our current information systems are constraining profitable growth
75%
74%
67%
65%
64%
63%
61%
57%
57%
50%
50%
49%
81%
81%
–
–
–
–
–
63%
74%
–
45%
–
–
76%
–
–
–
–
–
53%
–
–
46%
–
–
79%
–
–
–
–
–
–
–
–
51%
–
–
86%
–
–
–
68%
–
56%
–
–
65%
–
75%
20122010200820062004 2014
74%
62%
64%
58%
60%
54%
52%
55%
55%
46%
42%
Significantly higher than 2014 Significantly lower than 2014
Management Tools & Trends 2015
3
Twenty-two years ago we launched our fi rst global survey
of Management Tools & Trends to track executives’ behav-
iors and attitudes through a full range of economic cycles
(see the sidebar, A history of Bain’s Management Tools &
Trends survey). This year we received 1,067 completed
surveys from a broad range of international executives
across all industries. Respondents from 10 countries
were grouped into four regions: North America (the US
and Canada); Europe, Middle East and Africa (France,
Germany, Spain and the UK); Asia-Pacifi c (China and
India); and Latin America (Mexico and Brazil). The re-
sults, as in the past, rank the best and the worst of 25
popular management tools and provide insight into
what is on the minds of executives around the globe.
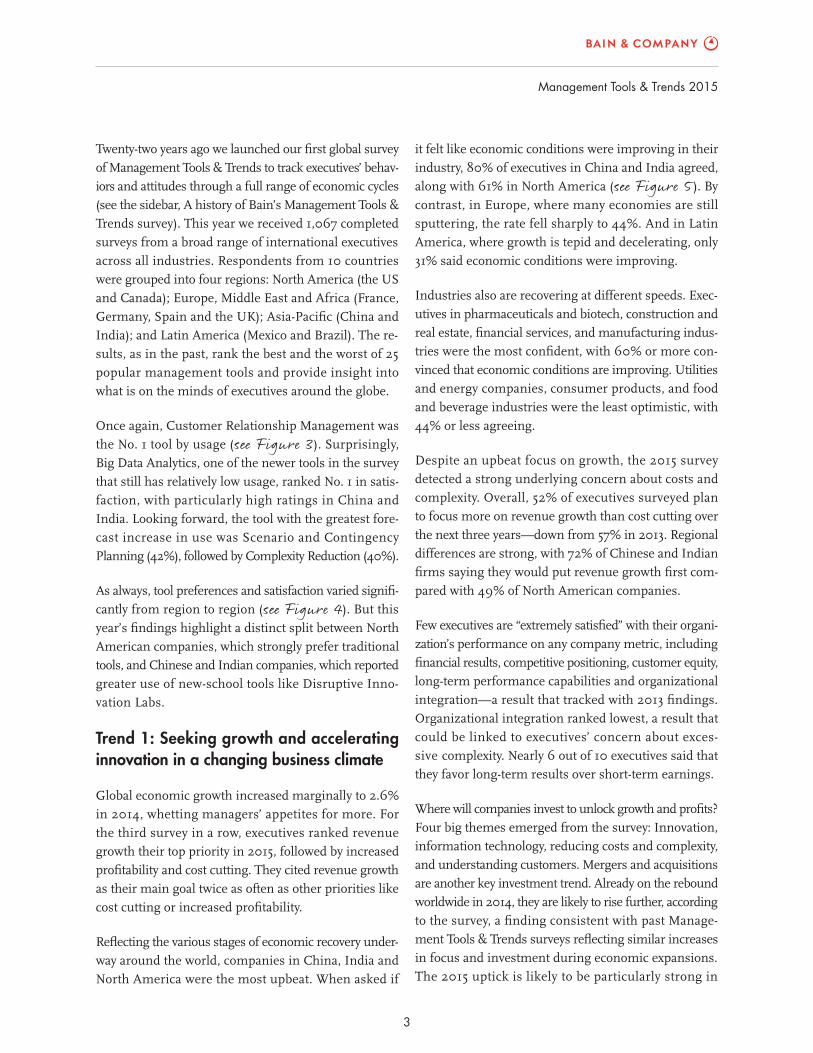
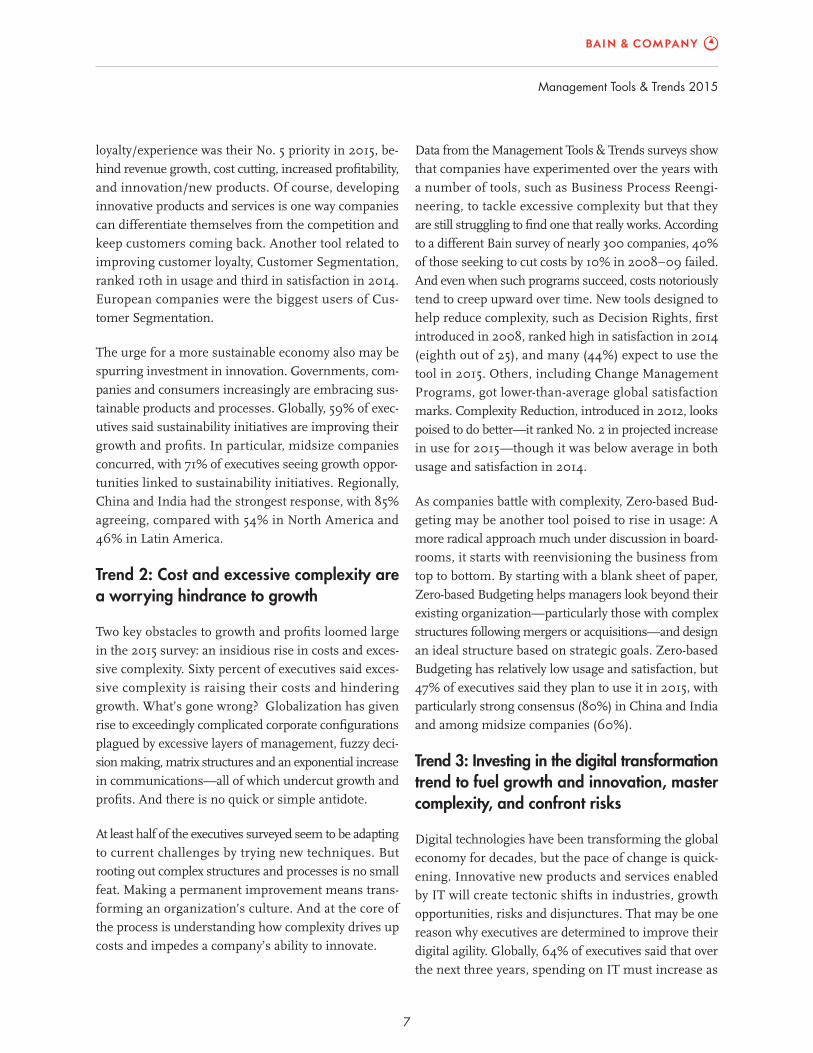
Once again, Customer Relationship Management was
the No. 1 tool by usage (see Figure 3). Surprisingly,
Big Data Analytics, one of the newer tools in the survey
that still has relatively low usage, ranked No. 1 in satis-
faction, with particularly high ratings in China and
India. Looking forward, the tool with the greatest fore-
cast increase in use was Scenario and Contingency
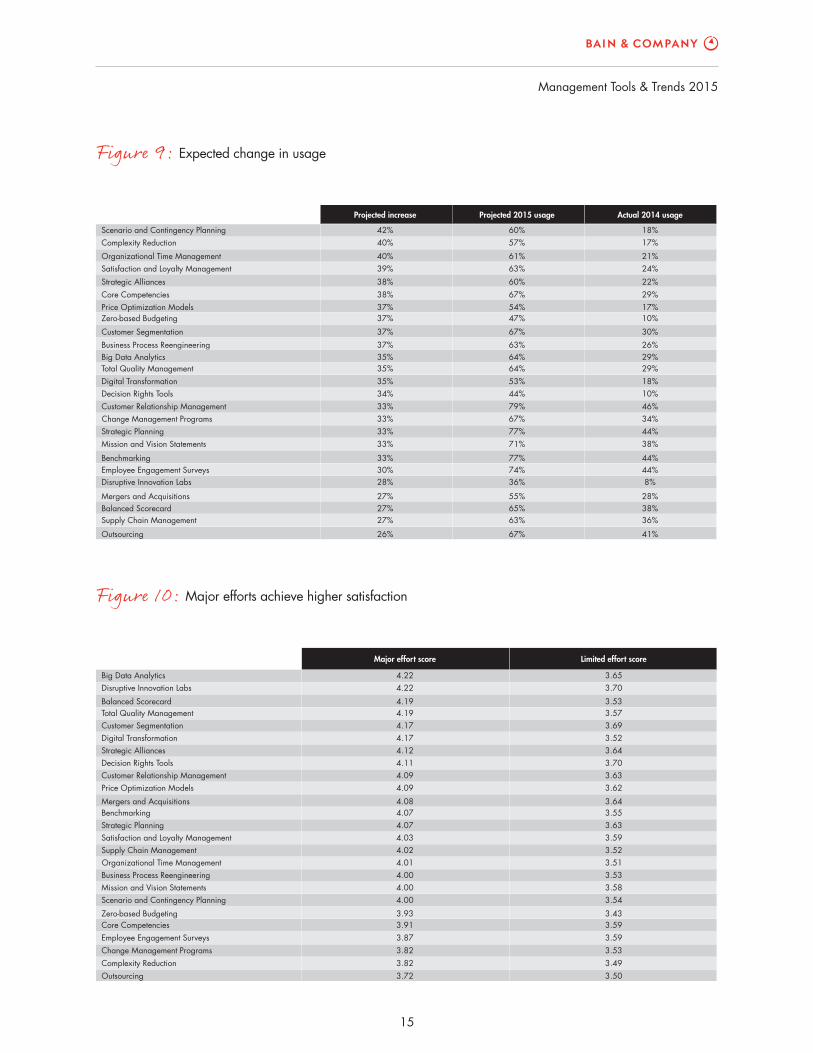
Planning (42%), followed by Complexity Reduction (40%).
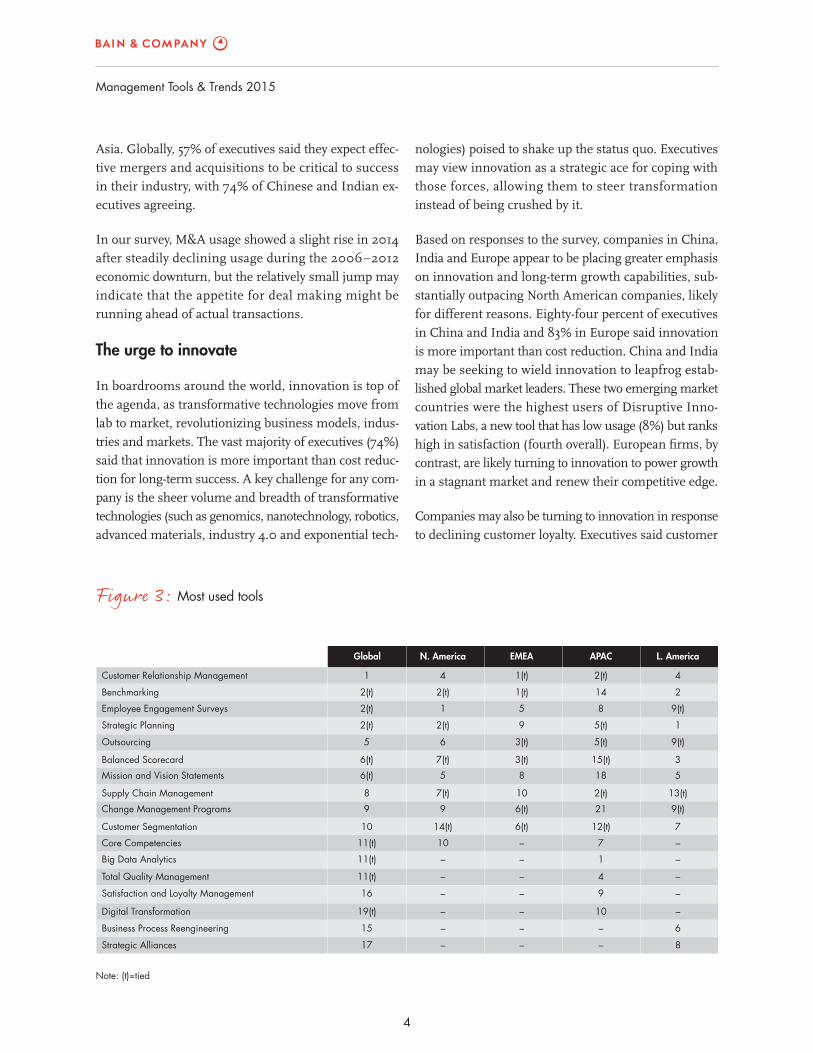
As always, tool preferences and satisfaction varied signifi -
cantly from region to region (see Figure 4). But this
year’s fi ndings highlight a distinct split between North
American companies, which strongly prefer traditional
tools, and Chinese and Indian companies, which reported
greater use of new-school tools like Disruptive Inno-
vation Labs.
Trend 1: Seeking growth and accelerating innovation in a changing business climate
Global economic growth increased marginally to 2.6%
in 2014, whetting managers’ appetites for more. For
the third survey in a row, executives ranked revenue
growth their top priority in 2015, followed by increased
profi tability and cost cutting. They cited revenue growth
as their main goal twice as often as other priorities like
cost cutting or increased profi tability.
Refl ecting the various stages of economic recovery under-
way around the world, companies in China, India and
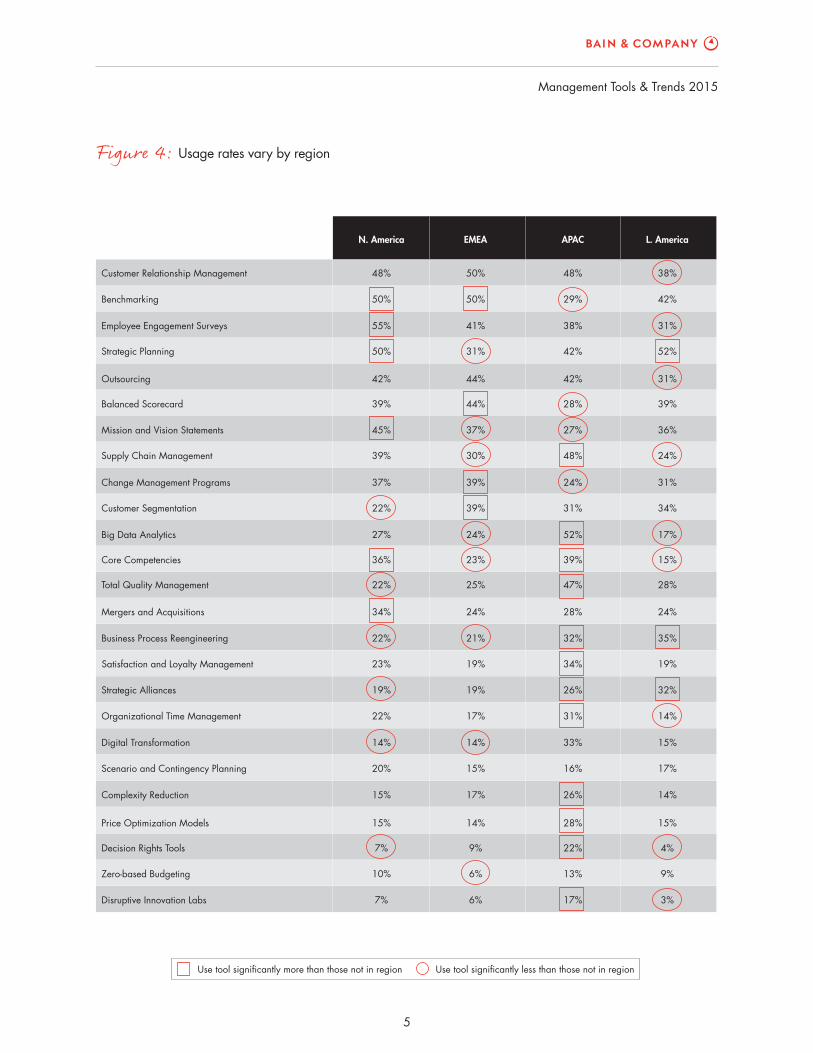
North America were the most upbeat. When asked if
it felt like economic conditions were improving in their
industry, 80% of executives in China and India agreed,
along with 61% in North America (see Figure 5). By
contrast, in Europe, where many economies are still
sputtering, the rate fell sharply to 44%. And in Latin
America, where growth is tepid and decelerating, only
31% said economic conditions were improving.
Industries also are recovering at different speeds. Exec-
utives in pharmaceuticals and biotech, construction and
real estate, fi nancial services, and manufacturing indus-
tries were the most confi dent, with 60% or more con-
vinced that economic conditions are improving. Utilities
and energy companies, consumer products, and food
and beverage industries were the least optimistic, with
44% or less agreeing.
Despite an upbeat focus on growth, the 2015 survey
detected a strong underlying concern about costs and
complexity. Overall, 52% of executives surveyed plan
to focus more on revenue growth than cost cutting over
the next three years—down from 57% in 2013. Regional
differences are strong, with 72% of Chinese and Indian
fi rms saying they would put revenue growth fi rst com-
pared with 49% of North American companies.
Few executives are “extremely satisfi ed” with their organi-
zation’s performance on any company metric, including
fi nancial results, competitive positioning, customer equity,
long-term performance capabilities and organizational
integration—a result that tracked with 2013 fi ndings.
Organizational integration ranked lowest, a result that
could be linked to executives’ concern about exces-
sive complexity. Nearly 6 out of 10 executives said that
they favor long-term results over short-term earnings.
Where will companies invest to unlock growth and profi ts?
Four big themes emerged from the survey: Innovation,
information technology, reducing costs and complexity,
and understanding customers. Mergers and acquisitions
are another key investment trend. Already on the rebound
worldwide in 2014, they are likely to rise further, according
to the survey, a fi nding consistent with past Manage-
ment Tools & Trends surveys refl ecting similar increases
in focus and investment during economic expansions.
The 2015 uptick is likely to be particularly strong in
4
Management Tools & Trends 2015
nologies) poised to shake up the status quo. Executives
may view innovation as a strategic ace for coping with
those forces, allowing them to steer transformation
instead of being crushed by it.
Based on responses to the survey, companies in China,
India and Europe appear to be placing greater emphasis
on innovation and long-term growth capabilities, sub-
stantially outpacing North American companies, likely
for different reasons. Eighty-four percent of executives
in China and India and 83% in Europe said innovation
is more important than cost reduction. China and India
may be seeking to wield innovation to leapfrog estab-
lished global market leaders. These two emerging market
countries were the highest users of Disruptive Inno-
vation Labs, a new tool that has low usage (8%) but ranks
high in satisfaction (fourth overall). European fi rms, by
contrast, are likely turning to innovation to power growth
in a stagnant market and renew their competitive edge.
Companies may also be turning to innovation in response
to declining customer loyalty. Executives said customer
Asia. Globally, 57% of executives said they expect effec-
tive mergers and acquisitions to be critical to success
in their industry, with 74% of Chinese and Indian ex-
ecutives agreeing.
In our survey, M&A usage showed a slight rise in 2014
after steadily declining usage during the 2006−2012
economic downturn, but the relatively small jump may
indicate that the appetite for deal making might be
running ahead of actual transactions.
The urge to innovate
In boardrooms around the world, innovation is top of
the agenda, as transformative technologies move from
lab to market, revolutionizing business models, indus-
tries and markets. The vast majority of executives (74%)
said that innovation is more important than cost reduc-
tion for long-term success. A key challenge for any com-
pany is the sheer volume and breadth of transformative
technologies (such as genomics, nanotechnology, robotics,
advanced materials, industry 4.0 and exponential tech-
Figure 3: Most used tools
1(t)
1(t)
5
9
3(t)
3(t)
8
10
6(t)
6(t)
–
–
–
–
–
–
–Strategic Alliances
Customer Relationship Management
Benchmarking
Employee Engagement Surveys
Strategic Planning
Outsourcing
Balanced Scorecard
Mission and Vision Statements
Supply Chain Management
Change Management Programs
Customer Segmentation
Core Competencies
Big Data Analytics
1
2(t)
2(t)
2(t)
5
6(t)
6(t)
8
9
10
11(t)
11(t)
APACEMEAN. AmericaGlobal L. America
Total Quality Management 11(t)
Satisfaction and Loyalty Management 16
Digital Transformation 19(t)
Business Process Reengineering 15
Note: (t)=tied
17
4
2(t)
1
2(t)
6
7(t)
5
7(t)
9
14(t)
10
–
–
–
–
–
–
2(t)
14
8
5(t)
5(t)
15(t)
18
2(t)
21
12(t)
7
1
4
9
10
–
–
4
2
9(t)
1
9(t)
3
5
13(t)
9(t)
7
–
–
–
–
–
6
8
Management Tools & Trends 2015
5
Figure 4: Usage rates vary by region
Customer Relationship Management
Benchmarking
Outsourcing
Balanced Scorecard
Mission and Vision Statements
Supply Chain Management
Change Management Programs
Core Competencies
Total Quality Management
Mergers and Acquisitions
Business Process Reengineering
Satisfaction and Loyalty Management
Strategic Alliances
Organizational Time Management
Digital Transformation
Scenario and Contingency Planning
Complexity Reduction
Price Optimization Models
Decision Rights Tools
Disruptive Innovation Labs
Zero-based Budgeting
50%
50%
41%
44%
44%
37%
39%
39%
24%
25%
24%
APACEMEAN. America L. America
48%
50%
55%
42%
39%
45%
37%
22%
27%
22%
34%
48%
29%
38%
42%
28%
27%
24%
31%
52%
47%
28%
38%
42%
31%
31%
31%50% 42% 52%
39%
36%
31%
30%39% 48% 24%
34%
17%
28%
19%19% 26% 32%
23%36% 39% 15%
24%
21%22% 32% 35%
19%23% 34% 19%
17%22% 31% 14%
14%14% 33% 15%
15%20% 16% 17%
17%15% 26% 14%
14%15% 28% 15%
9%7% 22% 4%
6%10% 13% 9%
6%7% 17% 3%
Employee Engagement Surveys
Strategic Planning
Customer Segmentation
Big Data Analytics
Use tool significantly more than those not in region Use tool significantly less than those not in region
6
Management Tools & Trends 2015
Figure 5: Attitudes vary by region
Our ability to adapt to change is a significant competitive advantage
Innovation is more important than cost reduction for long-term success
Our current financial performance is strong
Over the next three years, our IT spending must increase as a percent of sales
Customers are less loyal to brands than they used to be
Excessive complexity is raising our costs and hindering our growth
Sustainability initiatives are improving our growth and profitability
Our management actions favor long-term results over short-term earnings
Effective mergers and acquisitions will be critical to success in our industry
Principles and passions of our founders still dominate our operating practices
I am very concerned about the impact a cyber attack could have on us
It feels like economic conditions are improving in our industry
Increased price transparency has had a major impact on our pricing strategy
Over the next three years, we’ll focus more on revenue growth than cost reduction
Advanced analytics are transforming our marketing strategy
We use experimentation and testing techniques proficiently
Insufficent consumer insight is hurting our performance
Our current information systems are constraining profitable growth
Our top management is unwilling to take greater risks for higher returns
We don’t have the tech capabilities required to be a leader in our industry
75%
83%
71%
60%
67%
56%
58%
43%
47%
54%
45%
APACEMEAN. America L. America
68%
63%
76%
64%
55%
54%
50%
55%
60%
49%
49%
88%
84%
76%
54%
68%
85%
74%
71%
74%
76%
72%
75%
74%
71%
68%
56%58% 83% 65%
53%
46%
54%
49%53% 80% 56%
64%
36%
43%
56%36% 57% 40%
44%61% 80% 31%
49%
45%47% 83% 38%
39%43% 75% 45%
40%37% 57% 40%
36%35% 49% 40%
27%28% 34% 30%
Significantly higher than executives not in that region Significantly lower than executives not in that region
Management Tools & Trends 2015
7
Data from the Management Tools & Trends surveys show
that companies have experimented over the years with
a number of tools, such as Business Process Reengi-
neering, to tackle excessive complexity but that they
are still struggling to fi nd one that really works. According
to a different Bain survey of nearly 300 companies, 40%
of those seeking to cut costs by 10% in 2008−09 failed.
And even when such programs succeed, costs notoriously
tend to creep upward over time. New tools designed to
help reduce complexity, such as Decision Rights, fi rst
introduced in 2008, ranked high in satisfaction in 2014
(eighth out of 25), and many (44%) expect to use the
tool in 2015. Others, including Change Management
Programs, got lower-than-average global satisfaction
marks. Complexity Reduction, introduced in 2012, looks
poised to do better—it ranked No. 2 in projected increase
in use for 2015—though it was below average in both
usage and satisfaction in 2014.
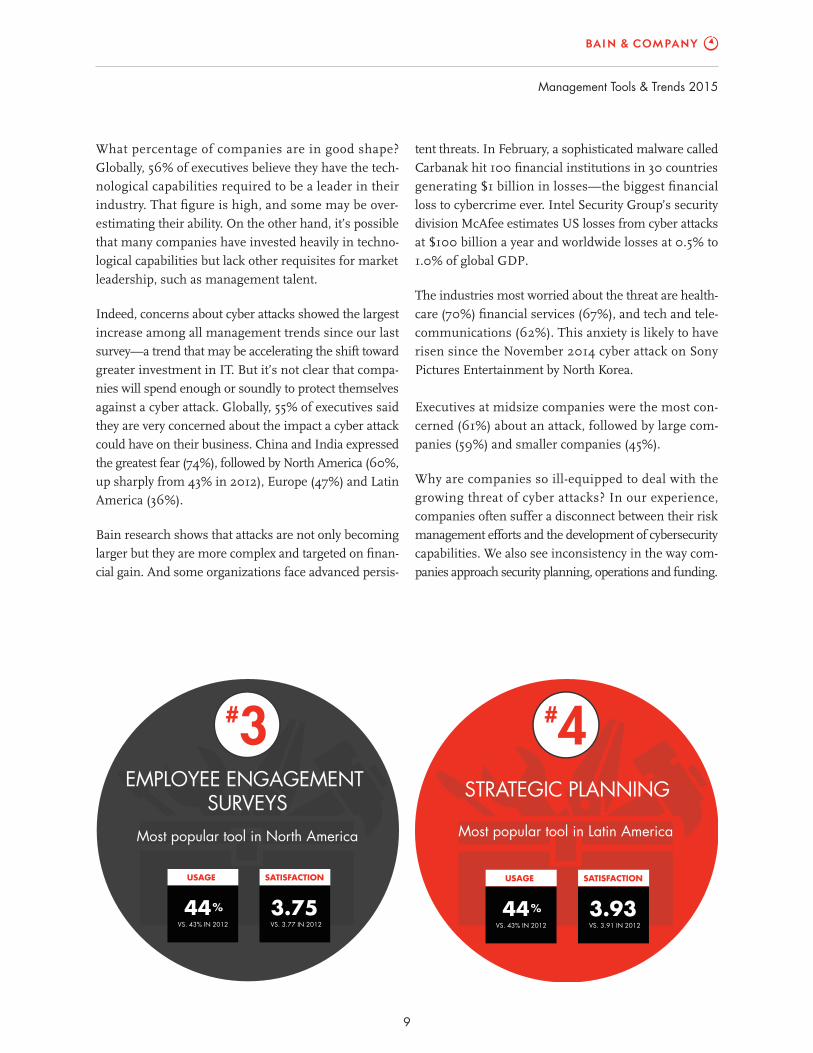
As companies battle with complexity, Zero-based Bud-
geting may be another tool poised to rise in usage: A
more radical approach much under discussion in board-
rooms, it starts with reenvisioning the business from
top to bottom. By starting with a blank sheet of paper,
Zero-based Budgeting helps managers look beyond their
existing organization—particularly those with complex
structures following mergers or acquisitions—and design
an ideal structure based on strategic goals. Zero-based
Budgeting has relatively low usage and satisfaction, but
47% of executives said they plan to use it in 2015, with
particularly strong consensus (80%) in China and India
and among midsize companies (60%).
Trend 3: Investing in the digital transformation trend to fuel growth and innovation, master complexity, and confront risks
Digital technologies have been transforming the global
economy for decades, but the pace of change is quick-
ening. Innovative new products and services enabled
by IT will create tectonic shifts in industries, growth
opportunities, risks and disjunctures. That may be one
reason why executives are determined to improve their
digital agility. Globally, 64% of executives said that over
the next three years, spending on IT must increase as
loyalty/experience was their No. 5 priority in 2015, be-
hind revenue growth, cost cutting, increased profi tability,
and innovation/new products. Of course, developing
innovative products and services is one way companies
can differentiate themselves from the competition and
keep customers coming back. Another tool related to
improving customer loyalty, Customer Segmentation,
ranked 10th in usage and third in satisfaction in 2014.
European companies were the biggest users of Cus-
tomer Segmentation.
The urge for a more sustainable economy also may be
spurring investment in innovation. Governments, com-
panies and consumers increasingly are embracing sus-
tainable products and processes. Globally, 59% of exec-
utives said sustainability initiatives are improving their
growth and profi ts. In particular, midsize companies
concurred, with 71% of executives seeing growth oppor-
tunities linked to sustainability initiatives. Regionally,
China and India had the strongest response, with 85%
agreeing, compared with 54% in North America and
46% in Latin America.
Trend 2: Cost and excessive complexity are a worrying hindrance to growth
Two key obstacles to growth and profi ts loomed large
in the 2015 survey: an insidious rise in costs and exces-
sive complexity. Sixty percent of executives said exces-
sive complexity is raising their costs and hindering
growth. What’s gone wrong? Globalization has given
rise to exceedingly complicated corporate confi gurations
plagued by excessive layers of management, fuzzy deci-
sion making, matrix structures and an exponential increase
in communications—all of which undercut growth and
profi ts. And there is no quick or simple antidote.
At least half of the executives surveyed seem to be adapting
to current challenges by trying new techniques. But
rooting out complex structures and processes is no small
feat. Making a permanent improvement means trans-
forming an organization’s culture. And at the core of
the process is understanding how complexity drives up
costs and impedes a company’s ability to innovate.
8
Management Tools & Trends 2015
The industries moving quickest to harness advanced
analytics are healthcare, financial services, pharma-
ceuticals and biotech, and technology and telecommu-
nications. Companies that are successful in applying
advanced analytics utilize it to automate a number of
carefully selected decisions so that they are done better
and faster, Bain research shows. Thirty percent of com-
panies were extremely satisfi ed with the Big Data Ana-
lytics tool, while only 5% were dissatisfied. Midsize
companies were the biggest users of the tool (38%) and
the most satisfi ed with it. But some industries clearly
haven’t fi gured out how to wield it to their advantage.
Executives in chemicals and metals and consumer
products are the least likely to say that advanced analytics
had a signifi cant impact on their marketing strategy.
For many companies, particularly smaller players, the
era of Big Data poses a daunting resource challenge.
Without the skills and capital to tap the potential of the
ongoing digital transformation, many may fi nd it increas-
ingly difficult to close the gap with data leaders and
benefit from the trend. They will need IT savvy not
only to unleash growth but also to respond effectively to
the networked digital economy’s challenges and risks,
such as cyber attacks.
a percentage of sales. Most of the respondents who shared
this view were from emerging countries, especially China
and India, where 83% said spending on IT would rise.
Companies may increase investment in IT to achieve a
wide array of goals, from better supply chain manage-
ment to increasing customer loyalty. They could also
identify new markets or improve data security in an era
of growing risks and volatility. More than half of those
surveyed, for example, said they are using advanced ana-
lytics to transform their marketing strategies, with 65%
of midsize companies concurring. Forty-two percent of
executives said their IT systems are constraining profi table
growth, down slightly from 49% in 2012. Firms in
China and India are most likely to say that advanced
analytics are transforming their marketing strategy
(83% agree), compared with North America (47%),
Europe (45%) and Latin America (38%).
The ranking of the Big Data Analytics tool in 2015 under-
scores the management trend. The tool helps companies
glean valuable insights from massive quantities of data
that can fuel growth. Introduced to the survey in 2012,
it ranked fi rst in satisfaction in 2014 and 11th in usage.
CUSTOMER RELATIONSHIP MANAGEMENT
Most popular tool globally
1#
USAGE
%46
SATISFACTION
3.93VS. 43% IN 2012 VS. 3.96 IN 2012
BENCHMARKING
Popular among large companies
2#
USAGE
%44
SATISFACTION
3.80VS. 40% IN 2012 VS. 3.86 IN 2012
Management Tools & Trends 2015
9
tent threats. In February, a sophisticated malware called
Carbanak hit 100 fi nancial institutions in 30 countries
generating $1 billion in losses—the biggest fi nancial
loss to cybercrime ever. Intel Security Group’s security
division McAfee estimates US losses from cyber attacks
at $100 billion a year and worldwide losses at 0.5% to
1.0% of global GDP.
The industries most worried about the threat are health-
care (70%) fi nancial services (67%), and tech and tele-
communications (62%). This anxiety is likely to have
risen since the November 2014 cyber attack on Sony
Pictures Entertainment by North Korea.
Executives at midsize companies were the most con-
cerned (61%) about an attack, followed by large com-
panies (59%) and smaller companies (45%).
Why are companies so ill-equipped to deal with the
growing threat of cyber attacks? In our experience,
companies often suffer a disconnect between their risk
management efforts and the development of cybersecurity
capabilities. We also see inconsistency in the way com-
panies approach security planning, operations and funding.
What percentage of companies are in good shape?
Globally, 56% of executives believe they have the tech-
nological capabilities required to be a leader in their
industry. That fi gure is high, and some may be over-
estimating their ability. On the other hand, it’s possible
that many companies have invested heavily in techno-
logical capabilities but lack other requisites for market
leadership, such as management talent.
Indeed, concerns about cyber attacks showed the largest
increase among all management trends since our last
survey—a trend that may be accelerating the shift toward
greater investment in IT. But it’s not clear that compa-
nies will spend enough or soundly to protect themselves
against a cyber attack. Globally, 55% of executives said
they are very concerned about the impact a cyber attack
could have on their business. China and India expressed
the greatest fear (74%), followed by North America (60%,
up sharply from 43% in 2012), Europe (47%) and Latin
America (36%).
Bain research shows that attacks are not only becoming
larger but they are more complex and targeted on fi nan-
cial gain. And some organizations face advanced persis-
EMPLOYEE ENGAGEMENT SURVEYS
Most popular tool in North America
3#
USAGE
%44
SATISFACTION
3.75VS. 43% IN 2012 VS. 3.77 IN 2012
STRATEGIC PLANNING
Most popular tool in Latin America
4#
USAGE
%44
SATISFACTION
3.93VS. 43% IN 2012 VS. 3.91 IN 2012
10
Management Tools & Trends 2015
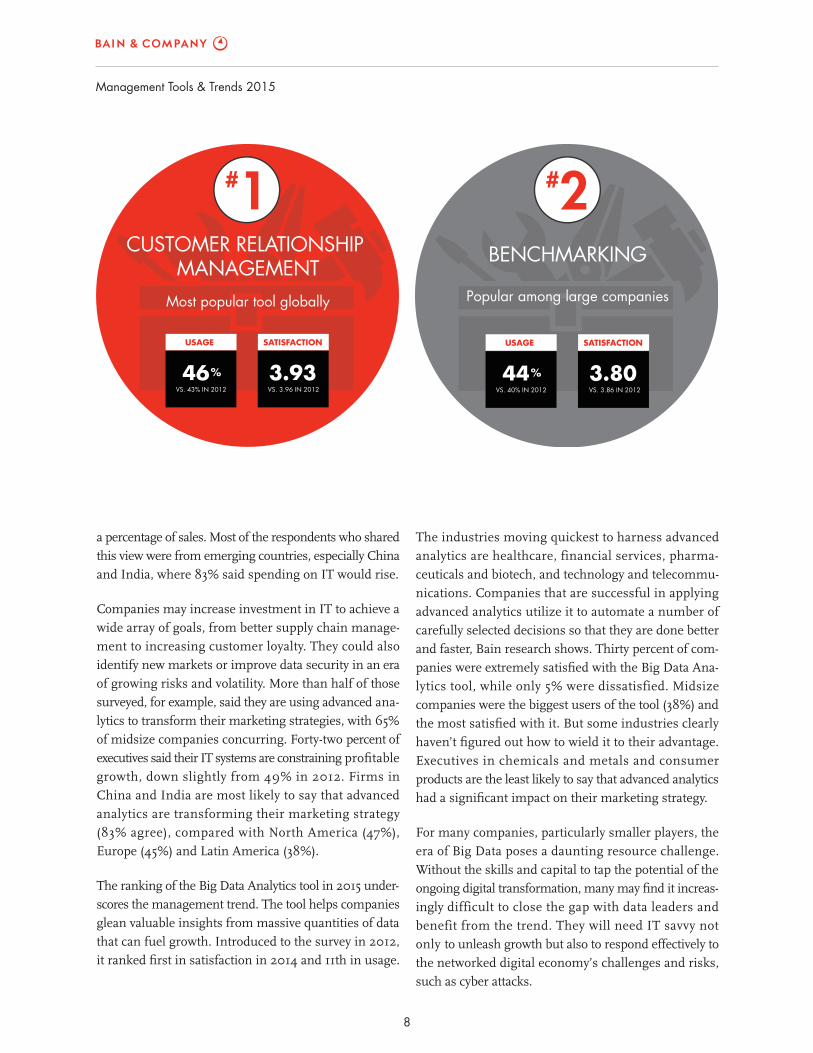
Engagement Surveys meanwhile ranked No. 2 in use
(tied with Benchmarking and Strategic Planning) among
all 25 tools, which may refl ect increasing evidence of a
link between engaged employees and customer loyalty.
Tool use and satisfaction: Old school vs. new school
Each survey highlights regional differences in tool use
and satisfaction. An interesting pattern that emerged
from the 2015 survey was a clear split between regions
preferring traditional tools and those going for newer
tools linked to the digital transformation trend. Such
differences may result from varying views on this year’s
key trends—namely, growth and innovation, cost and
complexity, investment in the digital transformation, and
better understanding customers.
Established market fi rms in North America and Europe
are heavier users of more traditional tools such as Bench-
marking, Employee Engagement Surveys and Change
Management Programs. By contrast, Chinese and Indian
companies strongly prefer newer and innovation-linked
tools such as Big Data Analytics, Digital Transformation,
Together, these mistakes create gaps in strategy and
operations that leave organizations vulnerable. Leading
organizations take a more strategic rather than operational
approach to security.
Trend 4: Understanding customers
Another trend linked to growth and the digital trans-
formation is the desire to better understand customers.
Leading companies know that improving customer
loyalty can help raise revenue and profi ts. The desire
cuts across industries, as retailers, bankers, insurers,
manufacturers and utilities search for ways to better
understand their customers’ desires—and prevent them
from defecting to rivals. In this year’s survey, 62% of
executives expressed concern that customers are less
loyal to brands than they used to be, and 46% said insuf-
fi cient consumer insight is hurting their performance.
Satisfaction and Loyalty Management tools can help by
tracking customer views and satisfaction and diagnosing
root causes of defection. So it’s not surprising that the
2015 survey ranked Customer Relationship Management
the top utilized tool for the second time in a row. Employee
OUTSOURCINGExecutives expect to use the tool
more in 2015
5#
USAGE
%41
SATISFACTION
3.61VS. 36% IN 2012 VS. 3.64 IN 2012
BALANCED SCORECARDHigher satisfaction in emerging markets
than established ones
6#
USAGE
%38
SATISFACTION
3.90VS. 38% IN 2012 VS. 3.90 IN 2012
Management Tools & Trends 2015
11
tencies (39%), Supply Chain Management (48%), Total
Quality Management (47%) and Price Optimization
Models (28%), and they matched North America in the
use of Outsourcing (both regions at 42%).
Latin American companies show more of a preference
than other regions for some of the old-school tools, in-
cluding Strategic Planning, Strategic Alliances and Busi-
ness Process Reengineering.
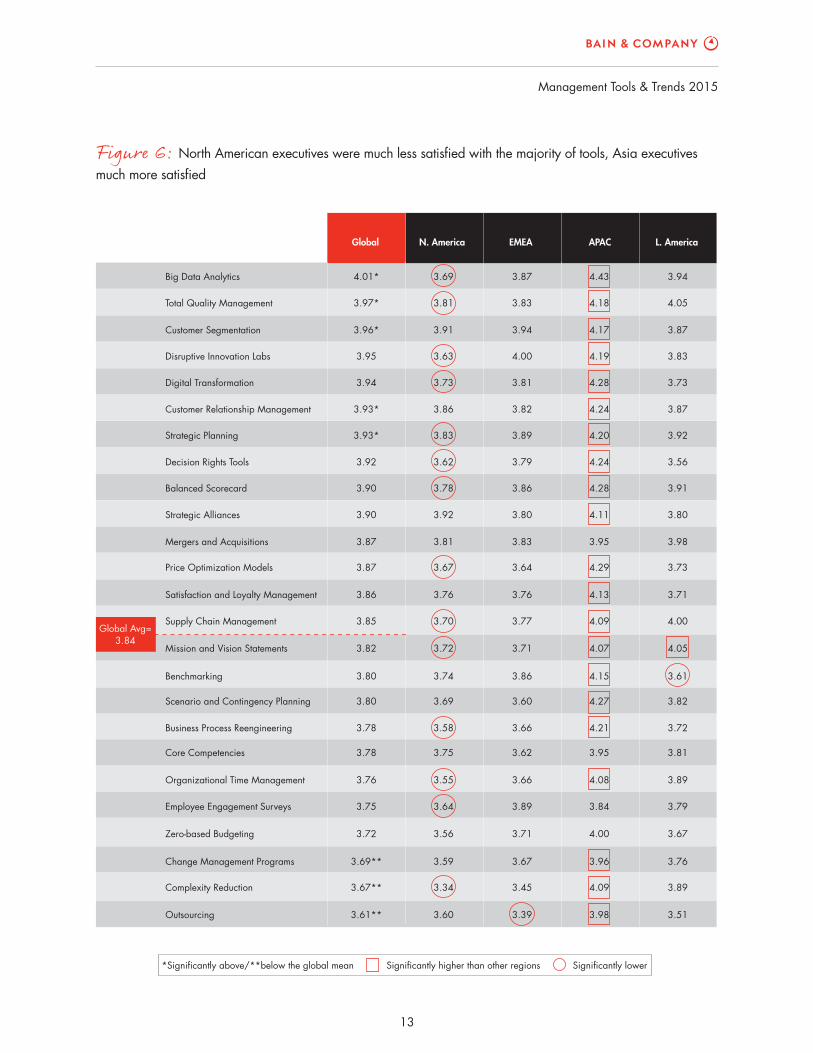
Perhaps the most striking regional fi nding: North Amer-
ican executives were signifi cantly less satisfi ed with the
majority of tools—old and new—while Chinese and
Indian executives were signifi cantly more satisfi ed with
them (see Figure 6). As mentioned above, Chinese
and Indian fi rms expressed far more commitment to
innovation than their North American counterparts
and were the most confident about their “ability to
adapt as a significant competitive advantage” (88%)
compared with North America (68%) and Europe
(75%). Chinese and Indian executives also were more
Disruptive Innovation Labs and Complexity Reduction—
perhaps viewing these tools as a way to catapult them-
selves into global markets as fast followers.
Are two distinct camps emerging—an old school and a
new school of tool users? It’s too soon to say. One factor
that might play a role in China’s and India’s embrace of
digital tools is their greater focus on innovation. As
mentioned earlier, 84% of Chinese and Indian execu-
tives ranked innovation as more important than cost
reduction to long-term success compared with only
63% of North American companies. Chinese and Indian
companies seeking to challenge established Western
giants in global markets might see innovation as their
best strategy and tools such as Disruptive Innovation
Labs as a way to unleash more of it.
Interestingly, China and India are using a lot of old tools
as well—perhaps an effort to leave no stone unturned
as they challenge entrenched market leaders. China and
India lead the rest of the world in using Core Compe-
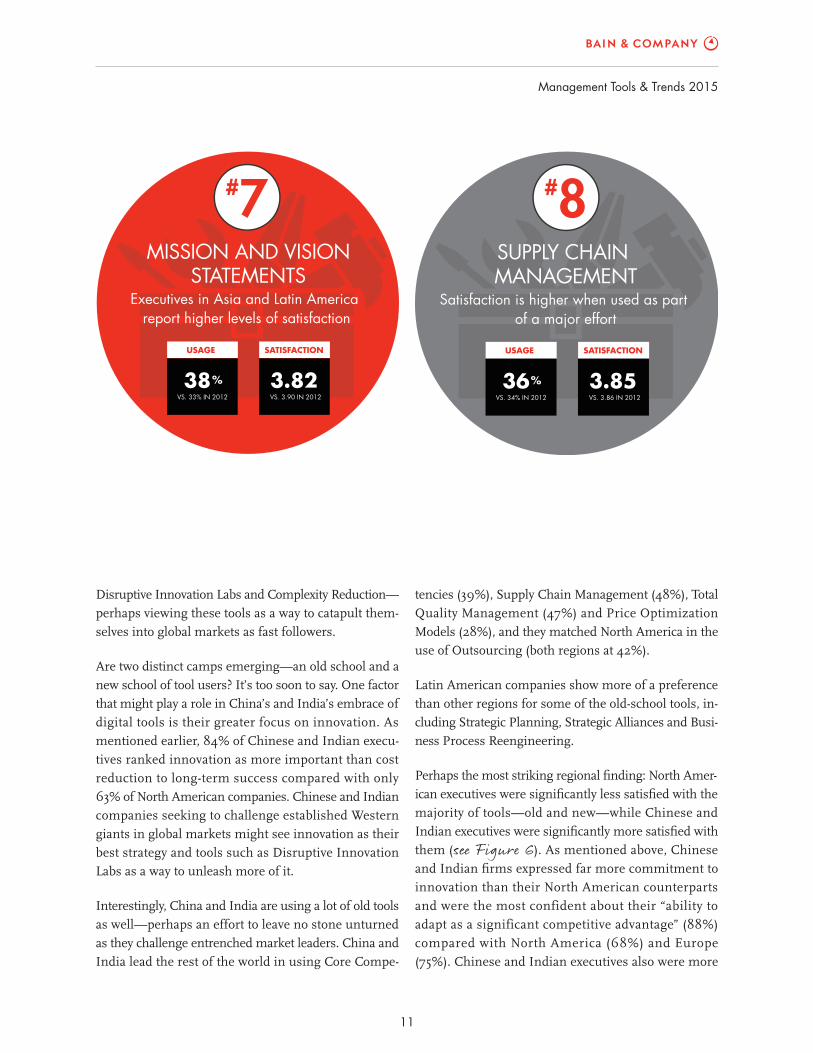
MISSION AND VISIONSTATEMENTS
Executives in Asia and Latin America report higher levels of satisfaction
7#
USAGE
%38
SATISFACTION
3.82VS. 33% IN 2012 VS. 3.90 IN 2012
SUPPLY CHAIN MANAGEMENT
Satisfaction is higher when used as part of a major effort
8#
USAGE
%36
SATISFACTION
3.85VS. 34% IN 2012 VS. 3.86 IN 2012
12
Management Tools & Trends 2015
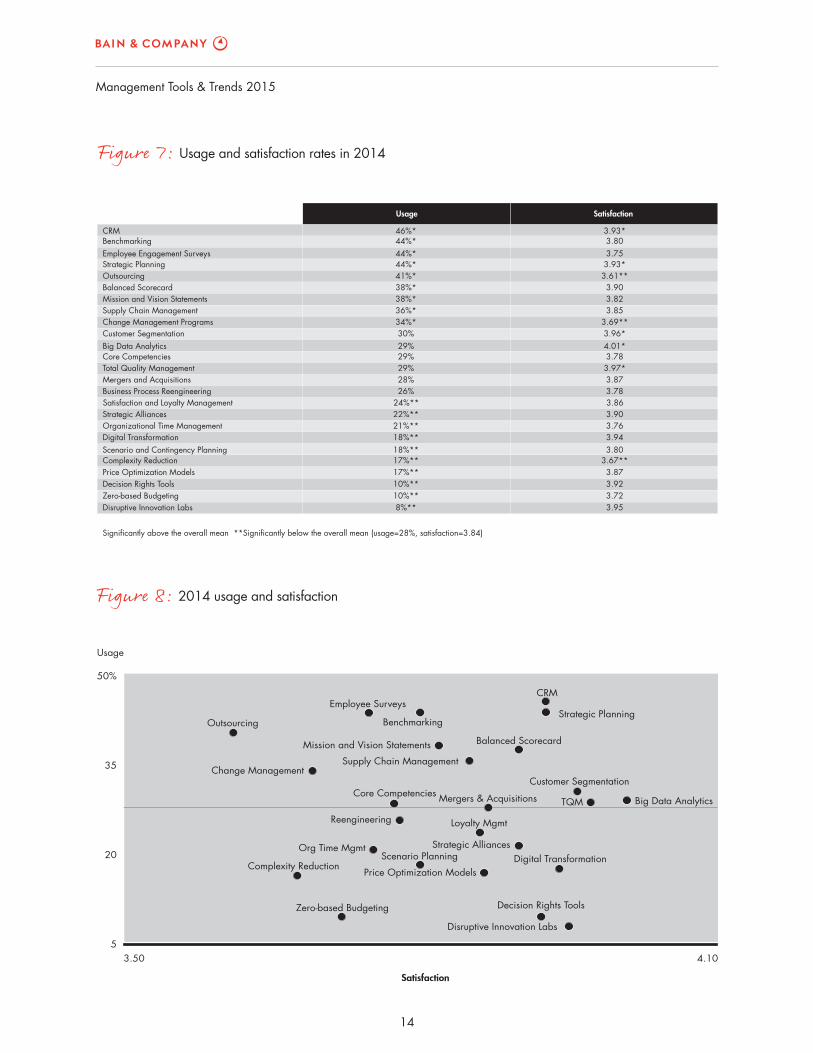
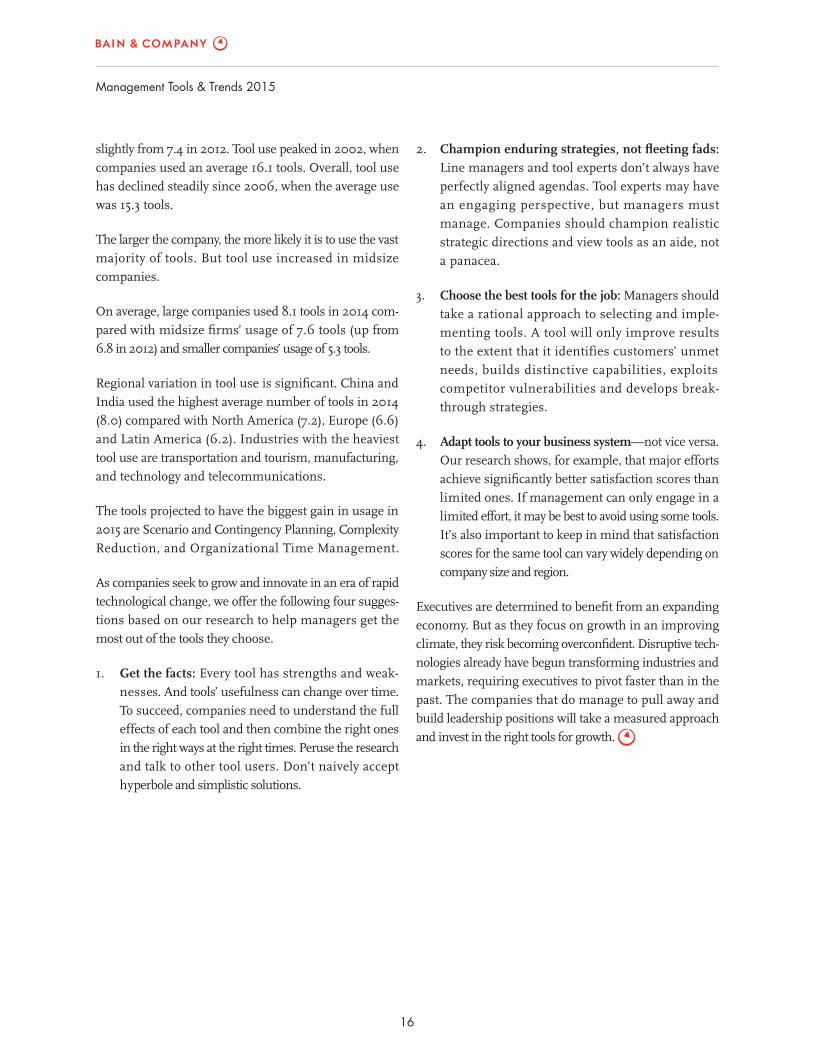
It’s important for companies to understand that not
every tool is right for every situation. Based on our experi-
ence tracking tool use, when satisfaction is high but
usage is low, usage tends to grow. One example is Big
Data Analytics, which looks poised to increase in use
(see Figure 9). When usage is high and satisfaction
is low, usage tends to drop, as is the case of Change Manage-
ment Programs—that is, unless the tool improves, as was
the case with Customer Relationship Management.
The tools with the greatest satisfaction spread, showing
more executives satisfi ed than not satisfi ed, were Total
Quality Management, Big Data Analytics, Decision
Rights Tools and Digital Transformation. No matter
what tools companies prefer, it’s clear that major efforts
with tools produce better satisfaction scores than limited
efforts, and some tools may not be worth using on a
limited basis. For some tools, the difference is enormous:
Balanced Scorecard rated third-highest tool when used
as part of a major effort, but it tied for 17th when used
on a limited basis (see Figure 10).
Globally, the trend toward using fewer tools continues.
Companies used an average of 7.0 tools in 2014, down
determined to increase investment in IT (83%) com-
pared with North America (58%), Europe (56%) and
Latin America (65%).
Extrapolating from those results, the greater satisfaction
of Chinese and Indian executives with all tools may
simply reflect their determination to leapfrog global
rivals and their belief that such tools are helping them.
On the other hand, it may also refl ect excessive optimism
about the impact of management tools based on fewer
years of experience with them.
Summing up
The six most popular tools of 2012 remained in the top
six for 2014, with Customer Relationship Management
the No. 1, followed by Benchmarking, Employee Engage-
ment Surveys, Strategic Planning, Outsourcing and
Balanced Scorecard (see Figure 7). Core Competencies
was the only tool to drop out of the top 10 from 2012.
Comparing the top 10 tools over a 10-year period, Stra-
tegic Planning, Benchmarking, Outsourcing, and Mission
and Vision Statements consistently remain in the top 10.
CHANGE MANAGEMENTPROGRAMS
Executives expect to use this tool more often in 2015
9#
USAGE
%36
SATISFACTION
3.69VS. 34% IN 2012 VS. 3.86 IN 2012
CUSTOMER SEGMENTATION
Satisfaction is higher when used as part of a major effort
10#
USAGE
%30
SATISFACTION
3.96VS. 30% IN 2012 VS. 3.88 IN 2012
Management Tools & Trends 2015
13
Figure 6: North American executives were much less satisfi ed with the majority of tools, Asia executives much more satisfi ed
Scenario and Contingency Planning
Big Data Analytics
Total Quality Management
Customer Segmentation
Disruptive Innovation Labs
Digital Transformation
Customer Relationship Management
Strategic Planning
Decision Rights Tools
Balanced Scorecard
Strategic Alliances
Mergers and Acquisitions
Price Optimization Models
4.01*
3.97*
3.96*
3.95
3.94
3.93*
3.93*
3.92
3.90
3.90
3.87
3.87
APACEMEAN. AmericaGlobal L. America
Satisfaction and Loyalty Management 3.86
Supply Chain Management 3.85
Mission and Vision Statements 3.82
Benchmarking 3.80
3.80
3.78
Core Competencies 3.78
Organizational Time Management 3.76
Employee Engagement Surveys 3.75
Zero-based Budgeting 3.72
Change Management Programs 3.69**
Complexity Reduction 3.67**
Outsourcing 3.61**
3.69
3.81
3.91
3.63
3.73
3.86
3.83
3.62
3.78
3.92
3.81
3.67
3.76
3.70
3.72
3.74
3.69
3.58
3.75
3.55
3.64
3.56
3.59
3.34
3.60
3.87
3.83
3.94
4.00
3.81
3.82
3.89
3.79
3.86
3.80
3.83
3.64
3.76
3.77
3.71
3.86
3.60
3.66
3.62
3.66
3.89
3.71
3.67
3.45
3.39
4.43
4.18
4.17
4.19
4.28
4.24
4.20
4.24
4.28
4.11
3.95
4.29
4.13
4.09
4.07
4.15
4.27
4.21
3.95
4.08
3.84
4.00
3.96
4.09
3.98
3.94
4.05
3.87
3.83
3.73
3.87
3.92
3.56
3.91
3.80
3.98
3.73
3.71
4.00
4.05
3.61
3.82
3.72
3.81
3.89
3.79
3.67
3.76
3.89
3.51
Business Process Reengineering
Global Avg=3.84
Significantly higher than other regions*Significantly above/**below the global mean Significantly lower
14
Management Tools & Trends 2015
Figure 8: 2014 usage and satisfaction
5
20
35
50%
3.50 4.10
Disruptive Innovation Labs
Zero-based Budgeting Decision Rights Tools
Price Optimization ModelsComplexity Reduction
Scenario Planning Digital TransformationOrg Time Mgmt Strategic Alliances
Loyalty MgmtReengineering
Core Competencies
Change ManagementSupply Chain Management
Mission and Vision Statements Balanced Scorecard
Outsourcing
Employee SurveysCRM
Satisfaction
Usage
Mergers & Acquisitions TQM Big Data Analytics
Customer Segmentation
BenchmarkingStrategic Planning
Figure 7: Usage and satisfaction rates in 2014
CRMBenchmarkingEmployee Engagement SurveysStrategic PlanningOutsourcingBalanced ScorecardMission and Vision StatementsSupply Chain ManagementChange Management ProgramsCustomer SegmentationBig Data AnalyticsCore CompetenciesTotal Quality ManagementMergers and AcquisitionsBusiness Process ReengineeringSatisfaction and Loyalty ManagementStrategic AlliancesOrganizational Time ManagementDigital TransformationScenario and Contingency Planning
46%*44%*44%*44%*41%*38%*38%*36%*34%*30%29%29%29%28%26%
24%**22%**21%**18%**18%**
3.93*3.803.753.93*3.61**3.903.823.85
3.69**3.96*4.01*3.783.97*3.873.783.863.903.763.94
Complexity Reduction 17%** 3.67**Price Optimization Models 17%** 3.87Decision Rights Tools 10%** 3.92Zero-based Budgeting 10%** 3.72Disruptive Innovation Labs
Significantly above the overall mean **Significantly below the overall mean (usage=28%, satisfaction=3.84)
8%** 3.95
3.80
Usage Satisfaction
Management Tools & Trends 2015
15
Figure 10: Major efforts achieve higher satisfaction
Big Data AnalyticsDisruptive Innovation Labs
Balanced ScorecardTotal Quality ManagementCustomer SegmentationDigital TransformationStrategic AlliancesDecision Rights ToolsCustomer Relationship ManagementPrice Optimization Models
Mergers and AcquisitionsBenchmarkingStrategic PlanningSatisfaction and Loyalty ManagementSupply Chain ManagementOrganizational Time ManagementBusiness Process ReengineeringMission and Vision StatementsScenario and Contingency Planning
Zero-based Budgeting
4.224.22
4.194.194.174.174.124.114.094.09
4.084.074.074.034.024.014.004.004.00
3.93
3.653.70
3.533.573.693.523.643.703.633.62
3.643.553.633.593.523.513.533.583.54
Core Competencies 3.91 3.59Employee Engagement Surveys 3.87 3.59Change Management Programs 3.82 3.53Complexity Reduction 3.82 3.49Outsourcing 3.72 3.50
3.43
Major effort score Limited effort score
Figure 9: Expected change in usage
Scenario and Contingency PlanningComplexity Reduction
Organizational Time Management
Strategic AlliancesCore CompetenciesPrice Optimization ModelsZero-based Budgeting
Customer Segmentation
Business Process ReengineeringBig Data AnalyticsTotal Quality ManagementDigital TransformationDecision Rights ToolsCustomer Relationship ManagementChange Management ProgramsStrategic PlanningMission and Vision Statements
BenchmarkingEmployee Engagement SurveysDisruptive Innovation Labs
Mergers and AcquisitionsBalanced Scorecard
Outsourcing
Supply Chain Management
42%40%
40%
38%38%37%
37%
37%35%
35%34%
Projected 2015 usageProjected increase Actual 2014 usage
60%57%
61%
60%67%54%
67%
63%64%
53%44%
18%17%
21%
22%
39% 63% 24%
29%17%
30%
37% 47% 10%
26%29%
18%
33% 77% 44%
35% 64% 29%
10%33% 79% 46%33% 67% 34%
33% 71% 38%
33% 77% 44%30% 74% 44%28% 36% 8%
27% 55% 28%27% 65% 38%27% 63% 36%
26% 67% 41%
Satisfaction and Loyalty Management
16
Management Tools & Trends 2015
2. Champion enduring strategies, not fl eeting fads: Line managers and tool experts don’t always have
perfectly aligned agendas. Tool experts may have
an engaging perspective, but managers must
manage. Companies should champion realistic
strategic directions and view tools as an aide, not
a panacea.
3. Choose the best tools for the job: Managers should
take a rational approach to selecting and imple-
menting tools. A tool will only improve results
to the extent that it identifies customers’ unmet
needs, builds distinctive capabilities, exploits
competitor vulnerabilities and develops break-
through strategies.
4. Adapt tools to your business system—not vice versa.
Our research shows, for example, that major efforts
achieve signifi cantly better satisfaction scores than
limited ones. If management can only engage in a
limited effort, it may be best to avoid using some tools.
It’s also important to keep in mind that satisfaction
scores for the same tool can vary widely depending on
company size and region.
Executives are determined to benefi t from an expanding
economy. But as they focus on growth in an improving
climate, they risk becoming overconfi dent. Disruptive tech-
nologies already have begun transforming industries and
markets, requiring executives to pivot faster than in the
past. The companies that do manage to pull away and
build leadership positions will take a measured approach
and invest in the right tools for growth.
slightly from 7.4 in 2012. Tool use peaked in 2002, when
companies used an average 16.1 tools. Overall, tool use
has declined steadily since 2006, when the average use
was 15.3 tools.
The larger the company, the more likely it is to use the vast
majority of tools. But tool use increased in midsize
companies.
On average, large companies used 8.1 tools in 2014 com-
pared with midsize fi rms’ usage of 7.6 tools (up from
6.8 in 2012) and smaller companies’ usage of 5.3 tools.
Regional variation in tool use is signifi cant. China and
India used the highest average number of tools in 2014
(8.0) compared with North America (7.2), Europe (6.6)
and Latin America (6.2). Industries with the heaviest
tool use are transportation and tourism, manufacturing,
and technology and telecommunications.
The tools projected to have the biggest gain in usage in
2015 are Scenario and Contingency Planning, Complexity
Reduction, and Organizational Time Management.
As companies seek to grow and innovate in an era of rapid
technological change, we offer the following four sugges-
tions based on our research to help managers get the
most out of the tools they choose.
1. Get the facts: Every tool has strengths and weak-
nesses. And tools’ usefulness can change over time.
To succeed, companies need to understand the full
effects of each tool and then combine the right ones
in the right ways at the right times. Peruse the research
and talk to other tool users. Don’t naively accept
hyperbole and simplistic solutions.
For more information, visit www.bain.com
Shared Ambit ion, True Re sults
Bain & Company is the management consulting fi rm that the world’s business leaders come to when they want results.
Bain advises clients on strategy, operations, technology, organization, private equity and mergers and acquisitions. We develop practical,
customized insights that clients act on and transfer skills that make change stick. Founded in 1973, Bain has 51 offi ces in 33 countries,
and our deep expertise and client roster cross every industry and economic sector. Our clients have outperformed the stock
market 4 to 1.
What sets us apart
We believe a consulting fi rm should be more than an adviser. So we put ourselves in our clients’ shoes, selling outcomes, not
projects. We align our incentives with our clients’ by linking our fees to their results and collaborate to unlock the full potential of
their business. Our Results Delivery® process builds our clients’ capabilities, and our True North values mean we do the right
thing for our clients, people and communities—always.


