41
Bajaj Consumer Care Limited INVESTOR PRESENTATION Q3 - 2018

Bajaj Consumer Care Limited
INVESTOR PRESENTATION
Q3 - 2018
FLOW
• BCL TRANSFORMATION FOR GROWTH PILLARS & ACTION TAKEN
• INDUSTRY OVERVIEW
• FINANCIAL INFORMATION
1

VISION
VALUES
WINNING
WITH
BRANDS
WINNING
IN
MARKET
WINNING
WITH
PROCESSES
WINNING
WITH
PEOPLE
TRANFORMING FOR GROWTH – BCL PATHFINDER
PILLARS OF GROWTH
MISSION
2

GROWTH PILLARS INTO ACTIONWINNING WITH BRANDS - INNOVATIONS , RENOVATIONS,
COLLABORATIONS
Haircare • Multi Media support behind ADHO Relaunch continued in Q3 to increase penetration of ADHO in the
THO category
• Rs 10 pack launched in PET jar as a part of the drive to boost our penetration growth in Rural India.
• Focused drive on BAHO started in IB markets , MT and Ecommerce channel.
Skincare• NOMARKS relaunch supported with strong Media and Distribution inputs in Q3 to gain share and
position it as a premium ayurvedic skincare brand
• Strong Market share growths on No Marks cream continue in UP (key market) and All India.
Consumer and Technical Expertise Creation• Started using the "Trained panel" which can evaluate sensory (tactile, visual) aspects of the product to
give directional insights to design formulations
• This will help in future launch of new products
3

Q3– MARKET CONTEXTStrong Volume Growth Across Categories
HAIROILS
• Volume MS% of Bajaj Almond Drops improved to 7.7% in MAT Nov 18 vs 7.2% in MAT Nov 17
• Share within the LHO segment continued to surge forward with MAT Nov 18 at 60% vs 58.4% for MAT Nov 17
• 2X Offtake growth on ADHO in Mat Nov 18 Period vs the Category in the same period (14.9 vs 7%)
• Strong Penetration increase in ADHO from 19% (MAT Q3-18) vs 17.4% (MAT Q3-17) with a 12% increase in Households
NOMARKS
• 2X Offtake growth on No Marks in Q3 with a 49% growth in Oct-Nov’18
• No Marks MAT Nov 18 MS% improved to 8.6% from 7.6% in MAT Nov 17
4
Source: Nielsen Retail Audit Report, Nov 2018

Q3 - BAJAJ ALMOND DROPS MULTI MEDIA SUPPORT ON RESTAGE
- New TVC for Pack Launch
- 13% SOV For the Restage Period
Innovative Press Ads
5
Jhandewalan 16'x8' 1
Delhi Metro – Outdoor Support
- Innovative In Program Integration for High Impact.

Q3 KEY INITIATIVE UPDATE– Rs. 10 PACK FOR RURAL
•Objective of Upgrading the huge base of Rs 1 sachet
• Rs 10 pack in a Secondary Pack of PET Jar format for increasing Distribution in Rural
• 40% Increase in Sales in Sep –Dec period vis a Vis Q1/Q2.
6

2,000
2,500
3,000
3,500
4,000
4,500
Oct-Nov'17 Oct-Nov'18
Vol Sales (KL)
174
211
100
120
140
160
180
200
220
Oct-Nov'17 Oct-Nov'18
Val Sales (Cr)
Positive Results across all Parameters on ADHO
High growth in Val Offtakes
High growths in Vol Offtakes
Growths in MS Val
All Time High THO Vol Share All Time High LHO Vol Share
All Time High LHO Val Share
Source: Nielsen Retail Audit Report, Nov 2018
7
9.3 9.4
8.00
8.50
9.00
9.50
Oct-Nov'17 Oct-Nov'18
MS Val - THO
60.8
62.3
55.0
56.0
57.0
58.0
59.0
60.0
61.0
62.0
63.0
Oct-Nov'17 Oct-Nov'18
MS Val - LHO
7.1
7.8
5.6
6.1
6.6
7.1
7.6
8.1
Oct-Nov'17 Oct-Nov'18
MS Vol - THO
58.5
59.6
55.0
56.0
57.0
58.0
59.0
60.0
Oct-Nov'17 Oct-Nov'18
MS Vol - LHO

0
10,000
20,000
30,000
40,000
50,000
60,000
70,000
80,000
90,000
1,00,000
Q1 Q2 Oct-Nov'18
NOMARKS OFFTAKES AND
GROWTH %
17-18 18-19
8
0.1%
32%
Source: Nielsen Retail Audit Report, Nov 2018
Q3 Key Initiative NOMARKS OFFTAKE post restage
Strong offtake growth post restage continued in Q3 .
49%

NOMARKS Market Share trend
7.5 7.6 7.8 7.9 8.1 8.2 8.1 8.1 8.0 8.0 8.2 8.3 8.5 8.6
9.1 9.2 9.59.6 9.7 9.7 9.6 9.6 9.5 9.5
9.6 9.8 10.1 10.3
4.8 4.8 4.9 5.0 5.25.3 5.3 5.4 5.3 5.3 5.5
5.5
5.4 5.5
4.0
5.0
6.0
7.0
8.0
9.0
10.0
11.0
MAT
OCT17
MAT
NOV17
MAT
DEC17
MAT
JAN18
MAT FEB
18
MAT
MAR 18
MAT
APR 18
MAT
MAY 18
MAT JUN
18
MAT JUL
18
MAT
AUG 18
MAT
SEPT18
MAT
OCT 18
MAT
NOV 18
MS VAL
All India U+R All India U All India R
9
Consistent growth in MAT share post restage
Re-launch
Source: Nielsen Retail Audit Report, Nov 2018
Highest
growth in
Market Share
in Antimarks

NOMARKS MS trend in Key Mkt - UP
5.3 5.5 5.7 6.0 6.36.5 6.6
6.8 6.6 6.66.9 7.1 7.2 7.37.8
8.28.6
9.19.7 9.9 10.0
10.3 10.3 10.210.6
11.211.6 11.8
3.6 3.6 3.7 3.8 4.0 4.2 4.4 4.5 4.2 4.44.6 4.6 4.5 4.6
3.0
4.0
5.0
6.0
7.0
8.0
9.0
10.0
11.0
12.0
MAT
OCT 17
MAT
NOV 17
MAT
DEC 17
MAT
JAN 18
MAT
FEB 18
MAT
MAR 18
MAT
APR 18
MAT
MAY 18
MAT
JUN 18
MAT
JUL 18
MAT
AUG 18
MAT
SEP 18
MAT
OCT 18
MAT
NOV 18
MS VAL
UP (U+R) Uttar Pradesh - Urban Uttar Pradesh - Rural
10
Highest MAT share in UP both Urban and Rural in the last 1 year
Re-launch
Source: Nielsen Retail Audit Report, Nov 2018
Highest
growth in
Market Share
in Antimarks

NOMARKS – Market Share post restage
MARKET SHARE % Q1 Q2
Oct-
Nov’18
CHEMIST 7.1 8.4 8.9
COSMETIC 13.2 18 21.1
GROCERS 8.2 11 9.0
TOTAL 7.5 9.2 9.3
Market Share increases across channelsSource: Nielsen Retail Audit Report, Nov 2018
11

Enhancing Quantity and Quality of Distribution:• Improving Quality and quantity of coverage through effective use of SFA
• Focus on increasing Numeric as well as Weighted Distribution of Hair Oils
• Bajaj Almond Drops now available in over 40 lakh outlets
• Lowering of WS contribution from 60% to 33% over the last 2.5 years
Costs • Input prices are seeing softening trend amidst volatility expected to be favourable Q4 onwards
• Crude oil prices expected to be volatile in Q4 given macroeconomic conditions
• Initiatives in manufacturing operations and distributions to further help in maximizing benefits in Q4
12
Source: Nielsen Retail Audit Report, Nov 2018
Outlet no. in Lakhs 16-17 17-18 Q1-18 Q2 -18 Q3 -18 Plan 18-19
AC Nielsen Coverage 37.5 39.0 39.6 39.9 40.01 41.0Direct Coverage 1.4 2.8 4.8 4.9 4.92 5.4
% of direct coverage 4% 8% 11.8% 12% 12% 14%
GROWTH PILLARS INTO ACTIONWINNING IN MARKET – QUALITY & QUANTITY

General Trade:• Rural markets still leading the overall growths in the overall market. • Witnessed buoyancy in the rural offtakes in Q3 vs Q2• Better traction in Wholesale in the latter part of Q3• Urban Retail continues to be stable
Alternate Channel:• Strong growth continues in Modern Trade. Growth at 27% y-o-y• Nomarks in Modern Trade grew by more than 20% by value in this quarter• Increase in e-commerce platforms leads to 150% growth in business within the ecommerce
segment• CSD has done much better this qtr but uncertainties for the future remain as is
International Business:• International Business reboot has started to show strong results as we end in a positive for the
first time this year• Stable front end and support teams in place with clear strategic priorities• Strong end to the quarter with both Nov and Dec delivering good volume and value growths
13
Q3 – MARKET CONTEXT

GROWTH PILLARS INTO ACTION
WINNING WITH PEOPLE – ENGAGE and DEVELOP
• As part of the Performance Management process, Mid-Year Review assessments for all employees were completed on time.
• The Internal Complaints Committee (ICC) has been reconstituted with induction of External Member as per POH mandate. The POSH Policy has also been revamped.
• To strengthen functional capability of the newly built R&D team, a focused 2 Days Intervention on skin anatomy and multiple applications and its effects on skin was conducted by a reputed Dermatologist
• In our endeavour to create talent pipeline by hiring through premium campuses, we have offered Summer Internship to 3 Students of Tier 1 Institutes ( IIM Lucknow and NMIMS Mumbai)
• Introduced the concept of online trainings to enhance the skills of Operators. Established a rewards and recognition program for operators delivering consistent quality and productivity
14

INDUSTRY OVERVIEW

Industry Size and Structure
Light Hair Oils36,409 Tn1,833 Cr
FMCGRs. 3,53,277 cr
Hair CareRs. 22,575 cr
ShampooRs. 6,788 cr
(30%)*
Coconut OilRs. 3,806 cr
(17%)*
Hair OilRs. 7,394 cr.
(33%)*
Hair ConditionersRs. 577 cr.
(3%)*
Hair DyesRs. 4,010 cr
(18%)*
Amla Based Oils54,570 Tn1,843 Cr
VACNO31,401 Tn1,226 Cr
6% CONTRIBUTION
All India (U+R) MAT MAR 2018
*Others (8% contribution)5,358 Tn
561 Cr
Ayurvedic/ Herbal8,719 Tn
901 Cr
Cooling Hair Oils20,184 Tn1,031 Cr
25% 25% 17% 12% 14%
* Indicates Value Contribution to Hair Care16

831
1,080
1,311
1,474 1,5021,576
1,6391,743
1,321
0
200
400
600
800
1,000
1,200
1,400
1,600
1,800
2,000
10-11 11-12 12-13 13-14 14-15 15-16 16-17 17-18 YTD
Nov'18
22.4
26.8
30.031.9 31.3 32.2 33.1
34.9
26.5
0.0
5.0
10.0
15.0
20.0
25.0
30.0
35.0
40.0
10-11 11-12 12-13 13-14 14-15 15-16 16-17 17-18 YTD
Nov'18
Hair Oil Market in IndiaOverall Hair Oil Market – Volume Overall Oil Market – Value
Light Hair Oil – Volume Light Hair Oil – Value
Hair Oils category shows Vol & Val growth at a YTD Nov 18 level. LHO segment also shows Val & Vol growth.
Source: Nielsen Retail Audit Report, Nov 2018
(In ‘
000 K
Ltr
)
(Rs.
Cr.
)
(In ‘
000 K
Ltr
)
(Rs.
Cr.
)
Gro
wth
7.4
%
Gro
wth
3.9
%
Gro
wth
-0
.2%
Gro
wth
-5
.3%
Gro
wth
8.7
%
Gro
wth
3.9
%
Gro
wth
5.7
%
Gro
wth
8.2
%
Gro
wth
10.3
%
Gro
wth
12.7
%G
row
th
21.4
%
Gro
wth
4.9
%
Gro
wth
1.9
%
Gro
wth
4.0
%
Gro
wth
12.5
%
Gro
wth
2.9
%
Gro
wth
2.7
%
Gro
wth
-1
.9%
Gro
wth
6.6
%
Gro
wth
11.9
%
Gro
wth
8.4
%
Gro
wth
10.9
%
Gro
wth
5.5
%
Gro
wth
6.4
%
Gro
wth
17.5
%
Gro
wth
14.9
%
Gro
wth
14.9
%
Gro
wth
1.8
%
Gro
wth
1.2
%
Gro
wth
21.9
%
Gro
wth
19.5
%
Gro
wth
30.0
%
17
236 238 247269
255 254 264283
206
0
50
100
150
200
250
300
10-11 11-12 12-13 13-14 14-15 15-16 16-17 17-18 YTD
Nov'18
5,728
6,9817,867
8,6769,390
9,928 10,103
11,200
8,746
0
2,000
4,000
6,000
8,000
10,000
12,000
10-11 11-12 12-13 13-14 14-15 15-16 16-17 17-18 YTD
Nov'18

441
594
746
861906
962 9941,069
829
0
200
400
600
800
1,000
1,200
10-11 11-12 12-13 13-14 14-15 15-16 16-17 17-18 YTD
Nov'18
11.0
13.9
16.318.1 18.1 18.8 19.2
20.5
16.0
0.0
5.0
10.0
15.0
20.0
25.0
10-11 11-12 12-13 13-14 14-15 15-16 16-17 17-18 YTD
Nov'18
Light Hair Oil Market in India
Almond Drops Hair Oil Market - Volume Almond Drops Hair Oil Market - Value
Bajaj Almond Drops shows growth in both volume & value at a YTD Nov 18 level
(Rs.
Cr.
)
Light Hair Oil – Volume Light Hair Oil – Value
(In ‘
000 K
Ltr
)
Gro
wth
3
.4 %
Gro
wth
6.1
%
Gro
wth
5
.3 %
Gro
wth
1
5.3
%
Gro
wth
2
5.6
%
Gro
wth
2
.3%
Gro
wth
3.5
%
Gro
wth
0.3
%
Gro
wth
10.9
%
Gro
wth
7
.1%
Gro
wth
7
.5 %
Gro
wth
17.3
%
Gro
wth
1
8.6
%
Gro
wth
1
8.4
%
Gro
wth
26.2
%
Gro
wth
3
4.8
%Source: Nielsen Retail Audit Report, Nov 2018
18
22.4
26.8
30.031.9 31.3 32.2 33.1
34.9
26.5
0.0
5.0
10.0
15.0
20.0
25.0
30.0
35.0
40.0
10-11 11-12 12-13 13-14 14-15 15-16 16-17 17-18 YTD
Nov'18
(In ‘
000 K
Ltr
)
Gro
wth
2.9
%
Gro
wth
2.7
%
Gro
wth
-1
.9%
Gro
wth
6.6
%
Gro
wth
11.9
%
Gro
wth
5.5
%
Gro
wth
14.9
%
Gro
wth
19.5
% 831
1,080
1,311
1,474 1,5021,576
1,6391,743
1,321
0
200
400
600
800
1,000
1,200
1,400
1,600
1,800
2,000
10-11 11-12 12-13 13-14 14-15 15-16 16-17 17-18 YTD
Nov'18
(Rs.
Cr.
)
Gro
wth
21.4
%
Gro
wth
4.9
%
Gro
wth
1.9
%
Gro
wth
4.0
%
Gro
wth
12.5
%
Gro
wth
6.4
%
Gro
wth
14.9
%
Gro
wth
30.0
%

Market Shares Trends in Light Hair Oil Category(All India - Urban Plus Rural)
Volume MS Value MS
Source: Nielsen Retail Audit Report, Nov 2018
19
Dominance in LHO Category continues…Highest ever val and vol shares
48.0% 49.1%51.9%
54.4%56.6%
57.8% 58.3% 58.0% 58.8% 58.4%60.0%
0.0%
10.0%
20.0%
30.0%
40.0%
50.0%
60.0%
70.0%
09-10 10-11 11-12 12-13 13-14 14-15 15-16 16-17 17-18 MAT
Nov 17
MAT
Nov 18
50.7%53.0%
55.0%56.9%
58.4%60.3% 61.0% 60.7% 61.3% 60.9%
62.4%
0.0%
10.0%
20.0%
30.0%
40.0%
50.0%
60.0%
70.0%
09-10 10-11 11-12 12-13 13-14 14-15 15-16 16-17 17-18 MAT
Nov 17
MAT
Nov 18

Market Shares Trends in Total Hair Oil Category (All India - Urban Plus Rural)
Volume MS Value MS
At MAT level, ADHO has increased Vol MS and has remained constant in Val MS
Source: Nielsen Retail Audit Report, Nov 2018
20
4.5%4.7%
5.8%
6.6% 6.7%7.1%
7.4% 7.3% 7.3% 7.2%
7.7%
0.0%
1.0%
2.0%
3.0%
4.0%
5.0%
6.0%
7.0%
8.0%
9.0%
09-10 10-11 11-12 12-13 13-14 14-15 15-16 16-17 17-18 MAT
Nov 17
MAT
Nov 18
7.1%
7.7%
8.5%
9.5%9.9%
9.7% 9.7% 9.8%9.5% 9.6% 9.6%
0.0%
2.0%
4.0%
6.0%
8.0%
10.0%
12.0%
09-10 10-11 11-12 12-13 13-14 14-15 15-16 16-17 17-18 MAT
Nov 17
MAT
Nov 18

Anti Marks Category Growth
23.4
10.47.9
15.118.4
45.2
29.7
0.1
32.5
49.0
0.0
10.0
20.0
30.0
40.0
50.0
60.0
Q3'17-18 Q4'17-18 Q1'18-19 Q2'18-19 Oct-Nov'18
Q-o-Q Gr Val (All India)
Antimarks (Only Women) NOMARKS
8.3
-5.6-1.6 0.4
25.2
84.9
58.0
3.4
36.5
55.1
-20.0
0.0
20.0
40.0
60.0
80.0
100.0
Q3'17-18 Q4'17-18 Q1'18-19 Q2'18-19 Oct-Nov'18
Q-o-Q Gr Val (UP)
Antimarks (Only Women) NOMARKS
• Category Growth has been revived in Q3 . Nomarks growth is 2x that of
Category.
21
Source: Nielsen Retail Audit Report, Nov 2018
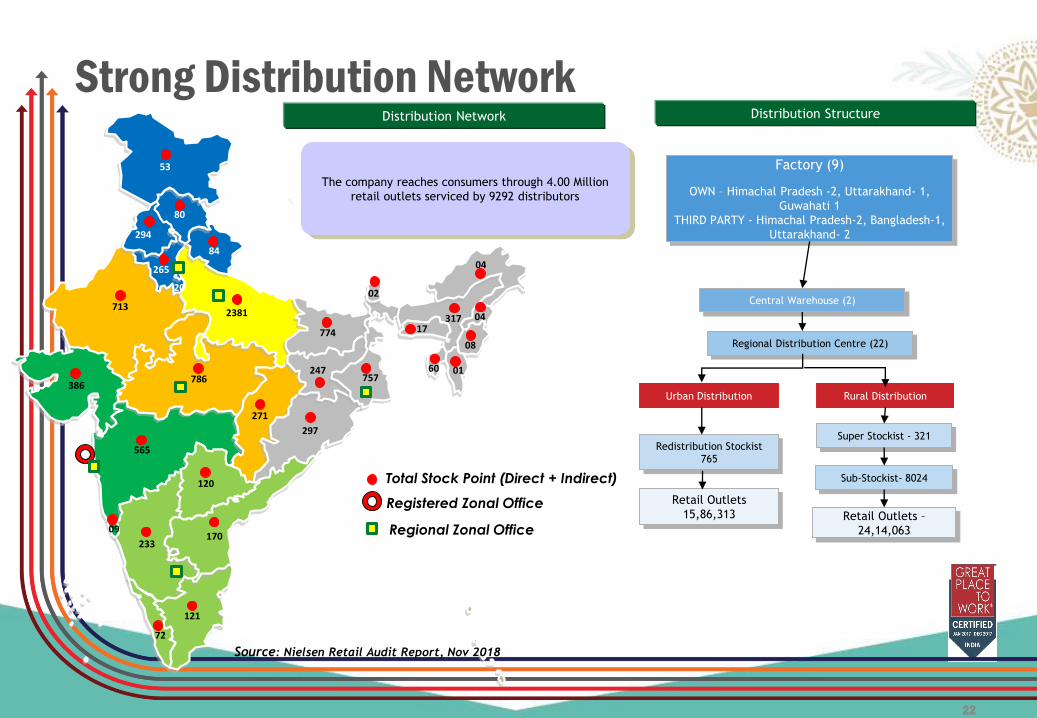
Factory (9)
OWN – Himachal Pradesh -2, Uttarakhand- 1,
Guwahati 1
THIRD PARTY - Himachal Pradesh-2, Bangladesh-1,
Uttarakhand- 2
Central Warehouse (2)
Regional Distribution Centre (22)
Urban Distribution Rural Distribution
Redistribution Stockist
765
Retail Outlets
15,86,313
Super Stockist - 321
Sub-Stockist- 8024
Retail Outlets –
24,14,063
Distribution Network Distribution Structure
The company reaches consumers through 4.00 Million
retail outlets serviced by 9292 distributors
757
774
247
297
294
84
265
20
2381713
786
271
120
53
80
386
565
170233
121
72
04
317
08
1704
02
60
Total Stock Point (Direct + Indirect)
Registered Zonal Office
Regional Zonal Office
01
09
Strong Distribution Network
22
Source: Nielsen Retail Audit Report, Nov 2018

ORGANISATION STRUCTURE

24
Kushagra Nayan BajajChairman
He has been Vice Chairman of Bajaj Hindustan Ltd. Since April 30, 2011 and as its Joint Managing Director since April 24, 2007. He is
also the promoter of the company. Mr. Bajaj served as the Chief Executive Officer of Bajaj Hindustan Ltd., since August 20, 2006. Mr.
Bajaj serves as Chairman of the Board of Bajaj Corp. Limited. He holds a Bachelor of Science degree in Economics, Political Philosophy
and Finance from Carnegie Mellon, Pittsburgh, USA and has a Masters Degree of Science in Marketing and finance from Northwestern
University, Chicago, USA.
Sumit MalhotraManaging Director
He has been appointed as Managing Director of the company with effect from August 08, 2011. He holds a bachelors degree in
pharmacy from IIT - Benaras Hindu University, Varanasi and a PGDBM from IIM - Ahmedabad. He has over 31 years of experience in
the FMCG sector. He joined the Company on April 1, 2008 and is responsible for overall management of the Company. Prior to joining
the company he was President, Sales & Marketing of BCCL since 2004.
Management Board

Management Committee
Sandeep VermaPresident – Sales,Marketing and R&D
Joined BCL on Jan 2016. Sandeep is a Mechanical Engineer from NIT- Allahabad and a PGDBM from IIM – Lucknow. Prior to joining
BCL, he has worked for 15 years in HUL/Unilever across various roles in Sales, Strategy and Marketing.
Dilip Kumar MalooChief Financial Officer
Joined Bajaj Group on April 1991. He is a qualified CA & CS professional having more than 30 years of experience across Finance,
Accounts, Taxation & Secretarial. He has worked in different departments such as Procurement, Operations, Supply chain and project
management.
25

Management Committee
Devendra JainHead - Supply Chain and Procurement
Joined BCL on Nov 2015. He is a Civil Engineer & MBA
and has 15 years of experience in organizations like
GSK, Johnson & Johnson. & Dabur
Rajat GhoshHead - Sales
Joined BCL on April 2016. He is a PGDBM from IMT,
Ghaziabad and has 21 years of experience in
organizations like Dabur and Britannia
Abhishek PrasadHead - Marketing
Joined BCL on May 2018. He holds a MBA from FMS,
Delhi and has 20 years of experience in organizations like
Reckitt Benkiser, Kraft Heinz & Pidilite.
Dipankar GhoshAssistant Vice President - Human Resources
Joined BCL on Aug 2018. He is Fullbright Fellow and
holds a MBA from Jadavpur University and has 20+
years of experience in organizations like Diageo & Tata
Motors.
26
Dr. Rajan RaghavachariHead – R&D
Joined BCL on Feb 2017. He holds a Ph.D. in Chemical
Engineering from IISc, Bangalore and has 19 years of R&D
leadership in consumer products, Home Care and
Personal Care products mostly working in UNILEVER/ HUL
Ravi NagarHead - International Business
Joined BCL on May 2018. Ravi is a Textile Engineer and a
PGDM from XIM - Bhubaneswar. He has got 16+ years of
rich and diverse FMCG experience. Prior to joining Bajaj,
he was associated with Godrej Consumer Products
Limited as Head-SAARC Businessresponsible for
managing all functions and categories spread across
Bangladesh, Sri Lanka, Nepal, Pakistan & Myanmar.

Management Committee
Dharmesh SanghaviGeneral Manager - IT
Joined BCL on Sep 2012. He is a computer Engineer
and a diploma in Business Management from ICFAI
University, Dehradun and has 14 years of experience in
organizations like Yash Birla Group & The Loot India (P)
Ltd
Makarand KarnatakiHead - Legal
Joined BCL in Sep 2017. Makarand is Commerce and
Law Graduate from Mumbai University and also a
member of Institute of Company Secretaries of India.
He has 20 years of experience and worked with
organizations like Colgate-Palmolive (India) Ltd. &
Godrej Agrovet Ltd.
27
Ankit ChudiwalaHead - Internal Audit
Joined BCL in Feb 2017. He is a qualified Chartered
Accountant (ICAI), Company Secretary (ICSI) and L.L.B
(Government Law College, Mumbai), with 15 years of
core experience in Internal Audit, Risk Management,
Financial Controlling and Managerial Finance. He has
previously worked with L’Oréal and Ernst & Young in
multiple geographies across the globe
Naresh GehlaudHead - Operations
Joined BCL on May 2018. He is an Electrical Engineer
and a MBA in Marketing and has 23+ years of
experience in organizations like Emami & Marico.

Financials

Financial Information
Summary Income Statement Summary Balance Sheet
(Rs. In Crore)(Rs. In Crore)
✓ Overall Company Sales Value growth 12.50% (Q-Q)
✓ Increase in EBITDA by 4.75% (Q-Q) now increased to Rs. 72.39 Cr (32.61%) from Rs. 69.10 Cr (35.02%).
✓ PAT is increased by 8.94% now increased to Rs. 60.09 Cr (27.07%) from Rs.55.16 Cr (27.96%).
29
ParticularsQ3 FY19 Q3 FY18 9M FY 19 9M FY 18
(Rs. In Crore)
Sales (Net) 221.98 197.32 642.68 597.40
Other Operating Income
7.59 10.73 21.02 12.21
EBITDA 72.39 69.10 204.80 190.60
EBITDA Margin 32.61% 35.02% 31.87% 31.90%
Profit Before Tax(PBT) 76.60 70.15 210.97 204.52
Net Profit after Tax 60.09 55.16 165.51 160.86
Net Profit Margin 27.07% 27.96% 25.75% 26.93%
Particulars As on
31.12.2018As on
31.03.2018(Rs. In Crore)
Shareholders Equity 672.55 505.36
Net Fixed Assets 56.97 57.10
Investments
(including Bank FDs, Bank CDs and Government Securities & Bonds) 561.77 443.74
Net Current Assets 53.81 4.52
Note: 1. Other Operating Income includes GST Refund (Budgetary Support) of Rs.7.03Cr in Q3FY19 (In Q3FY18 Rs.10.25 Cr)
2. In Q3 FY18 GST Refund of Rs. 10.25 Cr includes GST Refund of Rs. 5.2 Cr pertaining to Q2FY18, it was recognized in Q3 because
notification was issued by GST authorities in Q3FY18 detailed impact of the same is given in next slide.
30
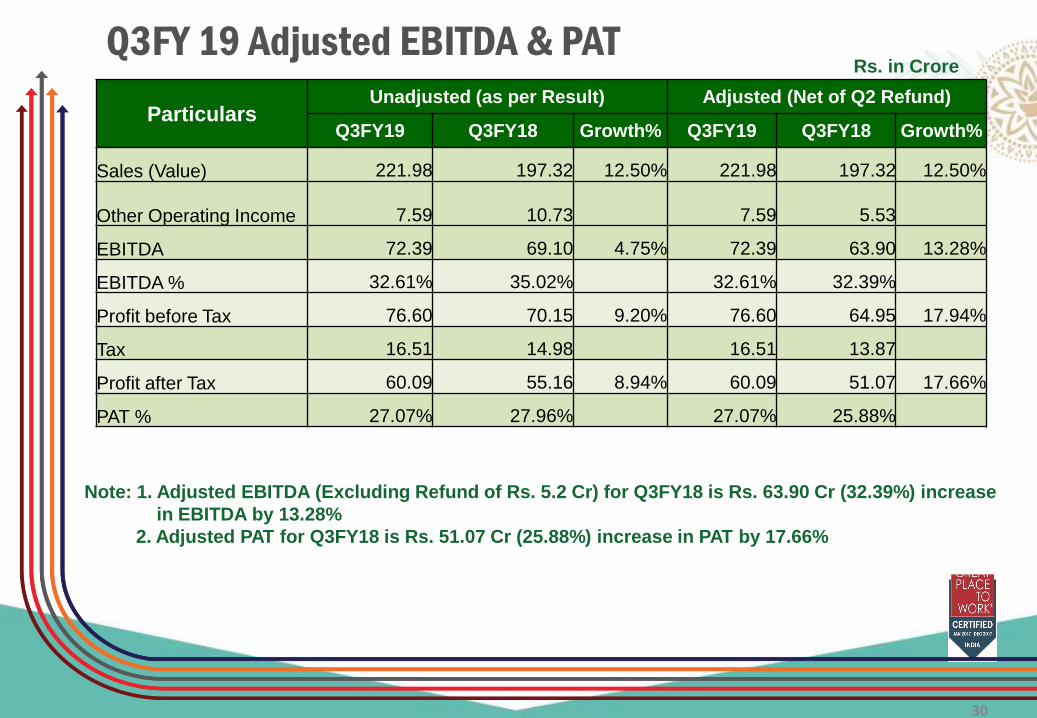
Rs. in CroreQ3FY 19 Adjusted EBITDA & PAT
ParticularsUnadjusted (as per Result) Adjusted (Net of Q2 Refund)
Q3FY19 Q3FY18 Growth% Q3FY19 Q3FY18 Growth%
Sales (Value) 221.98 197.32 12.50% 221.98 197.32 12.50%
Other Operating Income 7.59 10.73 7.59 5.53
EBITDA 72.39 69.10 4.75% 72.39 63.90 13.28%
EBITDA % 32.61% 35.02% 32.61% 32.39%
Profit before Tax 76.60 70.15 9.20% 76.60 64.95 17.94%
Tax 16.51 14.98 16.51 13.87
Profit after Tax 60.09 55.16 8.94% 60.09 51.07 17.66%
PAT % 27.07% 27.96% 27.07% 25.88%
Note: 1. Adjusted EBITDA (Excluding Refund of Rs. 5.2 Cr) for Q3FY18 is Rs. 63.90 Cr (32.39%) increase
in EBITDA by 13.28%
2. Adjusted PAT for Q3FY18 is Rs. 51.07 Cr (25.88%) increase in PAT by 17.66%

Rs. in CroreProfit & Loss Quarter ended Dec 31,2018
✓ Sales increased by 12.50% in Q3FY19 (Q-Q)
✓ Increase in EBITDA by 13.28% (Q-Q) in Q3FY19
31
Particulars Q3 FY19 Q3 FY18 (Adjusted) YoY%Net Sales 221.98 197.32 12.50%Other Operating Income 7.59 5.53 Total Operating Income 229.57 202.85
Material Cost 74.81 64.39% of Sales 33.70% 32.63%
Employees Cost 24.04 19.26% of Sales 10.83% 9.76%Advertisement & Sales Prom. 37.02 32.65% of Sales 16.68% 16.55%Other Expenses 21.31 22.65% of Sales 9.60% 11.48%EBITDA 72.39 63.90 13.28%% of Sales 32.61% 32.38%Other Income 7.38 4.48Finance Cost 0.09 0.27Depreciation 1.72 1.90Corporate Social Responsibility 1.36 1.26Profit Before Tax(PBT) 76.60 64.95 17.94%Tax Expenses 16.51 13.87 Profit After Tax(PAT) 60.09 51.07 17.66%% of Sales 27.07% 25.88%Other Comprehensive Income (net of tax) - -Total Comprehensive Income (net of tax) 60.09 51.07 17.66%Basic & Diluted EPS (Rs.) 4.07 3.47

Rs. in CroreProfit & Loss 9M ended Dec 31, 2018 (9M FY19)
✓ Sales increased by 7.58% in 9MFY19
✓ Increase in EBITDA by 7.45% in 9MFY19
32
Particulars 9M FY 19 9M FY 18 YoY%Net Sales 642.68 597.40 7.58%Other Operating Income 21.02 12.21 Total Operating Income 663.70 609.61
Material Cost 218.24 200.54 % of Sales 33.96% 33.57%
Employees Cost 70.18 55.52% of Sales 10.92% 9.29%Advertisement & Sales Prom. 99.23 89.19 % of Sales 15.44% 14.93%Other Expenses 71.25 73.76 % of Sales 11.09% 12.35%EBITDA 204.80 190.60 7.45%% of Sales 31.87% 31.90%Other Income 15.67 23.49Finance Cost 0.56 0.78Depreciation 4.86 5.02Corporate Social Responsibility 4.08 3.77Profit Before Tax(PBT) 210.97 204.52 3.16%Tax Expenses 45.46 43.66 Profit After Tax(PAT) 165.51 160.86 2.89%% of Sales 25.75% 26.93%Other Comprehensive Income (net of tax) -0.07 0.05 Total Comprehensive Income (net of tax) 165.44 160.90 2.82%Basic & Diluted EPS (Rs.) 11.22 10.91

Sales Value Growth Q3 FY19
33
Sales VerticalQ3FY19
Salience %
Growth
Q3FY19
General Trade84.82% 10.33%
Modern Trade8.16% 27.87%
Total Domestic ( Excluding CSD)92.98% 11.68%
Canteen Stores Department4.14% 35.27%
Total Domestic 97.12% 12.51%
International Business 2.88% 11.84%
Total for the Company 100.00% 12.50%

Sales Value Growth 9M FY19
Note: The Growth number for the company post GST period has been arrived at after adjusting GST impact. 34
Sales Vertical9MFY19
Salience %
Growth
9MFY19
General Trade 87.35% 9.88%
Modern Trade 7.77% 28.37%
Total Domestic ( Excluding CSD)95.12% 11.18%
Canteen Stores Department 2.87% -14.14%
Total Domestic 97.98% 10.23%
International Business 2.02% -34.05%
Total for the Company 100.00% 8.76%

Sales Volume Growth Q3 FY19
35
Sales VerticalQ3FY19
Salience %
Growth
Q3FY19
General Trade 85.12% 5.15%
Modern Trade 7.17% 21.79%
Total Domestic ( Excluding CSD) 92.29% 6.28%
Canteen Stores Department 4.52% 34.25%
Total Domestic 96.80% 7.33%
International Business 3.20% -2.05%
Total for the Company 100.00% 7.00%

Sales Volume Growth 9M FY19
36
Sales Vertical9MFY19
Salience %
Growth
9MFY19
General Trade 87.86% 6.05%
Modern Trade 6.76% 21.38%
Total Domestic ( Excluding CSD)94.63% 7.01%
Canteen Stores Department 3.18% -14.27%
Total Domestic 97.80% 6.16%
International Business 2.20% -43.59%
Total for the Company 100.00% 4.14%
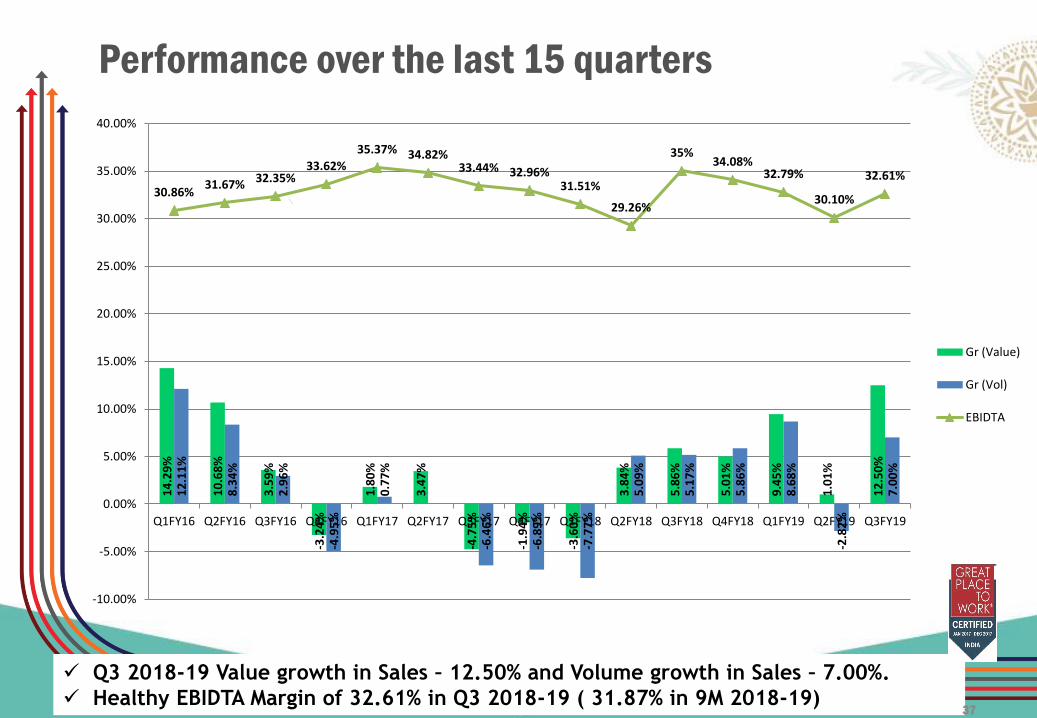
Performance over the last 15 quarters
✓ Q3 2018-19 Value growth in Sales – 12.50% and Volume growth in Sales – 7.00%.
✓ Healthy EBIDTA Margin of 32.61% in Q3 2018-19 ( 31.87% in 9M 2018-19)37
14
.29
%
10
.68
%
3.5
9%
-3.2
4%
1.8
0%
3.4
7%
-4.7
5%
-1.9
4%
-3.6
0%
3.8
4%
5.8
6%
5.0
1%
9.4
5%
1.0
1%
12
.50
%
12
.11
%
8.3
4%
2.9
6%
-4.9
5%
0.7
7%
-6.4
6%
-6.8
9%
-7.7
7%
5.0
9%
5.1
7%
5.8
6%
8.6
8%
-2.8
2%
7.0
0%
30.86%31.67% 32.35%
33.62%
35.37% 34.82%33.44% 32.96%
31.51%
29.26%
35%34.08%
32.79%
30.10%
32.61%
-10.00%
-5.00%
0.00%
5.00%
10.00%
15.00%
20.00%
25.00%
30.00%
35.00%
40.00%
Q1FY16 Q2FY16 Q3FY16 Q4FY16 Q1FY17 Q2FY17 Q3FY17 Q4FY17 Q1FY18 Q2FY18 Q3FY18 Q4FY18 Q1FY19 Q2FY19 Q3FY19
Gr (Value)
Gr (Vol)
EBIDTA

✓ The adjusted landed cost (Net of input credit) of LLP during the quarter is increased to
Rs.63.65/Kg from Rs. 52.81/Kg of corresponding quarter.
✓ The adjusted landed cost (Net of input credit) of Refined Oil during the quarter is increased
to Rs. 86.46/Kg from Rs. 76.69/Kg of corresponding quarter.
Change in Prices of Key Ingredients
38
61.22 59.80 73.93 71.86
0
20
40
60
80
100
Qtr3 FY18 vs FY19 9M FY18 vs FY19
Am
ou
nt
(Rs
.)
Per Kg Rates of LLP
80.52 77.2390.79 88.35
0
20
40
60
80
100
Qtr3 FY18 vs FY19 9M FY18 vs FY19
Am
ou
nt
(Rs
.)
Per Kg Rates of Oil

YearNo. of Shares
(in Lacs)
Face
Value
Dividend
Payout
(Rs in Lacs)
% to Capital
Dividend per
share
(Rs.)
2018-19 1,475 1 20,650.00 1400% 14.00
2017-18 1,475 1 17,700.00 1200% 12.00
2016-17 1,475 1 16,962.50 1150% 11.50
2015-16 1,475 1 16,962.50 1150% 11.50
2014-15 1,475 1 16,962.50 1150% 11.50
2013-14 1,475 1 9,587.50 650% 6.50
2012-13 1,475 1 9,587.50 650% 6.50
2011-12 1,475 1 5,900.00 400% 4.00
2010-11 295 5 2,802.50 190% 9.50
39
Dividend Payout History

For More Information
For more information & updates
Contact:
Kushal Maheshwari
• Please Visit www.bajajcorp.com
40


