33
BAJAJ FINSERV LIMITED Investor Presentation – Q1 FY19* * Financial year 2018-19

BAJAJ FINSERV LIMITEDInvestor Presentation – Q1 FY19*
* Financial year 2018-19
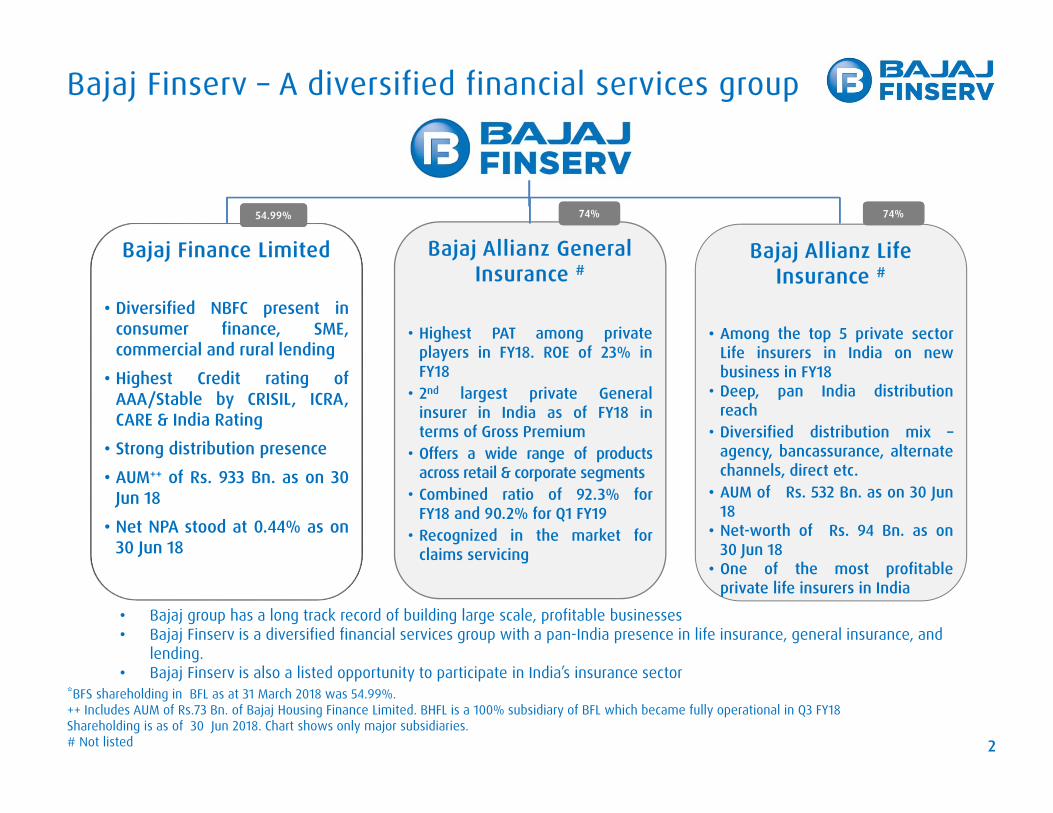
Bajaj Finance Limited
• Diversified NBFC present inconsumer finance, SME,commercial and rural lending
• Highest Credit rating ofAAA/Stable by CRISIL, ICRA,CARE & India Rating
• Strong distribution presence
• AUM++ of Rs. 933 Bn. as on 30Jun 18
• Net NPA stood at 0.44% as on30 Jun 18
Bajaj Finserv – A diversified financial services group
2
*BFS shareholding in BFL as at 31 March 2018 was 54.99%. ++ Includes AUM of Rs.73 Bn. of Bajaj Housing Finance Limited. BHFL is a 100% subsidiary of BFL which became fully operational in Q3 FY18Shareholding is as of 30 Jun 2018. Chart shows only major subsidiaries. # Not listed
54.99%54.99%
• Bajaj group has a long track record of building large scale, profitable businesses• Bajaj Finserv is a diversified financial services group with a pan-India presence in life insurance, general insurance, and
lending.• Bajaj Finserv is also a listed opportunity to participate in India’s insurance sector
Bajaj Allianz General Insurance #
• Highest PAT among privateplayers in FY18. ROE of 23% inFY18
• 2nd largest private Generalinsurer in India as of FY18 interms of Gross Premium
• Offers a wide range of productsacross retail & corporate segments
• Combined ratio of 92.3% forFY18 and 90.2% for Q1 FY19
• Recognized in the market forclaims servicing
Bajaj Allianz Life Insurance #
• Among the top 5 private sectorLife insurers in India on newbusiness in FY18
• Deep, pan India distributionreach
• Diversified distribution mix –agency, bancassurance, alternatechannels, direct etc.
• AUM of Rs. 532 Bn. as on 30 Jun18
• Net-worth of Rs. 94 Bn. as on30 Jun 18
• One of the most profitableprivate life insurers in India
74%74% 74%74%

Adoption of Ind AS Accounting standards
• Bajaj Finserv has adopted Indian Accounting Standards (Ind AS) with effect from 1st April 2018
• Insurance companies’ stand-alone numbers are as per Indian GAAP as Ind AS is not applicable to them. However, for consolidation purposes, they have provided Ind AS compliant financial statements
• Consolidated figures for Q1 FY 19 are compliant with Ind AS
• Corresponding figures for FY 18 (Q1 and FY) have been restated to be compliant with Ind AS
• Figures in the business presentation of insurance companies are based on their stand alone numbers
3

All Figures in Rs Million
Profit before Tax(Consolidated)
19,90319,903
12,59112,591
58%
87,71187,711
Total Revenue(Consolidated)
75,35675,356
PAT(Consolidated)
8,2588,258
5,8455,845
41%
Net Worth (Standalone)
28,85828,858
27,69927,699
4%16%
Performance Highlights of Q1 FY19 over Q1 FY18 (Ind AS)
Bajaj Finserv performance highlights
4
CY
• Bajaj Finserv remains a debt free company. Bajaj Finserv’s surplus funds stood at Rs. 6.6 Bn as on30 Jun 2018 (Rs. 5.7 Bn as on 30 Jun 2017)
• Consolidated Net Worth stood at Rs. 209 billion (Rs. 167 Bn as on 30 Jun 2017) and ConsolidatedBook Value Per Share at Rs. 1,315 ( Rs.1,051 as on 30 Jun 2017)
PY

4,597
8,258Bajaj Finserv
-Consolidated
Consolidated profit components for Q1 FY19 (Ind AS)
Bajaj Finance
General Insurance
Life Insurance
Others
Bajaj Finserv-Standalone
2,249
1,352
-
60
-
Intercompany adjustments
Consolidated profit components for Q1 FY18 (Ind AS)
Bajaj Finance
General Insurance
Life Insurance
Others
1,541
1,599
1
-
Intercompany adjustments
All Figures in Rs Million
Consolidated profit components
5
5,845Bajaj Finserv
-Consolidated
Bajaj Finserv-Standalone
40
2,664

All Figures in Rs Million
BAGIC Q1 FY19 Q1 FY18 Growth
GWP 24,294 19,732 23%
Investments 149,732 116,867 28%
PAT 2,911 2,133 36%
BALIC Q1 FY19 Q1 FY18 Growth
GWP 13,614 11,536 18%
Investments 532,192 499,982 6%
PAT 1,462 1,964 -26%
BAJAJ FINANCE$# Q1 FY19 Q1 FY18 Growth
AUM 933,139 689,454 35%
Total Income 39,413 28,339 39%
PAT 8,359 4,609 81%
Highlights of Group Companies BAJAJ FINSERV$ Q1 FY19 Q1 FY18 Growth
Total Revenue 87,711 75,356 16%
Net worth (Cons) 209,196 167,203 25%
PAT 8,258 5,845 41%
*Others includes Bajaj Finserv Standalone, and all remaining components.
Q1 FY19 Highlights
6
#Consolidated | $ Ind AS
Bajaj Finserv and Bajaj Finance figures are as per Ind AS
BAGIC and BALIC figures are as per IRDAI & the Indian Accounting Standard framework
$ Ind AS
48% 46% 56%
26% 26%27%
20% 27% 16%5% 1% 1%
2017-18 Q1 FY 17-18 Q1 FY 18-19
Consolidated Profit Components *
BFL BAGIC BALIC Others

Bajaj Finance Limited
7

Bajaj Finance - Overview
8
Business Construct
Non-bank with strategy & structure of a bank with consistent track record
of profitability
Focused on mass affluent & above clients with strong cross sell orientation
Diversified financial services strategy seeks to optimise risk and profit to
deliver a sustainable business model
Business construct is to deliver a superior ROE and ROA
Focused on continuous innovation to transform customer experience to
create growth opportunities

Bajaj Finance – Overview
9
DIFFERENTIATORS
Part of the Bajaj Group – one of the oldest & most respected
business houses
Strong focus on cross selling assets, insurance and wealth products to existing customer
Highly agile and innovative
Focus on mass affluent and above customers
Diversified lending strategy
Deep investment in technology and analytics
A trusted brand with strong brand equity
Overall franchise of 28.28 Mn. and Cross sell client base of 16.55 Mn.
Centre of Excellence for each business vertical to bring efficiencies across businesses and improve cross sell opportunity
Continuous improvement in features of products & timely transitions to maintain competitive edge
AUM mix for Consumer : Rural : SME : Commercial : Mortgage stood at 39% : 7% : 13% : 13% : 28%
Has helped establish a highly metricised company and manage risk & controllership effectively

Bajaj Finance’s businesses
10
BAJAJ FINANCE
Consumer SME Commercial Rural
• Largest consumer electronics, digital products & furniture lender in India
• Presence in 793 locations with 59,000+ active points of sale
• Amongst the largest personal loan lenders
• EMI (Existing Member Identification) Card franchise of over 14.2 Mn (incl. EMI & Virtual EMI cards)
• Among the largest new loans acquirers in India (5.63 Mn in Q1 FY19, 15.32 Mn in FY18)
• Bajaj Finserv – Mobikwikactive wallet users stood at 2.2 Mn as on 30 June 2018 who have linked EMI card to wallet
• Focused on affluent SMEs with an average annual sales of around Rs. 10-12 Crores with established financials & demonstrated borrowing track records
• Offer a range of working capital & growth capital products and mortgage (Loan against property, Lease Rental Discounting & Home Loans) products to SME & self employed professionals
• Relationship management approach to cross sell
• Wholesale Lending products covering short, medium and long term financing needs of selected sectors viz. Auto component and
ancillary manufacturers
Light engineering vendors
Financial institutions• Structured products
collateralized bymarketable securities ormortgage
• Unique hub-and-spoke model in 693 locations and retail presence across 10,100+ points of sale
• Diversified rural lending model with 9 product lines for consumer and MSME segments

Bajaj Finance – Q1 highlights
Performance Highlights of Q1 FY19 over Q1 FY18 (Ind AS)
8,3598,359
Profit After TaxTotal Income
4,6094,609
39,41339,413
28,33928,339
81%39%
All Figures in Rs Million
Return on Assets(Non-annualized)
1%1%
0.8%0.8%
899,037899,037
Book Size
ROE(Non-annualized)
651,837651,837
5.2%5.2%
5.0%5.0%
38%
• Borrowing mix is not excessively dependenton banks. (Mix of 30 : 61 : 9 between banks,money markets and deposits as of 30 Jun2018)
• Capital Adequacy stands at 23.04% as of30 Jun 2018
CY
PY
CY
PY
11

81,503
17,610 25,777
FY18 Q1 FY18 Q1 FY19
Net Interest Income
127,719
28,339 39,413
FY18 Q1 FY18 Q1 FY19
Total Income
808,158
651,837
899,037
FY18 Q1 FY18 Q1 FY19
Book Size
Bajaj Finance has clocked healthy growth in revenues All Figures in Rs Million
12
Q1 FY19 Increase by 46%Q1 FY19 Increase by 46%
Q1 FY19 Increase by 39%Q1 FY19 Increase by 39%
Q1 FY19 Increase by 38%Q1 FY19 Increase by 38%

24,963
4,609 8,359
FY18 Q1 FY18 Q1 FY19
PAT
Portfolio quality continues to be good, operating costs remain under control with profitability All Figures in Rs Million
13
10,349
3,051
3,268
0.38%0.53%
0.44%
0.0%
2.0%
01,0002,0003,0004,0005,0006,0007,0008,0009,000
10,00011,000
FY18 Q1 FY18 Q1 FY19
Loss Provision and Net NPA%
Loss Provision (Rs. millions) Net NPA %
Q1 FY19 Increase by 81%Q1 FY19 Increase by 81%
40.1% 42.2%37.0%
FY18 Q1 FY18 Q1 FY19
Operating expenses as a % of NII

Bajaj Allianz General Insurance
14

STRATEGY
Strategy is to focus on retail product lines, with diversified distribution supported by prudent underwriting and strong cash flow generation, while delivering excellence in customer service.
DIFFERENTIATORS
BAGIC - Key Strategic Differentiators
15
Focused on Segmentation
Industry leading combined ratios consistently overtime - BAGIC’s Combined Ratio stood at 92.3% FY18Business construct is to deliver superior ROE
Disruptive innovation In-house Health Administration, GeographicalExpansion through Virtual Points of Sale
Balanced distribution mixMulti channel distribution network with multi-line agents, strong bancassurance network, D2C, etc in retail and corporate segments.
Excellent claims servicing Has a consistent track record of excellence in claimsservicing
Strong selection of Risk & prudent underwriting
“Number 1 in Profits and Number 2 in GWP amongst Private Sector P&C insurers in FY18. Consistent track record of profits since first full year of operations”
Focused on retail segments – mass, mass affluent andHNI while maintaining strong position in institutionalbusiness

Bajaj Allianz General – Q1 highlightsAll Figures in Rs Million
16,12116,121
13,33913,339
24,29424,294
6.3%6.3%
Net Earned PremiumGross Written Premium
21%23%
Net Written Premium
17,30817,308
14,99414,994
15%
2,9112,911
2,1332,133
Profit After Tax
36%
Performance Highlights of Q1 FY19 over Q1 FY18
Ex Crop GWP was Rs. 24,192 Mn in Q1 FY19 (Rs.19,371 Mn Q1 FY18) a growth of 25%
Solvency Ratio was 288% as against regulatory requirement of 150% as of 30 Jun 2018
CY
PY
16
19,73219,732
5.9%5.9%ROE
(Not Annualized)

BAGIC has maintained Combined ratio, below 100% on a sustained basis
17
1. Combined Ratios are in accordance with the Master Circular on ‘Preparation of Financial statements of General Insurance Business’ issued by IRDAeffective from 1 st April, 2013. (Net claims incurred divided by Net Earned Premium) + ( Expenses of management including net Commission divided byNet Written Premium). Pool losses, wherever applicable, include the impact of the erstwhile IMTPIP and Declined Risk Pool.
2. Combined ratio ex Motor Third Party Pool for BAGIC for FY14 was 94.2%.
98.1% 96.7% 99.3% 96.8% 92.3% 95.8%90.2%
FY14 FY15 FY16 FY17 FY18 Q1 FY18 Q1 FY19
Combined Ratios (Including Motor TP Pool Losses)

BAGIC retains its position among top 2 private insurers in terms of Gross Premium
18Source : IRDAI, GDPI : Gross Direct Premium Income | *Private Insurers : Includes Standalone Health Insurers, PSU excludes AIC of India, GIC and ECGC
350 386 425 477 602 678 165 167
297 343 378 439 597
737
164 197
647 729 803 916
1,199 1,415
329 364
FY13 FY14 FY15 FY16 FY17 FY18 Q1 FY18 Q1 FY19
Industry GDPI Trend(Rs. Bn.)
PSU Private Insurers* Industry
Q1 FY19 growth 11%Q1 FY19 growth 11%FY18 growth 18%FY18 growth 18%
45,8
39
53,0
07
59,0
06
76,8
71
94,8
65
19,7
32
24,2
94
34,9
31
38,3
19
42,2
36
49,3
70
60,5
86
13,3
39
16,1
21
FY14 FY15 FY16 FY17 FY18 Q1 FY18 Q1 FY19
BAGIC Premium Trend(Rs. Mn.)
GWP NEP
FY18 GWP growth 23%FY18 GWP growth 23% Q1 FY19 GWP growth 23%Q1 FY19 GWP growth 23%

16,643 22,255
27,897 35,346
44,664 37,385
47,759
FY14 FY15 FY16 FY17 FY18 Q1 FY18 Q1 FY19
BAGIC - Capital Invested - Networth
Net Worth
4,090 5,623 5,642
7,278
9,212
2,133 2,911
FY14 FY15 FY16 FY17 FY18 Q1 FY18 Q1 FY19
PAT
36% increase36% increase
Strong profit growth resulting in high efficiency of capital
19
All Figures in Rs Million
No Capital infusion since FY08No Capital infusion since FY08Accumulated profit* 94% of Net worth as on 30 Jun 2018
Accumulated profit* 94% of Net worth as on 30 Jun 2018
PAT CAGR of 23% between FY14 – FY18
*Accumulated profit includes reserves

BAGIC has a balanced business mix
20
Business mix is retail focused Ex Crop GWP Growth for Q1 FY19 was 25% and for FY18 was 23%
59% 55% 56%46% 44% 50% 44%
5%6% 6%
6% 5%5%
5%
9%6% 6%
7% 9%11% 23%
18%16% 16%
13% 14%
20%18%
8% 6%19% 20%
2%9% 9% 10% 9% 8% 12% 10%
FY14 FY15 FY16 FY17 FY18 Q1 FY18 Q1 FY19
Business Mix
Motor (Retail) Health (Retail) Group Health
Prop, Liability, Engg Agri (Crop Insurance) Others

BAGIC’s Channel Mix : Bancassurance strengthening
21
Focus on Bancassurance channel has yielded results with a growth of over 100% in Q1 FY19 (FY18 growth of 77%)
Agency has delivered a robust growth of 26% in Q1 FY19 (32% in FY18)
40% 36% 32%42% 35%
16% 28% 31% 18% 26%
24%19% 20% 20% 21%
13% 12% 9% 13% 7%
7% 5% 8% 7% 11%
FY16 FY17 FY18 Q1 FY18 Q1 FY19
Channel Mix
Brokers Direct Business Individual Agents Corporate Agents - Others Corporate Agents - Banks

70
79
92
108
148
117
150
FY14 FY15 FY16 FY17 FY18 Q1 FY18 Q1 FY19
AUM(cash and investments) - Rs Billion(as of end of period)
BAGIC’s AUM continues to grow
BAGIC continues to grow its AUM strongly
Investments are largely in fixed income securities
22
FY18 Increase by 37%FY18 Increase by 37%
Q1 FY19 Increase by 28%Q1 FY19 Increase by 28%

Bajaj Allianz Life Insurance
23

• Balance growth with balanced product mix, seeking steady increase in market share.• Business construct is to balance customer value with shareholder returns, focusing on New
Business Value
STRATEGY
DIFFERENTIATORS
BALIC – KEY STRATEGIC DIFFERENTIATORS
24
Sustainable product mix • Balanced product mix between Unit-LinkedInsurance Plans (ULIP)
Financial Inclusion • In terms of lives covered in group schemes BALIC
leads the private sector, with about 30% share oflives covered in FY18
Large Proprietary Agency Force • Large pan-India proprietary agency force 3rd
highest agency premium amongst private players.• Lean support structure
“Consistently among the top 5 private insurers in New Business. Track record of profits since FY10. Highest number of lives covered in the private sector in FY18”
Focused on segmentation • Focused on retail segments – mass, and massaffluent customers

Bajaj Allianz Life – Q1 highlights
Performance Highlights of Q1 FY19 over Q1 FY18
1,4621,462
PAT
Individual Rated NB Renewal Premium
1,9641,964
2,8292,829
2,7812,781
6,4096,409
4,7114,711
532,192532,192
499,982499,982
AUM
-26%
2% 36%
13,61413,614
11,53611,536
Gross Written Premium
18%
All Figures in Rs. Million
770%770%
Solvency Ratio as on 30 Jun 2018 6%
Group NB
4,2474,247
3,9053,905
9%
CY
PY
CY
PY
25

50,165
62,858
50,013
59,084
FY17 FY18 Q1 FY18 Q1 FY19
Regular Premium Ticket Size (Agency)
FY17 FY18 Q1 FY18 Q1 FY19
37,066
45,449 41,026
48,031
FY17 FY18 Q1 FY18 Q1 FY19
Regular Premium Ticket Size
FY17 FY18 Q1 FY18 Q1 FY19
Productivity has improved strongly
All Figures in Rs.
26
Q1 FY19 increase by 17%Q1 FY19 increase by 17% FY18 Increase by 18%FY18 Increase by 18%
Focus on balancing various customer segments for sustainability

Efforts to improve Persistency paying off
27
63% 68%77%
68% 73%
Persistency - 13th Month
Persistency 13th Month
FY16 FY17 FY18 Q1 FY18 Q1 FY19
51% 51%58%
48%58%
Persistency - 25th Month
Persistency 25th Month
FY16 FY17 FY18 Q1 FY18 Q1 FY19
42% 44%49%
39%45%
Persistency - 37th Month
Persistency 37th Month
FY16 FY17 FY18 Q1 FY18 Q1 FY19
Note : Persistency for Q1 FY19 is for Apr’18 to May’18

1,050
1,909
229 509
FY17 FY18 Q1 FY18 Q1 FY19
Institutional Business Individual Rated NB
8,476
11,065
2,406 2,128
FY17 FY18 Q1 FY18 Q1 FY19
Agency Individual Rated NB
10,101 13,972
2,781 2,829
FY17 FY18 Q1 FY18 Q1 FY19
Individual Rated NB
BALIC’s Individual Rated premiumsAll Figures in Rs Million
28
FY18 Increase by 38%FY18 Increase by 38%
Q1 FY19 Increase by 2%Q1 FY19 Increase by 2% Q1 FY19 decrease
12%Q1 FY19 decrease 12%
FY18 Increase by 31%FY18 Increase by 31%
FY18 Increase by 82%FY18 Increase by 82%
Rated individual NB = (100% of first year premium & 10% of single premium excluding group products)
Q1 FY19 Increase by 122%Q1 FY19 Increase by 122%

78%61%
19%35%
3% 5%
Q1 FY18 Q1 FY19
Individual Rated NB Mix (Quarterly)
Individual - Unit Linked Individual - Par Individual - Non Par
Diversified product mix with greater mix of traditional business
29
51%70% 72%
42%25% 24%
7% 5% 4%
FY16 FY17 FY18
Individual Rated NB Product Mix (Annual)
Individual - Unit Linked Individual - Par Individual - Non Par
• During Q1 FY19 and H2 FY18 share of ULIP was lower, in line with BALIC’s focus
• Individual Rated NB product mix is well diversified across par, non par and UL
• Protection Business (Group) new business in Q1 FY19 was Rs. 2,605 Mn (Q1 FY18 Rs.1,938 Mn) a growth of 34% and in FY18 Rs. 9,795 Mn (FY 17 Rs. 8,823 Mn) a growth of 11%.
75% 70%
21% 25%
4% 5%
H1 FY18 H2 FY18
Individual Rated NB Product Mix(H1 FY18 vs H2 FY18)
Individual - Unit Linked Individual - Par Individual - Non Par

BALIC is amongst the most capital efficient private insurers
30
• BALIC’s accumulated profits are 86% of the Net worth as at 30 Jun 2018
• No Capital infused after FY08
*Accumulated profit includes reserves
58,708 67,490
76,315 84,756
92,182 86,715 93,813
FY14 FY15 FY16 FY17 FY18 Q1 FY18 Q1 FY19
Net worth (Rs. Mn.)
388436 441
493 520 500532
FY14 FY15 FY16 FY17 FY18 Q1 FY18 Q1 FY19
AUM (Rs. Bn.) • Q1 FY19 AUM grew by 2% vs AUM as on 31 Mar 2018
• AUM growth of 6% for Q1 FY19 vs Q1 FY18

Assets Under Management are significant
31
AUM as of end of period in Rs Billion
Of the UL Funds of Rs.219 Billion, 59% is equity funds as on 30 Jun 2018
213 217192
214 214 209 219
175
219
249
279306
291313
FY14 FY15 FY16 FY17 FY18 Q1 FY18 Q1 FY19
AUM (Mix)
Unit Linked Other than Unit Linked

DisclaimerThis presentation has been prepared by Bajaj Finserv Limited (the “Company”) solely for your information and for your use. This presentation is forinformation purposes only and should not be deemed to constitute or form part of any offer or invitation or inducement to sell or issue anysecurities, or any solicitation of any offer to purchase or subscribe for, any securities of the Company, nor shall it or any part of it or the fact of itsdistribution form the basis of, or be relied upon in connection with, any contract or commitment therefor. The financial information in thispresentation may have been re-classified and reformatted for the purposes of this presentation. You may also refer to the financial statements ofthe Company available at www.bajajfinserv.in, before making any decision on the basis of this information.This presentation contains statements that may not be based on historical information or facts but that may constitute forward-looking statements.These forward looking statements include descriptions regarding the intent, belief or current expectations of the Company or its directors andofficers with respect to the results of operations and financial condition of the Company. Such forward-looking statements are not guarantees offuture performance and involve risks and uncertainties, and actual results may differ from those in such forward-looking statements as a result ofvarious factors and assumptions which the Company presently believes to be reasonable in light of its operating experience in recent years butthese assumptions may prove to be incorrect. Any opinion, estimate or projection constitutes a judgment as of the date of this presentation, andthere can be no assurance that future results or events will be consistent with any such opinion, estimate or projection. The Company does notundertake to revise any forward-looking statement that may be made from time to time by or on behalf of the Company.No representation, warranty, guarantee or undertaking, express or implied, is or will be made as to, and no reliance should be placed on, theaccuracy, completeness, correctness or fairness of the information, estimates, projections and opinions contained in this presentation. Potentialinvestors must make their own assessment of the relevance, accuracy and adequacy of the information contained in this presentation and mustmake such independent investigation as they may consider necessary or appropriate for such purpose. This presentation does not constitute andshould not be considered as a recommendation by the Company that any investor should subscribe for, purchase or sell any of Company's securities.By viewing this presentation you acknowledge that you will be solely responsible for your own assessment of the market and the market positionof the Company and that you will conduct your own analysis and be solely responsible for forming your own view of the potential futureperformance of the business of the Company. None of the Company, book running lead managers, their affiliates, agents or advisors, the placementagents, promoters or any other persons that may participate in any offering of any securities of the Company shall have any responsibility orliability whatsoever for any loss howsoever arising from this presentation or its contents or otherwise arising in connection therewith.This presentation and its contents are confidential and should not be distributed, published or reproduced, in whole or part, or disclosed byrecipients directly or indirectly to any other person. Viewing this information may not be lawful in certain jurisdictions. In other jurisdictions onlycertain categories of person may be allowed to view this information. Any person who wishes to view this site must first satisfy themselves thatthey are not subject to any local requirements which prohibit or restrict them from doing so. If you are not permitted to view this presentation onthis website or are in any doubt as to whether you are permitted to view these materials, please exit this webpage. In particular, this presentationis not directed at persons located in the United States, Canada Australia or Japan and this presentation is not for publication or distribution orrelease in the United States, Australia, Canada or Japan or in any other country where such distribution may lead to a breach of any law orregulatory requirement. The information contained herein does not constitute or form part of an offer or solicitation of an offer to purchase orsubscribe for securities for sale in the United States, Australia, Canada or Japan or any other jurisdiction where such distribution may lead to abreach of any law or regulatory requirement. The securities referred to herein have not been and will not be registered under the United StatesSecurities Act of 1933, as amended, and may not be offered or sold in the United States or absent registration or an applicable exemption fromregistration. This presentation is not intended to be a prospectus or preliminary placement document or final placement document under theSecurities Exchange Board of India (Issue of Capital and Disclosure Requirements) Regulations, 2009, as amended. 32

Thank You
33


