112
BALANCE OF PAYMENTS BY REGION AUGUST 2006 Special Statistical Publication 11
BALANCE OF PAYMENTSBY REGION
AUGUST2006
Special Statistical Publication 11

DEUTSCHEBUNDESBANKE U R O S Y S T E M
Balance of paymentsby regionAugust 2006
Deutsche Bundesbank
Wilhelm-Epstein-Strasse 14
60431 Frankfurt am Main
Germany
Postal address
Postfach 10 06 02
60006 Frankfurt am Main
Germany
Tel +49 69 9566-1
Fax +49 69 5601071
Telex 41227 within Germany
414431 from abroad
Internet http://www.bundesbank.de
ISBN 3-86558-193-5 (print edition)
ISBN 3-86558-194-3 (internet edition)
Reproduction permitted only if source is
stated.
The Statistical Supplement Balance of pay-
ments statistics, which is augmented annually
by this Special Statistical Publication, is pub-
lished at monthly intervals by the Deutsche
Bundesbank, Frankfurt am Main, by virtue of
section 18 of the Bundesbank Act. It is avail-
able to interested parties free of charge.
Further statistical data, supplementing the
Monthly Report, are to be found in the
following supplements.
Banking statistics monthly
Capital market statistics monthly
Seasonally adjusted
business statistics monthly
Exchange rate statistics quarterly
Selected updated statistics are available on
the internet. For a small fee to cover costs, a
file which is updated monthly and contains
approximately 40,000 time series published
by the Bundesbank can also be obtained on
magnetic tape cassette or on CD-ROM from
the Division for Statistical Information Sys-
tems and Mathematical Methods.
DEUTSCHEBUNDESBANK
Balance of paymentsby regionAugust 2006
Contents I Balance of payments of the
Federal Republic of Germany
1 General survey 1994-2005 6
2 Regional breakdown 2002-2005 8
3 Trade in goods with non-residents 34
4 Trade in services with non-residents 42
5 Factor income 50
6 Current transfers 58
7 Capital transfers 59
8 Financial transactions with non-residents
(a) Total 66
(b) Portfolio investment 74
(c) Other investment 90
II Supplementary data on the
balance of payments
1 Merchanting trade with
non-residents 98
2 Transfers between the Federal
Republic of Germany and the
European Communities in
connection with the EU budget 100
3 Supplementary data on current
and capital transfers 101
III External stocks
1 External position of the Bundesbank
up to end-1998 102
2 External position of the Bundesbank
in European monetary union 102
3 Germany’s international investment
position 103

DEUTSCHEBUNDESBANKE U R O S Y S T E M
Balance of paymentsby regionAugust 2006
IV List of countries as in the regional
breakdown of the balance of
payments 104
Explanatory notes 107
Special Statistical Publications 111

DEUTSCHEBUNDESBANK
Balance of paymentsby regionAugust 2006
Notes
NB
All the figures in the tables are shown in
Deutsche Mark for the period under review
up to the end of 1998, and in euro for the
period from the beginning of 1999.
Changeover to the accrual principle
for interest income
Since the annual revision for the Monthly Re-
port of March 2005, the interest component
of investment income is shown in the current
account in accordance with the accrual prin-
ciple and calculated retroactively to 1971. In
line with IMF and ECB specifications, this
interest income is distributed evenly over the
interest period rather than being initially with-
held and then recorded in the current ac-
count at the time of payment. For details see
the explanatory notes on page 109.
Supplementary tables
In addition to the published data, further in-
formation is available. The following tables,
which contain a more detailed breakdown,
can be supplied separately on request.
Service transactions
Breakdown of residual services
Breakdown of other services
Breakdown of transportation
Factor income
Breakdown of income from direct investment
and interest on loans
Financial transactions
Breakdown of direct investment
Portfolio transactions with individual countries
Abbreviations and symbols
e Estimated
p Provisional
r Revised
... Data available at a later date
. Data unknown, not to be published or
not meaningful
0 Less than 0.5 but more than nil
– Nil
/ No data because the numerical value is
not sufficiently reliable
Discrepancies in the totals are due to round-
ing.
DEUTSCHEBUNDESBANKE U R O S Y S T E M
Balance of paymentsby regionAugust 2006
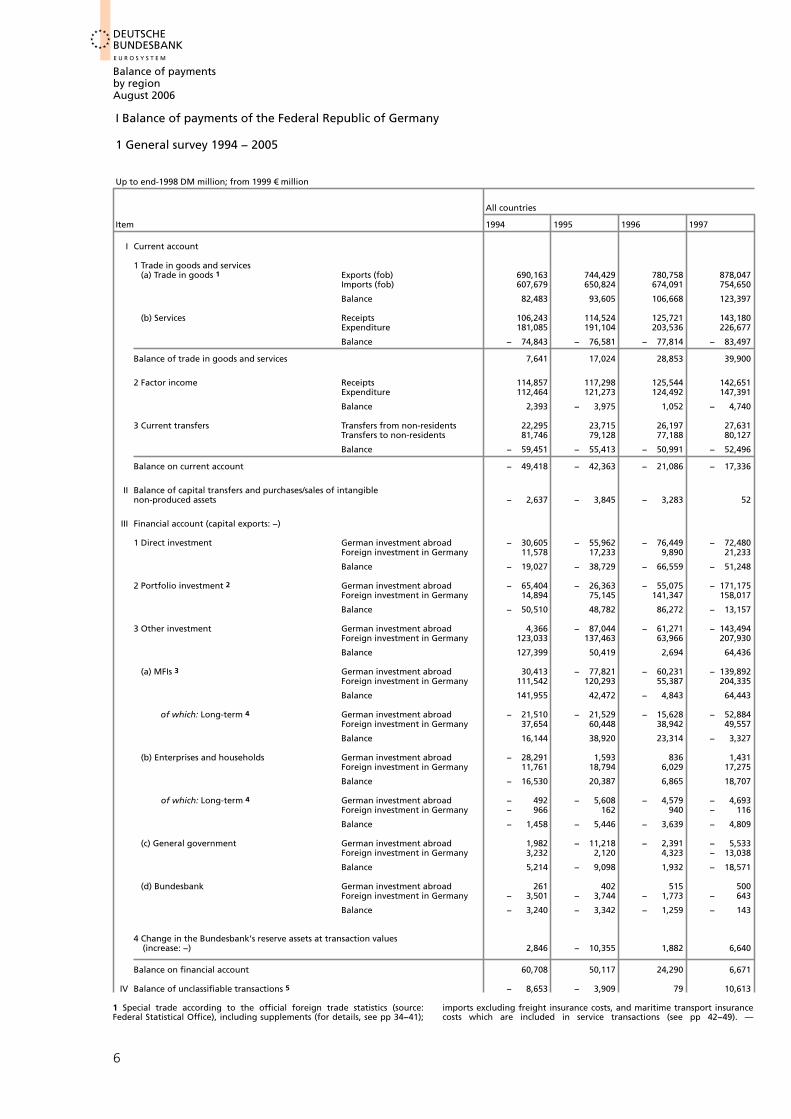
I Balance of payments of the Federal Republic of Germany 1 General survey 1994 − 2005 Up to end-1998 DM million; from 1999 € million
All countries
Item 1994 1995 1996 1997
Current accountI
1 Trade in goods and services(a) Trade in goods 1 Exports (fob) 690,163 744,429 780,758 878,047
Imports (fob) 607,679 650,824 674,091 754,650
Balance 82,483 93,605 106,668 123,397
(b) Services Receipts 106,243 114,524 125,721 143,180Expenditure 181,085 191,104 203,536 226,677
Balance − 74,843 − 76,581 − 77,814 − 83,497
Balance of trade in goods and services 7,641 17,024 28,853 39,900
2 Factor income Receipts 114,857 117,298 125,544 142,651Expenditure 112,464 121,273 124,492 147,391
Balance 2,393 − 3,975 1,052 − 4,740
3 Current transfers Transfers from non-residents 22,295 23,715 26,197 27,631Transfers to non-residents 81,746 79,128 77,188 80,127
Balance − 59,451 − 55,413 − 50,991 − 52,496
Balance on current account − 49,418 − 42,363 − 21,086 − 17,336
Balance of capital transfers and purchases/sales of intangibleIInon-produced assets − 2,637 − 3,845 − 3,283 52
Financial account (capital exports: −)III
1 Direct investment German investment abroad − 30,605 − 55,962 − 76,449 − 72,480Foreign investment in Germany 11,578 17,233 9,890 21,233
Balance − 19,027 − 38,729 − 66,559 − 51,248
2 Portfolio investment 2 German investment abroad − 65,404 − 26,363 − 55,075 − 171,175Foreign investment in Germany 14,894 75,145 141,347 158,017
Balance − 50,510 48,782 86,272 − 13,157
3 Other investment German investment abroad 4,366 − 87,044 − 61,271 − 143,494Foreign investment in Germany 123,033 137,463 63,966 207,930
Balance 127,399 50,419 2,694 64,436
(a) MFIs 3 German investment abroad 30,413 − 77,821 − 60,231 − 139,892Foreign investment in Germany 111,542 120,293 55,387 204,335
Balance 141,955 42,472 − 4,843 64,443
German investment abroad − 21,510 − 21,529 − 15,628 − 52,884of which: Long-term 4 Foreign investment in Germany 37,654 60,448 38,942 49,557
Balance 16,144 38,920 23,314 − 3,327
(b) Enterprises and households German investment abroad − 28,291 1,593 836 1,431Foreign investment in Germany 11,761 18,794 6,029 17,275
Balance − 16,530 20,387 6,865 18,707
of which: Long-term 4 German investment abroad − 492 − 5,608 − 4,579 − 4,693Foreign investment in Germany − 966 162 940 − 116
Balance − 1,458 − 5,446 − 3,639 − 4,809
(c) General government German investment abroad 1,982 − 11,218 − 2,391 − 5,533Foreign investment in Germany 3,232 2,120 4,323 − 13,038
Balance 5,214 − 9,098 1,932 − 18,571
(d) Bundesbank German investment abroad 261 402 515 500Foreign investment in Germany − 3,501 − 3,744 − 1,773 − 643
Balance − 3,240 − 3,342 − 1,259 − 143
4 Change in the Bundesbank’s reserve assets at transaction values(increase: −) 2,846 − 10,355 1,882 6,640
Balance on financial account 60,708 50,117 24,290 6,671
Balance of unclassifiable transactions 5 − 8,653 − 3,909 79 10,613IV
1 Special trade according to the official foreign trade statistics (source: imports excluding freight insurance costs, and maritime transport insuranceFederal Statistical Office), including supplements (for details, see pp 34−41); costs which are included in service transactions (see pp 42−49). —
6

DEUTSCHEBUNDESBANK
Balance of paymentsby regionAugust 2006
I Balance of payments of the Federal Republic of Germany
1998 1999 2000 2001 2002 2003 2004 2005
942,853 504,665 589,813 629,677 645,397 658,647 725,080 781,678809,059 439,285 529,064 531,007 511,059 529,484 572,467 628,320
133,794 65,380 60,750 98,670 134,338 129,162 152,614 153,358
147,847 78,850 90,236 98,921 108,518 108,595 114,849 124,329238,641 133,207 149,935 159,378 153,948 153,260 157,864 164,765
− 90,794 − 54,357 − 59,699 − 60,457 − 45,430 − 44,665 − 43,015 − 40,436
43,001 11,023 1,050 38,213 88,908 84,498 109,599 112,922
148,725 86,860 115,986 101,889 103,891 104,149 120,093 138,741167,360 98,275 124,320 112,822 121,912 120,074 119,459 130,098
− 18,635 − 11,415 − 8,335 − 10,932 − 18,022 − 15,925 635 8,643
28,505 16,100 16,444 17,063 17,111 16,877 15,974 17,50781,566 40,885 44,394 43,920 44,623 45,158 44,282 46,428
− 53,061 − 24,785 − 27,950 − 26,856 − 27,511 − 28,282 − 28,309 − 28,921
− 28,695 − 25,177 − 35,235 425 43,375 40,291 81,925 92,645
1,289 − 154 6,823 − 387 − 212 312 430 − 1,268
− 156,302 − 102,018 − 61,387 − 44,347 − 20,132 − 5,470 − 1,516 − 36,69543,276 52,634 215,209 29,518 56,871 25,873 − 12,172 26,264
− 113,026 − 49,384 153,822 − 14,829 36,739 20,403 − 13,689 − 10,430
− 269,535 − 179,562 − 216,002 − 117,681 − 64,135 − 43,621 − 116,004 − 215,587265,147 168,090 51,093 156,708 130,154 112,629 120,068 196,987
− 4,387 − 11,471 − 164,910 39,027 66,020 69,008 4,064 − 18,600
− 151,471 − 65,158 − 86,902 − 111,965 − 174,236 − 154,722 − 144,826 − 118,461301,696 103,082 126,332 69,942 30,964 16,813 38,285 44,893
150,224 37,924 39,430 − 42,024 − 143,272 − 137,909 − 106,541 − 73,568
− 136,210 − 42,144 − 101,500 − 130,691 − 132,610 − 122,352 − 121,833 − 85,781279,294 95,394 115,352 54,330 28,453 10,708 32,337 22,455
143,084 53,251 13,852 − 76,361 − 104,157 − 111,644 − 89,496 − 63,325
− 62,128 − 42,417 − 40,123 − 47,678 − 33,864 − 32,602 5,854 − 69,97761,127 35,241 15,723 4,414 18,378 − 5,964 − 10,083 − 9,830
− 1,001 − 7,176 − 24,400 − 43,265 − 15,486 − 38,566 − 4,230 − 79,807
− 10,014 17,563 − 6,760 − 20,668 − 12,197 − 33,329 − 22,284 − 13,76318,764 20,933 10,040 12,101 3,483 429 11,057 20,803
8,750 38,496 3,280 − 8,566 − 8,713 − 32,900 − 11,227 7,040
− 4,483 − 3,997 − 1,553 − 3,308 − 2,689 − 4,920 − 7,482 − 8,92415,824 3,809 4,343 11,837 5,396 − 297 7,810 7,836
11,341 − 188 2,789 8,529 2,707 − 5,216 328 − 1,089
− 5,096 6,966 − 20,614 15,378 6,580 728 2,143 3,15649 − 11,255 526 879 − 1,625 3,693 − 2,658 3,740
− 5,047 − 4,288 − 20,088 16,258 4,955 4,421 − 515 6,896
− 151 − 47,544 41,972 24,015 − 36,010 230 − 2,851 − 22,0733,588 − 1,991 414 2,631 653 1,983 − 2,451 − 2,105
3,438 − 49,535 42,386 26,645 − 35,357 2,213 − 5,302 − 24,178
− 7,128 12,535 5,844 6,032 2,065 445 1,470 2,182
25,683 − 10,396 34,187 − 11,794 − 38,448 − 48,054 − 114,695 − 100,416
1,724 35,726 − 5,775 11,757 − 4,716 7,451 32,340 9,039
2 Including money market paper and financial derivatives. — 3 Excluding or unlimited maturities. — 5 Net errors and omissions on current and finan-Bundesbank. — 4 Long-term: with original maturities of more than one year cial transactions.
7

DEUTSCHEBUNDESBANKE U R O S Y S T E M
Balance of paymentsby regionAugust 2006
I Balance of payments of the Federal Republic of Germany 2 Regional breakdown 2002 − 2005 * € million
Europe
Total
Item 2002 2003 2004 2005
Current accountI
1 Trade in goods and services(a) Trade in goods 1 Exports (fob) 469,635 489,730 539,383 580,973
Imports (fob) 370,742 384,863 409,164 450,913
Balance 98,893 104,867 130,219 130,060
(b) Services Receipts 67,053 71,148 76,011 81,267Expenditure 109,459 111,483 114,310 118,136
Balance − 42,406 − 40,335 − 38,299 − 36,870
Balance of trade in goods and services 56,487 64,532 91,920 93,190
2 Factor income Receipts 79,559 82,148 94,607 108,708Expenditure 101,653 102,214 102,448 110,412
Balance − 22,094 − 20,065 − 7,841 − 1,704
3 Current transfers Transfers from non-residents 14,825 14,717 14,643 15,621Transfers to non-residents 34,893 36,535 35,872 37,267
Balance − 20,069 − 21,818 − 21,229 − 21,646
Balance on current account 14,324 22,648 62,850 69,840
Balance of capital transfers and purchases/sales of intangibleIInon-produced assets 1,706 2,688 2,366 3,119
Financial account (capital exports: −)III
1 Direct investment 2 German investment abroad − 23,722 3,655 − 3,520 − 35,393Foreign investment in Germany 49,911 22,793 − 14,468 26,196
Balance 26,189 26,447 − 17,988 − 9,197
2 Portfolio investment 3 German investment abroad − 57,242 − 40,686 − 90,305 − 186,448Foreign investment in Germany 112,304 96,192 136,057 175,129
Balance 55,062 55,506 45,752 − 11,319
3 Other investment 2 German investment abroad − 138,720 − 136,794 − 138,518 − 80,272Foreign investment in Germany 55,712 34,639 50,138 50,649
Balance − 83,008 − 102,156 − 88,380 − 29,624
(a) MFIs 4 German investment abroad − 99,860 − 109,846 − 117,175 − 50,422Foreign investment in Germany 54,313 32,709 45,661 27,617
Balance − 45,547 − 77,137 − 71,514 − 22,805
German investment abroad − 26,629 − 21,551 2,645 − 62,009of which: Long-termForeign investment in Germany 9,933 10,162 1,556 4,356
Balance − 16,696 − 11,390 4,202 − 57,653
(b) Enterprises and households German investment abroad − 10,013 − 27,948 − 20,945 − 9,393Foreign investment in Germany 3,167 − 1,962 7,404 19,590
Balance − 6,846 − 29,910 − 13,541 10,196
of which: Long-term German investment abroad − 2,292 − 2,768 − 5,999 − 8,073Foreign investment in Germany 5,416 − 833 6,519 9,465
Balance 3,123 − 3,602 520 1,391
(c) General government German investment abroad 7,163 769 2,453 1,579Foreign investment in Germany − 1,568 3,737 − 2,865 3,540
Balance 5,595 4,506 − 411 5,119
(d) Bundesbank German investment abroad − 36,010 230 − 2,851 − 22,036Foreign investment in Germany − 200 154 − 63 − 98
Balance − 36,210 385 − 2,914 − 22,134
4 Change in the Bundesbank’s reserve assets at transaction values(increase: −) Not classifiable by region
Balance on financial account . . . .
Balance of unclassifiable transactionsIV Not classifiable by region
* Countries attributed to individual groups of countries according to the Office): exports by country of destination, imports by country of origin;most recent position; see also list of countries on pp 104−105. For further including supplementary trade items. — 2 Regional attribution of Germanfootnotes, see table on pp 6−7. — 1 Special trade (source: Federal Statistical investment abroad to the country of investment or debtor country,
8
DEUTSCHEBUNDESBANK
Balance of paymentsby regionAugust 2006
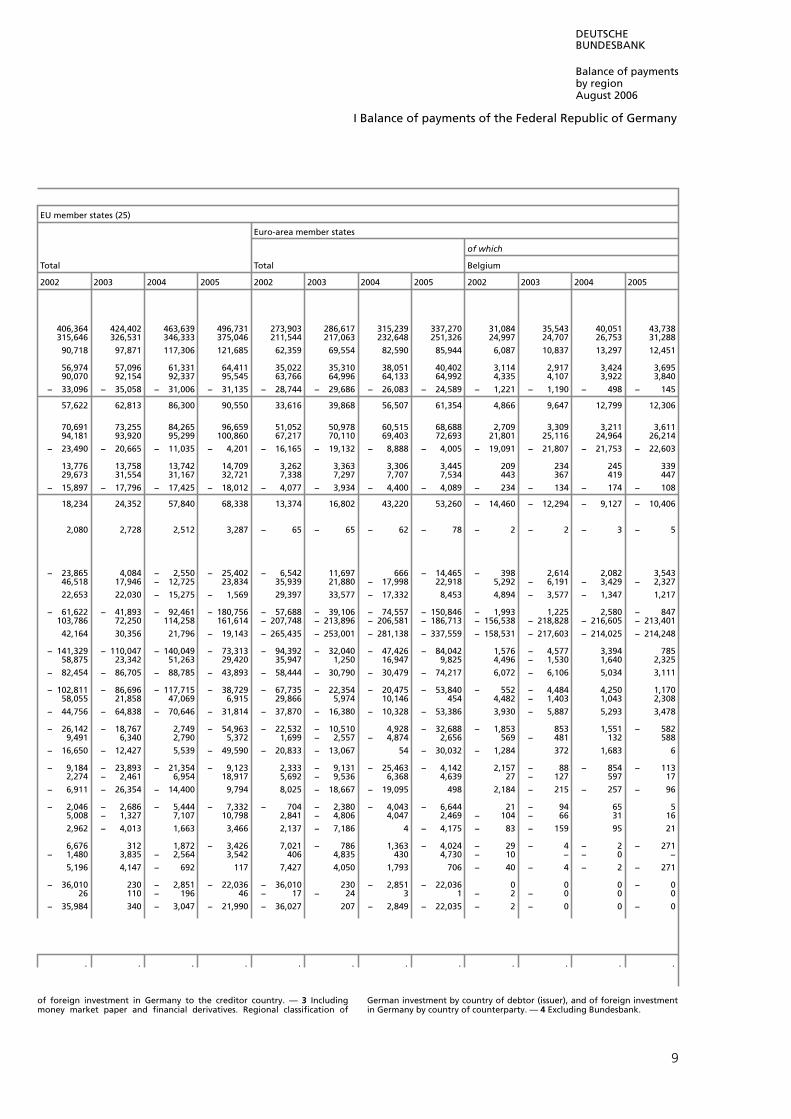
I Balance of payments of the Federal Republic of Germany
EU member states (25)
Euro-area member states
of which
Total Total Belgium
2002 2003 2004 2005 2002 2003 2004 2005 2002 2003 2004 2005
406,364 424,402 463,639 496,731 273,903 286,617 315,239 337,270 31,084 35,543 40,051 43,738315,646 326,531 346,333 375,046 211,544 217,063 232,648 251,326 24,997 24,707 26,753 31,288
90,718 97,871 117,306 121,685 62,359 69,554 82,590 85,944 6,087 10,837 13,297 12,451
56,974 57,096 61,331 64,411 35,022 35,310 38,051 40,402 3,114 2,917 3,424 3,69590,070 92,154 92,337 95,545 63,766 64,996 64,133 64,992 4,335 4,107 3,922 3,840
− 33,096 − 35,058 − 31,006 − 31,135 − 28,744 − 29,686 − 26,083 − 24,589 − 1,221 − 1,190 − 498 − 145
57,622 62,813 86,300 90,550 33,616 39,868 56,507 61,354 4,866 9,647 12,799 12,306
70,691 73,255 84,265 96,659 51,052 50,978 60,515 68,688 2,709 3,309 3,211 3,61194,181 93,920 95,299 100,860 67,217 70,110 69,403 72,693 21,801 25,116 24,964 26,214
− 23,490 − 20,665 − 11,035 − 4,201 − 16,165 − 19,132 − 8,888 − 4,005 − 19,091 − 21,807 − 21,753 − 22,603
13,776 13,758 13,742 14,709 3,262 3,363 3,306 3,445 209 234 245 33929,673 31,554 31,167 32,721 7,338 7,297 7,707 7,534 443 367 419 447
− 15,897 − 17,796 − 17,425 − 18,012 − 4,077 − 3,934 − 4,400 − 4,089 − 234 − 134 − 174 − 108
18,234 24,352 57,840 68,338 13,374 16,802 43,220 53,260 − 14,460 − 12,294 − 9,127 − 10,406
2,080 2,728 2,512 3,287 − 65 − 65 − 62 − 78 − 2 − 2 − 3 − 5
− 23,865 4,084 − 2,550 − 25,402 − 6,542 11,697 666 − 14,465 − 398 2,614 2,082 3,54346,518 17,946 − 12,725 23,834 35,939 21,880 − 17,998 22,918 5,292 − 6,191 − 3,429 − 2,327
22,653 22,030 − 15,275 − 1,569 29,397 33,577 − 17,332 8,453 4,894 − 3,577 − 1,347 1,217
− 61,622 − 41,893 − 92,461 − 180,756 − 57,688 − 39,106 − 74,557 − 150,846 − 1,993 1,225 2,580 − 847103,786 72,250 114,258 161,614 − 207,748 − 213,896 − 206,581 − 186,713 − 156,538 − 218,828 − 216,605 − 213,401
42,164 30,356 21,796 − 19,143 − 265,435 − 253,001 − 281,138 − 337,559 − 158,531 − 217,603 − 214,025 − 214,248
− 141,329 − 110,047 − 140,049 − 73,313 − 94,392 − 32,040 − 47,426 − 84,042 1,576 − 4,577 3,394 78558,875 23,342 51,263 29,420 35,947 1,250 16,947 9,825 4,496 − 1,530 1,640 2,325
− 82,454 − 86,705 − 88,785 − 43,893 − 58,444 − 30,790 − 30,479 − 74,217 6,072 − 6,106 5,034 3,111
− 102,811 − 86,696 − 117,715 − 38,729 − 67,735 − 22,354 − 20,475 − 53,840 − 552 − 4,484 4,250 1,17058,055 21,858 47,069 6,915 29,866 5,974 10,146 454 4,482 − 1,403 1,043 2,308
− 44,756 − 64,838 − 70,646 − 31,814 − 37,870 − 16,380 − 10,328 − 53,386 3,930 − 5,887 5,293 3,478
− 26,142 − 18,767 2,749 − 54,963 − 22,532 − 10,510 4,928 − 32,688 − 1,853 853 1,551 − 5829,491 6,340 2,790 5,372 1,699 − 2,557 − 4,874 2,656 569 − 481 132 588
− 16,650 − 12,427 5,539 − 49,590 − 20,833 − 13,067 54 − 30,032 − 1,284 372 1,683 6
− 9,184 − 23,893 − 21,354 − 9,123 2,333 − 9,131 − 25,463 − 4,142 2,157 − 88 − 854 − 1132,274 − 2,461 6,954 18,917 5,692 − 9,536 6,368 4,639 27 − 127 597 17
− 6,911 − 26,354 − 14,400 9,794 8,025 − 18,667 − 19,095 498 2,184 − 215 − 257 − 96
− 2,046 − 2,686 − 5,444 − 7,332 − 704 − 2,380 − 4,043 − 6,644 21 − 94 65 55,008 − 1,327 7,107 10,798 2,841 − 4,806 4,047 2,469 − 104 − 66 31 16
2,962 − 4,013 1,663 3,466 2,137 − 7,186 4 − 4,175 − 83 − 159 95 21
6,676 312 1,872 − 3,426 7,021 − 786 1,363 − 4,024 − 29 − 4 − 2 − 271− 1,480 3,835 − 2,564 3,542 406 4,835 430 4,730 − 10 − − 0 −
5,196 4,147 − 692 117 7,427 4,050 1,793 706 − 40 − 4 − 2 − 271
− 36,010 230 − 2,851 − 22,036 − 36,010 230 − 2,851 − 22,036 0 0 0 − 026 110 − 196 46 − 17 − 24 3 1 − 2 − 0 0 0
− 35,984 340 − 3,047 − 21,990 − 36,027 207 − 2,849 − 22,035 − 2 − 0 0 − 0
. . . . . . . . . . . .
of foreign investment in Germany to the creditor country. — 3 Including German investment by country of debtor (issuer), and of foreign investmentmoney market paper and financial derivatives. Regional classification of in Germany by country of counterparty. — 4 Excluding Bundesbank.
9
DEUTSCHEBUNDESBANKE U R O S Y S T E M
Balance of paymentsby regionAugust 2006
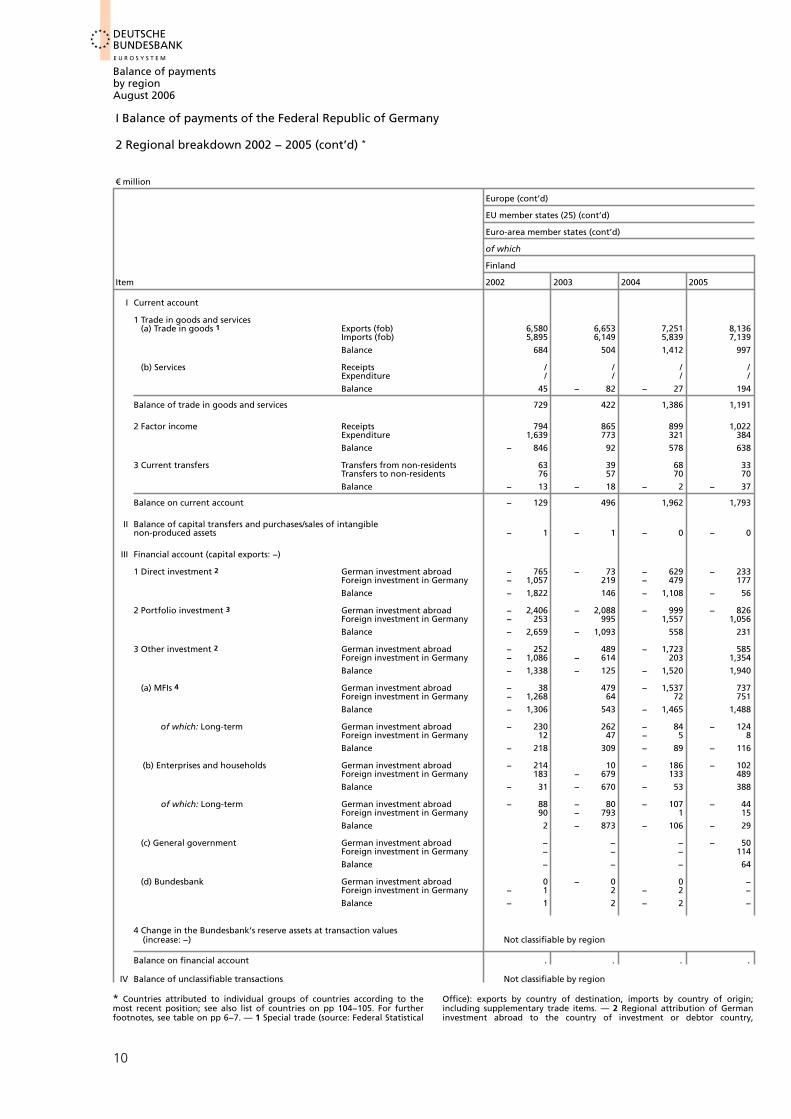
I Balance of payments of the Federal Republic of Germany 2 Regional breakdown 2002 − 2005 (cont’d) * € million
Europe (cont’d)
EU member states (25) (cont’d)
Euro-area member states (cont’d)
of which
Finland
Item 2002 2003 2004 2005
Current accountI
1 Trade in goods and services(a) Trade in goods 1 Exports (fob) 6,580 6,653 7,251 8,136
Imports (fob) 5,895 6,149 5,839 7,139
Balance 684 504 1,412 997
(b) Services Receipts / / / /Expenditure / / / /
Balance 45 − 82 − 27 194
Balance of trade in goods and services 729 422 1,386 1,191
2 Factor income Receipts 794 865 899 1,022Expenditure 1,639 773 321 384
Balance − 846 92 578 638
3 Current transfers Transfers from non-residents 63 39 68 33Transfers to non-residents 76 57 70 70
Balance − 13 − 18 − 2 − 37
Balance on current account − 129 496 1,962 1,793
Balance of capital transfers and purchases/sales of intangibleIInon-produced assets − 1 − 1 − 0 − 0
Financial account (capital exports: −)III
1 Direct investment 2 German investment abroad − 765 − 73 − 629 − 233Foreign investment in Germany − 1,057 219 − 479 177
Balance − 1,822 146 − 1,108 − 56
2 Portfolio investment 3 German investment abroad − 2,406 − 2,088 − 999 − 826Foreign investment in Germany − 253 995 1,557 1,056
Balance − 2,659 − 1,093 558 231
3 Other investment 2 German investment abroad − 252 489 − 1,723 585Foreign investment in Germany − 1,086 − 614 203 1,354
Balance − 1,338 − 125 − 1,520 1,940
(a) MFIs 4 German investment abroad − 38 479 − 1,537 737Foreign investment in Germany − 1,268 64 72 751
Balance − 1,306 543 − 1,465 1,488
German investment abroad − 230 262 − 84 − 124of which: Long-termForeign investment in Germany 12 47 − 5 8
Balance − 218 309 − 89 − 116
(b) Enterprises and households German investment abroad − 214 10 − 186 − 102Foreign investment in Germany 183 − 679 133 489
Balance − 31 − 670 − 53 388
of which: Long-term German investment abroad − 88 − 80 − 107 − 44Foreign investment in Germany 90 − 793 1 15
Balance 2 − 873 − 106 − 29
(c) General government German investment abroad − − − − 50Foreign investment in Germany − − − 114
Balance − − − 64
(d) Bundesbank German investment abroad 0 − 0 0 −Foreign investment in Germany − 1 2 − 2 −
Balance − 1 2 − 2 −
4 Change in the Bundesbank’s reserve assets at transaction values(increase: −) Not classifiable by region
Balance on financial account . . . .
Balance of unclassifiable transactionsIV Not classifiable by region
* Countries attributed to individual groups of countries according to the Office): exports by country of destination, imports by country of origin;most recent position; see also list of countries on pp 104−105. For further including supplementary trade items. — 2 Regional attribution of Germanfootnotes, see table on pp 6−7. — 1 Special trade (source: Federal Statistical investment abroad to the country of investment or debtor country,
10

DEUTSCHEBUNDESBANK
Balance of paymentsby regionAugust 2006
I Balance of payments of the Federal Republic of Germany
France Greece Ireland
2002 2003 2004 2005 2002 2003 2004 2005 2002 2003 2004 2005
68,796 69,202 74,911 80,121 4,907 5,496 6,202 6,400 4,136 3,792 4,421 4,83547,715 49,040 51,895 55,192 1,575 1,566 1,604 1,624 13,616 13,648 14,779 15,306
21,081 20,162 23,015 24,929 3,332 3,930 4,598 4,777 − 9,481 − 9,857 − 10,358 − 10,471
8,405 7,446 7,127 7,585 46 531 618 679 1,664 1,710 2,036 1,84111,554 11,653 11,975 11,664 3,334 3,308 3,023 3,058 / / / /
− 3,149 − 4,207 − 4,849 − 4,079 − 3,289 − 2,778 − 2,405 − 2,378 − 482 − 243 − 297 − 387
17,932 15,955 18,166 20,850 43 1,152 2,193 2,399 − 9,962 − 10,099 − 10,655 − 10,858
7,824 7,752 10,788 11,772 1,157 1,163 1,628 2,130 1,678 1,735 2,802 3,4506,589 7,153 7,541 8,007 74 98 109 128 2,031 1,837 2,507 3,438
1,235 599 3,247 3,765 1,083 1,065 1,519 2,003 − 353 − 101 295 12
1,260 1,306 1,316 1,234 10 12 7 8 83 113 66 1051,040 1,118 1,146 1,161 627 656 649 643 155 198 156 166
220 188 171 74 − 617 − 644 − 642 − 635 − 71 − 85 − 90 − 61
19,386 16,742 21,584 24,689 509 1,573 3,070 3,766 − 10,387 − 10,286 − 10,450 − 10,907
− 14 − 18 − 13 − 18 − 2 − 4 − 2 − 3 − 7 1 − 0 − 0
− 8,728 − 1,409 − 5,086 4,663 − 99 − 65 − 144 − 59 1,032 264 − 574 − 1,0622,415 10,579 3,354 − 19,640 216 − 9 − 6 5 2,741 184 − 475 4,262
− 6,313 9,170 − 1,732 − 14,977 117 − 74 − 150 − 54 3,773 449 − 1,049 3,200
− 14,175 − 13,677 3,258 − 24,023 − 1,445 − 2,581 − 4,909 − 7,906 − 1,499 − 9,089 − 14,960 − 11,75814,853 63,656 71,472 53,553 308 2,051 2,367 2,375 − 132 910 3,984 2,689
678 49,979 74,730 29,529 − 1,137 − 531 − 2,543 − 5,531 − 1,631 − 8,179 − 10,976 − 9,069
− 19,478 − 9,883 − 15,369 11,953 − 1,212 − 830 224 406 − 8,375 − 3,698 − 14,576 − 12,4267,445 12,241 14,857 − 8,112 539 − 359 − 226 − 79 2,602 8,392 6,289 9,286
− 12,034 2,357 − 513 3,842 − 673 − 1,189 − 2 327 − 5,773 4,694 − 8,287 − 3,140
− 17,334 − 6,565 − 12,553 11,006 − 1,715 − 982 − 59 460 − 6,838 − 4,152 − 4,366 − 9,0924,668 12,183 10,607 − 9,878 423 − 423 − 394 − 76 2,839 5,600 3,456 4,535
− 12,666 5,618 − 1,946 1,128 − 1,292 − 1,405 − 453 384 − 4,000 1,448 − 910 − 4,556
− 1,225 − 706 827 − 1,343 − 432 − 1,425 − 116 − 252 − 70 − 2,474 1,657 − 7,353− 211 3,071 1,987 − 340 303 − 108 − 822 − 132 1,063 3,495 3,737 2,824
− 1,436 2,365 2,814 − 1,683 − 129 − 1,533 − 939 − 384 992 1,021 5,394 − 4,528
− 2,008 − 2,999 − 2,818 2,234 503 152 283 − 54 − 1,451 331 − 10,131 − 3,4562,783 − 470 4,218 1,656 117 65 168 − 3 229 − 1,630 1,906 12
775 − 3,469 1,401 3,889 619 217 451 − 56 − 1,222 − 1,299 − 8,224 − 3,444
− 129 − 140 282 − 432 15 8 2 3 − 124 − 119 − 678 − 1,6891,405 − 527 1,391 1,392 − 2 − 1 − 1 26 274 − 1,101 1,196 − 81
1,277 − 667 1,673 960 13 7 1 29 150 − 1,220 518 − 1,770
− 3 0 2 − 1,285 − 0 − 0 − 1 − 85 124 − 79 122− 528 29 113 − − − − − 464 4,422 926 4,735
− 3 528 31 − 1,172 − 0 − 0 − 1 − 550 4,545 847 4,857
− 133 − 320 − 1 − 2 0 − 0 0 − 0 0 − 0 − 0 0− 7 − 0 2 − 2 − 1 − 0 0 − 0 − 1 − 0 1 4
− 140 − 320 2 − 4 − 1 − 0 0 − 0 − 1 − 0 1 4
. . . . . . . . . . . .
of foreign investment in Germany to the creditor country. — 3 Including German investment by country of debtor (issuer), and of foreign investmentmoney market paper and financial derivatives. Regional classification of in Germany by country of counterparty. — 4 Excluding Bundesbank.
11
DEUTSCHEBUNDESBANKE U R O S Y S T E M
Balance of paymentsby regionAugust 2006
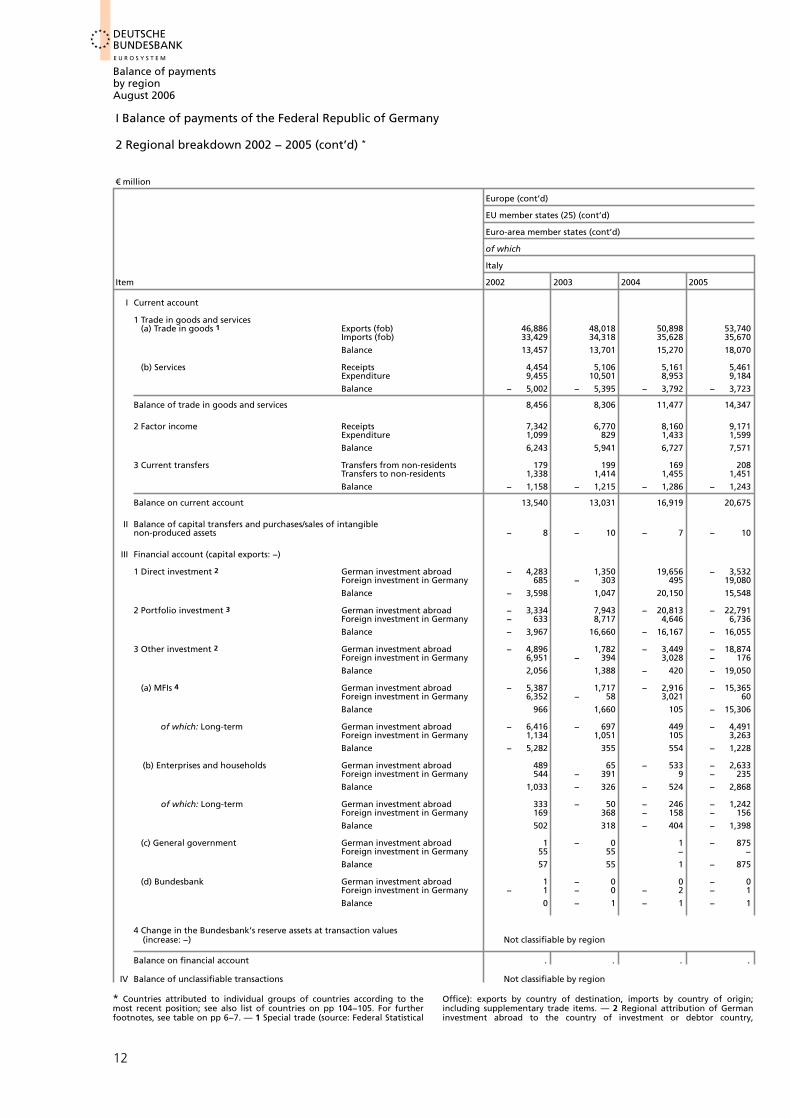
I Balance of payments of the Federal Republic of Germany 2 Regional breakdown 2002 − 2005 (cont’d) * € million
Europe (cont’d)
EU member states (25) (cont’d)
Euro-area member states (cont’d)
of which
Italy
Item 2002 2003 2004 2005
Current accountI
1 Trade in goods and services(a) Trade in goods 1 Exports (fob) 46,886 48,018 50,898 53,740
Imports (fob) 33,429 34,318 35,628 35,670
Balance 13,457 13,701 15,270 18,070
(b) Services Receipts 4,454 5,106 5,161 5,461Expenditure 9,455 10,501 8,953 9,184
Balance − 5,002 − 5,395 − 3,792 − 3,723
Balance of trade in goods and services 8,456 8,306 11,477 14,347
2 Factor income Receipts 7,342 6,770 8,160 9,171Expenditure 1,099 829 1,433 1,599
Balance 6,243 5,941 6,727 7,571
3 Current transfers Transfers from non-residents 179 199 169 208Transfers to non-residents 1,338 1,414 1,455 1,451
Balance − 1,158 − 1,215 − 1,286 − 1,243
Balance on current account 13,540 13,031 16,919 20,675
Balance of capital transfers and purchases/sales of intangibleIInon-produced assets − 8 − 10 − 7 − 10
Financial account (capital exports: −)III
1 Direct investment 2 German investment abroad − 4,283 1,350 19,656 − 3,532Foreign investment in Germany 685 − 303 495 19,080
Balance − 3,598 1,047 20,150 15,548
2 Portfolio investment 3 German investment abroad − 3,334 7,943 − 20,813 − 22,791Foreign investment in Germany − 633 8,717 4,646 6,736
Balance − 3,967 16,660 − 16,167 − 16,055
3 Other investment 2 German investment abroad − 4,896 1,782 − 3,449 − 18,874Foreign investment in Germany 6,951 − 394 3,028 − 176
Balance 2,056 1,388 − 420 − 19,050
(a) MFIs 4 German investment abroad − 5,387 1,717 − 2,916 − 15,365Foreign investment in Germany 6,352 − 58 3,021 60
Balance 966 1,660 105 − 15,306
German investment abroad − 6,416 − 697 449 − 4,491of which: Long-termForeign investment in Germany 1,134 1,051 105 3,263
Balance − 5,282 355 554 − 1,228
(b) Enterprises and households German investment abroad 489 65 − 533 − 2,633Foreign investment in Germany 544 − 391 9 − 235
Balance 1,033 − 326 − 524 − 2,868
of which: Long-term German investment abroad 333 − 50 − 246 − 1,242Foreign investment in Germany 169 368 − 158 − 156
Balance 502 318 − 404 − 1,398
(c) General government German investment abroad 1 − 0 1 − 875Foreign investment in Germany 55 55 − −
Balance 57 55 1 − 875
(d) Bundesbank German investment abroad 1 − 0 0 − 0Foreign investment in Germany − 1 − 0 − 2 − 1
Balance 0 − 1 − 1 − 1
4 Change in the Bundesbank’s reserve assets at transaction values(increase: −) Not classifiable by region
Balance on financial account . . . .
Balance of unclassifiable transactionsIV Not classifiable by region
* Countries attributed to individual groups of countries according to the Office): exports by country of destination, imports by country of origin;most recent position; see also list of countries on pp 104−105. For further including supplementary trade items. — 2 Regional attribution of Germanfootnotes, see table on pp 6−7. — 1 Special trade (source: Federal Statistical investment abroad to the country of investment or debtor country,
12
DEUTSCHEBUNDESBANK
Balance of paymentsby regionAugust 2006
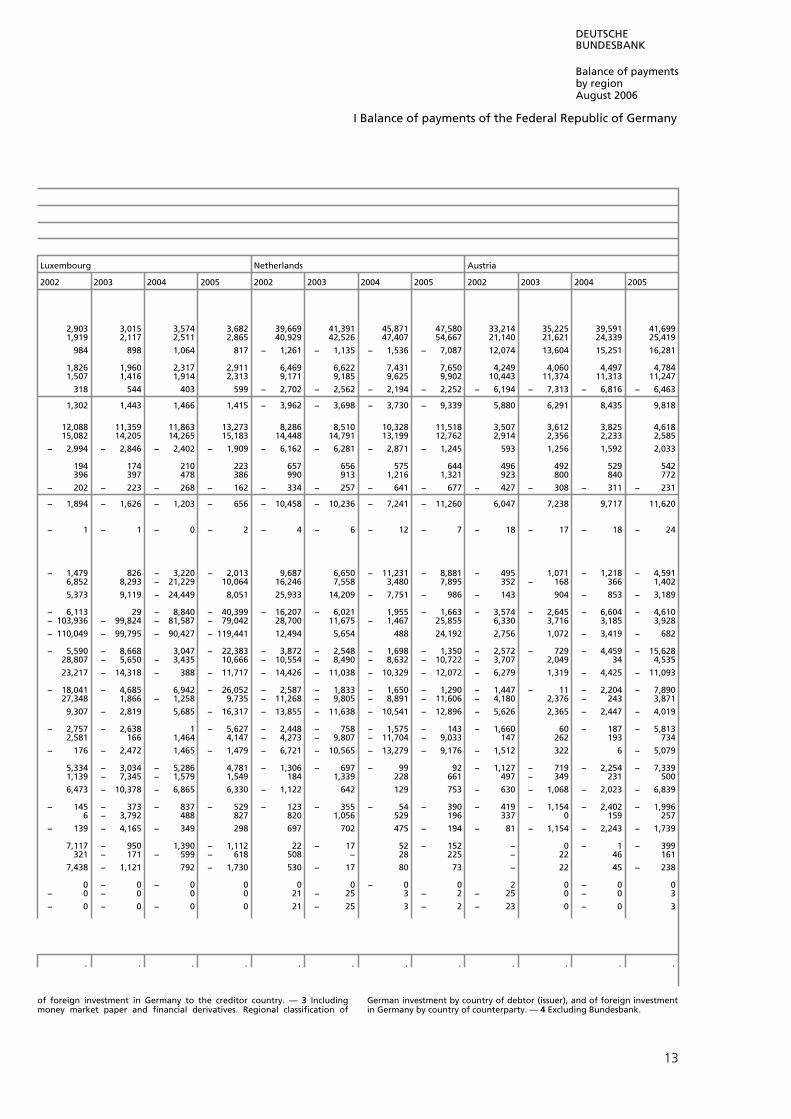
I Balance of payments of the Federal Republic of Germany
Luxembourg Netherlands Austria
2002 2003 2004 2005 2002 2003 2004 2005 2002 2003 2004 2005
2,903 3,015 3,574 3,682 39,669 41,391 45,871 47,580 33,214 35,225 39,591 41,6991,919 2,117 2,511 2,865 40,929 42,526 47,407 54,667 21,140 21,621 24,339 25,419
984 898 1,064 817 − 1,261 − 1,135 − 1,536 − 7,087 12,074 13,604 15,251 16,281
1,826 1,960 2,317 2,911 6,469 6,622 7,431 7,650 4,249 4,060 4,497 4,7841,507 1,416 1,914 2,313 9,171 9,185 9,625 9,902 10,443 11,374 11,313 11,247
318 544 403 599 − 2,702 − 2,562 − 2,194 − 2,252 − 6,194 − 7,313 − 6,816 − 6,463
1,302 1,443 1,466 1,415 − 3,962 − 3,698 − 3,730 − 9,339 5,880 6,291 8,435 9,818
12,088 11,359 11,863 13,273 8,286 8,510 10,328 11,518 3,507 3,612 3,825 4,61815,082 14,205 14,265 15,183 14,448 14,791 13,199 12,762 2,914 2,356 2,233 2,585
− 2,994 − 2,846 − 2,402 − 1,909 − 6,162 − 6,281 − 2,871 − 1,245 593 1,256 1,592 2,033
194 174 210 223 657 656 575 644 496 492 529 542396 397 478 386 990 913 1,216 1,321 923 800 840 772
− 202 − 223 − 268 − 162 − 334 − 257 − 641 − 677 − 427 − 308 − 311 − 231
− 1,894 − 1,626 − 1,203 − 656 − 10,458 − 10,236 − 7,241 − 11,260 6,047 7,238 9,717 11,620
− 1 − 1 − 0 − 2 − 4 − 6 − 12 − 7 − 18 − 17 − 18 − 24
− 1,479 826 − 3,220 − 2,013 9,687 6,650 − 11,231 − 8,881 − 495 1,071 − 1,218 − 4,5916,852 8,293 − 21,229 10,064 16,246 7,558 3,480 7,895 352 − 168 366 1,402
5,373 9,119 − 24,449 8,051 25,933 14,209 − 7,751 − 986 − 143 904 − 853 − 3,189
− 6,113 29 − 8,840 − 40,399 − 16,207 − 6,021 1,955 − 1,663 − 3,574 − 2,645 − 6,604 − 4,610− 103,936 − 99,824 − 81,587 − 79,042 28,700 11,675 − 1,467 25,855 6,330 3,716 3,185 3,928
− 110,049 − 99,795 − 90,427 − 119,441 12,494 5,654 488 24,192 2,756 1,072 − 3,419 − 682
− 5,590 − 8,668 3,047 − 22,383 − 3,872 − 2,548 − 1,698 − 1,350 − 2,572 − 729 − 4,459 − 15,62828,807 − 5,650 − 3,435 10,666 − 10,554 − 8,490 − 8,632 − 10,722 − 3,707 2,049 34 4,535
23,217 − 14,318 − 388 − 11,717 − 14,426 − 11,038 − 10,329 − 12,072 − 6,279 1,319 − 4,425 − 11,093
− 18,041 − 4,685 6,942 − 26,052 − 2,587 − 1,833 − 1,650 − 1,290 − 1,447 − 11 − 2,204 − 7,89027,348 1,866 − 1,258 9,735 − 11,268 − 9,805 − 8,891 − 11,606 − 4,180 2,376 − 243 3,871
9,307 − 2,819 5,685 − 16,317 − 13,855 − 11,638 − 10,541 − 12,896 − 5,626 2,365 − 2,447 − 4,019
− 2,757 − 2,638 1 − 5,627 − 2,448 − 758 − 1,575 − 143 − 1,660 60 − 187 − 5,8132,581 166 1,464 4,147 − 4,273 − 9,807 − 11,704 − 9,033 147 262 193 734
− 176 − 2,472 1,465 − 1,479 − 6,721 − 10,565 − 13,279 − 9,176 − 1,512 322 6 − 5,079
5,334 − 3,034 − 5,286 4,781 − 1,306 − 697 − 99 92 − 1,127 − 719 − 2,254 − 7,3391,139 − 7,345 − 1,579 1,549 184 1,339 228 661 497 − 349 231 500
6,473 − 10,378 − 6,865 6,330 − 1,122 642 129 753 − 630 − 1,068 − 2,023 − 6,839
− 145 − 373 − 837 − 529 − 123 − 355 − 54 − 390 − 419 − 1,154 − 2,402 − 1,9966 − 3,792 488 827 820 1,056 529 196 337 0 159 257
− 139 − 4,165 − 349 298 697 702 475 − 194 − 81 − 1,154 − 2,243 − 1,739
7,117 − 950 1,390 − 1,112 22 − 17 52 − 152 − 0 − 1 − 399321 − 171 − 599 − 618 508 − 28 225 − 22 46 161
7,438 − 1,121 792 − 1,730 530 − 17 80 73 − 22 45 − 238
0 − 0 − 0 0 0 0 − 0 0 2 0 − 0 0− 0 − 0 0 0 21 − 25 3 − 2 − 25 0 − 0 3
− 0 − 0 − 0 0 21 − 25 3 − 2 − 23 0 − 0 3
. . . . . . . . . . . .
of foreign investment in Germany to the creditor country. — 3 Including German investment by country of debtor (issuer), and of foreign investmentmoney market paper and financial derivatives. Regional classification of in Germany by country of counterparty. — 4 Excluding Bundesbank.
13
DEUTSCHEBUNDESBANKE U R O S Y S T E M
Balance of paymentsby regionAugust 2006
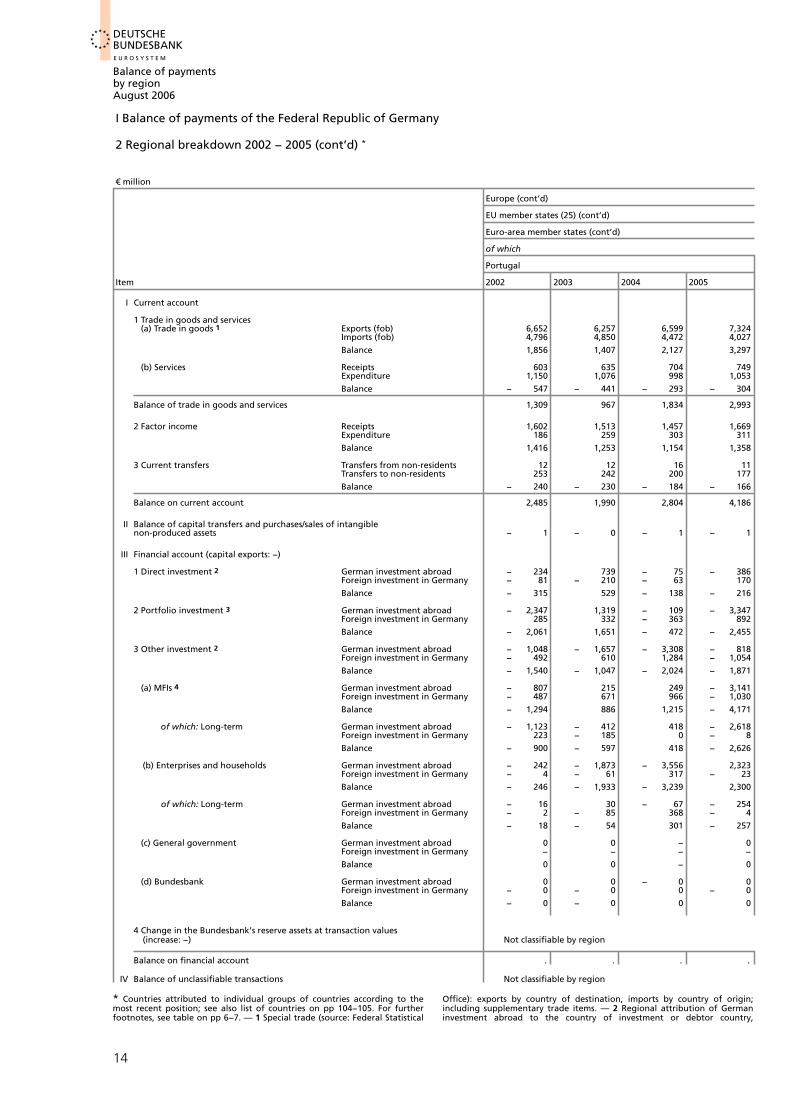
I Balance of payments of the Federal Republic of Germany 2 Regional breakdown 2002 − 2005 (cont’d) * € million
Europe (cont’d)
EU member states (25) (cont’d)
Euro-area member states (cont’d)
of which
Portugal
Item 2002 2003 2004 2005
Current accountI
1 Trade in goods and services(a) Trade in goods 1 Exports (fob) 6,652 6,257 6,599 7,324
Imports (fob) 4,796 4,850 4,472 4,027
Balance 1,856 1,407 2,127 3,297
(b) Services Receipts 603 635 704 749Expenditure 1,150 1,076 998 1,053
Balance − 547 − 441 − 293 − 304
Balance of trade in goods and services 1,309 967 1,834 2,993
2 Factor income Receipts 1,602 1,513 1,457 1,669Expenditure 186 259 303 311
Balance 1,416 1,253 1,154 1,358
3 Current transfers Transfers from non-residents 12 12 16 11Transfers to non-residents 253 242 200 177
Balance − 240 − 230 − 184 − 166
Balance on current account 2,485 1,990 2,804 4,186
Balance of capital transfers and purchases/sales of intangibleIInon-produced assets − 1 − 0 − 1 − 1
Financial account (capital exports: −)III
1 Direct investment 2 German investment abroad − 234 739 − 75 − 386Foreign investment in Germany − 81 − 210 − 63 170
Balance − 315 529 − 138 − 216
2 Portfolio investment 3 German investment abroad − 2,347 1,319 − 109 − 3,347Foreign investment in Germany 285 332 − 363 892
Balance − 2,061 1,651 − 472 − 2,455
3 Other investment 2 German investment abroad − 1,048 − 1,657 − 3,308 − 818Foreign investment in Germany − 492 610 1,284 − 1,054
Balance − 1,540 − 1,047 − 2,024 − 1,871
(a) MFIs 4 German investment abroad − 807 215 249 − 3,141Foreign investment in Germany − 487 671 966 − 1,030
Balance − 1,294 886 1,215 − 4,171
German investment abroad − 1,123 − 412 418 − 2,618of which: Long-termForeign investment in Germany 223 − 185 0 − 8
Balance − 900 − 597 418 − 2,626
(b) Enterprises and households German investment abroad − 242 − 1,873 − 3,556 2,323Foreign investment in Germany − 4 − 61 317 − 23
Balance − 246 − 1,933 − 3,239 2,300
of which: Long-term German investment abroad − 16 30 − 67 − 254Foreign investment in Germany − 2 − 85 368 − 4
Balance − 18 − 54 301 − 257
(c) General government German investment abroad 0 0 − 0Foreign investment in Germany − − − −
Balance 0 0 − 0
(d) Bundesbank German investment abroad 0 0 − 0 0Foreign investment in Germany − 0 − 0 0 − 0
Balance − 0 − 0 0 0
4 Change in the Bundesbank’s reserve assets at transaction values(increase: −) Not classifiable by region
Balance on financial account . . . .
Balance of unclassifiable transactionsIV Not classifiable by region
* Countries attributed to individual groups of countries according to the Office): exports by country of destination, imports by country of origin;most recent position; see also list of countries on pp 104−105. For further including supplementary trade items. — 2 Regional attribution of Germanfootnotes, see table on pp 6−7. — 1 Special trade (source: Federal Statistical investment abroad to the country of investment or debtor country,
14
DEUTSCHEBUNDESBANK
Balance of paymentsby regionAugust 2006
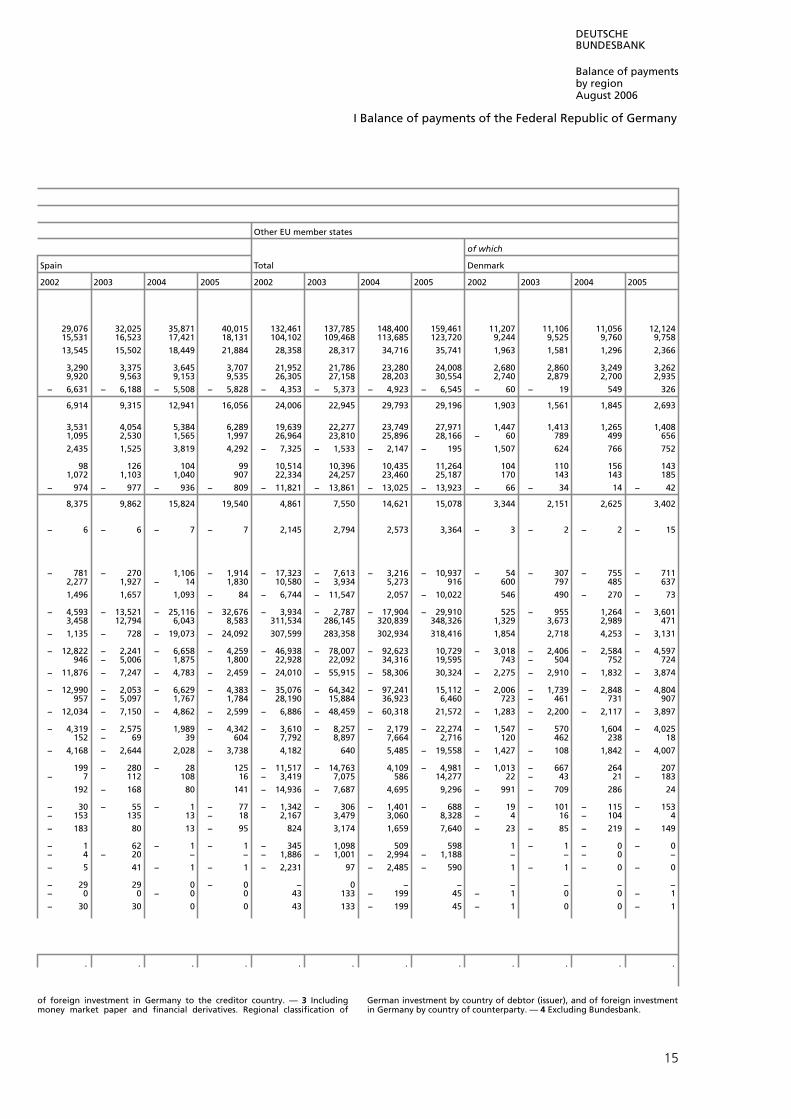
I Balance of payments of the Federal Republic of Germany
Other EU member states
of which
Spain Total Denmark
2002 2003 2004 2005 2002 2003 2004 2005 2002 2003 2004 2005
29,076 32,025 35,871 40,015 132,461 137,785 148,400 159,461 11,207 11,106 11,056 12,12415,531 16,523 17,421 18,131 104,102 109,468 113,685 123,720 9,244 9,525 9,760 9,758
13,545 15,502 18,449 21,884 28,358 28,317 34,716 35,741 1,963 1,581 1,296 2,366
3,290 3,375 3,645 3,707 21,952 21,786 23,280 24,008 2,680 2,860 3,249 3,2629,920 9,563 9,153 9,535 26,305 27,158 28,203 30,554 2,740 2,879 2,700 2,935
− 6,631 − 6,188 − 5,508 − 5,828 − 4,353 − 5,373 − 4,923 − 6,545 − 60 − 19 549 326
6,914 9,315 12,941 16,056 24,006 22,945 29,793 29,196 1,903 1,561 1,845 2,693
3,531 4,054 5,384 6,289 19,639 22,277 23,749 27,971 1,447 1,413 1,265 1,4081,095 2,530 1,565 1,997 26,964 23,810 25,896 28,166 − 60 789 499 656
2,435 1,525 3,819 4,292 − 7,325 − 1,533 − 2,147 − 195 1,507 624 766 752
98 126 104 99 10,514 10,396 10,435 11,264 104 110 156 1431,072 1,103 1,040 907 22,334 24,257 23,460 25,187 170 143 143 185
− 974 − 977 − 936 − 809 − 11,821 − 13,861 − 13,025 − 13,923 − 66 − 34 14 − 42
8,375 9,862 15,824 19,540 4,861 7,550 14,621 15,078 3,344 2,151 2,625 3,402
− 6 − 6 − 7 − 7 2,145 2,794 2,573 3,364 − 3 − 2 − 2 − 15
− 781 − 270 1,106 − 1,914 − 17,323 − 7,613 − 3,216 − 10,937 − 54 − 307 − 755 − 7112,277 1,927 − 14 1,830 10,580 − 3,934 5,273 916 600 797 485 637
1,496 1,657 1,093 − 84 − 6,744 − 11,547 2,057 − 10,022 546 490 − 270 − 73
− 4,593 − 13,521 − 25,116 − 32,676 − 3,934 − 2,787 − 17,904 − 29,910 525 − 955 1,264 − 3,6013,458 12,794 6,043 8,583 311,534 286,145 320,839 348,326 1,329 3,673 2,989 471
− 1,135 − 728 − 19,073 − 24,092 307,599 283,358 302,934 318,416 1,854 2,718 4,253 − 3,131
− 12,822 − 2,241 − 6,658 − 4,259 − 46,938 − 78,007 − 92,623 10,729 − 3,018 − 2,406 − 2,584 − 4,597946 − 5,006 1,875 1,800 22,928 22,092 34,316 19,595 743 − 504 752 724
− 11,876 − 7,247 − 4,783 − 2,459 − 24,010 − 55,915 − 58,306 30,324 − 2,275 − 2,910 − 1,832 − 3,874
− 12,990 − 2,053 − 6,629 − 4,383 − 35,076 − 64,342 − 97,241 15,112 − 2,006 − 1,739 − 2,848 − 4,804957 − 5,097 1,767 1,784 28,190 15,884 36,923 6,460 723 − 461 731 907
− 12,034 − 7,150 − 4,862 − 2,599 − 6,886 − 48,459 − 60,318 21,572 − 1,283 − 2,200 − 2,117 − 3,897
− 4,319 − 2,575 1,989 − 4,342 − 3,610 − 8,257 − 2,179 − 22,274 − 1,547 − 570 1,604 − 4,025152 − 69 39 604 7,792 8,897 7,664 2,716 120 462 238 18
− 4,168 − 2,644 2,028 − 3,738 4,182 640 5,485 − 19,558 − 1,427 − 108 1,842 − 4,007
199 − 280 − 28 125 − 11,517 − 14,763 4,109 − 4,981 − 1,013 − 667 264 207− 7 112 108 16 − 3,419 7,075 586 14,277 22 − 43 21 − 183
192 − 168 80 141 − 14,936 − 7,687 4,695 9,296 − 991 − 709 286 24
− 30 − 55 − 1 − 77 − 1,342 − 306 − 1,401 − 688 − 19 − 101 − 115 − 153− 153 135 13 − 18 2,167 3,479 3,060 8,328 − 4 16 − 104 4
− 183 80 13 − 95 824 3,174 1,659 7,640 − 23 − 85 − 219 − 149
− 1 62 − 1 − 1 − 345 1,098 509 598 1 − 1 − 0 − 0− 4 − 20 − − − 1,886 − 1,001 − 2,994 − 1,188 − − − 0 −
− 5 41 − 1 − 1 − 2,231 97 − 2,485 − 590 1 − 1 − 0 − 0
− 29 29 0 − 0 − 0 − − − − − −− 0 0 − 0 0 43 133 − 199 45 − 1 0 0 − 1
− 30 30 0 0 43 133 − 199 45 − 1 0 0 − 1
. . . . . . . . . . . .
of foreign investment in Germany to the creditor country. — 3 Including German investment by country of debtor (issuer), and of foreign investmentmoney market paper and financial derivatives. Regional classification of in Germany by country of counterparty. — 4 Excluding Bundesbank.
15

DEUTSCHEBUNDESBANKE U R O S Y S T E M
Balance of paymentsby regionAugust 2006
I Balance of payments of the Federal Republic of Germany 2 Regional breakdown 2002 − 2005 (cont’d) * € million
Europe (cont’d)
EU member states (25) (cont’d)
Other EU member states (cont’d)
of which
Poland
Item 2002 2003 2004 2005
Current accountI
1 Trade in goods and services(a) Trade in goods 1 Exports (fob) 16,228 16,347 18,685 21,820
Imports (fob) 13,671 15,336 15,519 15,860
Balance 2,557 1,012 3,166 5,960
(b) Services Receipts 1,240 1,261 1,487 1,708Expenditure 2,576 2,994 3,656 4,077
Balance − 1,336 − 1,733 − 2,168 − 2,369
Balance of trade in goods and services 1,220 − 721 997 3,591
2 Factor income Receipts 526 617 1,379 1,541Expenditure 2,489 2,476 2,605 3,260
Balance − 1,963 − 1,859 − 1,226 − 1,719
3 Current transfers Transfers from non-residents 884 924 1,019 1,244Transfers to non-residents 525 372 552 329
Balance 360 553 467 915
Balance on current account − 383 − 2,027 239 2,787
Balance of capital transfers and purchases/sales of intangibleIInon-produced assets − 5 − 6 − 6 − 6
Financial account (capital exports: −)III
1 Direct investment 2 German investment abroad − 55 − 94 − 664 − 482Foreign investment in Germany 20 217 72 183
Balance − 34 123 − 592 − 299
2 Portfolio investment 3 German investment abroad − 849 − 867 − 167 − 1,946Foreign investment in Germany − 1,024 − 554 39 898
Balance − 1,872 − 1,421 − 128 − 1,048
3 Other investment 2 German investment abroad − 370 329 − 705 − 106Foreign investment in Germany − 550 − 772 1,052 912
Balance − 919 − 443 346 806
(a) MFIs 4 German investment abroad − 68 29 − 605 − 1,006Foreign investment in Germany − 598 − 768 927 858
Balance − 666 − 739 322 − 148
German investment abroad 82 85 − 733 − 1,047of which: Long-termForeign investment in Germany − 65 2 56 − 12
Balance 17 87 − 677 − 1,059
(b) Enterprises and households German investment abroad − 354 231 − 225 − 291Foreign investment in Germany 48 − 3 125 54
Balance − 306 228 − 100 − 237
of which: Long-term German investment abroad − 296 199 − 162 − 51Foreign investment in Germany − 1 − 1 − 10 − 2
Balance − 297 198 − 172 − 52
(c) General government German investment abroad 53 68 124 1,192Foreign investment in Germany − − − −
Balance 53 68 124 1,192
(d) Bundesbank German investment abroad − − − −Foreign investment in Germany 0 − 1 − 0 − 0
Balance 0 − 1 − 0 − 0
4 Change in the Bundesbank’s reserve assets at transaction values(increase: −) Not classifiable by region
Balance on financial account . . . .
Balance of unclassifiable transactionsIV Not classifiable by region
* Countries attributed to individual groups of countries according to the Office): exports by country of destination, imports by country of origin;most recent position; see also list of countries on pp 104−105. For further including supplementary trade items. — 2 Regional attribution of Germanfootnotes, see table on pp 6−7. — 1 Special trade (source: Federal Statistical investment abroad to the country of investment or debtor country,
16

DEUTSCHEBUNDESBANK
Balance of paymentsby regionAugust 2006
I Balance of payments of the Federal Republic of Germany
Sweden Czech Republic Hungary
2002 2003 2004 2005 2002 2003 2004 2005 2002 2003 2004 2005
13,303 14,011 15,472 16,901 15,450 16,392 17,324 18,538 11,156 11,831 12,811 13,5458,454 9,119 9,736 10,884 16,031 17,438 16,421 17,647 11,932 12,083 13,139 14,130
4,849 4,892 5,735 6,017 − 581 − 1,046 903 891 − 776 − 252 − 328 − 585
/ / / / 999 1,027 1,197 1,345 590 782 942 1,0952,237 2,416 2,516 2,587 1,610 2,085 2,320 2,716 1,286 1,325 1,398 1,272
− 126 − 182 − 314 − 305 − 611 − 1,058 − 1,123 − 1,371 − 695 − 543 − 456 − 176
4,723 4,710 5,422 5,712 − 1,192 − 2,104 − 220 − 481 − 1,472 − 795 − 785 − 761
1,469 1,484 1,913 2,251 518 654 976 1,178 950 757 1,513 1,8831,121 655 1,061 1,302 589 460 383 338 176 251 120 136
348 829 852 949 − 71 193 593 840 774 505 1,393 1,747
43 45 56 64 219 205 162 157 25 33 24 31171 133 159 179 157 151 114 82 126 134 140 107
− 128 − 88 − 104 − 115 62 55 48 76 − 101 − 101 − 116 − 77
4,943 5,450 6,170 6,546 − 1,202 − 1,856 421 434 − 799 − 390 492 910
− 4 − 3 − 4 − 6 − 3 − 2 − 3 − 3 − 3 − 2 − 2 − 2
− 1,078 − 2,142 − 4,772 − 294 − 535 1,064 − 236 − 562 1,021 609 − 1,101 − 1,380788 384 1,621 771 111 − 36 124 30 − 56 − 33 169 3,365
− 291 − 1,758 − 3,151 477 − 425 1,028 − 112 − 533 965 576 − 932 1,985
− 1,464 7 − 713 − 1,907 − 35 − 262 − 695 − 522 − 290 − 1,680 0 − 1,221725 2,283 2,884 1,326 2,926 2,047 2,365 1,669 987 1,041 1,603 1,991
− 739 2,290 2,171 − 581 2,892 1,785 1,669 1,147 697 − 639 1,603 769
− 1,987 1,253 − 8,419 5,265 − 596 − 270 267 − 1,135 − 631 − 657 − 549 − 5052,619 − 2,853 5,764 2,021 361 − 65 466 982 166 113 351 442
632 − 1,600 − 2,654 7,285 − 235 − 335 733 − 153 − 465 − 543 − 198 − 63
− 1,843 1,776 − 8,706 5,250 − 634 − 294 602 − 1,033 − 600 − 634 − 185 − 7002,316 − 2,262 5,680 1,800 339 − 120 498 762 103 − 11 61 650
474 − 486 − 3,026 7,050 − 295 − 414 1,100 − 271 − 497 − 645 − 124 − 50
− 624 − 191 392 267 37 31 86 − 304 − 391 − 617 70 − 590163 250 1,256 3,892 − 60 45 − 31 137 22 − 16 − 7 130
− 460 59 1,648 4,159 − 23 76 55 − 167 − 369 − 633 63 − 460
− 144 − 529 288 14 38 25 − 334 − 102 − 31 − 22 − 364 195305 − 592 56 236 22 55 − 32 220 62 124 290 − 208
161 − 1,121 343 251 60 80 − 366 118 31 102 − 74 − 13
− 12 5 − 2 3 − 16 − 4 − 22 10 − 12 − 18 − 43 − 10154 − 448 − 29 − 3 − 1 − 2 − 1 − 5 − 1 0 − 2 − 2
142 − 443 − 31 − 0 − 17 − 7 − 23 5 − 13 − 17 − 45 − 12
− 0 6 − 0 0 − 0 − 0 − 0 0 − 0 − 0 − 0 − 0− − 30 − 15 − − − − − − − 0 −
− 0 6 30 − 15 − 0 − 0 − 0 0 − 0 − 0 − 0 − 0
− − − − − − − − − − − −− 2 1 − 1 0 0 − 0 0 0 0 − 0 − 0 0
− 2 1 − 1 0 0 − 0 0 0 0 − 0 − 0 0
. . . . . . . . . . . .
of foreign investment in Germany to the creditor country. — 3 Including German investment by country of debtor (issuer), and of foreign investmentmoney market paper and financial derivatives. Regional classification of in Germany by country of counterparty. — 4 Excluding Bundesbank.
17

DEUTSCHEBUNDESBANKE U R O S Y S T E M
Balance of paymentsby regionAugust 2006
I Balance of payments of the Federal Republic of Germany 2 Regional breakdown 2002 − 2005 (cont’d) * € million
Europe (cont’d)
EU member states (25) (cont’d)
Other EU member states (cont’d)
of which
United Kingdom
Item 2002 2003 2004 2005
Current accountI
1 Trade in goods and services(a) Trade in goods 1 Exports (fob) 54,288 55,866 60,477 62,867
Imports (fob) 34,629 33,326 36,294 42,219
Balance 19,659 22,540 24,183 20,649
(b) Services Receipts 12,041 11,825 11,950 11,894Expenditure 14,138 13,551 13,495 14,627
Balance − 2,097 − 1,726 − 1,544 − 2,734
Balance of trade in goods and services 17,561 20,815 22,639 17,915
2 Factor income Receipts 13,818 16,304 15,520 18,213Expenditure 21,368 18,005 20,004 21,139
Balance − 7,550 − 1,702 − 4,484 − 2,926
3 Current transfers Transfers from non-residents 999 1,034 960 1,395Transfers to non-residents 1,252 1,410 1,433 1,330
Balance − 253 − 376 − 473 65
Balance on current account 9,759 18,737 17,682 15,055
Balance of capital transfers and purchases/sales of intangibleIInon-produced assets − 17 − 14 − 16 − 15
Financial account (capital exports: −)III
1 Direct investment 2 German investment abroad − 14,532 − 7,719 5,012 − 6,226Foreign investment in Germany 9,117 − 5,342 2,862 − 4,359
Balance − 5,415 − 13,061 7,873 − 10,585
2 Portfolio investment 3 German investment abroad − 2,104 3,003 − 13,392 − 19,104Foreign investment in Germany 303,889 275,056 308,514 337,964
Balance 301,785 278,059 295,122 318,860
3 Other investment 2 German investment abroad − 40,617 − 75,219 − 79,281 13,847Foreign investment in Germany 18,179 24,078 22,696 10,558
Balance − 22,438 − 51,141 − 56,585 24,404
(a) MFIs 4 German investment abroad − 30,344 − 62,446 − 84,426 19,252Foreign investment in Germany 22,418 17,077 24,020 − 1,957
Balance − 7,926 − 45,370 − 60,406 17,296
German investment abroad − 1,658 − 6,556 − 2,604 − 15,295of which: Long-termForeign investment in Germany 5,003 5,613 2,691 − 4,805
Balance 3,346 − 943 88 − 20,099
(b) Enterprises and households German investment abroad − 9,856 − 13,798 4,759 − 4,821Foreign investment in Germany − 3,876 6,994 − 211 13,547
Balance − 13,733 − 6,804 4,548 8,725
of which: Long-term German investment abroad − 985 − 325 − 1,034 − 467Foreign investment in Germany 1,970 3,475 3,106 7,914
Balance 985 3,150 2,072 7,447
(c) General government German investment abroad − 417 1,025 386 − 585Foreign investment in Germany − 363 8 − 1,113 − 1,032
Balance − 780 1,033 − 727 − 1,616
(d) Bundesbank German investment abroad − − − −Foreign investment in Germany 0 − 0 0 − 1
Balance 0 − 0 0 − 1
4 Change in the Bundesbank’s reserve assets at transaction values(increase: −) Not classifiable by region
Balance on financial account . . . .
Balance of unclassifiable transactionsIV Not classifiable by region
* Countries attributed to individual groups of countries according to the Office): exports by country of destination, imports by country of origin;most recent position; see also list of countries on pp 104−105. For further including supplementary trade items. — 2 Regional attribution of Germanfootnotes, see table on pp 6−7. — 1 Special trade (source: Federal Statistical investment abroad to the country of investment or debtor country,
18
DEUTSCHEBUNDESBANK
Balance of paymentsby regionAugust 2006
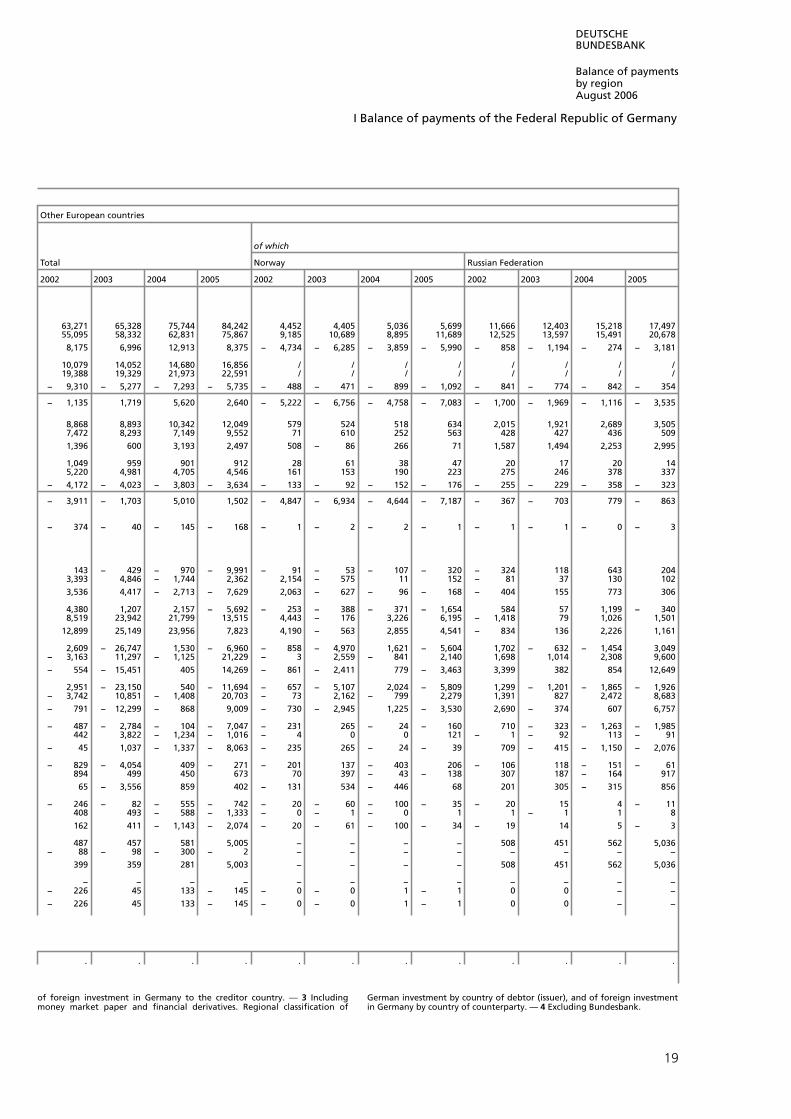
I Balance of payments of the Federal Republic of Germany
Other European countries
of which
Total Norway Russian Federation
2002 2003 2004 2005 2002 2003 2004 2005 2002 2003 2004 2005
63,271 65,328 75,744 84,242 4,452 4,405 5,036 5,699 11,666 12,403 15,218 17,49755,095 58,332 62,831 75,867 9,185 10,689 8,895 11,689 12,525 13,597 15,491 20,678
8,175 6,996 12,913 8,375 − 4,734 − 6,285 − 3,859 − 5,990 − 858 − 1,194 − 274 − 3,181
10,079 14,052 14,680 16,856 / / / / / / / /19,388 19,329 21,973 22,591 / / / / / / / /
− 9,310 − 5,277 − 7,293 − 5,735 − 488 − 471 − 899 − 1,092 − 841 − 774 − 842 − 354
− 1,135 1,719 5,620 2,640 − 5,222 − 6,756 − 4,758 − 7,083 − 1,700 − 1,969 − 1,116 − 3,535
8,868 8,893 10,342 12,049 579 524 518 634 2,015 1,921 2,689 3,5057,472 8,293 7,149 9,552 71 610 252 563 428 427 436 509
1,396 600 3,193 2,497 508 − 86 266 71 1,587 1,494 2,253 2,995
1,049 959 901 912 28 61 38 47 20 17 20 145,220 4,981 4,705 4,546 161 153 190 223 275 246 378 337
− 4,172 − 4,023 − 3,803 − 3,634 − 133 − 92 − 152 − 176 − 255 − 229 − 358 − 323
− 3,911 − 1,703 5,010 1,502 − 4,847 − 6,934 − 4,644 − 7,187 − 367 − 703 779 − 863
− 374 − 40 − 145 − 168 − 1 − 2 − 2 − 1 − 1 − 1 − 0 − 3
143 − 429 − 970 − 9,991 − 91 − 53 − 107 − 320 − 324 118 643 2043,393 4,846 − 1,744 2,362 2,154 − 575 11 152 − 81 37 130 102
3,536 4,417 − 2,713 − 7,629 2,063 − 627 − 96 − 168 − 404 155 773 306
4,380 1,207 2,157 − 5,692 − 253 − 388 − 371 − 1,654 584 57 1,199 − 3408,519 23,942 21,799 13,515 4,443 − 176 3,226 6,195 − 1,418 79 1,026 1,501
12,899 25,149 23,956 7,823 4,190 − 563 2,855 4,541 − 834 136 2,226 1,161
2,609 − 26,747 1,530 − 6,960 − 858 − 4,970 1,621 − 5,604 1,702 − 632 − 1,454 3,049− 3,163 11,297 − 1,125 21,229 − 3 2,559 − 841 2,140 1,698 1,014 2,308 9,600
− 554 − 15,451 405 14,269 − 861 − 2,411 779 − 3,463 3,399 382 854 12,649
2,951 − 23,150 540 − 11,694 − 657 − 5,107 2,024 − 5,809 1,299 − 1,201 − 1,865 − 1,926− 3,742 10,851 − 1,408 20,703 − 73 2,162 − 799 2,279 1,391 827 2,472 8,683
− 791 − 12,299 − 868 9,009 − 730 − 2,945 1,225 − 3,530 2,690 − 374 607 6,757
− 487 − 2,784 − 104 − 7,047 − 231 265 − 24 − 160 710 − 323 − 1,263 − 1,985442 3,822 − 1,234 − 1,016 − 4 0 0 121 − 1 − 92 113 − 91
− 45 1,037 − 1,337 − 8,063 − 235 265 − 24 − 39 709 − 415 − 1,150 − 2,076
− 829 − 4,054 409 − 271 − 201 137 − 403 206 − 106 118 − 151 − 61894 499 450 673 70 397 − 43 − 138 307 187 − 164 917
65 − 3,556 859 402 − 131 534 − 446 68 201 305 − 315 856
− 246 − 82 − 555 − 742 − 20 − 60 − 100 − 35 − 20 15 4 − 11408 493 − 588 − 1,333 − 0 − 1 − 0 1 1 − 1 1 8
162 411 − 1,143 − 2,074 − 20 − 61 − 100 − 34 − 19 14 5 − 3
487 457 581 5,005 − − − − 508 451 562 5,036− 88 − 98 − 300 − 2 − − − − − − − −
399 359 281 5,003 − − − − 508 451 562 5,036
− − − − − − − − − − − −− 226 45 133 − 145 − 0 − 0 1 − 1 0 0 − −
− 226 45 133 − 145 − 0 − 0 1 − 1 0 0 − −
. . . . . . . . . . . .
of foreign investment in Germany to the creditor country. — 3 Including German investment by country of debtor (issuer), and of foreign investmentmoney market paper and financial derivatives. Regional classification of in Germany by country of counterparty. — 4 Excluding Bundesbank.
19

DEUTSCHEBUNDESBANKE U R O S Y S T E M
Balance of paymentsby regionAugust 2006
I Balance of payments of the Federal Republic of Germany 2 Regional breakdown 2002 − 2005 (cont’d) * € million
Europe (cont’d)
Other European countries (cont’d)
of which
Switzerland
Item 2002 2003 2004 2005
Current accountI
1 Trade in goods and services(a) Trade in goods 1 Exports (fob) 27,350 26,664 28,331 30,351
Imports (fob) 20,357 20,254 22,892 27,358
Balance 6,993 6,410 5,439 2,993
(b) Services Receipts 6,547 10,153 10,371 11,769Expenditure 9,055 8,835 10,222 10,035
Balance − 2,508 1,318 149 1,733
Balance of trade in goods and services 4,485 7,728 5,588 4,726
2 Factor income Receipts 4,704 4,560 4,912 5,328Expenditure 5,670 5,088 4,529 4,973
Balance − 966 − 528 383 354
3 Current transfers Transfers from non-residents 846 689 686 631Transfers to non-residents 1,315 1,322 1,313 1,348
Balance − 469 − 633 − 627 − 717
Balance on current account 3,050 6,567 5,344 4,363
Balance of capital transfers and purchases/sales of intangibleIInon-produced assets − 44 − 31 − 23 − 56
Financial account (capital exports: −)III
1 Direct investment 2 German investment abroad 804 761 − 1,335 − 4,774Foreign investment in Germany 1,697 5,119 81 3,284
Balance 2,501 5,880 − 1,255 − 1,491
2 Portfolio investment 3 German investment abroad 2,622 2,048 1,275 1,789Foreign investment in Germany 5,244 19,109 19,807 342
Balance 7,866 21,157 21,082 2,131
3 Other investment 2 German investment abroad 1,537 − 14,856 5,276 − 1,149Foreign investment in Germany − 1,724 1,272 − 2,279 7,531
Balance − 187 − 13,584 2,996 6,382
(a) MFIs 4 German investment abroad 2,237 − 13,254 5,745 − 1,037Foreign investment in Germany − 2,392 1,912 − 2,011 7,004
Balance − 154 − 11,342 3,734 5,967
German investment abroad − 391 − 460 2,021 − 1,847of which: Long-termForeign investment in Germany 362 103 − 224 266
Balance − 29 − 357 1,797 − 1,581
(b) Enterprises and households German investment abroad − 699 − 1,600 − 468 − 46Foreign investment in Germany 757 − 543 − 210 482
Balance 59 − 2,143 − 678 436
of which: Long-term German investment abroad − 231 − 51 − 376 − 506Foreign investment in Germany 421 − 140 − 695 − 408
Balance 189 − 191 − 1,071 − 915
(c) General government German investment abroad − 1 − 1 − 1 − 67Foreign investment in Germany − 88 − 98 − 62 49
Balance − 89 − 99 − 63 − 18
(d) Bundesbank German investment abroad − − − −Foreign investment in Germany − 2 0 3 − 3
Balance − 2 0 3 − 3
4 Change in the Bundesbank’s reserve assets at transaction values(increase: −) Not classifiable by region
Balance on financial account . . . .
Balance of unclassifiable transactionsIV Not classifiable by region
* Countries attributed to individual groups of countries according to the Office): exports by country of destination, imports by country of origin;most recent position; see also list of countries on pp 104−105. For further including supplementary trade items. — 2 Regional attribution of Germanfootnotes, see table on pp 6−7. — 1 Special trade (source: Federal Statistical investment abroad to the country of investment or debtor country,
20

DEUTSCHEBUNDESBANK
Balance of paymentsby regionAugust 2006
I Balance of payments of the Federal Republic of Germany
Africa America
Turkey Total Total
2002 2003 2004 2005 2002 2003 2004 2005 2002 2003 2004 2005
7,452 8,788 11,667 12,644 11,254 12,005 13,636 14,743 86,951 77,424 83,354 91,3086,719 7,097 7,786 7,995 9,158 9,574 10,391 12,413 51,864 50,960 54,823 58,888
732 1,691 3,881 4,649 2,095 2,431 3,244 2,330 35,087 26,465 28,531 32,420
611 654 759 793 2,132 2,266 2,233 2,613 26,045 22,082 22,018 24,0693,928 3,666 4,236 4,510 3,650 3,120 3,605 3,985 25,538 23,823 23,574 24,584
− 3,317 − 3,012 − 3,477 − 3,717 − 1,518 − 854 − 1,372 − 1,371 508 − 1,741 − 1,556 − 515
− 2,585 − 1,321 404 932 577 1,577 1,873 958 35,595 24,723 26,975 31,906
730 602 728 900 1,049 1,021 1,081 1,270 15,093 14,085 17,059 20,071406 225 127 119 379 346 377 524 13,339 11,487 12,024 14,283
324 378 601 781 670 675 704 746 1,754 2,598 5,035 5,788
10 10 8 10 182 332 125 27 1,765 1,363 906 9712,112 1,805 1,195 1,183 574 629 554 653 4,719 3,481 3,259 3,599
− 2,102 − 1,795 − 1,187 − 1,173 − 392 − 297 − 429 − 626 − 2,954 − 2,119 − 2,354 − 2,629
− 4,363 − 2,739 − 181 540 856 1,955 2,148 1,078 34,395 25,203 29,657 35,065
− 19 − 1 − 18 − 11 − 656 − 919 − 660 − 1,300 − 498 − 799 − 589 − 515
87 − 325 − 369 − 571 349 283 − 146 635 5,833 − 8,694 5,042 2,32033 − 21 − 35 37 − 299 110 141 − 172 5,971 1,835 530 − 444
120 − 346 − 404 − 534 50 393 − 5 463 11,803 − 6,858 5,571 1,876
2,291 1,090 738 − 182 39 − 428 − 483 877 − 3,743 269 − 16,648 − 24,214− 1,931 1,175 − 2,503 2,436 814 2,877 3,229 5,361 7,566 6,558 − 9,725 7,205
359 2,265 − 1,765 2,255 853 2,449 2,746 6,238 3,823 6,827 − 26,373 − 17,009
580 − 422 − 80 − 1,164 40 − 0 528 − 218 − 25,111 − 16,389 495 − 34,146− 1,123 − 572 1,005 337 − 515 1,582 3,081 7,767 − 14,388 − 12,376 − 17,772 − 15,979
− 543 − 994 925 − 828 − 475 1,582 3,609 7,548 − 39,499 − 28,766 − 17,277 − 50,125
360 − 302 − 431 − 1,134 351 − 484 362 − 488 − 24,741 − 12,490 563 − 33,935− 878 − 120 672 429 − 259 1,323 2,727 7,924 − 14,641 − 15,035 − 17,393 − 16,741
− 519 − 422 241 − 705 92 839 3,089 7,436 − 39,382 − 27,525 − 16,830 − 50,676
− 291 32 − 29 − 669 − 117 − 445 148 17 − 6,839 − 10,214 1,286 − 5,871− 35 − 11 − 22 27 − 83 − 91 − 6 − 26 10,117 − 15,544 − 9,387 − 14,059
− 326 21 − 51 − 642 − 200 − 536 142 − 9 3,279 − 25,758 − 8,100 − 19,930
221 − 123 347 − 31 − 299 83 − 18 − 296 − 700 − 4,187 − 424 − 345− 243 − 452 333 − 93 − 213 231 339 − 249 − 621 1,013 1,950 233
− 22 − 575 680 − 124 − 512 314 320 − 545 − 1,322 − 3,174 1,526 − 112
34 11 93 55 − 118 − 550 − 57 121 19 − 582 − 708 − 716− 1 − 1 − 1 − 3 − 3 − 4 4 − 5 − 233 802 1,281 − 1,452
33 9 92 52 − 121 − 555 − 53 116 − 214 220 573 − 2,168
− 1 3 4 2 − 12 401 185 565 330 288 356 135− − − − − − 1 − − 51 − 39 147 108
− 1 3 4 2 − 12 401 186 565 279 249 503 243
− − − − − − − − − − − −− 1 0 − 0 1 − 42 28 14 92 925 1,684 − 2,477 421
− 1 0 − 0 1 − 42 28 14 92 925 1,684 − 2,477 421
. . . . . . . . . . . .
of foreign investment in Germany to the creditor country. — 3 Including German investment by country of debtor (issuer), and of foreign investmentmoney market paper and financial derivatives. Regional classification of in Germany by country of counterparty. — 4 Excluding Bundesbank.
21

DEUTSCHEBUNDESBANKE U R O S Y S T E M
Balance of paymentsby regionAugust 2006
I Balance of payments of the Federal Republic of Germany 2 Regional breakdown 2002 − 2005 (cont’d) * € million
America (cont’d)
North America
Total
Item 2002 2003 2004 2005
Current accountI
1 Trade in goods and services(a) Trade in goods 1 Exports (fob) 70,281 62,675 66,641 71,266
Imports (fob) 39,643 38,078 40,100 40,602
Balance 30,638 24,597 26,541 30,665
(b) Services Receipts 23,767 18,913 18,550 19,905Expenditure 21,763 19,665 19,985 20,475
Balance 2,005 − 753 − 1,435 − 570
Balance of trade in goods and services 32,643 23,845 25,107 30,094
2 Factor income Receipts 11,256 10,624 12,378 14,218Expenditure 11,070 9,084 9,482 11,435
Balance 185 1,540 2,896 2,783
3 Current transfers Transfers from non-residents 1,333 1,130 838 911Transfers to non-residents 4,242 2,928 2,845 3,163
Balance − 2,909 − 1,798 − 2,007 − 2,252
Balance on current account 29,919 23,587 25,995 30,625
Balance of capital transfers and purchases/sales of intangibleIInon-produced assets − 81 − 87 − 99 − 93
Financial account (capital exports: −)III
1 Direct investment 2 German investment abroad 3,695 − 8,193 6,720 3,283Foreign investment in Germany 3,734 5,660 3,010 1,180
Balance 7,428 − 2,533 9,730 4,463
2 Portfolio investment 3 German investment abroad − 178 − 6,485 − 11,221 − 20,848Foreign investment in Germany 7,680 5,967 − 11,293 4,346
Balance 7,502 − 518 − 22,514 − 16,503
3 Other investment 2 German investment abroad − 17,343 − 17,672 − 4,697 − 6,840Foreign investment in Germany − 25,257 − 8,902 − 13,387 − 6,629
Balance − 42,601 − 26,574 − 18,084 − 13,469
(a) MFIs 4 German investment abroad − 17,518 − 13,906 − 3,524 − 7,435Foreign investment in Germany − 26,198 − 10,535 − 12,096 − 9,387
Balance − 43,716 − 24,441 − 15,620 − 16,822
German investment abroad − 6,098 − 10,931 2,160 − 5,174of which: Long-termForeign investment in Germany 4,714 − 12,525 − 12,550 − 8,297
Balance − 1,383 − 23,456 − 10,390 − 13,472
(b) Enterprises and households German investment abroad − 116 − 4,045 − 1,463 465Foreign investment in Germany 23 − 1 1,006 2,229
Balance − 93 − 4,046 − 457 2,694
of which: Long-term German investment abroad − 21 − 519 − 588 − 537Foreign investment in Germany 51 341 337 729
Balance 30 − 178 − 250 192
(c) General government German investment abroad 291 279 291 130Foreign investment in Germany − 26 − 39 163 108
Balance 265 240 453 238
(d) Bundesbank German investment abroad − − − −Foreign investment in Germany 944 1,673 − 2,460 421
Balance 944 1,673 − 2,460 421
4 Change in the Bundesbank’s reserve assets at transaction values(increase: −) Not classifiable by region
Balance on financial account . . . .
Balance of unclassifiable transactionsIV Not classifiable by region
* Countries attributed to individual groups of countries according to the Office): exports by country of destination, imports by country of origin;most recent position; see also list of countries on pp 104−105. For further including supplementary trade items. — 2 Regional attribution of Germanfootnotes, see table on pp 6−7. — 1 Special trade (source: Federal Statistical investment abroad to the country of investment or debtor country,
22

DEUTSCHEBUNDESBANK
Balance of paymentsby regionAugust 2006
I Balance of payments of the Federal Republic of Germany
Central America
of which
Canada United States Total
2002 2003 2004 2005 2002 2003 2004 2005 2002 2003 2004 2005
5,333 4,548 4,505 5,095 64,946 58,125 62,133 66,169 7,093 6,112 6,533 7,6442,332 2,174 2,130 2,200 37,296 35,894 37,958 38,388 2,438 2,837 2,590 3,037
3,000 2,374 2,375 2,895 27,650 22,231 24,176 27,781 4,654 3,275 3,943 4,607
/ / / / 22,686 17,935 17,507 18,812 921 1,694 1,382 1,892/ / / / 20,417 18,268 18,599 18,937 / / / /
− 261 − 419 − 342 − 444 2,269 − 333 − 1,091 − 124 − 1,260 − 943 − 789 − 656
2,739 1,955 2,033 2,451 29,919 21,897 23,084 27,656 3,394 2,332 3,154 3,951
1,181 1,138 903 1,008 10,075 9,486 11,474 13,210 2,870 2,654 3,190 4,049376 506 359 355 10,695 8,578 9,123 11,080 2,010 2,184 2,374 2,663
805 633 545 653 − 620 907 2,351 2,129 860 470 816 1,386
43 54 116 38 1,290 1,076 721 872 391 198 37 29353 353 386 315 3,889 2,575 2,458 2,848 158 267 148 128
− 310 − 299 − 270 − 276 − 2,599 − 1,499 − 1,737 − 1,976 233 − 69 − 112 − 99
3,234 2,289 2,308 2,828 26,700 21,305 23,698 27,810 4,487 2,734 3,858 5,237
− 18 − 22 − 19 − 19 − 62 − 66 − 80 − 74 − 147 − 143 − 243 − 104
796 441 − 359 − 2,308 2,899 − 8,634 7,080 5,591 1,698 − 993 − 70 50338 251 297 762 3,695 5,410 2,713 419 2,202 − 3,693 − 2,524 − 1,905
834 692 − 62 − 1,547 6,594 − 3,225 9,793 6,010 3,900 − 4,686 − 2,594 − 1,403
1,252 − 380 − 1,886 − 1,986 − 1,431 − 6,105 − 9,335 − 18,853 − 3,620 5,960 − 5,475 − 3,815− 803 144 549 72 8,483 5,823 − 11,842 4,274 454 268 487 2,701
449 − 236 − 1,337 − 1,914 7,052 − 282 − 21,177 − 14,579 − 3,166 6,229 − 4,988 − 1,114
− 141 248 − 564 − 1,476 − 17,199 − 17,920 − 4,141 − 5,365 − 9,572 115 3,856 − 28,334168 743 − 229 169 − 25,425 − 9,643 − 13,159 − 6,800 11,792 − 3,048 − 3,853 − 8,224
27 990 − 793 − 1,306 − 42,625 − 27,563 − 17,299 − 12,165 2,220 − 2,933 3 − 36,558
− 42 391 − 135 − 1,520 − 17,474 − 14,297 − 3,397 − 5,915 − 8,508 833 2,880 − 27,675− 62 622 − 632 144 − 26,136 − 11,156 − 11,464 − 9,533 12,318 − 4,269 − 4,464 − 5,952
− 103 1,013 − 767 − 1,377 − 43,610 − 25,453 − 14,861 − 15,448 3,810 − 3,436 − 1,584 − 33,627
4 272 20 − 591 − 6,099 − 11,203 2,131 − 4,584 − 1,478 128 − 1,956 − 1,7101 − 2 − 46 − 1 4,713 − 12,523 − 12,504 − 8,296 5,450 − 2,959 3,182 − 5,732
6 270 − 26 − 593 − 1,386 − 23,726 − 10,373 − 12,880 3,972 − 2,831 1,226 − 7,442
− 99 − 144 − 427 43 − 17 − 3,901 − 1,036 422 − 1,038 − 685 1,006 − 676233 120 404 26 − 210 − 121 602 2,204 − 482 1,210 643 − 2,271
133 − 24 − 23 69 − 227 − 4,023 − 434 2,626 − 1,520 525 1,648 − 2,948
− 36 17 − 23 − 51 15 − 536 − 565 − 486 32 − 78 − 112 − 19832 − 14 − 71 − 11 19 356 409 740 − 281 439 945 − 2,163
− 4 3 − 94 − 62 34 − 180 − 156 254 − 249 361 833 − 2,361
− 0 0 − 2 2 291 279 293 128 − 27 − 33 − 29 17− − − − − 26 − 39 163 108 − 26 − − 15 −
− 0 0 − 2 2 265 240 455 236 − 52 − 33 − 44 17
− − − − − − − − − − − −− 3 1 − 1 − 0 946 1,673 − 2,459 421 − 18 11 − 17 − 1
− 3 1 − 1 − 0 946 1,673 − 2,459 421 − 18 11 − 17 − 1
. . . . . . . . . . . .
of foreign investment in Germany to the creditor country. — 3 Including German investment by country of debtor (issuer), and of foreign investmentmoney market paper and financial derivatives. Regional classification of in Germany by country of counterparty. — 4 Excluding Bundesbank.
23
DEUTSCHEBUNDESBANKE U R O S Y S T E M
Balance of paymentsby regionAugust 2006
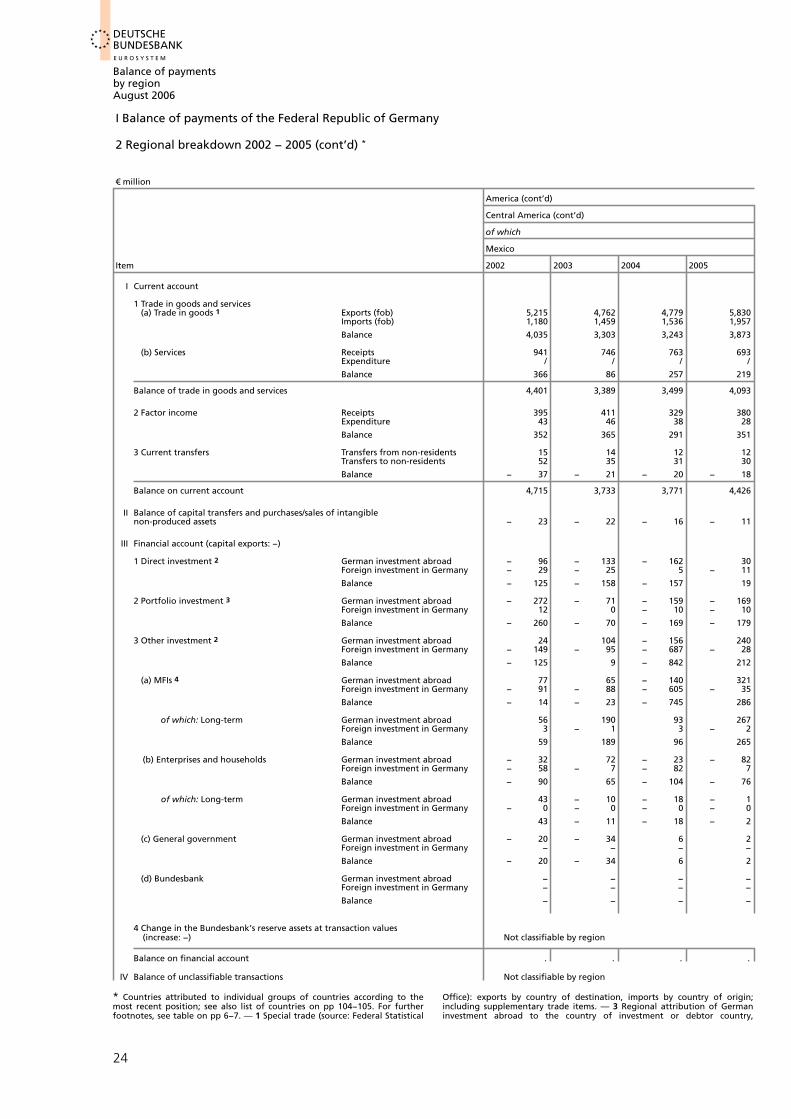
I Balance of payments of the Federal Republic of Germany 2 Regional breakdown 2002 − 2005 (cont’d) * € million
America (cont’d)
Central America (cont’d)
of which
Mexico
Item 2002 2003 2004 2005
Current accountI
1 Trade in goods and services(a) Trade in goods 1 Exports (fob) 5,215 4,762 4,779 5,830
Imports (fob) 1,180 1,459 1,536 1,957
Balance 4,035 3,303 3,243 3,873
(b) Services Receipts 941 746 763 693Expenditure / / / /
Balance 366 86 257 219
Balance of trade in goods and services 4,401 3,389 3,499 4,093
2 Factor income Receipts 395 411 329 380Expenditure 43 46 38 28
Balance 352 365 291 351
3 Current transfers Transfers from non-residents 15 14 12 12Transfers to non-residents 52 35 31 30
Balance − 37 − 21 − 20 − 18
Balance on current account 4,715 3,733 3,771 4,426
Balance of capital transfers and purchases/sales of intangibleIInon-produced assets − 23 − 22 − 16 − 11
Financial account (capital exports: −)III
1 Direct investment 2 German investment abroad − 96 − 133 − 162 30Foreign investment in Germany − 29 − 25 5 − 11
Balance − 125 − 158 − 157 19
2 Portfolio investment 3 German investment abroad − 272 − 71 − 159 − 169Foreign investment in Germany 12 0 − 10 − 10
Balance − 260 − 70 − 169 − 179
3 Other investment 2 German investment abroad 24 104 − 156 240Foreign investment in Germany − 149 − 95 − 687 − 28
Balance − 125 9 − 842 212
(a) MFIs 4 German investment abroad 77 65 − 140 321Foreign investment in Germany − 91 − 88 − 605 − 35
Balance − 14 − 23 − 745 286
German investment abroad 56 190 93 267of which: Long-termForeign investment in Germany 3 − 1 3 − 2
Balance 59 189 96 265
(b) Enterprises and households German investment abroad − 32 72 − 23 − 82Foreign investment in Germany − 58 − 7 − 82 7
Balance − 90 65 − 104 − 76
of which: Long-term German investment abroad 43 − 10 − 18 − 1Foreign investment in Germany − 0 − 0 − 0 − 0
Balance 43 − 11 − 18 − 2
(c) General government German investment abroad − 20 − 34 6 2Foreign investment in Germany − − − −
Balance − 20 − 34 6 2
(d) Bundesbank German investment abroad − − − −Foreign investment in Germany − − − −
Balance − − − −
4 Change in the Bundesbank’s reserve assets at transaction values(increase: −) Not classifiable by region
Balance on financial account . . . .
Balance of unclassifiable transactionsIV Not classifiable by region
* Countries attributed to individual groups of countries according to the Office): exports by country of destination, imports by country of origin;most recent position; see also list of countries on pp 104−105. For further including supplementary trade items. — 3 Regional attribution of Germanfootnotes, see table on pp 6−7. — 1 Special trade (source: Federal Statistical investment abroad to the country of investment or debtor country,
24
DEUTSCHEBUNDESBANK
Balance of paymentsby regionAugust 2006
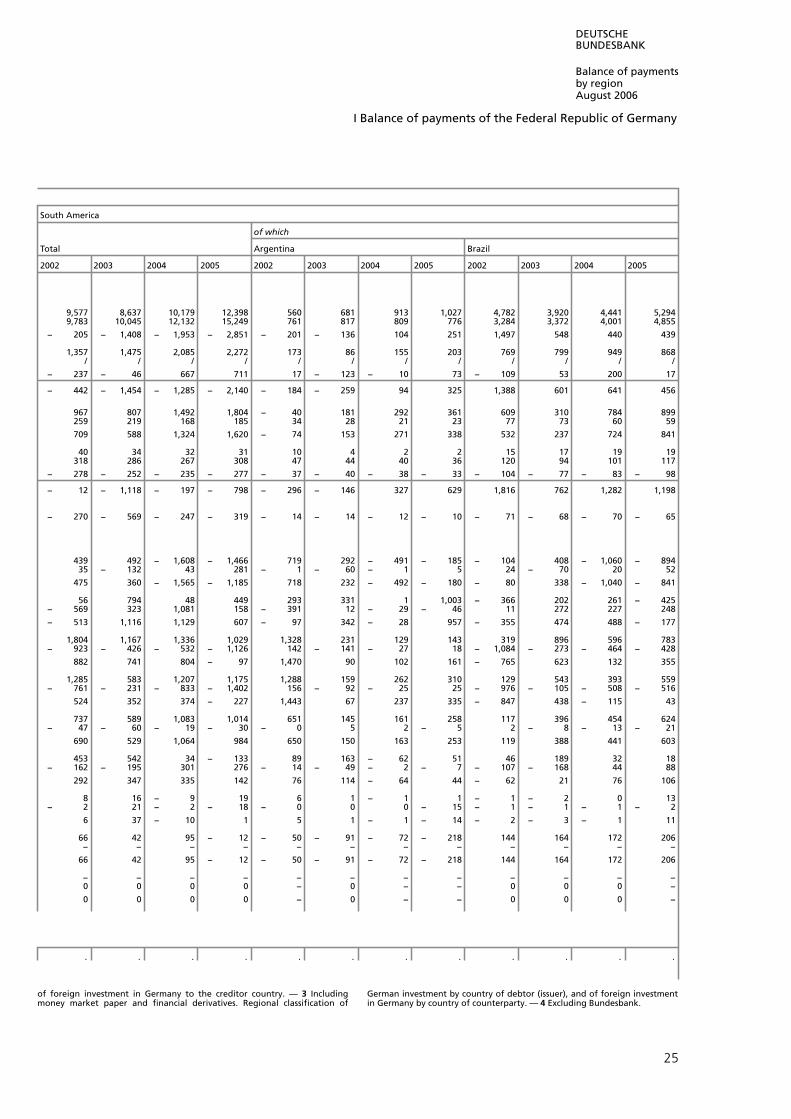
I Balance of payments of the Federal Republic of Germany
South America
of which
Total Argentina Brazil
2002 2003 2004 2005 2002 2003 2004 2005 2002 2003 2004 2005
9,577 8,637 10,179 12,398 560 681 913 1,027 4,782 3,920 4,441 5,2949,783 10,045 12,132 15,249 761 817 809 776 3,284 3,372 4,001 4,855
− 205 − 1,408 − 1,953 − 2,851 − 201 − 136 104 251 1,497 548 440 439
1,357 1,475 2,085 2,272 173 86 155 203 769 799 949 868/ / / / / / / / / / / /
− 237 − 46 667 711 17 − 123 − 10 73 − 109 53 200 17
− 442 − 1,454 − 1,285 − 2,140 − 184 − 259 94 325 1,388 601 641 456
967 807 1,492 1,804 − 40 181 292 361 609 310 784 899259 219 168 185 34 28 21 23 77 73 60 59
709 588 1,324 1,620 − 74 153 271 338 532 237 724 841
40 34 32 31 10 4 2 2 15 17 19 19318 286 267 308 47 44 40 36 120 94 101 117
− 278 − 252 − 235 − 277 − 37 − 40 − 38 − 33 − 104 − 77 − 83 − 98
− 12 − 1,118 − 197 − 798 − 296 − 146 327 629 1,816 762 1,282 1,198
− 270 − 569 − 247 − 319 − 14 − 14 − 12 − 10 − 71 − 68 − 70 − 65
439 492 − 1,608 − 1,466 719 292 − 491 − 185 − 104 408 − 1,060 − 89435 − 132 43 281 − 1 − 60 − 1 5 24 − 70 20 52
475 360 − 1,565 − 1,185 718 232 − 492 − 180 − 80 338 − 1,040 − 841
56 794 48 449 293 331 1 1,003 − 366 202 261 − 425− 569 323 1,081 158 − 391 12 − 29 − 46 11 272 227 248
− 513 1,116 1,129 607 − 97 342 − 28 957 − 355 474 488 − 177
1,804 1,167 1,336 1,029 1,328 231 129 143 319 896 596 783− 923 − 426 − 532 − 1,126 142 − 141 − 27 18 − 1,084 − 273 − 464 − 428
882 741 804 − 97 1,470 90 102 161 − 765 623 132 355
1,285 583 1,207 1,175 1,288 159 262 310 129 543 393 559− 761 − 231 − 833 − 1,402 156 − 92 − 25 25 − 976 − 105 − 508 − 516
524 352 374 − 227 1,443 67 237 335 − 847 438 − 115 43
737 589 1,083 1,014 651 145 161 258 117 396 454 624− 47 − 60 − 19 − 30 − 0 5 2 − 5 2 − 8 − 13 − 21
690 529 1,064 984 650 150 163 253 119 388 441 603
453 542 34 − 133 89 163 − 62 51 46 189 32 18− 162 − 195 301 276 − 14 − 49 − 2 − 7 − 107 − 168 44 88
292 347 335 142 76 114 − 64 44 − 62 21 76 106
8 16 − 9 19 6 1 − 1 1 − 1 − 2 0 13− 2 21 − 2 − 18 − 0 0 0 − 15 − 1 − 1 − 1 − 2
6 37 − 10 1 5 1 − 1 − 14 − 2 − 3 − 1 11
66 42 95 − 12 − 50 − 91 − 72 − 218 144 164 172 206− − − − − − − − − − − −
66 42 95 − 12 − 50 − 91 − 72 − 218 144 164 172 206
− − − − − − − − − − − −0 0 0 0 − 0 − − 0 0 0 −
0 0 0 0 − 0 − − 0 0 0 −
. . . . . . . . . . . .
of foreign investment in Germany to the creditor country. — 3 Including German investment by country of debtor (issuer), and of foreign investmentmoney market paper and financial derivatives. Regional classification of in Germany by country of counterparty. — 4 Excluding Bundesbank.
25
DEUTSCHEBUNDESBANKE U R O S Y S T E M
Balance of paymentsby regionAugust 2006
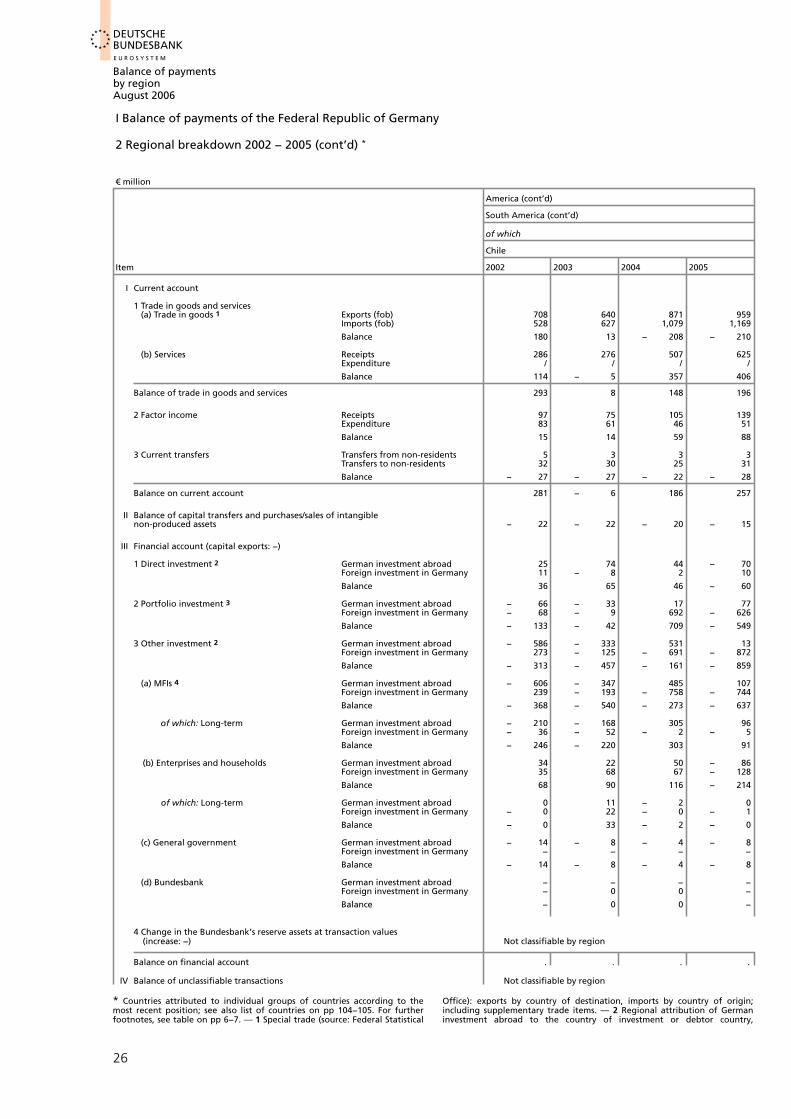
I Balance of payments of the Federal Republic of Germany 2 Regional breakdown 2002 − 2005 (cont’d) * € million
America (cont’d)
South America (cont’d)
of which
Chile
Item 2002 2003 2004 2005
Current accountI
1 Trade in goods and services(a) Trade in goods 1 Exports (fob) 708 640 871 959
Imports (fob) 528 627 1,079 1,169
Balance 180 13 − 208 − 210
(b) Services Receipts 286 276 507 625Expenditure / / / /
Balance 114 − 5 357 406
Balance of trade in goods and services 293 8 148 196
2 Factor income Receipts 97 75 105 139Expenditure 83 61 46 51
Balance 15 14 59 88
3 Current transfers Transfers from non-residents 5 3 3 3Transfers to non-residents 32 30 25 31
Balance − 27 − 27 − 22 − 28
Balance on current account 281 − 6 186 257
Balance of capital transfers and purchases/sales of intangibleIInon-produced assets − 22 − 22 − 20 − 15
Financial account (capital exports: −)III
1 Direct investment 2 German investment abroad 25 74 44 − 70Foreign investment in Germany 11 − 8 2 10
Balance 36 65 46 − 60
2 Portfolio investment 3 German investment abroad − 66 − 33 17 77Foreign investment in Germany − 68 − 9 692 − 626
Balance − 133 − 42 709 − 549
3 Other investment 2 German investment abroad − 586 − 333 531 13Foreign investment in Germany 273 − 125 − 691 − 872
Balance − 313 − 457 − 161 − 859
(a) MFIs 4 German investment abroad − 606 − 347 485 107Foreign investment in Germany 239 − 193 − 758 − 744
Balance − 368 − 540 − 273 − 637
German investment abroad − 210 − 168 305 96of which: Long-termForeign investment in Germany − 36 − 52 − 2 − 5
Balance − 246 − 220 303 91
(b) Enterprises and households German investment abroad 34 22 50 − 86Foreign investment in Germany 35 68 67 − 128
Balance 68 90 116 − 214
of which: Long-term German investment abroad 0 11 − 2 0Foreign investment in Germany − 0 22 − 0 − 1
Balance − 0 33 − 2 − 0
(c) General government German investment abroad − 14 − 8 − 4 − 8Foreign investment in Germany − − − −
Balance − 14 − 8 − 4 − 8
(d) Bundesbank German investment abroad − − − −Foreign investment in Germany − 0 0 −
Balance − 0 0 −
4 Change in the Bundesbank’s reserve assets at transaction values(increase: −) Not classifiable by region
Balance on financial account . . . .
Balance of unclassifiable transactionsIV Not classifiable by region
* Countries attributed to individual groups of countries according to the Office): exports by country of destination, imports by country of origin;most recent position; see also list of countries on pp 104−105. For further including supplementary trade items. — 2 Regional attribution of Germanfootnotes, see table on pp 6−7. — 1 Special trade (source: Federal Statistical investment abroad to the country of investment or debtor country,
26

DEUTSCHEBUNDESBANK
Balance of paymentsby regionAugust 2006
I Balance of payments of the Federal Republic of Germany
Asia
Total Near and Middle Eastern countries Other Asian countries
2002 2003 2004 2005 2002 2003 2004 2005 2002 2003 2004 2005
71,050 73,164 81,980 87,525 14,817 14,767 16,742 19,670 56,233 58,398 65,238 67,85676,648 81,398 95,266 103,397 4,433 4,068 3,972 4,535 72,215 77,329 91,294 98,863
− 5,597 − 8,233 − 13,286 − 15,872 10,384 10,699 12,770 15,135 − 15,982 − 18,932 − 26,056 − 31,007
12,011 11,956 12,778 14,503 2,238 2,129 2,126 2,647 9,773 9,827 10,652 11,85714,089 13,432 14,855 16,429 / / / / / / / /
− 2,078 − 1,477 − 2,077 − 1,925 − 186 − 184 − 388 − 144 − 1,892 − 1,293 − 1,689 − 1,782
− 7,675 − 9,710 − 15,362 − 17,797 10,198 10,515 12,382 14,991 − 17,874 − 20,225 − 27,744 − 32,788
5,362 4,600 5,942 7,157 654 639 719 791 4,708 3,962 5,223 6,3664,948 4,174 3,497 3,626 1,043 871 658 711 3,905 3,303 2,839 2,915
415 426 2,445 3,531 − 389 − 233 61 80 803 659 2,384 3,451
313 436 271 756 56 67 65 66 257 369 206 6902,223 2,458 2,640 2,600 938 816 958 822 1,285 1,643 1,682 1,778
− 1,910 − 2,022 − 2,369 − 1,844 − 882 − 748 − 893 − 756 − 1,028 − 1,274 − 1,476 − 1,088
− 9,171 − 11,306 − 15,286 − 16,110 8,928 9,534 11,550 14,316 − 18,099 − 20,840 − 26,836 − 30,425
− 640 − 539 − 544 − 2,480 − 130 − 153 − 143 − 1,909 − 510 − 386 − 401 − 571
− 2,689 − 1,514 − 3,913 − 5,556 − 76 − 61 − 238 − 488 − 2,612 − 1,454 − 3,675 − 5,068− 81 1,014 1,464 663 133 − 399 − 447 − 709 − 214 1,413 1,911 1,372
− 2,769 − 500 − 2,449 − 4,893 56 − 460 − 685 − 1,196 − 2,826 − 40 − 1,765 − 3,697
− 4,032 − 2,854 − 7,094 − 4,248 − 9 − 93 12 − 734 − 4,023 − 2,761 − 7,106 − 3,51415,550 9,434 4,729 9,947 − 96 1,480 − 1,249 2,462 15,646 7,954 5,979 7,485
11,518 6,580 − 2,364 5,699 − 105 1,387 − 1,237 1,728 11,623 5,193 − 1,127 3,971
− 10,477 374 − 6,439 793 − 1,482 472 − 2,331 − 1,375 − 8,995 − 97 − 4,108 2,168− 8,446 − 8,207 2,431 4,715 911 − 520 4,597 2,389 − 9,357 − 7,687 − 2,166 2,326
− 18,923 − 7,832 − 4,008 5,508 − 571 − 48 2,266 1,014 − 18,352 − 7,784 − 6,274 4,494
− 8,855 1,740 − 5,772 2,177 − 880 681 − 2,136 − 2,801 − 7,974 1,059 − 3,637 4,979− 9,386 − 9,540 1,143 5,707 430 − 1,452 3,688 1,232 − 9,816 − 8,088 − 2,545 4,475
− 18,240 − 7,800 − 4,629 7,884 − 451 − 771 1,552 − 1,569 − 17,790 − 7,029 − 6,182 9,454
123 163 2,079 − 550 − 483 220 − 646 − 2,286 606 − 57 2,725 1,736− 1,445 − 735 − 1,807 − 1,119 262 − 314 − 60 − 169 − 1,707 − 421 − 1,747 − 950
− 1,322 − 572 272 − 1,669 − 222 − 94 − 706 − 2,456 − 1,100 − 478 978 786
− 1,290 − 1,167 − 552 − 2,941 − 599 − 207 − 193 − 369 − 691 − 960 − 359 − 2,572959 1,224 1,156 1,446 487 933 896 1,132 472 292 260 314
− 331 57 604 − 1,495 − 113 726 703 764 − 219 − 669 − 99 − 2,258
− 298 − 872 − 591 − 257 − 30 − 42 − 36 − 46 − 268 − 830 − 555 − 211233 − 264 − 8 − 162 1 36 − 10 − 11 232 − 301 2 − 151
− 66 − 1,136 − 599 − 419 − 29 − 5 − 46 − 56 − 36 − 1,130 − 553 − 362
− 332 − 198 − 114 1,557 − 2 − 2 − 2 1,795 − 329 − 196 − 112 − 238− 5 − 6 58 92 − − 13 − − 5 − 6 45 92
− 337 − 204 − 56 1,649 − 2 − 2 11 1,795 − 335 − 202 − 67 − 147
− − − − − − − − − − − −− 14 114 74 − 2,530 − 6 − 1 − 0 25 − 8 115 74 − 2,555
− 14 114 74 − 2,530 − 6 − 1 − 0 25 − 8 115 74 − 2,555
. . . . . . . . . . . .
of foreign investment in Germany to the creditor country. — 3 Including German investment by country of debtor (issuer), and of foreign investmentmoney market paper and financial derivatives. Regional classification of in Germany by country of counterparty. — 4 Excluding Bundesbank.
27

DEUTSCHEBUNDESBANKE U R O S Y S T E M
Balance of paymentsby regionAugust 2006
I Balance of payments of the Federal Republic of Germany 2 Regional breakdown 2002 − 2005 (cont’d) * € million
Asia (cont’d)
Other Asian countries (cont’d)
of which
China, People‘s Republic of
Item 2002 2003 2004 2005
Current accountI
1 Trade in goods and services(a) Trade in goods 1 Exports (fob) 14,256 17,875 20,532 20,763
Imports (fob) 20,373 24,513 31,264 38,018
Balance − 6,117 − 6,638 − 10,732 − 17,255
(b) Services Receipts 1,501 1,540 1,907 2,288Expenditure / / / /
Balance 130 358 303 10
Balance of trade in goods and services − 5,987 − 6,280 − 10,429 − 17,244
2 Factor income Receipts 515 739 816 1,017Expenditure 185 131 138 142
Balance 330 608 677 875
3 Current transfers Transfers from non-residents 31 85 28 29Transfers to non-residents 91 156 152 131
Balance − 60 − 71 − 125 − 102
Balance on current account − 5,718 − 5,743 − 9,876 − 16,471
Balance of capital transfers and purchases/sales of intangibleIInon-produced assets − 35 − 1 − 33 − 31
Financial account (capital exports: −)III
1 Direct investment 2 German investment abroad − 662 − 1,558 − 1,087 − 2,982Foreign investment in Germany − 156 308 98 137
Balance − 818 − 1,250 − 989 − 2,845
2 Portfolio investment 3 German investment abroad 412 − 96 − 239 − 128Foreign investment in Germany 1,048 421 2,183 5,409
Balance 1,460 325 1,944 5,281
3 Other investment 2 German investment abroad − 354 − 4 − 655 19Foreign investment in Germany − 802 − 538 604 1,482
Balance − 1,156 − 542 − 51 1,501
(a) MFIs 4 German investment abroad 37 279 − 768 502Foreign investment in Germany − 1,115 − 1,146 − 53 1,482
Balance − 1,079 − 867 − 821 1,984
German investment abroad 119 349 114 126of which: Long-termForeign investment in Germany − 223 − 276 − 6 34
Balance − 105 73 108 160
(b) Enterprises and households German investment abroad − 366 − 260 134 − 461Foreign investment in Germany 315 609 635 0
Balance − 51 349 769 − 461
of which: Long-term German investment abroad − 92 − 80 − 117 − 60Foreign investment in Germany − 3 − 3 − 57 − 2
Balance − 95 − 83 − 174 − 62
(c) General government German investment abroad − 25 − 24 − 21 − 21Foreign investment in Germany − − 22 −
Balance − 25 − 24 1 − 21
(d) Bundesbank German investment abroad − − − −Foreign investment in Germany − 2 − 0 0 − 0
Balance − 2 − 0 0 − 0
4 Change in the Bundesbank’s reserve assets at transaction values(increase: −) Not classifiable by region
Balance on financial account . . . .
Balance of unclassifiable transactionsIV Not classifiable by region
* Countries attributed to individual groups of countries according to the Office): exports by country of destination, imports by country of origin;most recent position; see also list of countries on pp 104−105. For further including supplementary trade items. — 2 Regional attribution of Germanfootnotes, see table on pp 6−7. — 1 Special trade (source: Federal Statistical investment abroad to the country of investment or debtor country,
28

DEUTSCHEBUNDESBANK
Balance of paymentsby regionAugust 2006
I Balance of payments of the Federal Republic of Germany
Emerging markets in South-East Asia of which
Japan Total Hong Kong
2002 2003 2004 2005 2002 2003 2004 2005 2002 2003 2004 2005
12,158 11,513 12,321 13,017 24,498 23,709 25,715 26,319 4,134 3,813 3,877 3,94919,493 19,350 21,881 21,527 25,200 25,859 29,109 29,661 2,046 1,967 2,021 1,967
− 7,335 − 7,837 − 9,560 − 8,510 − 702 − 2,150 − 3,394 − 3,341 2,088 1,846 1,856 1,982
2,964 2,814 2,760 2,957 4,245 4,200 4,746 5,198 848 836 898 9452,061 2,164 2,342 2,392 / / / / 1,299 1,259 1,502 1,650
903 650 418 566 − 1,600 − 1,016 − 923 − 867 − 451 − 423 − 604 − 705
− 6,432 − 7,187 − 9,142 − 7,945 − 2,302 − 3,166 − 4,317 − 4,208 1,637 1,423 1,252 1,277
1,481 632 663 702 2,258 2,218 3,209 3,993 471 426 610 6901,799 1,800 1,488 1,448 1,686 1,193 1,099 1,190 340 182 150 193
− 318 − 1,168 − 826 − 745 572 1,025 2,111 2,804 132 244 460 498
106 57 60 592 103 217 107 58 19 78 71 15157 165 169 146 655 989 1,053 1,062 55 54 67 68
− 51 − 109 − 108 446 − 552 − 772 − 947 − 1,004 − 36 24 4 − 53
− 6,800 − 8,463 − 10,076 − 8,244 − 2,281 − 2,913 − 3,153 − 2,409 1,732 1,691 1,715 1,722
0 0 0 0 − 110 − 100 − 96 − 127 − 3 − 3 − 0 − 1
− 854 − 725 − 360 1,638 − 883 1,146 − 1,767 − 2,969 − 278 − 74 − 492 − 68581 865 562 − 125 − 184 273 1,178 1,176 − 111 59 − 43 73
− 774 140 202 1,512 − 1,067 1,419 − 589 − 1,793 − 389 − 15 − 535 − 612
− 4,195 − 2,005 − 6,428 − 2,949 − 213 − 569 − 253 − 177 − 49 − 178 0 − 1008,650 4,193 − 3,208 − 1,407 5,158 3,724 6,570 3,079 2,250 257 880 413
4,456 2,189 − 9,636 − 4,355 4,945 3,155 6,316 2,902 2,200 80 880 313
− 5,338 − 2,657 − 2,181 4,215 − 3,544 3,262 − 827 − 1,311 − 1,894 2,888 − 797 − 607− 1,528 − 1,570 371 − 726 − 7,656 − 5,447 − 3,404 800 − 4,830 − 3,785 − 882 1,443
− 6,866 − 4,226 − 1,811 3,489 − 11,200 − 2,185 − 4,230 − 511 − 6,724 − 898 − 1,679 837
− 5,179 − 2,600 − 1,668 6,306 − 3,043 4,026 − 851 − 1,348 − 1,860 2,838 − 709 − 568− 1,514 − 1,194 284 1,444 − 7,661 − 5,476 − 3,184 836 − 4,789 − 3,702 − 1,095 1,466
− 6,694 − 3,794 − 1,384 7,750 − 10,703 − 1,450 − 4,035 − 512 − 6,649 − 864 − 1,804 898
− 331 − 198 2,148 − 445 557 − 314 385 2,092 184 − 90 − 580 − 14− 736 − 210 − 323 − 965 − 913 152 − 1,247 261 − 789 407 − 402 19
− 1,067 − 408 1,825 − 1,410 − 356 − 162 − 862 2,353 − 605 317 − 982 5
− 159 − 56 − 513 − 2,092 − 280 − 655 138 214 − 35 39 − 100 − 38− 13 − 376 87 22 29 40 − 260 − 24 − 36 − 58 229 − 23
− 172 − 432 − 426 − 2,070 − 252 − 616 − 122 190 − 71 − 19 129 − 61
5 − 73 − 13 − 52 − 185 − 678 − 355 − 95 − 8 − 19 − 42 − 32197 − 236 − 31 − 67 39 − 60 91 − 80 − 77 − 25 55 − 22
202 − 309 − 44 − 119 − 146 − 738 − 264 − 175 − 85 − 44 13 − 53
− − − 0 − − 222 − 108 − 114 − 177 1 11 12 − 0− 0 − − 0 119 − 5 − 6 13 − 27 − 5 − 26 − 15 −
− 0 − − 0 119 − 227 − 114 − 101 − 204 − 4 − 15 − 4 − 0
− − − − − − − − − − − −− 0 0 − 0 − 2,310 − 18 − 6 28 15 − 0 − −
− 0 0 − 0 − 2,310 − 18 − 6 28 15 − 0 − −
. . . . . . . . . . . .
of foreign investment in Germany to the creditor country. — 3 Including German investment by country of debtor (issuer), and of foreign investmentmoney market paper and financial derivatives. Regional classification of in Germany by country of counterparty. — 4 Excluding Bundesbank.
29

DEUTSCHEBUNDESBANKE U R O S Y S T E M
Balance of paymentsby regionAugust 2006
I Balance of payments of the Federal Republic of Germany 2 Regional breakdown 2002 − 2005 (cont’d) * € million
Asia (cont’d)
Other Asian countries (cont’d)
Emerging markets in South-East Asia (cont’d)
of which
Korea, Republic of
Item 2002 2003 2004 2005
Current accountI
1 Trade in goods and services(a) Trade in goods 1 Exports (fob) 5,500 5,345 6,203 6,862
Imports (fob) 4,746 5,768 7,962 9,349
Balance 753 − 423 − 1,759 − 2,486
(b) Services Receipts 923 1,066 1,166 1,353Expenditure / / / /
Balance 277 224 312 415
Balance of trade in goods and services 1,030 − 199 − 1,446 − 2,071
2 Factor income Receipts 391 258 509 641Expenditure − 134 − 71 55 74
Balance 526 329 454 568
3 Current transfers Transfers from non-residents 13 103 10 8Transfers to non-residents 30 65 52 48
Balance − 17 38 − 42 − 39
Balance on current account 1,539 168 − 1,034 − 1,542
Balance of capital transfers and purchases/sales of intangibleIInon-produced assets − 3 − 3 − 6 − 2
Financial account (capital exports: −)III
1 Direct investment 2 German investment abroad − 171 − 277 231 − 773Foreign investment in Germany − 173 107 1,166 790
Balance − 343 − 170 1,397 17
2 Portfolio investment 3 German investment abroad − 27 − 244 583 271Foreign investment in Germany − 10 1 352 1,662
Balance − 37 − 243 935 1,933
3 Other investment 2 German investment abroad − 410 − 1,362 − 105 111Foreign investment in Germany − 827 345 13 334
Balance − 1,237 − 1,016 − 93 445
(a) MFIs 4 German investment abroad − 302 − 365 41 − 155Foreign investment in Germany − 807 − 46 160 − 12
Balance − 1,109 − 411 201 − 167
German investment abroad − 110 − 277 145 − 57of which: Long-termForeign investment in Germany − 12 17 4 11
Balance − 122 − 260 149 − 46
(b) Enterprises and households German investment abroad − 82 − 1,000 − 137 275Foreign investment in Germany − 20 391 − 147 346
Balance − 102 − 609 − 285 620
of which: Long-term German investment abroad − 200 − 492 − 305 − 26Foreign investment in Germany 0 − 0 − 0 − 1
Balance − 200 − 493 − 305 − 27
(c) General government German investment abroad − 26 4 − 9 − 9Foreign investment in Germany − − − −
Balance − 26 4 − 9 − 9
(d) Bundesbank German investment abroad − − − −Foreign investment in Germany − 0 − 0
Balance − 0 − 0
4 Change in the Bundesbank’s reserve assets at transaction values(increase: −) Not classifiable by region
Balance on financial account . . . .
Balance of unclassifiable transactionsIV Not classifiable by region
* Countries attributed to individual groups of countries according to the Office): exports by country of destination, imports by country of origin;most recent position; see also list of countries on pp 104−105. For further including supplementary trade items. — 2 Regional attribution of Germanfootnotes, see table on pp 6−7. — 1 Special trade (source: Federal Statistical investment abroad to the country of investment or debtor country,
30
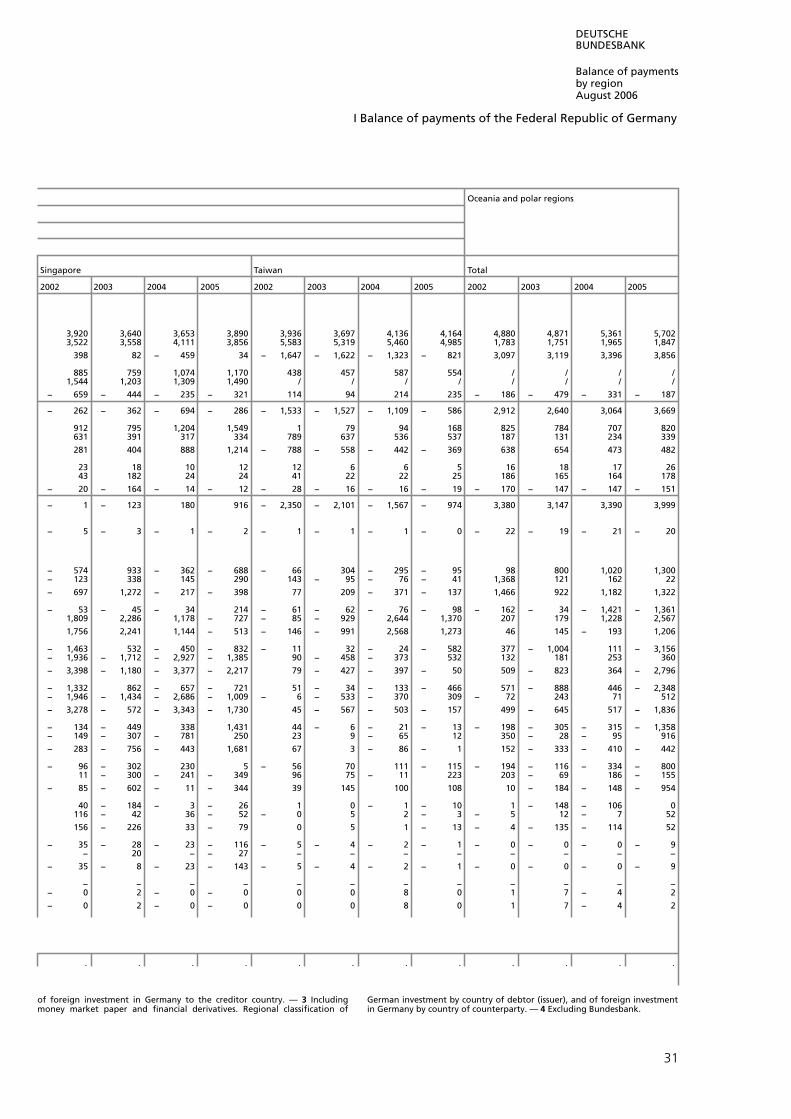
DEUTSCHEBUNDESBANK
Balance of paymentsby regionAugust 2006
I Balance of payments of the Federal Republic of Germany
Oceania and polar regions
Singapore Taiwan Total
2002 2003 2004 2005 2002 2003 2004 2005 2002 2003 2004 2005
3,920 3,640 3,653 3,890 3,936 3,697 4,136 4,164 4,880 4,871 5,361 5,7023,522 3,558 4,111 3,856 5,583 5,319 5,460 4,985 1,783 1,751 1,965 1,847
398 82 − 459 34 − 1,647 − 1,622 − 1,323 − 821 3,097 3,119 3,396 3,856
885 759 1,074 1,170 438 457 587 554 / / / /1,544 1,203 1,309 1,490 / / / / / / / /
− 659 − 444 − 235 − 321 114 94 214 235 − 186 − 479 − 331 − 187
− 262 − 362 − 694 − 286 − 1,533 − 1,527 − 1,109 − 586 2,912 2,640 3,064 3,669
912 795 1,204 1,549 1 79 94 168 825 784 707 820631 391 317 334 789 637 536 537 187 131 234 339
281 404 888 1,214 − 788 − 558 − 442 − 369 638 654 473 482
23 18 10 12 12 6 6 5 16 18 17 2643 182 24 24 41 22 22 25 186 165 164 178
− 20 − 164 − 14 − 12 − 28 − 16 − 16 − 19 − 170 − 147 − 147 − 151
− 1 − 123 180 916 − 2,350 − 2,101 − 1,567 − 974 3,380 3,147 3,390 3,999
− 5 − 3 − 1 − 2 − 1 − 1 − 1 − 0 − 22 − 19 − 21 − 20
− 574 933 − 362 − 688 − 66 304 − 295 − 95 98 800 1,020 1,300− 123 338 145 290 143 − 95 − 76 − 41 1,368 121 162 22
− 697 1,272 − 217 − 398 77 209 − 371 − 137 1,466 922 1,182 1,322
− 53 − 45 − 34 214 − 61 − 62 − 76 − 98 − 162 − 34 − 1,421 − 1,3611,809 2,286 1,178 − 727 − 85 − 929 2,644 1,370 207 179 1,228 2,567
1,756 2,241 1,144 − 513 − 146 − 991 2,568 1,273 46 145 − 193 1,206
− 1,463 532 − 450 − 832 − 11 32 − 24 − 582 377 − 1,004 111 − 3,156− 1,936 − 1,712 − 2,927 − 1,385 90 − 458 − 373 532 132 181 253 360
− 3,398 − 1,180 − 3,377 − 2,217 79 − 427 − 397 − 50 509 − 823 364 − 2,796
− 1,332 862 − 657 − 721 51 − 34 − 133 − 466 571 − 888 446 − 2,348− 1,946 − 1,434 − 2,686 − 1,009 − 6 − 533 − 370 309 − 72 243 71 512
− 3,278 − 572 − 3,343 − 1,730 45 − 567 − 503 − 157 499 − 645 517 − 1,836
− 134 − 449 338 1,431 44 − 6 − 21 − 13 − 198 − 305 − 315 − 1,358− 149 − 307 − 781 250 23 9 − 65 12 350 − 28 − 95 916
− 283 − 756 − 443 1,681 67 3 − 86 − 1 152 − 333 − 410 − 442
− 96 − 302 230 5 − 56 70 111 − 115 − 194 − 116 − 334 − 80011 − 300 − 241 − 349 96 75 − 11 223 203 − 69 186 − 155
− 85 − 602 − 11 − 344 39 145 100 108 10 − 184 − 148 − 954
40 − 184 − 3 − 26 1 0 − 1 − 10 1 − 148 − 106 0116 − 42 36 − 52 − 0 5 2 − 3 − 5 12 − 7 52
156 − 226 33 − 79 0 5 1 − 13 − 4 − 135 − 114 52
− 35 − 28 − 23 − 116 − 5 − 4 − 2 − 1 − 0 − 0 − 0 − 9− 20 − − 27 − − − − − − − −
− 35 − 8 − 23 − 143 − 5 − 4 − 2 − 1 − 0 − 0 − 0 − 9
− − − − − − − − − − − −− 0 2 − 0 − 0 0 0 8 0 1 7 − 4 2
− 0 2 − 0 − 0 0 0 8 0 1 7 − 4 2
. . . . . . . . . . . .
of foreign investment in Germany to the creditor country. — 3 Including German investment by country of debtor (issuer), and of foreign investmentmoney market paper and financial derivatives. Regional classification of in Germany by country of counterparty. — 4 Excluding Bundesbank.
31

DEUTSCHEBUNDESBANKE U R O S Y S T E M
Balance of paymentsby regionAugust 2006
I Balance of payments of the Federal Republic of Germany 2 Regional breakdown 2002 − 2005 (cont’d) * € million
International organisations
Item 2002 2003 2004 2005
Current accountI
1 Trade in goods and services(a) Trade in goods 1 Exports (fob) − − − −
Imports (fob) − − − −
Balance − − − −
(b) Services Receipts 312 456 922 775Expenditure 105 265 337 368
Balance 208 191 585 407
Balance of trade in goods and services 208 191 585 407
2 Factor income Receipts 1,976 1,508 697 715Expenditure 1,380 1,718 778 814
Balance 596 − 210 − 81 − 100
3 Current transfers Transfers from non-residents 9 9 5 2Transfers to non-residents 1,936 1,802 1,692 1,644
Balance − 1,926 − 1,793 − 1,687 − 1,641
Balance on current account − 1,123 − 1,812 − 1,183 − 1,334
Balance of capital transfers and purchases/sales of intangibleIInon-produced assets − 9 − 4 − 5 − 3
Financial account (capital exports: −)III
1 Direct investment 2 German investment abroad − − − −Foreign investment in Germany − − − −
Balance − − − −
2 Portfolio investment 3 German investment abroad 1,005 113 − 53 − 193Foreign investment in Germany − 6,287 − 2,611 − 15,450 − 3,221
Balance − 5,282 − 2,497 − 15,503 − 3,415
3 Other investment 2 German investment abroad − 645 − 761 − 941 − 1,547Foreign investment in Germany − 1,531 1,024 63 − 2,551
Balance − 2,176 263 − 878 − 4,098
(a) MFIs 4 German investment abroad − 75 − 230 − 184 − 839Foreign investment in Germany − 1,503 1,038 38 − 2,497
Balance − 1,578 808 − 146 − 3,336
German investment abroad − 204 − 63 14 − 211of which: Long-termForeign investment in Germany − 494 342 − 346 104
Balance − 698 279 − 332 − 107
(b) Enterprises and households German investment abroad − − − 20 0Foreign investment in Germany − 12 − 9 22 − 63
Balance − 12 − 9 2 − 63
of which: Long-term German investment abroad − − − 20 0Foreign investment in Germany − 12 − 9 22 − 63
Balance − 12 − 9 2 − 63
(c) General government German investment abroad − 570 − 531 − 737 − 671Foreign investment in Germany − − − −
Balance − 570 − 531 − 737 − 671
(d) Bundesbank German investment abroad − 0 − − 38Foreign investment in Germany − 16 − 5 4 9
Balance − 16 − 5 4 − 29
4 Change in the Bundesbank’s reserve assets at transaction values(increase: −) Not classifiable by region
Balance on financial account . . . .
Balance of unclassifiable transactionsIV Not classifiable by region
* Countries attributed to individual groups of countries according to the Office): exports by country of destination, imports by country of origin;most recent position; see also list of countries on pp 104−105. For further including supplementary trade items. — 3 Regional attribution of Germanfootnotes, see table on pp 6−7. — 1 Special trade (source: Federal Statistical investment abroad to the country of investment or debtor country,
32

DEUTSCHEBUNDESBANK
Balance of paymentsby regionAugust 2006
I Balance of payments of the Federal Republic of Germany
Memo item
Unidentified countries Industrial countries Emerging markets and developing countries
2002 2003 2004 2005 2002 2003 2004 2005 2002 2003 2004 2005
1,628 1,452 1,367 1,426 533,344 543,918 593,882 636,439 110,425 113,277 129,831 143,813865 939 858 862 413,496 424,269 450,404 486,646 96,699 104,277 121,205 140,812
763 514 509 564 119,849 119,649 143,477 149,793 13,727 9,000 8,627 3,000
44 35 38 36 93,003 91,715 95,878 102,165 15,157 16,390 18,011 21,3532 4 3 10 129,676 129,708 132,619 136,564 24,165 23,283 24,905 27,822
43 31 35 25 − 36,673 − 37,993 − 36,741 − 34,399 − 9,007 − 6,893 − 6,894 − 6,469
806 545 544 589 83,176 81,656 106,736 115,394 4,719 2,106 1,733 − 3,468
26 1 0 0 90,604 91,742 105,007 120,150 11,284 10,897 14,389 17,87626 4 100 99 113,800 112,264 112,779 122,543 6,706 6,088 5,801 6,641
1 − 3 − 100 − 99 − 23,196 − 20,522 − 7,772 − 2,392 4,578 4,809 8,588 11,234
2 3 7 103 16,153 15,782 15,409 16,956 947 1,083 553 44593 88 102 487 37,828 38,129 37,090 39,013 4,766 5,140 5,399 5,284
− 90 − 85 − 94 − 384 − 21,675 − 22,346 − 21,681 − 22,057 − 3,820 − 4,057 − 4,846 − 4,839
716 457 349 106 38,305 38,788 77,284 90,945 5,478 2,859 5,475 2,927
− 93 − 95 − 118 − 69 1,918 2,592 2,349 3,105 − 2,028 − 2,180 − 1,797 − 4,302
− − − − − 20,079 − 4,328 3,908 − 23,968 − 53 − 1,142 − 5,424 − 12,726− − − − 55,215 29,388 − 10,983 27,216 1,656 − 3,515 − 1,190 − 951
0 0 − − 35,136 25,060 − 7,075 3,247 1,603 − 4,658 − 6,614 − 13,677
− − 2 − − − 62,162 − 49,089 − 110,919 − 211,334 − 2,978 5,357 − 5,031 − 4,060− − − − 129,127 104,625 119,651 177,295 7,315 10,614 15,867 22,914
− − 2 − − 66,965 55,536 8,732 − 34,039 4,337 15,971 10,835 18,854
300 − 148 − 62 86 − 162,215 − 156,231 − 142,296 − 85,952 − 11,676 2,417 − 1,527 − 31,047− 0 − 30 90 − 67 28,620 22,922 35,242 33,603 3,875 − 7,104 2,889 13,908
300 − 178 28 19 − 133,595 − 133,308 − 107,053 − 52,349 − 7,800 − 4,687 1,362 − 17,139
− 0 − 154 − 72 74 − 122,773 − 124,988 − 118,741 − 49,042 − 9,762 3,019 − 2,836 − 35,973− 0 − 30 90 − 67 26,152 20,289 31,928 11,169 3,804 − 10,589 281 13,850
− 0 − 184 18 7 − 96,620 − 104,699 − 86,813 − 37,873 − 5,958 − 7,570 − 2,555 − 22,123
− 0 − 187 − 3 5 − 33,564 − 31,688 9,098 − 64,651 − 96 − 664 − 3,255 − 5,120− 0 − 70 1 − 2 14,206 − 2,489 − 11,510 − 3,886 4,666 − 3,747 1,771 − 6,046
− 0 − 257 − 2 3 − 19,357 − 34,178 − 2,412 − 68,536 4,570 − 4,411 − 1,484 − 11,166
300 6 10 12 − 10,397 − 32,056 − 22,878 − 11,512 − 2,099 − 1,279 604 − 2,263− − − − 3,094 − 2,856 8,669 20,514 401 3,294 2,367 352
300 6 10 12 − 7,303 − 34,912 − 14,209 9,001 − 1,698 2,015 2,971 − 1,911
− 0 − − − 2,290 − 3,375 − 6,551 − 8,601 − 399 − 1,545 − 911 − 324− 0 − − 0 − 5,658 − 711 6,814 10,174 − 249 423 975 − 2,276
− 0 0 − 0 − 3,367 − 4,085 263 1,573 − 648 − 1,122 64 − 2,600
− − − − 6,965 583 2,175 − 3,361 186 677 705 7,189− − − − − 1,594 3,699 − 2,702 3,767 − 31 − 6 44 − 27
− − − − 5,370 4,282 − 527 406 155 671 749 7,161
− − − − − 36,010 230 − 2,851 − 22,036 − − − −− − − − 968 1,790 − 2,652 − 1,846 − 299 197 197 − 267
− − − − − 35,042 2,021 − 5,504 − 23,882 − 299 197 197 − 267
. . . . . . . . . . . .
of foreign investment in Germany to the creditor country. — 3 Including German investment by country of debtor (issuer), and of foreign investmentmoney market paper and financial derivatives. Regional classification of in Germany by country of counterparty. — 4 Excluding Bundesbank.
33

DEUTSCHEBUNDESBANKE U R O S Y S T E M
Balance of paymentsby regionAugust 2006
I Balance of payments of the Federal Republic of Germany
3 Trade in goods with non-residents * o
Up to end-1998 DM million; from 1999 € million
Foreign trade 1,2 Supplementary trade items
to exports to imports Goods
Additions Additions Freight
of which andof which Imports to insurance
Exports warehouse costs from payable onless importsExports Imports ware- Deductions, from ware- Deductions, Exports Imports imports
Year (fob) (cif) Balance Total houses 3 total Total house 3,4 total (fob) (cif) Balance (cif)
All countries
1994 694,685 622,923 71,762 17,218 9,952 21,740 15,463 8,211 18,667 690,163 619,719 70,444 12,039
1995 749,537 664,234 85,303 16,016 9,217 21,124 17,514 9,747 18,328 744,429 663,420 81,009 12,5961996 788,937 690,399 98,538 14,489 8,667 22,667 16,866 8,231 20,103 780,758 687,162 93,597 13,0711997 888,616 772,149 116,467 14,884 9,100 25,452 19,053 10,676 21,747 878,047 769,455 108,592 14,8051998 955,170 828,200 126,970 18,295 8,702 30,612 21,534 6,620 24,934 942,853 824,800 118,053 15,7411999 510,008 444,797 65,211 9,474 4,052 14,817 15,381 5,863 12,571 504,665 447,608 57,058 8,322
2000 597,440 538,311 59,128 12,123 5,538 19,749 17,204 4,257 15,759 589,813 539,757 50,057 10,6932001 638,268 542,774 95,495 13,656 4,757 22,248 16,864 3,432 18,036 629,677 541,602 88,075 10,5952002 651,320 518,532 132,788 16,656 4,411 22,579 19,495 3,302 16,866 645,397 521,161 124,236 10,1022003 664,455 534,534 129,921 17,123 3,754 22,931 20,277 2,912 14,936 658,647 539,875 118,772 10,3912004 731,544 575,448 156,096 18,151 3,444 24,615 24,985 3,960 16,206 725,080 584,227 140,853 11,760
2005 786,186 625,632 160,554 20,632 3,372 25,140 31,698 3,216 16,058 781,678 641,271 140,406 12,952
Europe
2002 470,877 372,955 97,922 12,357 3,060 13,599 11,366 405 9,884 469,635 374,437 95,198 3,6952003 490,674 384,939 105,735 12,719 2,665 13,662 12,325 366 8,503 489,730 388,761 100,970 3,8982004 541,397 408,698 132,699 13,125 2,110 15,139 14,767 379 9,953 539,383 413,511 125,872 4,3472005 581,551 445,392 136,159 14,542 2,145 15,120 19,528 288 9,377 580,973 455,543 125,430 4,630
EU member states (25)
2002 408,306 314,991 93,314 8,550 1,066 10,491 8,882 140 5,831 406,364 318,042 88,322 2,3962003 426,356 324,045 102,311 9,052 1,004 11,005 9,723 192 4,683 424,402 329,085 95,318 2,5532004 466,348 342,639 123,708 9,568 424 12,276 11,831 62 5,440 463,639 349,031 114,609 2,6982005 498,579 368,834 129,745 10,253 1 12,101 13,932 30 4,867 496,731 377,899 118,832 2,853
Euro-area member states
2002 276,290 211,652 64,637 4,357 1 6,743 4,939 26 4,114 273,903 212,477 61,427 9332003 288,682 215,708 72,974 4,577 1 6,642 5,297 31 3,005 286,617 218,000 68,617 9372004 317,718 230,721 86,997 5,291 1 7,770 6,542 27 3,608 315,239 233,655 81,584 1,0062005 339,775 249,165 90,610 5,167 0 7,672 6,744 26 3,482 337,270 252,427 84,843 1,101
of which: Belgium
2002 31,096 24,666 6,431 755 − 767 740 4 382 31,084 25,024 6,060 272003 35,310 24,149 11,161 858 − 624 933 3 349 35,543 24,733 10,811 262004 40,308 26,525 13,783 623 − 880 702 1 444 40,051 26,782 13,268 292005 43,926 31,107 12,819 669 − 858 686 5 474 43,738 31,319 12,419 31
Finland
2002 6,619 6,137 482 30 − 69 46 4 42 6,580 6,142 438 2462003 6,686 6,366 320 38 − 71 53 18 34 6,653 6,385 268 2362004 7,322 6,124 1,198 27 − 98 36 2 48 7,251 6,112 1,139 2732005 8,228 7,491 737 30 − 122 39 0 52 8,136 7,478 658 339
France
2002 68,725 48,201 20,524 1,336 0 1,265 1,310 15 1,719 68,796 47,792 21,005 762003 69,026 48,545 20,482 1,494 0 1,318 1,441 6 870 69,202 49,115 20,086 762004 74,361 51,535 22,827 1,917 0 1,367 1,394 7 953 74,911 51,976 22,935 802005 79,873 54,627 25,246 1,772 0 1,524 1,354 11 705 80,121 55,276 24,844 85
Greece
2002 5,003 1,586 3,417 30 − 125 54 0 38 4,907 1,601 3,306 262003 5,582 1,581 4,001 47 − 133 43 0 34 5,496 1,590 3,905 242004 6,291 1,613 4,678 35 − 123 48 0 33 6,202 1,628 4,574 242005 6,516 1,620 4,896 61 − 177 66 0 36 6,400 1,650 4,750 27
* Breakdown of the trade in goods shown under item I.1 (a) in the balance Office). — 2 From 1993 including the additional estimates for externalof payments tables on pp 6−33. — o For the classification of countries into transactions which do not have to be reported and which are included ingroups of countries, see list of countries on pp 104−105. — 1 Special trade the supplementary trade item up to 1992. From 1993 these additionalaccording to the official foreign trade statistics (source: Federal Statistical estimates are shown under “Unidentified countries”. — 3 For account of
34

DEUTSCHEBUNDESBANK
Balance of paymentsby regionAugust 2006
I Balance of payments of the Federal Republic of Germany
Goods (fob)
Exports (fob) Imports (fob) 6
Goods Goods
procured in Non- procured in Non-General Goods for Repairs ports by monetary General Goods for Repairs ports by monetary
Total processing on goods 5 carriers gold Total processing on goods 5 carriers gold Balancemerchandise merchandise Year
All countries
690,163 656,050 30,962 1,060 835 1,256 607,679 567,594 36,007 172 1,750 2,156 82,483 1994
744,429 708,351 33,021 1,120 751 1,187 650,824 606,954 39,409 148 2,248 2,065 93,605 1995780,758 739,455 38,053 1,269 638 1,343 674,091 626,578 43,338 170 1,850 2,155 106,668 1996878,047 832,216 42,194 1,840 797 1,000 754,650 704,900 45,119 218 2,301 2,113 123,397 1997942,853 889,004 50,201 2,029 754 865 809,059 753,777 49,993 245 2,372 2,672 133,794 1998504,665 475,554 27,281 989 366 475 439,285 410,437 26,535 153 1,309 852 65,380 1999
589,813 556,596 31,044 1,093 436 645 529,064 497,054 29,358 163 1,728 761 60,750 2000629,677 597,493 30,043 1,083 458 599 531,007 498,746 29,575 149 1,682 854 98,670 2001645,397 609,109 33,729 1,440 452 666 511,059 476,372 31,651 104 2,275 657 134,338 2002658,647 621,101 35,140 1,451 421 533 529,484 494,472 31,839 53 2,533 587 129,162 2003725,080 683,931 38,974 1,404 365 407 572,467 535,999 32,817 52 3,012 587 152,614 2004
781,678 737,098 42,036 1,731 357 456 628,320 589,323 34,132 63 3,931 870 153,358 2005
Europe
469,635 441,623 26,530 581 452 448 370,742 343,977 24,725 83 1,581 376 98,893 2002489,730 460,825 27,538 581 421 365 384,863 357,971 24,670 45 1,800 377 104,867 2003539,383 507,464 30,683 626 365 245 409,164 381,235 25,247 45 2,167 471 130,219 2004580,973 545,912 33,670 771 357 264 450,913 420,816 26,696 49 2,810 543 130,060 2005
EU member states (25)
406,364 383,302 22,066 488 374 134 315,646 293,632 20,175 66 1,516 257 90,718 2002424,402 399,790 23,562 492 367 191 326,531 304,166 20,350 37 1,741 238 97,871 2003463,639 436,452 26,225 525 311 126 346,333 323,371 20,505 35 2,090 332 117,306 2004496,731 466,421 29,248 644 302 117 375,046 349,967 21,991 39 2,687 362 121,685 2005
Euro-area member states
273,903 258,416 14,825 340 230 92 211,544 199,982 10,520 44 804 193 62,359 2002286,617 269,377 16,614 297 224 105 217,063 204,573 11,279 24 1,010 178 69,554 2003315,239 294,037 20,537 357 210 97 232,648 217,655 13,452 25 1,281 235 82,590 2004337,270 312,297 24,264 413 214 82 251,326 233,361 16,041 27 1,652 246 85,944 2005
of which: Belgium
31,084 29,061 1,960 32 20 11 24,997 23,174 1,611 4 119 88 6,087 200235,543 30,385 5,087 37 23 12 24,707 21,416 3,060 3 177 51 10,837 200340,051 32,190 7,802 32 20 7 26,753 21,922 4,568 1 200 63 13,297 200443,738 33,627 10,061 24 20 6 31,288 24,670 6,357 1 220 39 12,451 2005
Finland
6,580 6,486 81 8 4 1 5,895 5,801 51 1 16 27 684 20026,653 6,410 231 8 3 1 6,149 5,814 292 0 11 32 504 20037,251 7,060 180 7 3 1 5,839 5,571 200 0 13 54 1,412 20048,136 7,728 393 9 3 3 7,139 6,569 518 0 19 34 997 2005
France
68,796 59,217 9,482 57 30 11 47,715 41,730 5,780 8 170 27 21,081 200269,202 60,899 8,206 51 30 15 49,040 43,610 5,229 6 160 34 20,162 200374,911 66,232 8,572 62 25 20 51,895 46,114 5,519 5 207 51 23,015 200480,121 70,400 9,594 64 25 37 55,192 48,884 5,985 6 245 71 24,929 2005
Greece
4,907 4,800 99 7 0 0 1,575 1,451 94 0 29 1 3,332 20025,496 5,399 76 19 0 0 1,566 1,474 67 0 25 0 3,930 20036,202 6,121 60 21 0 0 1,604 1,518 47 0 30 8 4,598 20046,400 6,335 51 14 0 0 1,624 1,543 38 0 41 1 4,777 2005
residents only. — 4 The item “Imports to warehouses” also includes goods repair work only. — 6 Imports in connection with goods for processing alsowhich are subsequently imported into Germany; to prevent double- include freight and insurance costs. The import of goods derived as thecounting, the “Imports from warehouses” are deducted. — 5 Value of the difference therefore do not include the cost of freight and insurance.
35

DEUTSCHEBUNDESBANKE U R O S Y S T E M
Balance of paymentsby regionAugust 2006
I Balance of payments of the Federal Republic of Germany
3 Trade in goods with non-residents (cont’d) * o
€ million
Foreign trade 1 Supplementary trade items
to exports to imports Goods
Additions Additions Freight
of which andof which Imports to insurance
Exports warehouse costs from payable onless importsExports Imports ware- Deductions, from ware- Deductions, Exports Imports imports
Year (fob) (cif) Balance Total houses 2 total Total house 2,3 total (fob) (cif) Balance (cif)
Ireland
2002 3,959 13,497 − 9,538 312 − 135 284 − 1 92 4,136 13,688 − 9,553 722003 3,764 13,627 − 9,863 215 − 188 178 0 81 3,792 13,724 − 9,932 762004 4,311 14,772 − 10,461 288 − 178 239 3 150 4,421 14,861 − 10,440 822005 4,865 15,431 − 10,567 107 − 136 26 0 67 4,835 15,390 − 10,555 84
Italy
2002 47,335 33,482 13,853 344 − 793 483 3 482 46,886 33,483 13,404 542003 48,414 34,259 14,156 350 0 747 478 1 366 48,018 34,371 13,647 532004 51,479 35,676 15,803 372 − 954 519 5 512 50,898 35,684 15,214 562005 54,374 35,589 18,785 386 − 1,020 516 5 377 53,740 35,727 18,013 58
Luxembourg
2002 3,011 1,839 1,172 34 − 142 130 − 0 48 2,903 1,920 983 12003 3,103 1,983 1,120 26 − 115 173 0 37 3,015 2,118 897 12004 3,684 2,294 1,390 31 − 141 256 0 37 3,574 2,512 1,062 12005 3,822 2,579 1,243 43 − 183 361 − 0 74 3,682 2,867 815 2
Netherlands
2002 40,463 40,751 − 288 848 − 1,642 877 − 0 579 39,669 41,048 − 1,380 1192003 42,219 42,301 − 83 796 0 1,624 887 0 540 41,391 42,649 − 1,258 1232004 46,730 46,204 526 975 − 1,833 2,000 − 0 664 45,871 47,539 − 1,668 1322005 47,799 53,371 − 5,573 1,267 − 1,486 2,327 − 1 884 47,580 54,814 − 7,234 147
Austria
2002 33,863 21,047 12,816 480 − 1,129 586 0 489 33,214 21,144 12,070 42003 35,857 21,453 14,404 559 − 1,191 659 1 487 35,225 21,625 13,600 42004 40,244 24,020 16,224 686 − 1,339 832 0 508 39,591 24,344 15,247 52005 42,533 25,292 17,241 533 − 1,367 692 1 560 41,699 25,424 16,276 5
Portugal
2002 6,765 4,906 1,859 10 − 123 34 1 62 6,652 4,877 1,775 812003 6,344 4,924 1,420 13 − 100 48 0 41 6,257 4,930 1,327 802004 6,720 4,530 2,191 21 − 142 59 13 43 6,599 4,546 2,054 732005 7,424 4,068 3,356 27 − 127 68 5 45 7,324 4,092 3,233 64
Spain
2002 29,452 15,542 13,910 177 1 553 394 0 179 29,076 15,757 13,318 2272003 32,376 16,520 15,856 180 1 531 404 0 165 32,025 16,760 15,266 2372004 36,268 17,429 18,839 317 1 715 457 − 5 215 35,871 17,671 18,200 2492005 40,415 17,988 22,427 272 0 673 609 − 0 207 40,015 18,390 21,625 259
Other EU member states
2002 132,016 103,339 28,677 4,193 1,065 3,748 3,943 114 1,717 132,461 105,566 26,895 1,4632003 137,674 108,337 29,336 4,475 1,003 4,363 4,426 161 1,679 137,785 111,085 26,701 1,6162004 148,630 111,919 36,711 4,277 424 4,506 5,289 35 1,832 148,400 115,376 33,024 1,6922005 158,804 119,669 39,135 5,086 0 4,429 7,188 4 1,385 159,461 125,472 33,989 1,752
of which: Denmark
2002 11,287 9,264 2,024 95 − 175 136 0 87 11,207 9,312 1,895 682003 11,272 9,486 1,786 104 − 270 206 0 96 11,106 9,596 1,510 702004 11,358 9,669 1,689 108 0 410 270 0 107 11,056 9,832 1,224 722005 12,325 9,570 2,754 139 − 339 350 2 91 12,124 9,829 2,296 71
* Breakdown of the trade in goods shown under item I.1 (a) in the balance according to the official foreign trade statistics (source: Federal Statisticalof payments tables on pp 6−33. — o For the classification of countries into Office). — 2 For account of residents only. — 3 The item “Imports to ware-groups of countries, see list of countries on pp 104−105. — 1 Special trade houses” also includes goods which are subsequently imported into
36
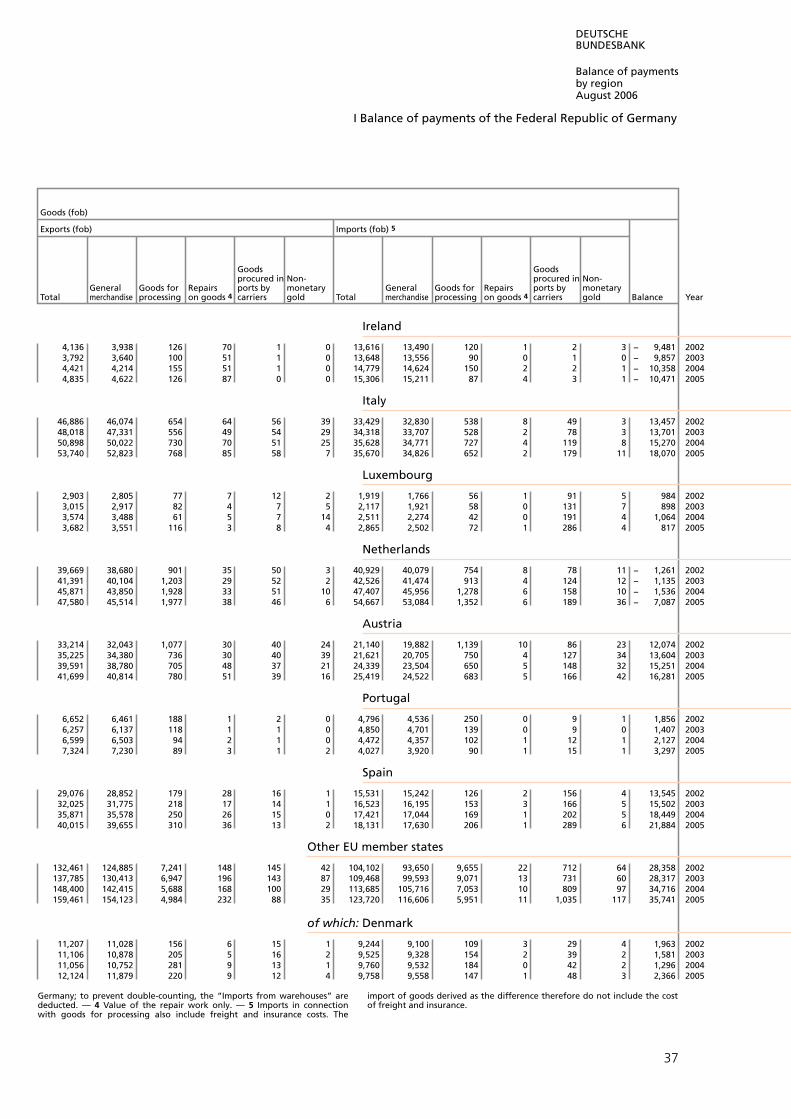
DEUTSCHEBUNDESBANK
Balance of paymentsby regionAugust 2006
I Balance of payments of the Federal Republic of Germany
Goods (fob)
Exports (fob) Imports (fob) 5
Goods Goods
procured in Non- procured in Non-General Goods for Repairs ports by monetary General Goods for Repairs ports by monetary
Total processing on goods 4 carriers gold Total processing on goods 4 carriers gold Balancemerchandise merchandise Year
Ireland
4,136 3,938 126 70 1 0 13,616 13,490 120 1 2 3 − 9,481 20023,792 3,640 100 51 1 0 13,648 13,556 90 0 1 0 − 9,857 20034,421 4,214 155 51 1 0 14,779 14,624 150 2 2 1 − 10,358 20044,835 4,622 126 87 0 0 15,306 15,211 87 4 3 1 − 10,471 2005
Italy
46,886 46,074 654 64 56 39 33,429 32,830 538 8 49 3 13,457 200248,018 47,331 556 49 54 29 34,318 33,707 528 2 78 3 13,701 200350,898 50,022 730 70 51 25 35,628 34,771 727 4 119 8 15,270 200453,740 52,823 768 85 58 7 35,670 34,826 652 2 179 11 18,070 2005
Luxembourg
2,903 2,805 77 7 12 2 1,919 1,766 56 1 91 5 984 20023,015 2,917 82 4 7 5 2,117 1,921 58 0 131 7 898 20033,574 3,488 61 5 7 14 2,511 2,274 42 0 191 4 1,064 20043,682 3,551 116 3 8 4 2,865 2,502 72 1 286 4 817 2005
Netherlands
39,669 38,680 901 35 50 3 40,929 40,079 754 8 78 11 − 1,261 200241,391 40,104 1,203 29 52 2 42,526 41,474 913 4 124 12 − 1,135 200345,871 43,850 1,928 33 51 10 47,407 45,956 1,278 6 158 10 − 1,536 200447,580 45,514 1,977 38 46 6 54,667 53,084 1,352 6 189 36 − 7,087 2005
Austria
33,214 32,043 1,077 30 40 24 21,140 19,882 1,139 10 86 23 12,074 200235,225 34,380 736 30 40 39 21,621 20,705 750 4 127 34 13,604 200339,591 38,780 705 48 37 21 24,339 23,504 650 5 148 32 15,251 200441,699 40,814 780 51 39 16 25,419 24,522 683 5 166 42 16,281 2005
Portugal
6,652 6,461 188 1 2 0 4,796 4,536 250 0 9 1 1,856 20026,257 6,137 118 1 1 0 4,850 4,701 139 0 9 0 1,407 20036,599 6,503 94 2 1 0 4,472 4,357 102 1 12 1 2,127 20047,324 7,230 89 3 1 2 4,027 3,920 90 1 15 1 3,297 2005
Spain
29,076 28,852 179 28 16 1 15,531 15,242 126 2 156 4 13,545 200232,025 31,775 218 17 14 1 16,523 16,195 153 3 166 5 15,502 200335,871 35,578 250 26 15 0 17,421 17,044 169 1 202 5 18,449 200440,015 39,655 310 36 13 2 18,131 17,630 206 1 289 6 21,884 2005
Other EU member states
132,461 124,885 7,241 148 145 42 104,102 93,650 9,655 22 712 64 28,358 2002137,785 130,413 6,947 196 143 87 109,468 99,593 9,071 13 731 60 28,317 2003148,400 142,415 5,688 168 100 29 113,685 105,716 7,053 10 809 97 34,716 2004159,461 154,123 4,984 232 88 35 123,720 116,606 5,951 11 1,035 117 35,741 2005
of which: Denmark
11,207 11,028 156 6 15 1 9,244 9,100 109 3 29 4 1,963 200211,106 10,878 205 5 16 2 9,525 9,328 154 2 39 2 1,581 200311,056 10,752 281 9 13 1 9,760 9,532 184 0 42 2 1,296 200412,124 11,879 220 9 12 4 9,758 9,558 147 1 48 3 2,366 2005
Germany; to prevent double-counting, the “Imports from warehouses” are import of goods derived as the difference therefore do not include the costdeducted. — 4 Value of the repair work only. — 5 Imports in connection of freight and insurance. with goods for processing also include freight and insurance costs. The
37

DEUTSCHEBUNDESBANKE U R O S Y S T E M
Balance of paymentsby regionAugust 2006
I Balance of payments of the Federal Republic of Germany
3 Trade in goods with non-residents (cont’d) * o
€ million
Foreign trade 1 Supplementary trade items
to exports to imports Goods
Additions Additions Freight
of which andof which Imports to insurance
Exports warehouse costs from payable onless importsExports Imports ware- Deductions, from ware- Deductions, Exports Imports imports
Year (fob) (cif) Balance Total houses 2 total Total house 2,3 total (fob) (cif) Balance (cif)
Poland
2002 16,103 14,193 1,909 445 354 320 80 13 204 16,228 14,069 2,158 3982003 16,362 15,888 474 421 315 435 117 13 229 16,347 15,776 571 4402004 18,776 15,973 2,803 257 128 348 167 − 0 173 18,685 15,967 2,718 4482005 21,909 16,093 5,816 182 0 270 330 1 111 21,820 16,312 5,508 452
Sweden
2002 13,496 8,868 4,628 61 − 253 62 − 0 168 13,303 8,762 4,541 3082003 14,240 9,501 4,738 68 − 297 52 0 108 14,011 9,445 4,566 3262004 15,730 10,197 5,532 70 − 328 69 0 179 15,472 10,087 5,385 3512005 17,238 11,308 5,930 77 − 414 88 − 0 122 16,901 11,274 5,627 390
United Kingdom
2002 53,761 33,075 20,685 2,048 − 1,521 2,507 11 633 54,288 34,949 19,338 3202003 55,597 31,712 23,885 2,364 − 2,095 2,599 9 668 55,866 33,643 22,223 3172004 59,986 34,466 25,520 2,894 − 2,403 3,025 8 858 60,477 36,633 23,844 3392005 61,681 39,414 22,268 3,827 − 2,641 3,909 8 726 62,867 42,597 20,271 378
Other European countries
2002 62,572 57,964 4,608 3,807 1,994 3,108 2,484 265 4,053 63,271 56,395 6,876 1,2992003 64,318 60,894 3,424 3,667 1,661 2,657 2,602 174 3,820 65,328 59,676 5,652 1,3442004 75,049 66,058 8,991 3,557 1,686 2,863 2,936 317 4,514 75,744 64,480 11,263 1,6492005 82,972 76,558 6,415 4,289 2,144 3,019 5,596 258 4,510 84,242 77,644 6,598 1,777
of which: Russian Federation
2002 11,374 13,178 − 1,804 428 400 135 83 66 66 11,666 13,195 − 1,529 6712003 12,120 14,231 − 2,111 406 378 122 34 13 64 12,403 14,201 − 1,798 6042004 14,988 16,335 − 1,347 399 375 170 113 90 80 15,218 16,368 − 1,150 8772005 17,282 21,621 − 4,340 441 368 225 52 22 90 17,497 21,584 − 4,086 905
Switzerland
2002 26,702 19,461 7,241 2,549 896 1,902 2,307 201 1,411 27,350 20,357 6,993 02003 26,009 19,093 6,916 2,398 587 1,743 2,386 96 1,224 26,664 20,254 6,410 02004 27,917 21,445 6,472 2,246 545 1,832 2,636 196 1,189 28,331 22,893 5,439 02005 29,579 23,283 6,295 2,672 801 1,900 5,275 196 1,200 30,351 27,358 2,993 0
Africa
2002 11,793 10,247 1,546 310 223 849 138 75 641 11,254 9,744 1,509 5862003 12,070 10,239 1,831 277 175 343 90 26 243 12,005 10,087 1,918 5132004 13,784 11,092 2,692 233 108 382 42 − 31 220 13,636 10,914 2,722 5222005 14,783 13,208 1,575 378 168 419 108 − 2 207 14,743 13,109 1,633 696
America
2002 89,080 52,822 36,259 3,038 597 5,168 5,597 1,141 3,961 86,951 54,458 32,493 2,5942003 79,629 51,948 27,681 3,180 491 5,385 5,241 692 3,693 77,424 53,496 23,928 2,5372004 84,694 54,679 30,015 3,810 769 5,150 6,408 981 3,465 83,354 57,621 25,732 2,7992005 91,970 57,443 34,527 4,563 554 5,225 8,274 647 3,736 91,308 61,981 29,327 3,093
of which: Canada
2002 5,636 2,876 2,760 84 37 388 46 27 351 5,333 2,571 2,761 2392003 4,879 2,525 2,354 88 48 419 18 − 10 165 4,548 2,378 2,170 2042004 4,915 2,485 2,430 64 30 474 54 15 209 4,505 2,329 2,175 2002005 5,501 2,634 2,868 52 17 458 38 − 4 252 5,095 2,420 2,675 220
* Breakdown of the trade in goods shown under item I.1 (a) in the balance according to the official foreign trade statistics (source: Federal Statisticalof payments tables on pp 6−33. — o For the classification of countries into Office). — 2 For account of residents only. — 3 The item “Imports to ware-groups of countries, see list of countries on pp 104−105. — 1 Special trade houses” also includes goods which are subsequently imported into
38

DEUTSCHEBUNDESBANK
Balance of paymentsby regionAugust 2006
I Balance of payments of the Federal Republic of Germany
Goods (fob)
Exports (fob) Imports (fob) 5
Goods Goods
procured in Non- procured in Non-General Goods for Repairs ports by monetary General Goods for Repairs ports by monetary
Total processing on goods 4 carriers gold Total processing on goods 4 carriers gold Balancemerchandise merchandise Year
Poland
16,228 14,804 1,381 4 39 − 13,671 11,589 2,059 1 21 − 2,557 200216,347 15,050 1,253 3 41 − 15,336 13,473 1,835 1 27 − 1,012 200318,685 17,684 972 4 25 1 15,519 14,089 1,378 0 46 6 3,166 200421,820 20,940 860 3 15 3 15,860 14,589 1,200 2 59 11 5,960 2005
Sweden
13,303 13,044 232 13 11 3 8,454 8,220 157 4 16 56 4,849 200214,011 13,640 333 22 10 6 9,119 8,816 221 3 25 53 4,892 200315,472 15,096 344 17 9 6 9,736 9,403 237 2 33 60 5,735 200416,901 16,530 342 10 10 11 10,884 10,532 222 2 48 80 6,017 2005
United Kingdom
54,288 53,018 1,139 85 9 37 34,629 33,162 869 12 583 4 19,659 200255,866 54,481 1,187 112 7 79 33,326 31,866 865 6 584 5 22,540 200360,477 59,187 1,185 79 7 19 36,294 34,728 941 5 615 6 24,183 200462,867 61,666 1,063 119 7 13 42,219 40,588 832 4 786 8 20,649 2005
Other European countries
63,271 58,322 4,464 93 78 314 55,095 50,345 4,550 17 64 119 8,175 200265,328 61,035 3,976 88 54 174 58,332 53,806 4,320 8 59 139 6,996 200375,744 71,012 4,458 101 55 118 62,831 57,864 4,742 10 77 139 12,913 200484,242 79,491 4,422 127 56 147 75,867 70,849 4,705 10 123 180 8,375 2005
of which: Russian Federation
11,666 11,500 150 10 7 − 12,525 12,366 148 1 9 − − 858 200212,403 12,279 110 7 6 0 13,597 13,465 121 1 10 − − 1,194 200315,218 15,012 190 9 5 1 15,491 15,284 159 3 11 34 − 274 200417,497 17,162 280 50 3 1 20,678 20,450 205 2 16 6 − 3,181 2005
Switzerland
27,350 24,845 2,126 33 38 307 20,357 18,671 1,533 13 25 116 6,993 200226,664 24,416 2,033 29 23 162 20,254 18,583 1,507 5 23 136 6,410 200328,331 25,875 2,297 35 24 101 22,892 21,052 1,720 4 26 91 5,439 200430,351 28,049 2,131 26 24 120 27,358 25,500 1,660 4 53 141 2,993 2005
Africa
11,254 10,331 841 81 − − 9,158 8,037 1,086 1 34 − 2,095 200212,005 11,281 657 66 0 − 9,574 8,718 823 1 32 − 2,431 200313,636 12,993 598 44 − 1 10,391 9,626 692 1 49 24 3,244 200414,743 14,127 547 68 − 1 12,413 11,711 609 1 75 17 2,330 2005
America
86,951 82,191 4,313 436 − 11 51,864 47,164 4,289 12 375 25 35,087 200277,424 72,600 4,448 361 − 16 50,960 45,978 4,542 3 429 8 26,465 200383,354 78,121 4,914 310 − 8 54,823 49,527 4,828 4 447 16 28,531 200491,308 86,303 4,620 377 − 9 58,888 53,646 4,560 4 609 69 32,420 2005
of which: Canada
5,333 4,979 308 45 − − 2,332 2,133 185 0 15 − 3,000 20024,548 4,221 288 39 − − 2,174 1,981 171 0 22 − 2,374 20034,505 4,143 329 33 − 0 2,130 1,909 199 0 19 3 2,375 20045,095 4,743 319 33 − 0 2,200 1,957 194 0 23 26 2,895 2005
Germany; to prevent double-counting, the “Imports from warehouses” are import of goods derived as the difference therefore do not include the costdeducted. — 4 Value of the repair work only. — 5 Imports in connection of freight and insurance. with goods for processing also include freight and insurance costs. The
39

DEUTSCHEBUNDESBANKE U R O S Y S T E M
Balance of paymentsby regionAugust 2006
I Balance of payments of the Federal Republic of Germany
3 Trade in goods with non-residents (cont’d) * o
€ million
Foreign trade 1 Supplementary trade items
to exports to imports Goods
Additions Additions Freight
of which andof which Imports to insurance
Exports warehouse costs from payable onless importsExports Imports ware- Deductions, from ware- Deductions, Exports Imports imports
Year (fob) (cif) Balance Total houses 2 total Total house 2,3 total (fob) (cif) Balance (cif)
United States
2002 68,263 40,376 27,887 931 452 4,248 1,542 991 3,389 64,946 38,529 26,417 1,2332003 61,654 39,231 22,423 802 335 4,331 1,179 602 3,316 58,125 37,094 21,031 1,2002004 64,860 40,709 24,151 1,216 633 3,943 1,503 851 3,013 62,133 39,199 22,935 1,2412005 69,311 41,342 27,969 1,152 442 4,294 1,606 651 3,285 66,169 39,663 26,506 1,275
Asia
2002 72,915 79,892 − 6,977 925 510 2,790 2,113 1,648 1,503 71,050 80,502 − 9,452 3,8552003 75,620 84,783 − 9,162 919 402 3,375 2,340 1,797 1,612 73,164 85,510 − 12,346 4,1132004 84,789 98,177 − 13,388 949 429 3,757 3,490 2,603 1,560 81,980 100,107 − 18,127 4,8412005 90,608 106,882 − 16,275 1,119 486 4,201 3,536 2,271 1,636 87,525 108,782 − 21,257 5,385
of which: Japan
2002 12,576 19,896 − 7,320 72 55 490 553 500 319 12,158 20,130 − 7,972 6372003 11,889 19,684 − 7,795 76 59 451 609 562 306 11,513 19,987 − 8,474 6372004 12,719 21,583 − 8,865 98 63 495 1,317 1,265 312 12,321 22,588 − 10,266 7072005 13,330 21,435 − 8,104 169 145 483 1,132 1,014 322 13,017 22,245 − 9,228 718
Emerging markets in South-East Asia
2002 25,282 26,660 − 1,377 298 122 1,082 627 420 579 24,498 26,707 − 2,209 1,5072003 24,515 27,119 − 2,603 338 108 1,144 744 507 503 23,709 27,360 − 3,651 1,5002004 26,838 30,012 − 3,174 292 101 1,415 1,185 776 469 25,715 30,729 − 5,014 1,6202005 27,542 30,596 − 3,054 286 87 1,509 1,169 684 457 26,319 31,308 − 4,988 1,647
Oceania and polar regions
2002 5,026 1,988 3,038 27 22 173 41 32 99 4,880 1,930 2,950 1472003 5,008 1,925 3,083 28 21 166 41 32 85 4,871 1,881 2,989 1302004 5,513 2,184 3,329 34 27 186 39 28 106 5,361 2,117 3,244 1522005 5,847 2,069 3,778 29 19 174 26 12 95 5,702 2,000 3,702 154
International organisations
2002 − − − − − − − − − − − − −2003 − − − − − − − − − − − − −2004 − − − − − − − − − − − − −2005 − − − − − − − − − − − − −
Unidentified countries
2002 1,628 627 1,001 0 − 0 240 − 779 1,628 89 1,539 − 7762003 1,453 700 753 0 0 1 240 0 800 1,452 139 1,313 − 7992004 1,367 618 749 0 − 0 240 − 902 1,367 − 43 1,410 − 9012005 1,427 638 789 − − 1 225 − 1,007 1,426 − 144 1,570 − 1,006
Memo item: Industrial countries
2002 539,302 419,090 120,211 12,476 2,727 18,433 13,373 1,833 13,832 533,344 418,631 114,713 5,1352003 549,731 427,751 121,980 12,741 2,240 18,555 14,020 1,457 12,197 543,918 429,574 114,343 5,3062004 600,097 451,883 148,214 13,525 1,932 19,740 17,481 2,408 13,378 593,882 455,987 137,895 5,5822005 641,702 483,445 158,257 14,684 1,633 19,947 22,149 1,884 13,064 636,439 492,530 143,910 5,884
Emerging markets and developing countries
2002 110,390 98,814 11,576 4,180 1,684 4,145 5,882 1,469 2,255 110,425 102,441 7,984 5,7422003 113,270 106,083 7,187 4,382 1,514 4,376 6,017 1,455 1,939 113,277 110,161 3,115 5,8852004 130,079 122,947 7,133 4,626 1,513 4,874 7,264 1,552 1,927 129,831 128,283 1,548 7,0792005 143,057 141,549 1,508 5,947 1,739 5,192 9,323 1,332 1,986 143,813 148,886 − 5,073 8,074
* Breakdown of the trade in goods shown under item I.1 (a) in the balance according to the official foreign trade statistics (source: Federal Statisticalof payments tables on pp 6−33. — o For the classification of countries into Office). — 2 For account of residents only. — 3 The item “Imports to ware-groups of countries, see list of countries on pp 104−105. — 1 Special trade houses” also includes goods which are subsequently imported into
40

DEUTSCHEBUNDESBANK
Balance of paymentsby regionAugust 2006
I Balance of payments of the Federal Republic of Germany
Goods (fob)
Exports (fob) Imports (fob) 5
Goods Goods
procured in Non- procured in Non-General Goods for Repairs ports by monetary General Goods for Repairs ports by monetary
Total processing on goods 4 carriers gold Total processing on goods 4 carriers gold Balancemerchandise merchandise Year
United States
64,946 60,868 3,723 344 − 11 37,296 33,042 3,939 9 282 25 27,650 200258,125 54,094 3,746 269 − 16 35,894 31,420 4,137 3 326 8 22,231 200362,133 57,827 4,069 230 − 8 37,958 33,266 4,338 3 339 12 24,176 200466,169 62,085 3,787 292 − 6 38,388 34,097 3,807 4 448 31 27,781 2005
Asia
71,050 68,755 1,956 338 − 1 76,648 74,876 1,483 7 280 1 − 5,597 200273,164 70,345 2,374 438 0 7 81,398 79,410 1,718 4 264 0 − 8,233 200381,980 78,804 2,704 417 − 55 95,266 92,893 2,002 3 340 29 − 13,286 200487,525 83,857 3,076 506 − 86 103,397 100,666 2,199 10 428 95 − 15,872 2005
of which: Japan
12,158 11,906 243 8 − 1 19,493 19,270 192 3 27 1 − 7,335 200211,513 11,295 203 14 − 2 19,350 19,172 151 1 26 0 − 7,837 200312,321 12,022 278 20 − 1 21,881 21,652 199 1 29 0 − 9,560 200413,017 12,722 274 15 − 6 21,527 21,274 189 7 57 1 − 8,510 2005
Emerging markets in South-East Asia
24,498 23,591 785 122 − − 25,200 24,466 639 3 92 − − 702 200223,709 22,589 950 167 − 3 25,859 24,988 776 2 94 − − 2,150 200325,715 24,456 1,066 145 − 47 29,109 28,072 888 1 130 18 − 3,394 200426,319 24,925 1,159 162 − 73 29,661 28,540 926 1 145 49 − 3,341 2005
Oceania and polar regions
4,880 4,793 84 3 − − 1,783 1,718 59 1 6 − 3,097 20024,871 4,743 122 5 − 1 1,751 1,660 84 0 7 − 3,119 20035,361 5,281 73 6 − 1 1,965 1,870 45 − 8 42 3,396 20045,702 5,565 123 8 − 6 1,847 1,731 68 − 9 38 3,856 2005
International organisations
− − − − − − − − − − − − − 2002− − − − − − − − − − − − − 2003− − − − − − − − − − − − − 2004− − − − − − − − − − − − − 2005
Unidentified countries
1,628 1,416 6 − − 206 865 600 9 − 0 256 763 20021,452 1,307 1 − − 144 939 735 2 − 0 201 514 20031,367 1,267 2 − − 98 858 849 3 − 0 6 509 20041,426 1,334 1 − − 91 862 752 1 − 0 109 564 2005
Memo item: Industrial countries
533,344 502,384 29,128 950 422 460 413,496 384,588 26,521 94 1,890 401 119,849 2002543,918 512,089 30,172 875 401 382 424,269 395,049 26,627 46 2,161 386 119,649 2003593,882 558,860 33,546 883 347 245 450,404 420,042 27,293 44 2,540 485 143,477 2004636,439 598,642 36,143 1,049 346 260 486,646 454,546 28,122 57 3,314 606 149,793 2005
Emerging markets and developing countries
110,425 105,309 4,596 490 30 − 96,699 91,184 5,121 9 385 − 13,727 2002113,277 107,705 4,967 576 21 8 104,277 98,688 5,210 7 372 − 9,000 2003129,831 123,803 5,426 521 18 64 121,205 115,108 5,520 8 472 97 8,627 2004143,813 137,122 5,892 682 12 105 140,812 134,025 6,009 6 617 155 3,000 2005
Germany; to prevent double-counting, the “Imports from warehouses” are import of goods derived as the difference therefore do not include the costdeducted. — 4 Value of the repair work only. — 5 Imports in connection of freight and insurance. with goods for processing also include freight and insurance costs. The
41
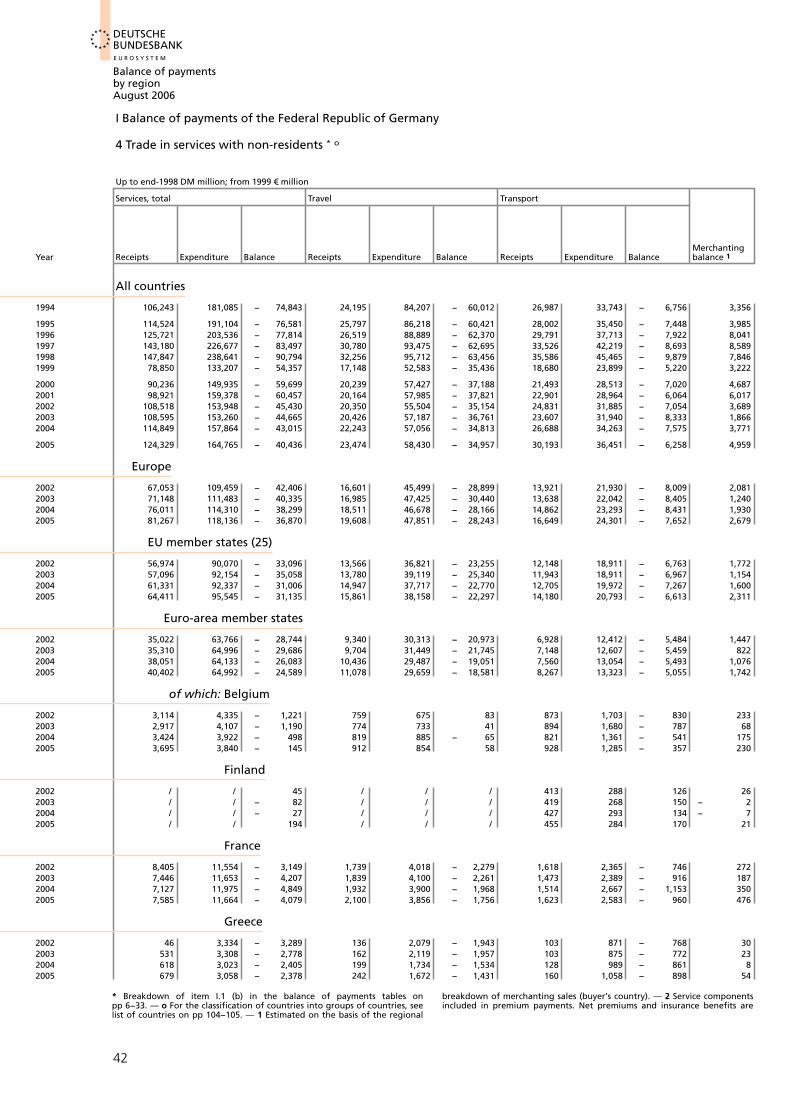
DEUTSCHEBUNDESBANKE U R O S Y S T E M
Balance of paymentsby regionAugust 2006
I Balance of payments of the Federal Republic of Germany
4 Trade in services with non-residents * o
Up to end-1998 DM million; from 1999 € million
Services, total Travel Transport
MerchantingYear Receipts Expenditure Balance Receipts Expenditure Balance Receipts Expenditure Balance balance 1
All countries
1994 106,243 181,085 − 74,843 24,195 84,207 − 60,012 26,987 33,743 − 6,756 3,356
1995 114,524 191,104 − 76,581 25,797 86,218 − 60,421 28,002 35,450 − 7,448 3,9851996 125,721 203,536 − 77,814 26,519 88,889 − 62,370 29,791 37,713 − 7,922 8,0411997 143,180 226,677 − 83,497 30,780 93,475 − 62,695 33,526 42,219 − 8,693 8,5891998 147,847 238,641 − 90,794 32,256 95,712 − 63,456 35,586 45,465 − 9,879 7,8461999 78,850 133,207 − 54,357 17,148 52,583 − 35,436 18,680 23,899 − 5,220 3,222
2000 90,236 149,935 − 59,699 20,239 57,427 − 37,188 21,493 28,513 − 7,020 4,6872001 98,921 159,378 − 60,457 20,164 57,985 − 37,821 22,901 28,964 − 6,064 6,0172002 108,518 153,948 − 45,430 20,350 55,504 − 35,154 24,831 31,885 − 7,054 3,6892003 108,595 153,260 − 44,665 20,426 57,187 − 36,761 23,607 31,940 − 8,333 1,8662004 114,849 157,864 − 43,015 22,243 57,056 − 34,813 26,688 34,263 − 7,575 3,771
2005 124,329 164,765 − 40,436 23,474 58,430 − 34,957 30,193 36,451 − 6,258 4,959
Europe
2002 67,053 109,459 − 42,406 16,601 45,499 − 28,899 13,921 21,930 − 8,009 2,0812003 71,148 111,483 − 40,335 16,985 47,425 − 30,440 13,638 22,042 − 8,405 1,2402004 76,011 114,310 − 38,299 18,511 46,678 − 28,166 14,862 23,293 − 8,431 1,9302005 81,267 118,136 − 36,870 19,608 47,851 − 28,243 16,649 24,301 − 7,652 2,679
EU member states (25)
2002 56,974 90,070 − 33,096 13,566 36,821 − 23,255 12,148 18,911 − 6,763 1,7722003 57,096 92,154 − 35,058 13,780 39,119 − 25,340 11,943 18,911 − 6,967 1,1542004 61,331 92,337 − 31,006 14,947 37,717 − 22,770 12,705 19,972 − 7,267 1,6002005 64,411 95,545 − 31,135 15,861 38,158 − 22,297 14,180 20,793 − 6,613 2,311
Euro-area member states
2002 35,022 63,766 − 28,744 9,340 30,313 − 20,973 6,928 12,412 − 5,484 1,4472003 35,310 64,996 − 29,686 9,704 31,449 − 21,745 7,148 12,607 − 5,459 8222004 38,051 64,133 − 26,083 10,436 29,487 − 19,051 7,560 13,054 − 5,493 1,0762005 40,402 64,992 − 24,589 11,078 29,659 − 18,581 8,267 13,323 − 5,055 1,742
of which: Belgium
2002 3,114 4,335 − 1,221 759 675 83 873 1,703 − 830 2332003 2,917 4,107 − 1,190 774 733 41 894 1,680 − 787 682004 3,424 3,922 − 498 819 885 − 65 821 1,361 − 541 1752005 3,695 3,840 − 145 912 854 58 928 1,285 − 357 230
Finland
2002 / / 45 / / / 413 288 126 262003 / / − 82 / / / 419 268 150 − 22004 / / − 27 / / / 427 293 134 − 72005 / / 194 / / / 455 284 170 21
France
2002 8,405 11,554 − 3,149 1,739 4,018 − 2,279 1,618 2,365 − 746 2722003 7,446 11,653 − 4,207 1,839 4,100 − 2,261 1,473 2,389 − 916 1872004 7,127 11,975 − 4,849 1,932 3,900 − 1,968 1,514 2,667 − 1,153 3502005 7,585 11,664 − 4,079 2,100 3,856 − 1,756 1,623 2,583 − 960 476
Greece
2002 46 3,334 − 3,289 136 2,079 − 1,943 103 871 − 768 302003 531 3,308 − 2,778 162 2,119 − 1,957 103 875 − 772 232004 618 3,023 − 2,405 199 1,734 − 1,534 128 989 − 861 82005 679 3,058 − 2,378 242 1,672 − 1,431 160 1,058 − 898 54
* Breakdown of item I.1 (b) in the balance of payments tables on breakdown of merchanting sales (buyer’s country). — 2 Service componentspp 6−33. — o For the classification of countries into groups of countries, see included in premium payments. Net premiums and insurance benefits arelist of countries on pp 104−105. — 1 Estimated on the basis of the regional
42

DEUTSCHEBUNDESBANK
Balance of paymentsby regionAugust 2006
I Balance of payments of the Federal Republic of Germany
Insurance services 2 Financial services 3 Other services
Receipts Expenditure Balance Receipts Expenditure Balance Receipts Expenditure Balance Year
All countries
2,408 2,702 − 294 2,372 722 1,650 46,924 59,710 − 12,787 1994
1,784 2,124 − 340 3,482 807 2,675 51,473 66,505 − 15,032 19954,112 3,537 575 4,187 1,535 2,653 53,071 71,863 − 18,791 19963,141 3,267 − 127 4,728 2,413 2,315 62,417 85,304 − 22,887 19971,327 3,313 − 1,986 5,882 2,871 3,011 64,950 91,280 − 26,330 19982,501 2,053 448 3,631 2,625 1,005 33,669 52,046 − 18,377 1999
666 1,044 − 378 3,849 2,181 1,668 39,302 60,770 − 21,468 20001,932 1,284 647 3,618 2,538 1,080 44,289 68,605 − 24,316 20017,880 1,453 6,427 3,682 2,258 1,424 48,085 62,847 − 14,762 20026,029 3,148 2,881 3,508 2,143 1,365 53,160 58,843 − 5,683 20032,885 4,252 − 1,366 4,093 2,777 1,316 55,169 59,516 − 4,347 2004
1,697 3,890 − 2,193 5,083 3,454 1,629 58,923 62,540 − 3,616 2005
Europe
2,867 1,098 1,769 2,851 1,736 1,115 28,732 39,195 − 10,463 20023,969 2,407 1,562 2,782 1,713 1,069 32,533 37,895 − 5,362 20032,597 2,998 − 401 3,376 2,242 1,134 34,735 39,100 − 4,365 20041,000 2,727 − 1,728 4,289 2,797 1,493 37,042 40,461 − 3,418 2005
EU member states (25)
2,948 713 2,235 2,595 1,535 1,060 23,945 32,090 − 8,145 20022,633 1,879 755 2,493 1,432 1,061 25,093 30,814 − 5,721 20032,186 1,090 1,096 3,043 1,878 1,166 26,849 31,680 − 4,831 2004
768 995 − 227 3,844 2,428 1,415 27,447 33,171 − 5,725 2005
Euro-area member states
1,471 349 1,122 1,266 674 591 14,570 20,017 − 5,447 20021,193 830 363 1,276 635 641 15,166 19,474 − 4,308 20031,119 568 550 1,586 801 784 16,274 20,223 − 3,949 2004
437 297 140 2,145 1,021 1,123 16,734 20,692 − 3,959 2005
of which: Belgium
113 20 92 35 48 − 13 1,103 1,889 − 787 2002− 11 47 − 58 30 34 − 4 1,163 1,614 − 451 2003
71 48 23 38 84 − 46 1,500 1,544 − 44 2004− 41 22 − 63 65 105 − 40 1,601 1,574 27 2005
Finland
17 − 8 25 6 3 3 218 336 − 117 20025 3 2 6 11 − 5 238 351 − 113 2003
24 2 22 9 8 0 320 434 − 114 200422 4 18 7 3 3 522 506 16 2005
France
887 219 668 146 99 47 3,742 4,854 − 1,112 2002441 250 192 105 149 − 45 3,401 4,765 − 1,364 2003327 196 131 141 144 − 3 2,863 5,069 − 2,206 2004435 326 109 202 125 78 2,749 4,774 − 2,025 2005
Greece − 444 17 − 461 8 5 3 213 362 − 150 2002
21 15 6 38 6 32 185 294 − 110 200344 23 22 13 5 8 226 273 − 47 200429 24 5 19 5 15 176 299 − 123 2005
recorded under current transfers or − in the case of life insurance − under under trade in services. — 3 Mainly receipts of and expenditure on bankfinancial transactions. Only reinsurance business is recorded as a net total commission fees.
43

DEUTSCHEBUNDESBANKE U R O S Y S T E M
Balance of paymentsby regionAugust 2006
I Balance of payments of the Federal Republic of Germany
4 Trade in services with non-residents (cont’d) * o
€ million
Services, total Travel Transport
MerchantingYear Receipts Expenditure Balance Receipts Expenditure Balance Receipts Expenditure Balance balance 1
Ireland
2002 1,664 / − 482 / / / 117 222 − 105 252003 1,710 / − 243 / / / 112 239 − 126 192004 2,036 / − 297 / / / 149 268 − 120 262005 1,841 / − 387 / / / 188 344 − 157 57
Italy
2002 4,454 9,455 − 5,002 1,089 6,449 − 5,360 1,478 1,434 44 2812003 5,106 10,501 − 5,395 1,201 6,317 − 5,116 1,678 1,465 214 2302004 5,161 8,953 − 3,792 1,308 5,312 − 4,003 1,802 1,499 303 2352005 5,461 9,184 − 3,723 1,295 5,476 − 4,181 1,882 1,505 377 449
Luxembourg
2002 1,826 1,507 318 296 337 − 42 67 216 − 148 12003 1,960 1,416 544 317 397 − 80 75 253 − 178 − 152004 2,317 1,914 403 456 622 − 166 79 211 − 132 − 1102005 2,911 2,313 599 453 608 − 155 94 223 − 129 48
Netherlands
2002 6,469 9,171 − 2,702 2,503 2,409 94 971 2,639 − 1,669 2542003 6,622 9,185 − 2,562 2,525 2,853 − 327 1,071 2,744 − 1,673 662004 7,431 9,625 − 2,194 2,616 2,724 − 108 1,255 3,020 − 1,765 1582005 7,650 9,902 − 2,252 2,784 3,202 − 418 1,359 3,165 − 1,806 − 78
Austria
2002 4,249 10,443 − 6,194 1,872 6,014 − 4,141 672 1,383 − 711 672003 4,060 11,374 − 7,313 1,881 6,746 − 4,865 622 1,396 − 774 492004 4,497 11,313 − 6,816 1,984 6,674 − 4,691 638 1,473 − 835 462005 4,784 11,247 − 6,463 2,031 6,388 − 4,357 720 1,484 − 764 124
Portugal
2002 603 1,150 − 547 164 768 − 604 143 166 − 23 332003 635 1,076 − 441 160 693 − 533 118 161 − 42 542004 704 998 − 293 172 577 − 405 139 184 − 45 342005 749 1,053 − 304 175 612 − 437 172 185 − 13 93
Spain
2002 3,290 9,920 − 6,631 585 7,223 − 6,637 473 1,127 − 654 2272003 3,375 9,563 − 6,188 638 6,971 − 6,333 583 1,138 − 555 1442004 3,645 9,153 − 5,508 718 6,653 − 5,935 610 1,088 − 478 1612005 3,707 9,535 − 5,828 817 6,666 − 5,848 687 1,207 − 520 268
Other EU member states
2002 21,952 26,305 − 4,353 4,226 6,508 − 2,282 5,220 6,499 − 1,279 3252003 21,786 27,158 − 5,373 4,075 7,670 − 3,595 4,795 6,303 − 1,508 3322004 23,280 28,203 − 4,923 4,511 8,230 − 3,719 5,144 6,918 − 1,774 5242005 24,008 30,554 − 6,545 4,783 8,499 − 3,716 5,913 7,470 − 1,558 569
of which: Denmark
2002 2,680 2,740 − 60 1,196 993 204 1,030 1,141 − 111 182003 2,860 2,879 − 19 1,227 1,166 61 1,028 1,147 − 119 02004 3,249 2,700 549 1,324 976 348 1,153 1,172 − 20 282005 3,262 2,935 326 1,386 1,004 382 1,298 1,324 − 26 72
* Breakdown of item I.1 (b) in the balance of payments tables on breakdown of merchanting sales (buyer’s country). — 2 Service componentspp 6−33. — o For the classification of countries into groups of countries, see included in premium payments. Net premiums and insurance benefits arelist of countries on pp 104−105. — 1 Estimated on the basis of the regional
44

DEUTSCHEBUNDESBANK
Balance of paymentsby regionAugust 2006
I Balance of payments of the Federal Republic of Germany
Insurance services 2 Financial services 3 Other services
Receipts Expenditure Balance Receipts Expenditure Balance Receipts Expenditure Balance Year
Ireland
183 171 13 101 21 80 1,155 1,522 − 366 2002− 60 − 34 − 26 86 67 19 1,460 1,388 72 2003
5 40 − 35 88 29 59 1,661 1,775 − 114 2004− 231 − 408 177 127 40 86 1,569 2,098 − 529 2005
Italy
82 − 451 533 32 22 10 1,492 2,001 − 509 2002395 514 − 119 50 29 21 1,552 2,176 − 624 2003200 48 153 70 44 26 1,546 2,052 − 505 2004
− 75 13 − 89 55 45 9 1,855 2,145 − 289 2005
Luxembourg − 2 23 − 24 690 324 366 774 608 166 2002
26 1 25 719 195 524 838 570 268 200348 105 − 57 800 329 471 1,044 647 397 200471 228 − 158 1,141 551 590 1,104 703 401 2005
Netherlands
183 346 − 164 174 62 113 2,385 3,715 − 1,330 2002172 2 170 144 59 85 2,644 3,528 − 884 200368 79 − 11 354 77 278 2,980 3,726 − 745 200444 33 11 407 55 352 3,135 3,448 − 313 2005
Austria
355 16 339 39 29 9 1,244 3,001 − 1,757 200220 17 3 66 75 − 8 1,422 3,139 − 1,717 2003
115 10 106 49 65 − 16 1,665 3,091 − 1,427 2004174 26 148 76 72 4 1,659 3,276 − 1,617 2005
Portugal − 19 0 − 19 3 17 − 14 279 199 80 2002
31 − 1 31 2 1 1 270 222 49 200332 1 31 3 3 − 0 324 233 92 200412 1 11 8 2 6 289 253 36 2005
Spain
116 − 5 121 31 45 − 14 1,857 1,531 327 2002153 16 137 31 10 22 1,826 1,428 398 2003184 19 165 21 13 8 1,951 1,380 571 2004
− 1 28 − 29 38 19 20 1,897 1,616 281 2005
Other EU member states
1,477 364 1,113 1,329 860 469 9,375 12,073 − 2,698 20021,440 1,049 391 1,217 796 420 9,926 11,340 − 1,414 20031,068 522 546 1,458 1,077 381 10,575 11,457 − 882 2004
331 698 − 367 1,699 1,407 292 10,713 12,479 − 1,766 2005
of which: Denmark
77 12 65 4 2 2 355 591 − 237 2002222 5 217 7 3 5 375 558 − 182 2003333 10 323 12 5 7 400 537 − 138 200485 27 58 21 2 19 399 578 − 179 2005
recorded under current transfers or − in the case of life insurance − under under trade in services. — 3 Mainly receipts of and expenditure on bankfinancial transactions. Only reinsurance business is recorded as a net total commission fees.
45

DEUTSCHEBUNDESBANKE U R O S Y S T E M
Balance of paymentsby regionAugust 2006
I Balance of payments of the Federal Republic of Germany
4 Trade in services with non-residents (cont’d) * o
€ million
Services, total Travel Transport
MerchantingYear Receipts Expenditure Balance Receipts Expenditure Balance Receipts Expenditure Balance balance 1
Poland
2002 1,240 2,576 − 1,336 544 989 − 444 249 901 − 651 562003 1,261 2,994 − 1,733 515 1,319 − 804 241 942 − 700 352004 1,487 3,656 − 2,168 597 1,874 − 1,277 268 1,017 − 749 612005 1,708 4,077 − 2,369 673 2,067 − 1,395 369 1,095 − 726 82
Sweden
2002 / 2,237 − 126 / / / 483 847 − 364 302003 / 2,416 − 182 / / / 519 873 − 354 282004 / 2,516 − 314 / / / 607 914 − 307 142005 / 2,587 − 305 / / / 681 958 − 277 84
United Kingdom
2002 12,041 14,138 − 2,097 1,151 1,788 − 637 2,826 2,690 135 1372003 11,825 13,551 − 1,726 1,141 1,700 − 559 2,313 2,421 − 108 2242004 11,950 13,495 − 1,544 1,375 1,719 − 344 2,311 2,555 − 244 3612005 11,894 14,627 − 2,734 1,448 1,606 − 158 2,566 2,805 − 239 112
Other European countries
2002 10,079 19,388 − 9,310 3,035 8,678 − 5,643 1,773 3,019 − 1,246 3092003 14,052 19,329 − 5,277 3,205 8,306 − 5,101 1,695 3,132 − 1,437 862004 14,680 21,973 − 7,293 3,564 8,960 − 5,396 2,157 3,321 − 1,164 3302005 16,856 22,591 − 5,735 3,747 9,692 − 5,945 2,469 3,508 − 1,039 367
of which: Russian Federation
2002 / / − 841 / / / 163 625 − 462 672003 / / − 774 / / / 161 683 − 522 122004 / / − 842 / / / 196 731 − 535 32005 / / − 354 / / / 327 869 − 542 45
Switzerland
2002 6,547 9,055 − 2,508 2,241 2,732 − 490 811 627 184 1232003 10,153 8,835 1,318 2,417 2,407 9 744 659 85 392004 10,371 10,222 149 2,693 2,309 385 984 650 334 2122005 11,769 10,035 1,733 2,786 2,565 221 1,089 642 447 179
Africa
2002 2,132 3,650 − 1,518 161 2,195 − 2,034 794 672 122 1032003 2,266 3,120 − 854 169 1,711 − 1,542 727 641 86 492004 2,233 3,605 − 1,372 153 2,149 − 1,997 750 609 141 952005 2,613 3,985 − 1,371 118 2,346 − 2,228 766 685 81 185
America
2002 26,045 25,538 508 2,499 4,487 − 1,988 5,032 4,264 768 6622003 22,082 23,823 − 1,741 2,256 5,114 − 2,858 4,284 3,889 395 2502004 22,018 23,574 − 1,556 2,532 4,903 − 2,372 5,062 3,965 1,097 9462005 24,069 24,584 − 515 2,646 4,313 − 1,667 5,906 4,511 1,394 944
of which: Canada
2002 / / − 261 / / / 589 365 224 132003 / / − 419 / / / 382 345 37 152004 / / − 342 / / / 420 360 60 632005 / / − 444 / / / 490 386 104 61
* Breakdown of item I.1 (b) in the balance of payments tables on breakdown of merchanting sales (buyer’s country). — 2 Service componentspp 6−33. — o For the classification of countries into groups of countries, see included in premium payments. Net premiums and insurance benefits arelist of countries on pp 104−105. — 1 Estimated on the basis of the regional
46
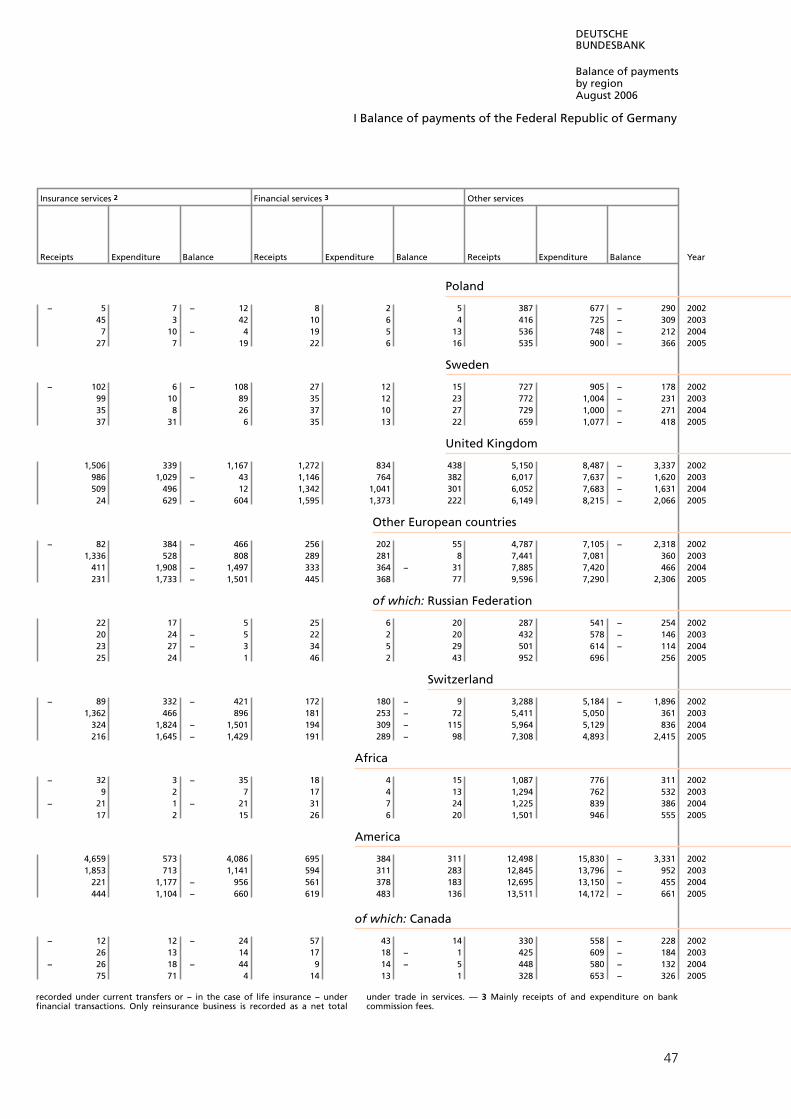
DEUTSCHEBUNDESBANK
Balance of paymentsby regionAugust 2006
I Balance of payments of the Federal Republic of Germany
Insurance services 2 Financial services 3 Other services
Receipts Expenditure Balance Receipts Expenditure Balance Receipts Expenditure Balance Year
Poland − 5 7 − 12 8 2 5 387 677 − 290 2002
45 3 42 10 6 4 416 725 − 309 20037 10 − 4 19 5 13 536 748 − 212 2004
27 7 19 22 6 16 535 900 − 366 2005
Sweden − 102 6 − 108 27 12 15 727 905 − 178 2002
99 10 89 35 12 23 772 1,004 − 231 200335 8 26 37 10 27 729 1,000 − 271 200437 31 6 35 13 22 659 1,077 − 418 2005
United Kingdom
1,506 339 1,167 1,272 834 438 5,150 8,487 − 3,337 2002986 1,029 − 43 1,146 764 382 6,017 7,637 − 1,620 2003509 496 12 1,342 1,041 301 6,052 7,683 − 1,631 200424 629 − 604 1,595 1,373 222 6,149 8,215 − 2,066 2005
Other European countries − 82 384 − 466 256 202 55 4,787 7,105 − 2,318 2002
1,336 528 808 289 281 8 7,441 7,081 360 2003411 1,908 − 1,497 333 364 − 31 7,885 7,420 466 2004231 1,733 − 1,501 445 368 77 9,596 7,290 2,306 2005
of which: Russian Federation
22 17 5 25 6 20 287 541 − 254 200220 24 − 5 22 2 20 432 578 − 146 200323 27 − 3 34 5 29 501 614 − 114 200425 24 1 46 2 43 952 696 256 2005
Switzerland − 89 332 − 421 172 180 − 9 3,288 5,184 − 1,896 2002
1,362 466 896 181 253 − 72 5,411 5,050 361 2003324 1,824 − 1,501 194 309 − 115 5,964 5,129 836 2004216 1,645 − 1,429 191 289 − 98 7,308 4,893 2,415 2005
Africa − 32 3 − 35 18 4 15 1,087 776 311 2002
9 2 7 17 4 13 1,294 762 532 2003− 21 1 − 21 31 7 24 1,225 839 386 2004
17 2 15 26 6 20 1,501 946 555 2005
America
4,659 573 4,086 695 384 311 12,498 15,830 − 3,331 20021,853 713 1,141 594 311 283 12,845 13,796 − 952 2003
221 1,177 − 956 561 378 183 12,695 13,150 − 455 2004444 1,104 − 660 619 483 136 13,511 14,172 − 661 2005
of which: Canada − 12 12 − 24 57 43 14 330 558 − 228 2002
26 13 14 17 18 − 1 425 609 − 184 2003− 26 18 − 44 9 14 − 5 448 580 − 132 2004
75 71 4 14 13 1 328 653 − 326 2005
recorded under current transfers or − in the case of life insurance − under under trade in services. — 3 Mainly receipts of and expenditure on bankfinancial transactions. Only reinsurance business is recorded as a net total commission fees.
47

DEUTSCHEBUNDESBANKE U R O S Y S T E M
Balance of paymentsby regionAugust 2006
I Balance of payments of the Federal Republic of Germany
4 Trade in services with non-residents (cont’d) * o
€ million
Services, total Travel Transport
MerchantingYear Receipts Expenditure Balance Receipts Expenditure Balance Receipts Expenditure Balance balance 1
United States
2002 22,686 20,417 2,269 2,200 2,609 − 408 3,100 3,065 35 5122003 17,935 18,268 − 333 1,978 2,838 − 859 2,823 2,776 48 1692004 17,507 18,599 − 1,091 2,251 3,031 − 780 3,134 2,654 480 5122005 18,812 18,937 − 124 2,322 2,617 − 295 3,556 3,000 556 577
Asia
2002 12,011 14,089 − 2,078 980 2,715 − 1,735 4,724 4,828 − 104 7162003 11,956 13,432 − 1,477 911 2,306 − 1,396 4,580 5,159 − 579 3342004 12,778 14,855 − 2,077 926 2,765 − 1,840 5,268 5,941 − 674 7492005 14,503 16,429 − 1,925 979 3,174 − 2,195 6,167 6,468 − 301 1,048
of which: Japan
2002 2,964 2,061 903 / / / 991 796 195 792003 2,814 2,164 650 / / / 842 763 79 702004 2,760 2,342 418 / / / 986 902 84 862005 2,957 2,392 566 / / / 1,093 1,111 − 18 151
Emerging markets in South-East Asia
2002 4,245 / − 1,600 / / / 1,997 2,033 − 36 4062003 4,200 / − 1,016 / / / 2,084 2,275 − 190 1462004 4,746 / − 923 / / / 2,390 2,612 − 223 4442005 5,198 / − 867 / / / 2,596 2,744 − 148 534
Oceania and polar regions
2002 / / − 186 / / / 359 191 168 1272003 / / − 479 / / / 373 209 165 − 82004 / / − 331 / / / 439 222 217 502005 / / − 187 / / / 435 158 277 104
International organisations
2002 312 105 208 − − − − − − −2003 456 265 191 − − − − 0 − 0 −2004 922 337 585 − − − 300 232 68 −2005 775 368 407 − − − 264 325 − 61 −
Unidentified countries
2002 44 2 43 32 − 32 1 0 1 −2003 35 4 31 27 − 27 6 1 5 −2004 38 3 35 28 − 28 7 1 6 −2005 36 10 25 22 − 22 6 2 3 −
Memo item: Industrial countries
2002 93,003 129,676 − 36,673 18,892 46,726 − 27,834 18,521 25,386 − 6,865 2,6852003 91,715 129,708 − 37,993 18,981 48,979 − 29,998 17,657 25,065 − 7,408 1,4762004 95,878 132,619 − 36,741 20,755 48,145 − 27,390 19,364 26,276 − 6,911 2,5902005 102,165 136,564 − 34,399 21,828 48,819 − 26,991 21,588 27,662 − 6,074 3,445
Emerging markets and developing countries
2002 15,157 24,165 − 9,007 1,426 8,778 − 7,353 6,309 6,499 − 190 1,0052003 16,390 23,283 − 6,893 1,418 8,207 − 6,789 5,945 6,875 − 930 3912004 18,011 24,905 − 6,894 1,460 8,911 − 7,451 7,016 7,755 − 738 1,1812005 21,353 27,822 − 6,469 1,624 9,611 − 7,987 8,335 8,462 − 126 1,514
* Breakdown of item I.1 (b) in the balance of payments tables on breakdown of merchanting sales (buyer’s country). — 2 Service componentspp 6−33. — o For the classification of countries into groups of countries, see included in premium payments. Net premiums and insurance benefits arelist of countries on pp 104−105. — 1 Estimated on the basis of the regional
48
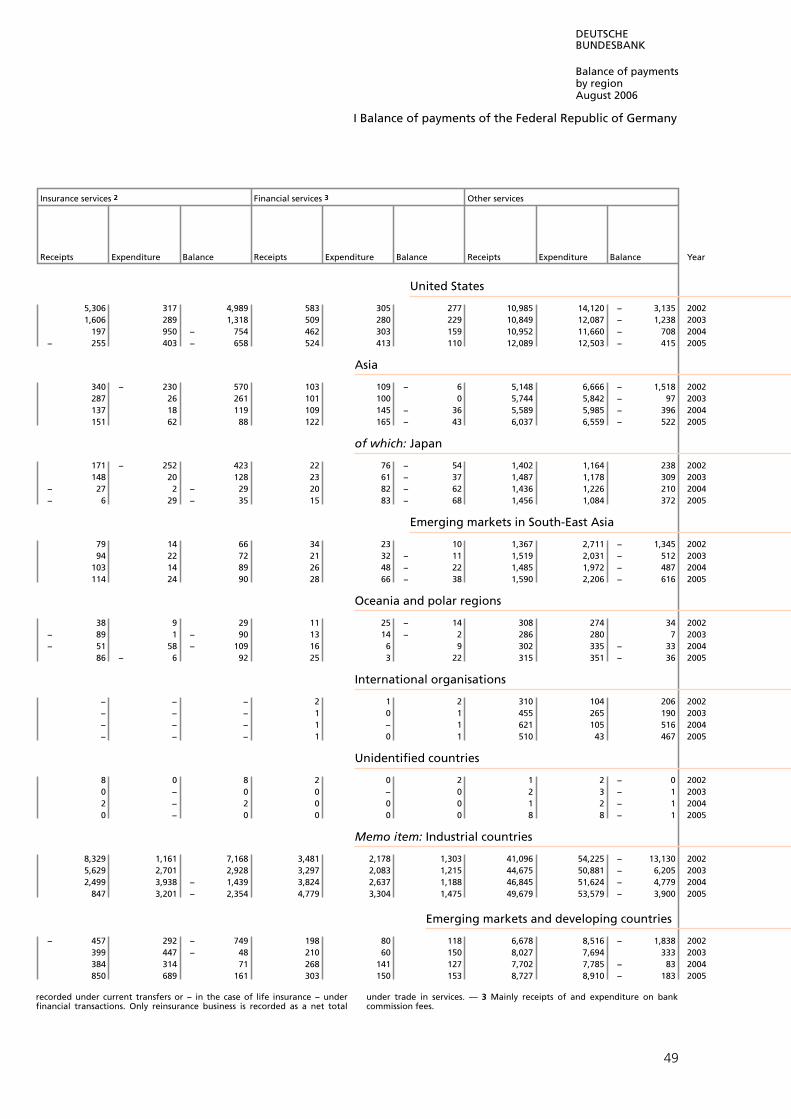
DEUTSCHEBUNDESBANK
Balance of paymentsby regionAugust 2006
I Balance of payments of the Federal Republic of Germany
Insurance services 2 Financial services 3 Other services
Receipts Expenditure Balance Receipts Expenditure Balance Receipts Expenditure Balance Year
United States
5,306 317 4,989 583 305 277 10,985 14,120 − 3,135 20021,606 289 1,318 509 280 229 10,849 12,087 − 1,238 2003
197 950 − 754 462 303 159 10,952 11,660 − 708 2004− 255 403 − 658 524 413 110 12,089 12,503 − 415 2005
Asia
340 − 230 570 103 109 − 6 5,148 6,666 − 1,518 2002287 26 261 101 100 0 5,744 5,842 − 97 2003137 18 119 109 145 − 36 5,589 5,985 − 396 2004151 62 88 122 165 − 43 6,037 6,559 − 522 2005
of which: Japan
171 − 252 423 22 76 − 54 1,402 1,164 238 2002148 20 128 23 61 − 37 1,487 1,178 309 2003
− 27 2 − 29 20 82 − 62 1,436 1,226 210 2004− 6 29 − 35 15 83 − 68 1,456 1,084 372 2005
Emerging markets in South-East Asia
79 14 66 34 23 10 1,367 2,711 − 1,345 200294 22 72 21 32 − 11 1,519 2,031 − 512 2003
103 14 89 26 48 − 22 1,485 1,972 − 487 2004114 24 90 28 66 − 38 1,590 2,206 − 616 2005
Oceania and polar regions
38 9 29 11 25 − 14 308 274 34 2002− 89 1 − 90 13 14 − 2 286 280 7 2003− 51 58 − 109 16 6 9 302 335 − 33 2004
86 − 6 92 25 3 22 315 351 − 36 2005
International organisations
− − − 2 1 2 310 104 206 2002− − − 1 0 1 455 265 190 2003− − − 1 − 1 621 105 516 2004− − − 1 0 1 510 43 467 2005
Unidentified countries
8 0 8 2 0 2 1 2 − 0 20020 − 0 0 − 0 2 3 − 1 20032 − 2 0 0 0 1 2 − 1 20040 − 0 0 0 0 8 8 − 1 2005
Memo item: Industrial countries
8,329 1,161 7,168 3,481 2,178 1,303 41,096 54,225 − 13,130 20025,629 2,701 2,928 3,297 2,083 1,215 44,675 50,881 − 6,205 20032,499 3,938 − 1,439 3,824 2,637 1,188 46,845 51,624 − 4,779 2004
847 3,201 − 2,354 4,779 3,304 1,475 49,679 53,579 − 3,900 2005
Emerging markets and developing countries − 457 292 − 749 198 80 118 6,678 8,516 − 1,838 2002
399 447 − 48 210 60 150 8,027 7,694 333 2003384 314 71 268 141 127 7,702 7,785 − 83 2004850 689 161 303 150 153 8,727 8,910 − 183 2005
recorded under current transfers or − in the case of life insurance − under under trade in services. — 3 Mainly receipts of and expenditure on bankfinancial transactions. Only reinsurance business is recorded as a net total commission fees.
49

DEUTSCHEBUNDESBANKE U R O S Y S T E M
Balance of paymentsby regionAugust 2006
I Balance of payments of the Federal Republic of Germany
5 Factor income * o
Up to end-1998 DM million; from 1999 € million
Factor income, total Compensation of employees 1 Investment income
Total Investment income received from
for portfolio investment 2 for direct
Year Receipts Expenditure Balance Receipts Expenditure Balance Receipts Expenditure Balance investment Total Dividends
All countries
1994 114,857 112,464 2,393 7,105 6,823 282 107,752 105,641 2,111 11,621 33,390 4,044
1995 117,298 121,273 − 3,975 6,454 7,983 − 1,530 110,845 113,290 − 2,445 13,419 33,236 3,7591996 125,544 124,492 1,052 6,517 8,440 − 1,923 119,027 116,053 2,975 22,769 35,456 3,0881997 142,651 147,391 − 4,740 6,640 8,939 − 2,299 136,011 138,452 − 2,441 26,543 40,194 4,1041998 148,725 167,360 − 18,635 6,856 9,038 − 2,183 141,869 158,322 − 16,453 27,145 46,672 6,0031999 86,860 98,275 − 11,415 3,527 5,020 − 1,494 83,333 93,254 − 9,921 14,189 29,430 4,764
2000 115,986 124,320 − 8,335 3,916 5,626 − 1,710 112,070 118,695 − 6,625 18,474 40,106 9,0832001 101,889 112,822 − 10,932 4,336 6,153 − 1,817 97,553 106,669 − 9,115 4,505 45,887 9,5272002 103,891 121,912 − 18,022 4,913 6,331 − 1,418 98,978 115,581 − 16,603 8,924 46,787 8,6962003 104,149 120,074 − 15,925 4,996 6,237 − 1,241 99,154 113,837 − 14,684 15,379 44,603 7,0532004 120,093 119,459 635 5,213 6,153 − 940 114,880 113,306 1,575 27,753 47,396 9,088
2005 138,741 130,098 8,643 5,208 6,827 − 1,618 133,533 123,271 10,262 34,177 52,806 9,416
Europe
2002 79,559 101,653 − 22,094 3,508 6,260 − 2,752 76,051 95,393 − 19,342 8,017 36,274 6,3112003 82,148 102,214 − 20,065 3,615 6,147 − 2,532 78,533 96,066 − 17,534 12,853 35,865 5,2432004 94,607 102,448 − 7,841 3,735 6,064 − 2,329 90,871 96,384 − 5,512 20,465 39,430 7,2872005 108,708 110,412 − 1,704 4,036 6,734 − 2,698 104,672 103,678 994 25,076 43,570 7,179
EU member states (25)
2002 70,691 94,181 − 23,490 1,892 5,887 − 3,995 68,799 88,294 − 19,495 6,658 34,542 5,7162003 73,255 93,920 − 20,665 2,121 5,728 − 3,606 71,134 88,193 − 17,059 11,094 34,111 4,7102004 84,265 95,299 − 11,035 2,343 5,632 − 3,288 81,921 89,668 − 7,746 17,853 37,783 6,7232005 96,659 100,860 − 4,201 2,781 6,166 − 3,386 93,879 94,694 − 815 21,801 41,842 6,557
Euro-area member states
2002 51,052 67,217 − 16,165 1,563 3,083 − 1,520 49,489 64,134 − 14,646 5,728 27,297 3,5682003 50,978 70,110 − 19,132 1,736 2,931 − 1,195 49,243 67,179 − 17,937 7,230 27,366 3,0422004 60,515 69,403 − 8,888 1,910 2,772 − 862 58,605 66,631 − 8,025 12,917 31,663 5,2002005 68,688 72,693 − 4,005 2,243 2,683 − 440 66,445 70,011 − 3,566 15,973 34,666 4,566
of which: Belgium
2002 2,709 21,801 − 19,091 25 102 − 77 2,685 21,698 − 19,014 642 967 922003 3,309 25,116 − 21,807 26 99 − 73 3,283 25,016 − 21,734 1,126 1,210 822004 3,211 24,964 − 21,753 27 95 − 69 3,184 24,868 − 21,684 1,056 1,140 1272005 3,611 26,214 − 22,603 47 94 − 46 3,564 26,121 − 22,557 1,309 1,209 186
Finland
2002 794 1,639 − 846 0 0 0 793 1,639 − 846 94 543 1892003 865 773 92 0 0 0 865 773 92 91 557 1402004 899 321 578 0 0 0 898 320 578 119 636 2132005 1,022 384 638 0 0 0 1,022 384 638 152 690 206
France
2002 7,824 6,589 1,235 120 2,093 − 1,973 7,704 4,496 3,208 1,124 3,356 1,2882003 7,752 7,153 599 121 1,982 − 1,861 7,631 5,171 2,460 1,119 3,683 1,0332004 10,788 7,541 3,247 107 1,881 − 1,775 10,681 5,660 5,021 2,510 5,558 2,0212005 11,772 8,007 3,765 112 1,835 − 1,723 11,660 6,172 5,488 3,128 5,723 1,519
Greece
2002 1,157 74 1,083 2 0 2 1,154 74 1,081 56 774 132003 1,163 98 1,065 1 0 0 1,162 98 1,065 85 817 102004 1,628 109 1,519 1 0 0 1,627 108 1,519 139 1,164 262005 2,130 128 2,003 1 0 0 2,129 127 2,002 169 1,533 73
* Breakdown of item I.2 in the balance of payments tables on pp 6−33. — countries on pp 104−105. — 1 Earnings of employed persons. — 2 Excludingo For the classification of countries into groups of countries, see list of income from direct investment. — 3 From 1991 including retained
50
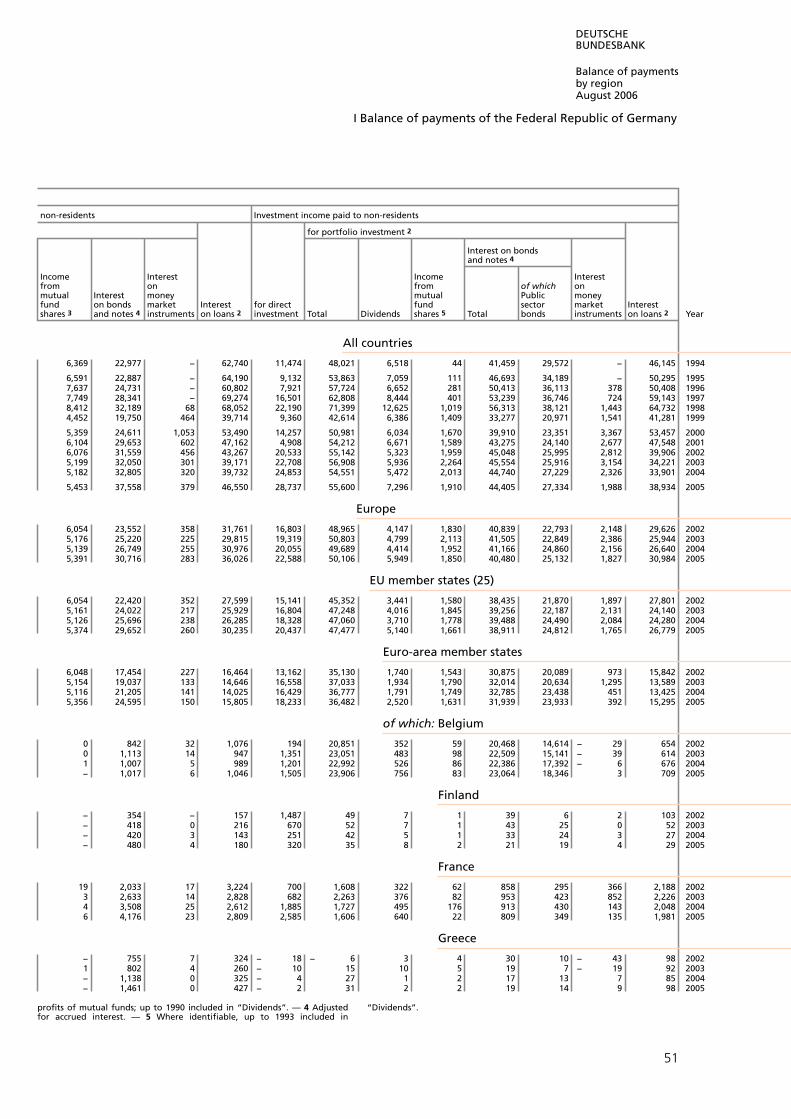
DEUTSCHEBUNDESBANK
Balance of paymentsby regionAugust 2006
I Balance of payments of the Federal Republic of Germany
non-residents Investment income paid to non-residents
for portfolio investment 2
Interest on bondsand notes 4
Income Interest Income Interestfrom on from of which onmutual Interest money mutual Public moneyfund on bonds market Interest for direct fund sector market Interestshares 3 instruments on loans 2 investment Total Dividends shares 5 Total bonds instruments on loans 2 and notes 4 Year
All countries
6,369 22,977 − 62,740 11,474 48,021 6,518 44 41,459 29,572 − 46,145 1994
6,591 22,887 − 64,190 9,132 53,863 7,059 111 46,693 34,189 − 50,295 19957,637 24,731 − 60,802 7,921 57,724 6,652 281 50,413 36,113 378 50,408 19967,749 28,341 − 69,274 16,501 62,808 8,444 401 53,239 36,746 724 59,143 19978,412 32,189 68 68,052 22,190 71,399 12,625 1,019 56,313 38,121 1,443 64,732 19984,452 19,750 464 39,714 9,360 42,614 6,386 1,409 33,277 20,971 1,541 41,281 1999
5,359 24,611 1,053 53,490 14,257 50,981 6,034 1,670 39,910 23,351 3,367 53,457 20006,104 29,653 602 47,162 4,908 54,212 6,671 1,589 43,275 24,140 2,677 47,548 20016,076 31,559 456 43,267 20,533 55,142 5,323 1,959 45,048 25,995 2,812 39,906 20025,199 32,050 301 39,171 22,708 56,908 5,936 2,264 45,554 25,916 3,154 34,221 20035,182 32,805 320 39,732 24,853 54,551 5,472 2,013 44,740 27,229 2,326 33,901 2004
5,453 37,558 379 46,550 28,737 55,600 7,296 1,910 44,405 27,334 1,988 38,934 2005
Europe
6,054 23,552 358 31,761 16,803 48,965 4,147 1,830 40,839 22,793 2,148 29,626 20025,176 25,220 225 29,815 19,319 50,803 4,799 2,113 41,505 22,849 2,386 25,944 20035,139 26,749 255 30,976 20,055 49,689 4,414 1,952 41,166 24,860 2,156 26,640 20045,391 30,716 283 36,026 22,588 50,106 5,949 1,850 40,480 25,132 1,827 30,984 2005
EU member states (25)
6,054 22,420 352 27,599 15,141 45,352 3,441 1,580 38,435 21,870 1,897 27,801 20025,161 24,022 217 25,929 16,804 47,248 4,016 1,845 39,256 22,187 2,131 24,140 20035,126 25,696 238 26,285 18,328 47,060 3,710 1,778 39,488 24,490 2,084 24,280 20045,374 29,652 260 30,235 20,437 47,477 5,140 1,661 38,911 24,812 1,765 26,779 2005
Euro-area member states
6,048 17,454 227 16,464 13,162 35,130 1,740 1,543 30,875 20,089 973 15,842 20025,154 19,037 133 14,646 16,558 37,033 1,934 1,790 32,014 20,634 1,295 13,589 20035,116 21,205 141 14,025 16,429 36,777 1,791 1,749 32,785 23,438 451 13,425 20045,356 24,595 150 15,805 18,233 36,482 2,520 1,631 31,939 23,933 392 15,295 2005
of which: Belgium
0 842 32 1,076 194 20,851 352 59 20,468 14,614 − 29 654 20020 1,113 14 947 1,351 23,051 483 98 22,509 15,141 − 39 614 20031 1,007 5 989 1,201 22,992 526 86 22,386 17,392 − 6 676 2004− 1,017 6 1,046 1,505 23,906 756 83 23,064 18,346 3 709 2005
Finland
− 354 − 157 1,487 49 7 1 39 6 2 103 2002− 418 0 216 670 52 7 1 43 25 0 52 2003− 420 3 143 251 42 5 1 33 24 3 27 2004− 480 4 180 320 35 8 2 21 19 4 29 2005
France
19 2,033 17 3,224 700 1,608 322 62 858 295 366 2,188 20023 2,633 14 2,828 682 2,263 376 82 953 423 852 2,226 20034 3,508 25 2,612 1,885 1,727 495 176 913 430 143 2,048 20046 4,176 23 2,809 2,585 1,606 640 22 809 349 135 1,981 2005
Greece
− 755 7 324 − 18 − 6 3 4 30 10 − 43 98 20021 802 4 260 − 10 15 10 5 19 7 − 19 92 2003− 1,138 0 325 − 4 27 1 2 17 13 7 85 2004− 1,461 0 427 − 2 31 2 2 19 14 9 98 2005
profits of mutual funds; up to 1990 included in “Dividends”. — 4 Adjusted “Dividends”. for accrued interest. — 5 Where identifiable, up to 1993 included in
51
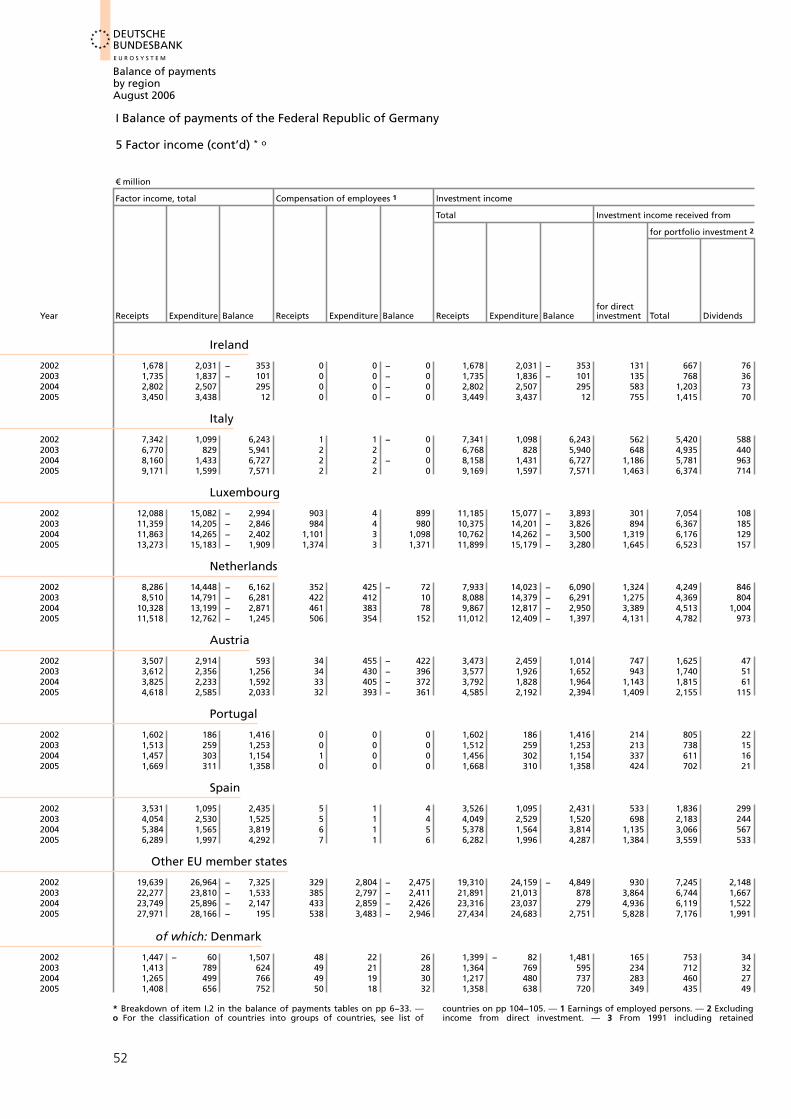
DEUTSCHEBUNDESBANKE U R O S Y S T E M
Balance of paymentsby regionAugust 2006
I Balance of payments of the Federal Republic of Germany
5 Factor income (cont’d) * o
€ million
Factor income, total Compensation of employees 1 Investment income
Total Investment income received from
for portfolio investment 2 for direct
Year Receipts Expenditure Balance Receipts Expenditure Balance Receipts Expenditure Balance investment Total Dividends
Ireland
2002 1,678 2,031 − 353 0 0 − 0 1,678 2,031 − 353 131 667 762003 1,735 1,837 − 101 0 0 − 0 1,735 1,836 − 101 135 768 362004 2,802 2,507 295 0 0 − 0 2,802 2,507 295 583 1,203 732005 3,450 3,438 12 0 0 − 0 3,449 3,437 12 755 1,415 70
Italy
2002 7,342 1,099 6,243 1 1 − 0 7,341 1,098 6,243 562 5,420 5882003 6,770 829 5,941 2 2 0 6,768 828 5,940 648 4,935 4402004 8,160 1,433 6,727 2 2 − 0 8,158 1,431 6,727 1,186 5,781 9632005 9,171 1,599 7,571 2 2 0 9,169 1,597 7,571 1,463 6,374 714
Luxembourg
2002 12,088 15,082 − 2,994 903 4 899 11,185 15,077 − 3,893 301 7,054 1082003 11,359 14,205 − 2,846 984 4 980 10,375 14,201 − 3,826 894 6,367 1852004 11,863 14,265 − 2,402 1,101 3 1,098 10,762 14,262 − 3,500 1,319 6,176 1292005 13,273 15,183 − 1,909 1,374 3 1,371 11,899 15,179 − 3,280 1,645 6,523 157
Netherlands
2002 8,286 14,448 − 6,162 352 425 − 72 7,933 14,023 − 6,090 1,324 4,249 8462003 8,510 14,791 − 6,281 422 412 10 8,088 14,379 − 6,291 1,275 4,369 8042004 10,328 13,199 − 2,871 461 383 78 9,867 12,817 − 2,950 3,389 4,513 1,0042005 11,518 12,762 − 1,245 506 354 152 11,012 12,409 − 1,397 4,131 4,782 973
Austria
2002 3,507 2,914 593 34 455 − 422 3,473 2,459 1,014 747 1,625 472003 3,612 2,356 1,256 34 430 − 396 3,577 1,926 1,652 943 1,740 512004 3,825 2,233 1,592 33 405 − 372 3,792 1,828 1,964 1,143 1,815 612005 4,618 2,585 2,033 32 393 − 361 4,585 2,192 2,394 1,409 2,155 115
Portugal
2002 1,602 186 1,416 0 0 0 1,602 186 1,416 214 805 222003 1,513 259 1,253 0 0 0 1,512 259 1,253 213 738 152004 1,457 303 1,154 1 0 0 1,456 302 1,154 337 611 162005 1,669 311 1,358 0 0 0 1,668 310 1,358 424 702 21
Spain
2002 3,531 1,095 2,435 5 1 4 3,526 1,095 2,431 533 1,836 2992003 4,054 2,530 1,525 5 1 4 4,049 2,529 1,520 698 2,183 2442004 5,384 1,565 3,819 6 1 5 5,378 1,564 3,814 1,135 3,066 5672005 6,289 1,997 4,292 7 1 6 6,282 1,996 4,287 1,384 3,559 533
Other EU member states
2002 19,639 26,964 − 7,325 329 2,804 − 2,475 19,310 24,159 − 4,849 930 7,245 2,1482003 22,277 23,810 − 1,533 385 2,797 − 2,411 21,891 21,013 878 3,864 6,744 1,6672004 23,749 25,896 − 2,147 433 2,859 − 2,426 23,316 23,037 279 4,936 6,119 1,5222005 27,971 28,166 − 195 538 3,483 − 2,946 27,434 24,683 2,751 5,828 7,176 1,991
of which: Denmark
2002 1,447 − 60 1,507 48 22 26 1,399 − 82 1,481 165 753 342003 1,413 789 624 49 21 28 1,364 769 595 234 712 322004 1,265 499 766 49 19 30 1,217 480 737 283 460 272005 1,408 656 752 50 18 32 1,358 638 720 349 435 49
* Breakdown of item I.2 in the balance of payments tables on pp 6−33. — countries on pp 104−105. — 1 Earnings of employed persons. — 2 Excludingo For the classification of countries into groups of countries, see list of income from direct investment. — 3 From 1991 including retained
52

DEUTSCHEBUNDESBANK
Balance of paymentsby regionAugust 2006
I Balance of payments of the Federal Republic of Germany
non-residents Investment income paid to non-residents
for portfolio investment 2
Interest on bondsand notes 4
Income Interest Income Interestfrom on from of which onmutual Interest money mutual Public moneyfund on bonds market Interest for direct fund sector market Interestshares 3 instruments on loans 2 investment Total Dividends shares 5 Total bonds instruments on loans 2 and notes 4 Year
Ireland
33 533 24 881 781 206 30 3 164 71 9 1,044 200280 635 17 832 400 274 26 5 233 107 9 1,163 200399 998 34 1,015 444 404 18 1 383 224 1 1,659 200459 1,250 37 1,278 579 467 25 2 439 259 1 2,392 2005
Italy
− 4,822 10 1,358 36 309 101 17 176 85 16 752 20021 4,487 7 1,185 − 223 466 125 30 301 173 11 585 2003− 4,809 9 1,191 224 564 86 10 463 112 6 643 20041 5,650 10 1,332 321 597 129 11 450 56 6 679 2005
Luxembourg
5,994 902 51 3,829 1,781 8,756 499 1,057 7,012 3,838 187 4,541 20025,067 1,094 21 3,114 2,711 7,690 459 1,278 5,883 3,648 70 3,799 20035,002 1,019 25 3,267 2,357 7,901 441 1,349 6,067 4,180 46 4,003 20045,278 1,059 30 3,731 2,664 7,178 526 1,348 5,298 3,875 7 5,337 2005
Netherlands
2 3,337 65 2,360 7,383 1,903 154 132 1,275 879 342 4,738 20021 3,527 37 2,444 8,991 1,630 203 111 1,236 816 80 3,758 20031 3,481 27 1,965 8,423 1,333 69 42 1,030 666 191 3,061 20041 3,782 26 2,099 8,455 1,251 155 22 918 568 155 2,703 2005
Austria
1 1,568 10 1,101 579 944 229 182 488 152 45 935 20022 1,674 12 895 307 896 160 153 542 162 40 723 20038 1,744 2 833 371 716 114 69 513 167 20 741 2004
10 2,028 2 1,021 500 848 216 121 487 179 25 844 2005
Portugal
− 781 3 582 18 71 3 3 59 48 6 97 2002− 720 2 562 14 118 5 4 104 99 4 128 2003− 588 7 508 14 126 2 2 122 118 1 162 20040 672 8 543 17 106 1 2 103 102 0 187 2005
Spain
0 1,528 8 1,157 221 440 39 23 306 91 72 434 2002− 1,934 5 1,169 1,666 555 79 23 167 21 286 308 20030 2,495 3 1,177 962 286 35 12 201 85 39 316 20041 3,021 4 1,340 1,289 379 63 16 254 144 46 327 2005
Other EU member states
6 4,966 125 11,135 1,979 10,222 1,701 37 7,560 1,781 924 11,959 20027 4,985 84 11,283 246 10,216 2,082 55 7,242 1,552 837 10,552 2003
10 4,490 97 12,261 1,899 10,283 1,919 29 6,703 1,053 1,633 10,855 200418 5,057 110 14,430 2,204 10,995 2,620 31 6,971 879 1,373 11,484 2005
of which: Denmark
− 717 2 482 − 384 141 34 3 77 13 28 160 2002− 678 2 418 473 75 34 5 18 9 20 220 2003− 431 2 473 275 100 38 1 57 42 4 105 2004− 383 2 574 383 139 60 1 74 52 4 116 2005
profits of mutual funds; up to 1990 included in “Dividends”. — 4 Adjusted “Dividends”. for accrued interest. — 5 Where identifiable, up to 1993 included in
53

DEUTSCHEBUNDESBANKE U R O S Y S T E M
Balance of paymentsby regionAugust 2006
I Balance of payments of the Federal Republic of Germany
5 Factor income (cont’d) * o
€ million
Factor income, total Compensation of employees 1 Investment income
Total Investment income received from
for portfolio investment 2 for direct
Year Receipts Expenditure Balance Receipts Expenditure Balance Receipts Expenditure Balance investment Total Dividends
Poland
2002 526 2,489 − 1,963 3 2,203 − 2,201 523 286 237 22 177 402003 617 2,476 − 1,859 2 2,269 − 2,268 615 206 409 100 199 32004 1,379 2,605 − 1,226 2 2,419 − 2,418 1,378 186 1,192 841 263 192005 1,541 3,260 − 1,719 2 3,091 − 3,089 1,539 169 1,370 1,058 282 10
Sweden
2002 1,469 1,121 348 0 0 0 1,469 1,121 348 291 639 1352003 1,484 655 829 0 0 0 1,483 655 829 330 663 1152004 1,913 1,061 852 0 0 0 1,912 1,061 851 798 572 1282005 2,251 1,302 949 0 0 0 2,250 1,302 948 956 702 227
United Kingdom
2002 13,818 21,368 − 7,550 274 1 273 13,544 21,367 − 7,823 − 561 4,787 1,8962003 16,304 18,005 − 1,702 332 2 330 15,972 18,004 − 2,032 1,906 4,437 1,4882004 15,520 20,004 − 4,484 380 2 378 15,141 20,002 − 4,861 558 4,055 1,2902005 18,213 21,139 − 2,926 482 2 480 17,732 21,137 − 3,406 404 4,786 1,657
Other European countries
2002 8,868 7,472 1,396 1,615 373 1,243 7,252 7,100 153 1,358 1,732 5952003 8,893 8,293 600 1,494 420 1,074 7,399 7,874 − 475 1,759 1,754 5342004 10,342 7,149 3,193 1,392 433 959 8,950 6,716 2,234 2,612 1,647 5652005 12,049 9,552 2,497 1,256 568 687 10,793 8,984 1,809 3,275 1,727 622
of which: Russian Federation
2002 2,015 428 1,587 1 18 − 17 2,014 410 1,604 172 131 512003 1,921 427 1,494 3 24 − 21 1,918 403 1,516 280 135 662004 2,689 436 2,253 3 22 − 19 2,687 415 2,272 425 129 592005 3,505 509 2,995 3 23 − 20 3,502 486 3,016 534 136 60
Switzerland
2002 4,704 5,670 − 966 1,606 79 1,527 3,098 5,592 − 2,494 941 639 5132003 4,560 5,088 − 528 1,484 90 1,394 3,076 4,998 − 1,922 1,153 575 4272004 4,912 4,529 383 1,381 91 1,290 3,531 4,438 − 907 1,586 580 4502005 5,328 4,973 354 1,244 91 1,152 4,084 4,882 − 798 1,986 578 483
Africa
2002 1,049 379 670 9 16 − 7 1,040 363 677 340 123 112003 1,021 346 675 10 20 − 10 1,012 326 686 287 117 82004 1,081 377 704 10 18 − 9 1,072 359 713 422 120 72005 1,270 524 746 11 18 − 8 1,259 506 753 500 152 14
America
2002 15,093 13,339 1,754 919 5 914 14,174 13,334 840 − 1,745 8,340 1,9832003 14,085 11,487 2,598 884 5 878 13,202 11,482 1,720 − 36 7,028 1,4522004 17,059 12,024 5,035 941 5 936 16,118 12,019 4,099 3,240 6,546 1,4172005 20,071 14,283 5,788 637 6 632 19,434 14,277 5,156 4,053 7,551 1,709
of which: Canada
2002 1,181 376 805 19 0 19 1,161 375 786 74 741 482003 1,138 506 633 16 0 15 1,123 505 617 360 587 262004 903 359 545 14 0 13 890 358 531 258 457 342005 1,008 355 653 12 0 12 996 355 641 313 516 45
* Breakdown of item I.2 in the balance of payments tables on pp 6−33. — countries on pp 104−105. — 1 Earnings of employed persons. — 2 Excludingo For the classification of countries into groups of countries, see list of income from direct investment. — 3 From 1991 including retained
54

DEUTSCHEBUNDESBANK
Balance of paymentsby regionAugust 2006
I Balance of payments of the Federal Republic of Germany
non-residents Investment income paid to non-residents
for portfolio investment 2
Interest on bondsand notes 4
Income Interest Income Interestfrom on from of which onmutual Interest money mutual Public moneyfund on bonds market Interest for direct fund sector market Interestshares 3 instruments on loans 2 investment Total Dividends shares 5 Total bonds instruments on loans 2 and notes 4 Year
Poland
− 137 1 324 8 199 1 1 190 172 8 79 2002− 195 1 317 11 149 3 2 138 121 6 46 2003− 244 0 274 12 95 0 1 89 77 4 79 2004− 272 0 199 13 50 0 1 43 38 6 106 2005
Sweden
0 497 6 539 695 256 42 6 206 199 2 170 2002− 543 6 489 356 150 27 12 108 93 2 149 20030 443 1 542 709 162 62 6 87 22 7 190 20040 474 0 593 934 154 81 7 58 17 7 214 2005
United Kingdom
5 2,772 114 9,318 1,617 9,435 1,621 22 7,061 1,393 730 10,315 20027 2,868 75 9,629 − 642 9,621 2,010 29 6,955 1,327 626 9,025 2003
10 2,665 90 10,528 853 9,890 1,817 18 6,453 907 1,602 9,259 200418 3,010 101 12,542 804 10,605 2,472 18 6,781 766 1,335 9,728 2005
Other European countries
0 1,131 5 4,162 1,662 3,613 707 251 2,404 923 251 1,825 200215 1,198 8 3,886 2,515 3,555 783 268 2,249 662 255 1,804 200313 1,053 17 4,691 1,727 2,629 704 174 1,679 369 72 2,360 200417 1,064 24 5,791 2,151 2,628 809 189 1,569 320 62 4,205 2005
of which: Russian Federation
− 81 − 1,710 126 143 7 1 135 93 − 141 2002− 69 − 1,503 112 138 4 2 132 82 0 153 2003− 70 − 2,133 129 61 0 2 58 34 1 225 2004− 75 − 2,832 168 0 1 2 − 3 − 3 0 318 2005
Switzerland
0 126 0 1,519 1,479 2,987 660 237 1,959 602 131 1,126 20024 144 0 1,348 1,323 2,850 709 249 1,823 450 69 825 20035 124 1 1,365 1,376 2,241 651 158 1,400 247 32 821 20040 92 3 1,521 1,700 2,297 723 173 1,375 232 26 885 2005
Africa
− 112 0 577 13 126 10 20 90 19 5 224 2002− 110 − 607 34 120 18 23 59 17 19 172 20030 112 − 531 24 71 4 8 39 28 20 263 20040 138 − 607 27 85 5 8 52 42 20 394 2005
America
22 6,251 85 7,579 3,577 2,124 980 67 930 304 147 7,633 200222 5,489 66 6,210 3,136 2,025 907 81 941 279 96 6,321 200342 5,026 61 6,333 4,257 2,052 884 34 1,119 251 15 5,709 200462 5,691 90 7,830 5,457 2,838 1,196 35 1,591 250 17 5,982 2005
of which: Canada
− 687 7 346 89 125 50 5 71 15 0 162 20021 551 9 176 85 161 102 8 51 9 0 260 2003− 422 1 175 96 69 44 3 22 2 0 193 2004− 470 1 167 134 56 39 3 13 0 1 165 2005
profits of mutual funds; up to 1990 included in “Dividends”. — 4 Adjusted “Dividends”. for accrued interest. — 5 Where identifiable, up to 1993 included in
55
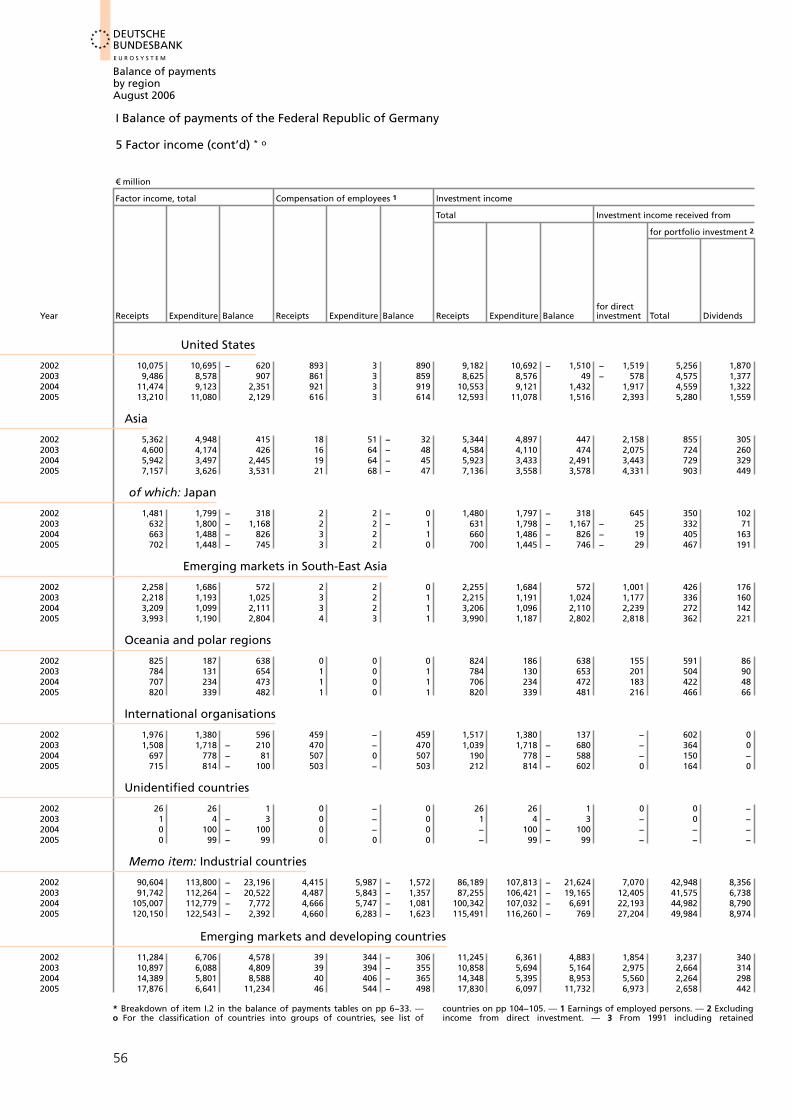
DEUTSCHEBUNDESBANKE U R O S Y S T E M
Balance of paymentsby regionAugust 2006
I Balance of payments of the Federal Republic of Germany
5 Factor income (cont’d) * o
€ million
Factor income, total Compensation of employees 1 Investment income
Total Investment income received from
for portfolio investment 2 for direct
Year Receipts Expenditure Balance Receipts Expenditure Balance Receipts Expenditure Balance investment Total Dividends
United States
2002 10,075 10,695 − 620 893 3 890 9,182 10,692 − 1,510 − 1,519 5,256 1,8702003 9,486 8,578 907 861 3 859 8,625 8,576 49 − 578 4,575 1,3772004 11,474 9,123 2,351 921 3 919 10,553 9,121 1,432 1,917 4,559 1,3222005 13,210 11,080 2,129 616 3 614 12,593 11,078 1,516 2,393 5,280 1,559
Asia
2002 5,362 4,948 415 18 51 − 32 5,344 4,897 447 2,158 855 3052003 4,600 4,174 426 16 64 − 48 4,584 4,110 474 2,075 724 2602004 5,942 3,497 2,445 19 64 − 45 5,923 3,433 2,491 3,443 729 3292005 7,157 3,626 3,531 21 68 − 47 7,136 3,558 3,578 4,331 903 449
of which: Japan
2002 1,481 1,799 − 318 2 2 − 0 1,480 1,797 − 318 645 350 1022003 632 1,800 − 1,168 2 2 − 1 631 1,798 − 1,167 − 25 332 712004 663 1,488 − 826 3 2 1 660 1,486 − 826 − 19 405 1632005 702 1,448 − 745 3 2 0 700 1,445 − 746 − 29 467 191
Emerging markets in South-East Asia
2002 2,258 1,686 572 2 2 0 2,255 1,684 572 1,001 426 1762003 2,218 1,193 1,025 3 2 1 2,215 1,191 1,024 1,177 336 1602004 3,209 1,099 2,111 3 2 1 3,206 1,096 2,110 2,239 272 1422005 3,993 1,190 2,804 4 3 1 3,990 1,187 2,802 2,818 362 221
Oceania and polar regions
2002 825 187 638 0 0 0 824 186 638 155 591 862003 784 131 654 1 0 1 784 130 653 201 504 902004 707 234 473 1 0 1 706 234 472 183 422 482005 820 339 482 1 0 1 820 339 481 216 466 66
International organisations
2002 1,976 1,380 596 459 − 459 1,517 1,380 137 − 602 02003 1,508 1,718 − 210 470 − 470 1,039 1,718 − 680 − 364 02004 697 778 − 81 507 0 507 190 778 − 588 − 150 −2005 715 814 − 100 503 − 503 212 814 − 602 0 164 0
Unidentified countries
2002 26 26 1 0 − 0 26 26 1 0 0 −2003 1 4 − 3 0 − 0 1 4 − 3 − 0 −2004 0 100 − 100 0 − 0 − 100 − 100 − − −2005 0 99 − 99 0 0 0 − 99 − 99 − − −
Memo item: Industrial countries
2002 90,604 113,800 − 23,196 4,415 5,987 − 1,572 86,189 107,813 − 21,624 7,070 42,948 8,3562003 91,742 112,264 − 20,522 4,487 5,843 − 1,357 87,255 106,421 − 19,165 12,405 41,575 6,7382004 105,007 112,779 − 7,772 4,666 5,747 − 1,081 100,342 107,032 − 6,691 22,193 44,982 8,7902005 120,150 122,543 − 2,392 4,660 6,283 − 1,623 115,491 116,260 − 769 27,204 49,984 8,974
Emerging markets and developing countries
2002 11,284 6,706 4,578 39 344 − 306 11,245 6,361 4,883 1,854 3,237 3402003 10,897 6,088 4,809 39 394 − 355 10,858 5,694 5,164 2,975 2,664 3142004 14,389 5,801 8,588 40 406 − 365 14,348 5,395 8,953 5,560 2,264 2982005 17,876 6,641 11,234 46 544 − 498 17,830 6,097 11,732 6,973 2,658 442
* Breakdown of item I.2 in the balance of payments tables on pp 6−33. — countries on pp 104−105. — 1 Earnings of employed persons. — 2 Excludingo For the classification of countries into groups of countries, see list of income from direct investment. — 3 From 1991 including retained
56
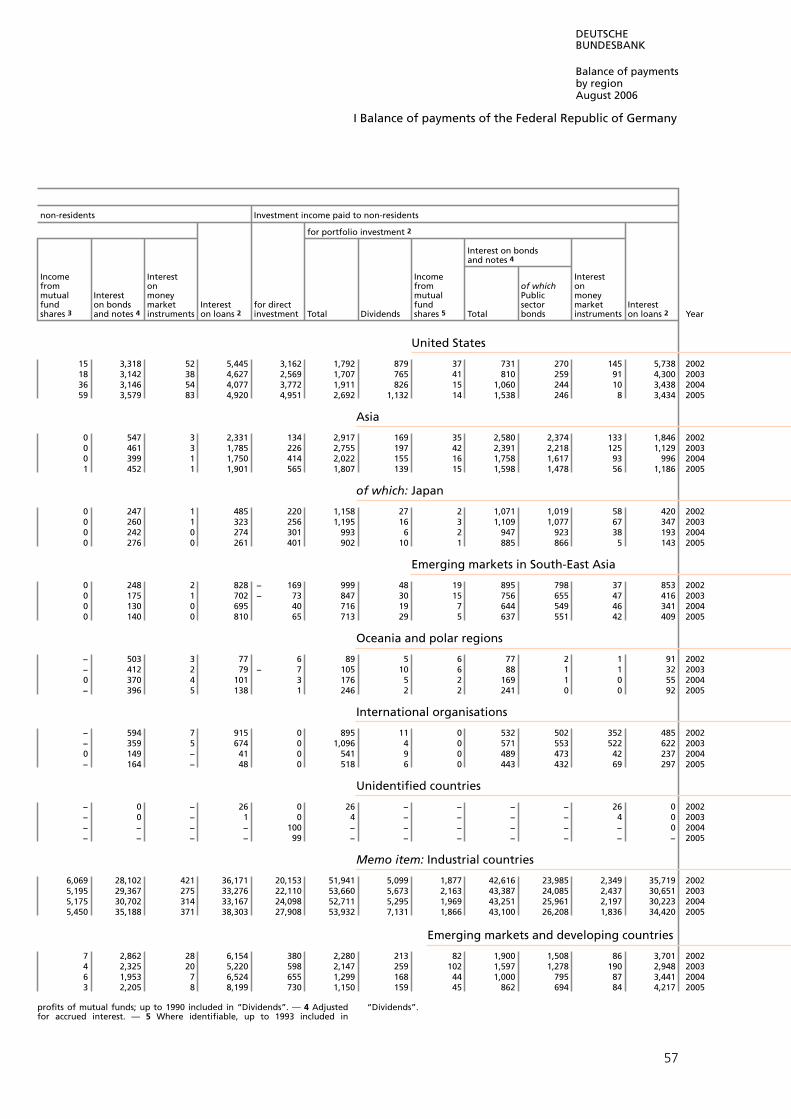
DEUTSCHEBUNDESBANK
Balance of paymentsby regionAugust 2006
I Balance of payments of the Federal Republic of Germany
non-residents Investment income paid to non-residents
for portfolio investment 2
Interest on bondsand notes 4
Income Interest Income Interestfrom on from of which onmutual Interest money mutual Public moneyfund on bonds market Interest for direct fund sector market Interestshares 3 instruments on loans 2 investment Total Dividends shares 5 Total bonds instruments on loans 2 and notes 4 Year
United States
15 3,318 52 5,445 3,162 1,792 879 37 731 270 145 5,738 200218 3,142 38 4,627 2,569 1,707 765 41 810 259 91 4,300 200336 3,146 54 4,077 3,772 1,911 826 15 1,060 244 10 3,438 200459 3,579 83 4,920 4,951 2,692 1,132 14 1,538 246 8 3,434 2005
Asia
0 547 3 2,331 134 2,917 169 35 2,580 2,374 133 1,846 20020 461 3 1,785 226 2,755 197 42 2,391 2,218 125 1,129 20030 399 1 1,750 414 2,022 155 16 1,758 1,617 93 996 20041 452 1 1,901 565 1,807 139 15 1,598 1,478 56 1,186 2005
of which: Japan
0 247 1 485 220 1,158 27 2 1,071 1,019 58 420 20020 260 1 323 256 1,195 16 3 1,109 1,077 67 347 20030 242 0 274 301 993 6 2 947 923 38 193 20040 276 0 261 401 902 10 1 885 866 5 143 2005
Emerging markets in South-East Asia
0 248 2 828 − 169 999 48 19 895 798 37 853 20020 175 1 702 − 73 847 30 15 756 655 47 416 20030 130 0 695 40 716 19 7 644 549 46 341 20040 140 0 810 65 713 29 5 637 551 42 409 2005
Oceania and polar regions
− 503 3 77 6 89 5 6 77 2 1 91 2002− 412 2 79 − 7 105 10 6 88 1 1 32 20030 370 4 101 3 176 5 2 169 1 0 55 2004− 396 5 138 1 246 2 2 241 0 0 92 2005
International organisations
− 594 7 915 0 895 11 0 532 502 352 485 2002− 359 5 674 0 1,096 4 0 571 553 522 622 20030 149 − 41 0 541 9 0 489 473 42 237 2004− 164 − 48 0 518 6 0 443 432 69 297 2005
Unidentified countries
− 0 − 26 0 26 − − − − 26 0 2002− 0 − 1 0 4 − − − − 4 0 2003− − − − 100 − − − − − − 0 2004− − − − 99 − − − − − − − 2005
Memo item: Industrial countries
6,069 28,102 421 36,171 20,153 51,941 5,099 1,877 42,616 23,985 2,349 35,719 20025,195 29,367 275 33,276 22,110 53,660 5,673 2,163 43,387 24,085 2,437 30,651 20035,175 30,702 314 33,167 24,098 52,711 5,295 1,969 43,251 25,961 2,197 30,223 20045,450 35,188 371 38,303 27,908 53,932 7,131 1,866 43,100 26,208 1,836 34,420 2005
Emerging markets and developing countries
7 2,862 28 6,154 380 2,280 213 82 1,900 1,508 86 3,701 20024 2,325 20 5,220 598 2,147 259 102 1,597 1,278 190 2,948 20036 1,953 7 6,524 655 1,299 168 44 1,000 795 87 3,441 20043 2,205 8 8,199 730 1,150 159 45 862 694 84 4,217 2005
profits of mutual funds; up to 1990 included in “Dividends”. — 4 Adjusted “Dividends”. for accrued interest. — 5 Where identifiable, up to 1993 included in
57

DEUTSCHEBUNDESBANKE U R O S Y S T E M
Balance of paymentsby regionAugust 2006
I Balance of payments of the Federal Republic of Germany
6 Current transfers * o
Up to end-1998 DM million; from 1999 € million
Current transfers, total Public transfers 1
Transfers from non-residents Transfers to non-residents
of which of which
Contri-butionsto other Pensions
Transfers Transfers Current Current inter- Transfers andfrom to transfers transfers national to de- main-
Year non- non- from the Tax to the organisa- veloping tenance Taxresidents residents Balance Balance Total EU 2,3 revenue Total EU tions payments refundscountries 3
All countries
1994 22,295 81,746 − 59,451 − 44,585 17,506 11,027 4,207 62,090 42,725 3,207 930 7,323 1,133
1995 23,715 79,128 − 55,413 − 40,243 18,826 11,816 4,327 59,070 41,778 3,227 949 7,574 1,1781996 26,197 77,188 − 50,991 − 35,284 21,743 13,216 5,656 57,027 40,769 3,123 948 7,660 1,7271997 27,631 80,127 − 52,496 − 36,569 22,225 14,721 4,326 58,794 43,223 3,010 987 7,783 1,5971998 28,505 81,566 − 53,061 − 37,073 22,622 13,557 5,837 59,696 43,939 2,707 995 8,197 1,7951999 16,100 40,885 − 24,785 − 17,143 12,494 7,360 3,401 29,637 21,205 1,583 535 4,246 938
2000 16,444 44,394 − 27,950 − 18,691 12,828 7,300 3,597 31,519 22,697 1,703 476 4,457 1,1562001 17,063 43,920 − 26,856 − 16,367 13,310 7,851 3,365 29,677 20,438 1,670 583 4,369 1,1542002 17,111 44,623 − 27,511 − 15,710 13,448 8,087 3,203 29,158 19,301 1,832 564 4,479 1,2942003 16,877 45,158 − 28,282 − 18,277 13,149 7,885 3,130 31,426 21,616 1,697 447 4,657 1,6202004 15,974 44,282 − 28,309 − 17,128 13,202 7,940 3,133 30,331 20,670 1,577 484 4,780 1,270
2005 17,507 46,428 − 28,921 − 17,907 14,058 8,065 3,653 31,965 22,790 1,529 542 4,846 1,191
Europe
2002 14,825 34,893 − 20,069 − 11,784 12,641 8,087 2,397 24,425 19,301 − 43 3,355 8932003 14,717 36,535 − 21,818 − 14,568 12,479 7,885 2,460 27,046 21,616 − 7 3,534 1,1222004 14,643 35,872 − 21,229 − 13,741 12,545 7,940 2,475 26,286 20,670 − 39 3,658 1,0242005 15,621 37,267 − 21,646 − 14,547 13,318 8,065 2,913 27,864 22,790 − 35 3,738 817
EU member states (25)
2002 13,776 29,673 − 15,897 − 11,116 11,874 8,087 1,740 22,990 19,301 − 2 2,552 6532003 13,758 31,554 − 17,796 − 13,689 11,803 7,885 1,904 25,491 21,616 − 2 2,688 8432004 13,742 31,167 − 17,425 − 12,782 11,919 7,940 1,977 24,701 20,670 − 1 2,769 7492005 14,709 32,721 − 18,012 − 13,892 12,653 8,065 2,422 26,545 22,790 − 1 2,805 680
Euro-area member states
2002 3,262 7,338 − 4,077 − 922 2,020 − 943 2,942 − − 0 2,317 4022003 3,363 7,297 − 3,934 − 1,121 2,009 − 973 3,130 − − 0 2,448 5082004 3,306 7,707 − 4,400 − 1,184 1,982 − 1,004 3,166 − − 0 2,526 4172005 3,445 7,534 − 4,089 − 1,087 2,103 − 1,156 3,190 − − 0 2,562 448
of which: Belgium
2002 209 443 − 234 − 48 160 − 125 208 − − 0 86 602003 234 367 − 134 53 184 − 149 130 − − 0 89 122004 245 419 − 174 20 198 − 164 178 − − 0 89 382005 339 447 − 108 83 250 − 217 166 − − 0 90 44
Finland
2002 63 76 − 13 − 5 2 − 2 7 − − − 3 12003 39 57 − 18 − 5 2 − 2 7 − − − 4 12004 68 70 − 2 − 7 3 − 3 11 − − − 4 32005 33 70 − 37 − 7 4 − 4 12 − − 0 4 2
France
2002 1,260 1,040 220 587 911 − 178 323 − − − 170 772003 1,306 1,118 188 472 928 − 226 455 − − 0 180 2052004 1,316 1,146 171 581 922 − 257 341 − − 0 190 752005 1,234 1,161 74 614 948 − 299 334 − − 0 188 82
Greece
2002 10 627 − 617 − 317 4 − 4 321 − − − 313 32003 12 656 − 644 − 332 4 − 4 336 − − − 332 12004 7 649 − 642 − 338 2 − 2 340 − − − 334 12005 8 643 − 635 − 352 2 − 2 354 − − 0 351 1
* Breakdown of items I.3 and II in the balance of payments tables on list of countries on pp 104−105. — 1 The classification of public and privatepp 6−33. — o For the classification of countries into groups of countries, see transfers depends on the sector to which the domestic agency
58

DEUTSCHEBUNDESBANK
Balance of paymentsby regionAugust 2006
I Balance of payments of the Federal Republic of Germany
7 Capital transfers * o
Private transfers 1 Capital transfers, total Public transfers 1 Private transfers 1
Transfers from Transfers to Transfers to Transfers tonon-residents 3 non-residents 3 non-residents non-residents
of which
of whichPension Pensionand andmain- Transfers main- Transfers Transfers Transferstenance by tenance from to of which from of whichpay- foreign pay- non- non- Debt non- Debt Year
Balance Total ments Total workers ments residents residents Balance Total remission residents Total remission
All countries
−14,866 4,789 693 19,656 7,500 3,776 2,533 5,170 − 2,637 2,323 297 2,533 2,847 965 1994
−15,169 4,889 732 20,058 7,600 3,803 2,413 6,257 − 3,845 4,394 2,305 2,413 1,863 15 1995−15,707 4,454 767 20,162 7,401 3,862 4,138 7,420 − 3,283 2,617 483 4,138 4,803 534 1996−15,927 5,406 745 21,333 7,519 3,998 4,928 4,877 52 2,821 528 4,928 2,056 14 1997−15,987 5,883 744 21,870 6,936 4,187 5,829 4,540 1,289 2,441 142 5,829 2,099 16 1998− 7,642 3,607 438 11,249 3,429 2,047 2,831 2,985 − 154 1,351 102 2,831 1,634 − 1999
− 9,260 3,616 460 12,876 3,458 1,988 1,907 3,506 − 1,599 1,189 71 1,907 2,317 1,168 2000−10,489 3,753 381 14,242 3,520 1,883 2,065 2,452 − 387 1,361 2 2,065 1,091 37 2001−11,801 3,664 396 15,465 3,470 1,644 2,223 2,434 − 212 1,416 199 2,223 1,018 7 2002−10,005 3,728 419 13,733 3,332 1,782 2,861 2,548 312 1,238 282 2,861 1,311 445 2003−11,180 2,771 457 13,952 3,180 1,298 2,668 2,237 430 1,094 50 2,668 1,143 232 2004
−11,014 3,449 480 14,462 2,926 1,415 3,468 4,736 − 1,268 3,419 2,232 3,468 1,317 330 2005
Europe
− 8,284 2,184 369 10,468 2,933 1,129 2,201 495 1,706 276 183 2,201 220 1 2002− 7,251 2,238 392 9,489 2,796 1,233 2,842 154 2,688 1 − 2,842 153 − 2003− 7,488 2,099 433 9,586 2,617 719 2,645 279 2,366 76 − 2,645 203 − 2004− 7,100 2,303 456 9,403 2,392 644 3,443 325 3,119 77 − 3,443 248 − 2005
EU member states (25)
− 4,781 1,902 352 6,683 1,335 347 2,194 114 2,080 1 − 2,194 113 − 2002− 4,107 1,956 370 6,063 1,384 473 2,838 109 2,728 0 − 2,838 109 − 2003− 4,644 1,823 403 6,466 1,142 464 2,627 116 2,512 0 − 2,627 115 − 2004− 4,120 2,056 416 6,176 930 403 3,431 145 3,287 3 − 3,431 142 − 2005
Euro-area member states
− 3,155 1,242 292 4,396 1,125 212 7 71 − 65 0 − 7 71 − 2002− 2,813 1,354 300 4,167 1,158 247 8 74 − 65 0 − 8 74 − 2003− 3,216 1,324 327 4,541 924 277 11 73 − 62 0 − 11 73 − 2004− 3,002 1,343 334 4,344 721 245 11 89 − 78 1 − 11 88 − 2005
of which: Belgium
− 187 49 2 236 9 14 0 2 − 2 0 − 0 2 − 2002− 187 50 2 237 9 17 0 2 − 2 0 − 0 2 − 2003− 193 47 7 241 9 22 0 3 − 3 0 − 0 3 − 2004− 191 89 3 280 8 20 0 6 − 5 0 − 0 5 − 2005
Finland
− 8 61 1 69 6 2 − 1 − 1 − − − 1 − 2002− 13 37 0 50 5 2 0 1 − 1 − − 0 1 − 2003
5 65 1 60 5 1 1 1 − 0 − − 1 1 − 2004− 29 28 0 58 5 2 0 1 − 0 0 − 0 1 − 2005
France
− 367 349 2 717 54 37 2 16 − 14 − − 2 16 − 2002− 284 378 3 663 38 49 2 20 − 18 0 − 2 20 − 2003− 411 394 3 805 20 91 2 15 − 13 0 − 2 15 − 2004− 540 286 4 826 15 57 3 21 − 18 0 − 3 21 − 2005
Greece
− 300 6 0 306 220 5 0 2 − 2 − − 0 2 − 2002− 311 9 0 320 220 10 0 5 − 4 − − 0 5 − 2003− 304 6 0 310 190 18 0 2 − 2 − − 0 2 − 2004− 283 6 1 289 162 17 0 3 − 3 0 − 0 3 − 2005
participating in the transaction belongs. — 2 Excluding refunds of collection transfers, where identifiable. expenses recorded under receipts from services. — 3 Excluding capital
59
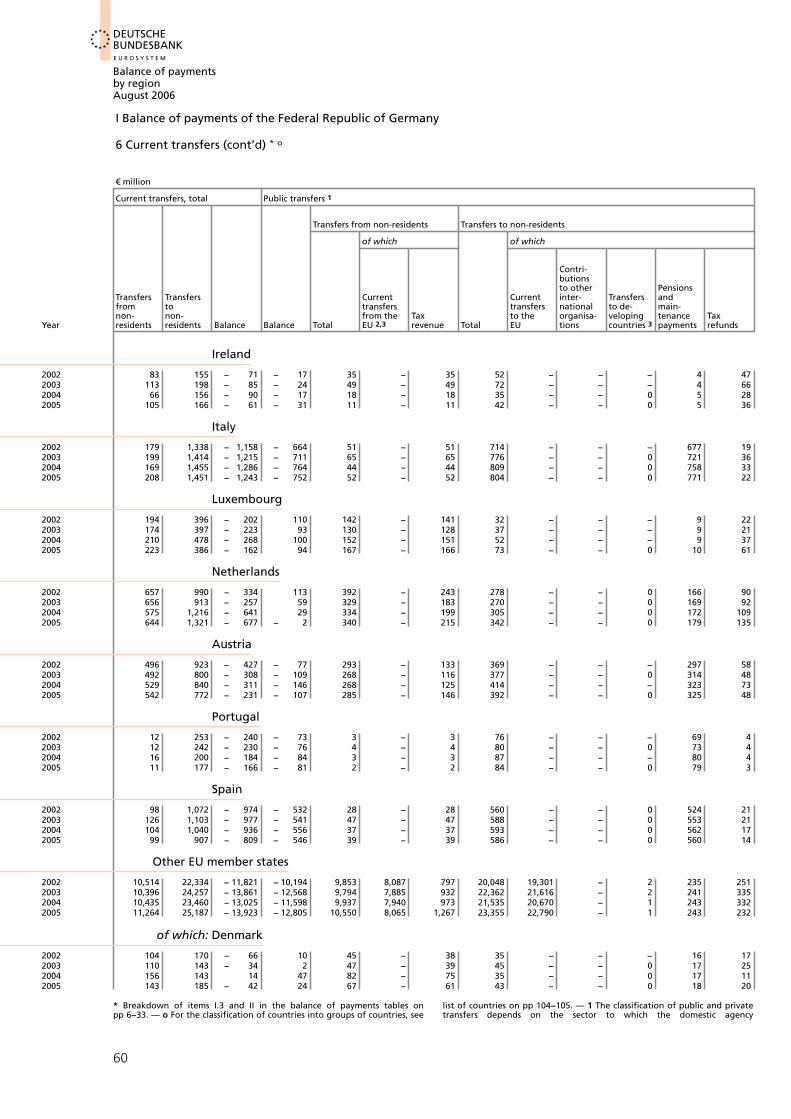
DEUTSCHEBUNDESBANKE U R O S Y S T E M
Balance of paymentsby regionAugust 2006
I Balance of payments of the Federal Republic of Germany
6 Current transfers (cont’d) * o
€ million
Current transfers, total Public transfers 1
Transfers from non-residents Transfers to non-residents
of which of which
Contri-butionsto other Pensions
Transfers Transfers Current Current inter- Transfers andfrom to transfers transfers national to de- main-non- non- from the Tax to the organisa- veloping tenance Tax
Year residents residents Balance Balance Total EU 2,3 revenue Total EU tions payments refundscountries 3
Ireland
2002 83 155 − 71 − 17 35 − 35 52 − − − 4 472003 113 198 − 85 − 24 49 − 49 72 − − − 4 662004 66 156 − 90 − 17 18 − 18 35 − − 0 5 282005 105 166 − 61 − 31 11 − 11 42 − − 0 5 36
Italy
2002 179 1,338 − 1,158 − 664 51 − 51 714 − − − 677 192003 199 1,414 − 1,215 − 711 65 − 65 776 − − 0 721 362004 169 1,455 − 1,286 − 764 44 − 44 809 − − 0 758 332005 208 1,451 − 1,243 − 752 52 − 52 804 − − 0 771 22
Luxembourg
2002 194 396 − 202 110 142 − 141 32 − − − 9 222003 174 397 − 223 93 130 − 128 37 − − − 9 212004 210 478 − 268 100 152 − 151 52 − − − 9 372005 223 386 − 162 94 167 − 166 73 − − 0 10 61
Netherlands
2002 657 990 − 334 113 392 − 243 278 − − 0 166 902003 656 913 − 257 59 329 − 183 270 − − 0 169 922004 575 1,216 − 641 29 334 − 199 305 − − 0 172 1092005 644 1,321 − 677 − 2 340 − 215 342 − − 0 179 135
Austria
2002 496 923 − 427 − 77 293 − 133 369 − − − 297 582003 492 800 − 308 − 109 268 − 116 377 − − 0 314 482004 529 840 − 311 − 146 268 − 125 414 − − − 323 732005 542 772 − 231 − 107 285 − 146 392 − − 0 325 48
Portugal
2002 12 253 − 240 − 73 3 − 3 76 − − − 69 42003 12 242 − 230 − 76 4 − 4 80 − − 0 73 42004 16 200 − 184 − 84 3 − 3 87 − − − 80 42005 11 177 − 166 − 81 2 − 2 84 − − 0 79 3
Spain
2002 98 1,072 − 974 − 532 28 − 28 560 − − 0 524 212003 126 1,103 − 977 − 541 47 − 47 588 − − 0 553 212004 104 1,040 − 936 − 556 37 − 37 593 − − 0 562 172005 99 907 − 809 − 546 39 − 39 586 − − 0 560 14
Other EU member states
2002 10,514 22,334 − 11,821 − 10,194 9,853 8,087 797 20,048 19,301 − 2 235 2512003 10,396 24,257 − 13,861 − 12,568 9,794 7,885 932 22,362 21,616 − 2 241 3352004 10,435 23,460 − 13,025 − 11,598 9,937 7,940 973 21,535 20,670 − 1 243 3322005 11,264 25,187 − 13,923 − 12,805 10,550 8,065 1,267 23,355 22,790 − 1 243 232
of which: Denmark
2002 104 170 − 66 10 45 − 38 35 − − − 16 172003 110 143 − 34 2 47 − 39 45 − − 0 17 252004 156 143 14 47 82 − 75 35 − − 0 17 112005 143 185 − 42 24 67 − 61 43 − − 0 18 20
* Breakdown of items I.3 and II in the balance of payments tables on list of countries on pp 104−105. — 1 The classification of public and privatepp 6−33. — o For the classification of countries into groups of countries, see transfers depends on the sector to which the domestic agency
60

DEUTSCHEBUNDESBANK
Balance of paymentsby regionAugust 2006
I Balance of payments of the Federal Republic of Germany
7 Capital transfers (cont’d) * o
Private transfers 1 Capital transfers, total Public transfers 1 Private transfers 1
Transfers from Transfers to Transfers to Transfers tonon-residents 3 non-residents 3 non-residents non-residents
of which
of whichPensions Pensionsand andmain- Transfers main- Transfers Transfers Transferstenance by tenance from to of which from of whichpay- foreign pay- non- non- Debt non- Debt
Balance Total ments Total workers ments residents residents Balance Total remission residents Total remission Year
Ireland
− 54 48 0 103 5 4 0 7 − 7 − − 0 7 − 2002− 61 64 1 125 5 3 1 1 1 − − 1 1 − 2003− 73 48 0 121 5 2 0 1 − 0 0 − 0 1 − 2004− 29 94 1 123 4 3 0 0 − 0 0 − 0 0 − 2005
Italy
− 494 129 64 623 240 39 0 8 − 8 − − 0 8 − 2002− 504 134 65 638 300 39 1 11 − 10 0 − 1 11 − 2003− 522 124 64 646 297 34 1 7 − 7 − − 1 7 − 2004− 491 156 65 647 282 31 1 11 − 10 0 − 1 11 − 2005
Luxembourg
− 312 51 1 363 2 3 1 2 − 1 − − 1 2 − 2002− 316 45 1 361 2 5 0 1 − 1 − − 0 1 − 2003− 368 58 2 426 1 4 1 1 − 0 − − 1 1 − 2004− 256 56 0 312 1 3 2 3 − 2 0 − 2 3 − 2005
Netherlands
− 447 265 82 712 30 19 2 6 − 4 0 − 2 6 − 2002− 316 327 89 643 29 22 1 7 − 6 0 − 1 7 − 2003− 670 241 106 910 28 19 2 14 − 12 0 − 2 14 − 2004− 675 304 109 979 27 35 1 8 − 7 0 − 1 8 − 2005
Austria
− 350 203 139 553 140 56 1 20 − 18 − − 1 20 − 2002− 199 224 139 423 130 57 2 19 − 17 0 − 2 19 − 2003− 165 262 144 426 80 51 2 20 − 18 − − 2 20 − 2004− 124 256 149 380 72 42 3 27 − 24 0 − 3 27 − 2005
Portugal
− 167 9 0 176 120 7 0 1 − 1 − − 0 1 − 2002− 153 8 0 161 120 7 0 1 − 0 0 − 0 1 − 2003− 100 13 0 113 88 8 0 1 − 1 − − 0 1 − 2004− 84 9 0 93 64 5 0 1 − 1 0 − 0 1 − 2005
Spain
− 442 70 1 512 300 29 0 6 − 6 0 − 0 6 − 2002− 436 80 1 516 300 35 0 7 − 6 0 − 0 7 − 2003− 379 67 1 446 200 27 1 7 − 7 0 − 1 7 − 2004− 262 59 1 321 79 31 1 8 − 7 0 − 1 8 − 2005
Other EU member states
− 1,627 660 60 2,287 210 135 2,187 43 2,145 1 − 2,187 42 − 2002− 1,294 602 70 1,896 226 225 2,829 36 2,794 0 − 2,829 35 − 2003− 1,427 498 77 1,926 219 188 2,617 43 2,573 0 − 2,617 43 − 2004− 1,118 714 82 1,832 210 158 3,420 56 3,364 2 − 3,420 54 − 2005
of which: Denmark
− 76 59 46 135 10 4 0 3 − 3 − − 0 3 − 2002− 36 63 50 99 10 15 0 3 − 2 0 − 0 3 − 2003− 33 74 57 107 9 12 0 2 − 2 0 − 0 2 − 2004− 66 76 55 142 8 12 0 15 − 15 0 − 0 15 − 2005
participating in the transaction belongs. — 2 Excluding refunds of collection transfers, where identifiable. expenses recorded under receipts from services. — 3 Excluding capital
61

DEUTSCHEBUNDESBANKE U R O S Y S T E M
Balance of paymentsby regionAugust 2006
I Balance of payments of the Federal Republic of Germany
6 Current transfers (cont’d) * o
€ million
Current transfers, total Public transfers 1
Transfers from non-residents Transfers to non-residents
of which of which
Contri-butionsto other Pensions
Transfers Transfers Current Current inter- Transfers andfrom to transfers transfers national to de- main-non- non- from the Tax to the organisa- veloping tenance Tax
Year residents residents Balance Balance Total EU 2,3 revenue Total EU tions payments refundscountries 3
Poland
2002 884 525 360 661 866 − 102 205 − − 0 32 262003 924 372 553 765 905 − 110 140 − − 0 31 542004 1,019 552 467 718 986 − 113 267 − − 0 33 502005 1,244 329 915 1,125 1,222 − 140 97 − − 0 32 50
Sweden
2002 43 171 − 128 − 49 20 − 20 69 − − − 29 292003 45 133 − 88 − 33 15 − 15 49 − − 0 32 62004 56 159 − 104 − 35 23 − 23 58 − − − 30 82005 64 179 − 115 − 32 31 − 31 62 − − 0 30 13
United Kingdom
2002 999 1,252 − 253 299 570 − 570 270 − − 0 78 1592003 1,034 1,410 − 376 373 706 − 706 333 − − 0 78 2282004 960 1,433 − 473 371 715 − 715 344 − − 0 77 2402005 1,395 1,330 65 759 990 − 990 230 − − 1 76 128
Other European countries
2002 1,049 5,220 − 4,172 − 668 767 − 657 1,435 − − 41 803 2412003 959 4,981 − 4,023 − 879 676 − 556 1,555 − − 5 846 2802004 901 4,705 − 3,803 − 959 626 − 499 1,585 − − 39 889 2752005 912 4,546 − 3,634 − 655 665 − 491 1,319 − − 34 933 138
of which: Russian Federation
2002 20 275 − 255 − 67 2 − 2 69 − − 0 1 12003 17 246 − 229 − 53 2 − 2 54 − − 0 1 02004 20 378 − 358 − 106 1 − 1 106 − − 0 0 02005 14 337 − 323 − 74 1 − 1 75 − − 1 1 0
Switzerland
2002 846 1,315 − 469 228 624 − 597 396 − − 0 130 2262003 689 1,322 − 633 81 517 − 485 435 − − 0 135 2582004 686 1,313 − 627 66 489 − 458 423 − − 0 142 2462005 631 1,348 − 717 183 470 − 438 286 − − 0 144 110
Africa
2002 182 574 − 392 − 239 20 − 20 259 − − 188 53 162003 332 629 − 297 − 218 20 − 20 237 − − 176 54 52004 125 554 − 429 − 231 12 − 12 242 − − 177 57 42005 27 653 − 626 − 259 11 − 11 269 − − 194 58 4
America
2002 1,765 4,719 − 2,954 − 932 698 − 698 1,630 − − 97 707 2982003 1,363 3,481 − 2,119 − 921 552 − 552 1,473 − − 88 702 4122004 906 3,259 − 2,354 − 727 561 − 561 1,289 − − 77 688 1912005 971 3,599 − 2,629 − 756 650 − 650 1,407 − − 93 672 327
of which: Canada
2002 43 353 − 310 − 233 23 − 23 256 − − 0 200 182003 54 353 − 299 − 212 39 − 39 251 − − − 200 222004 116 386 − 270 − 183 64 − 64 247 − − 0 198 82005 38 315 − 276 − 212 25 − 25 237 − − 0 193 10
* Breakdown of items I.3 and II in the balance of payments tables on list of countries on pp 104−105. — 1 The classification of public and privatepp 6−33. — o For the classification of countries into groups of countries, see transfers depends on the sector to which the domestic agency
62
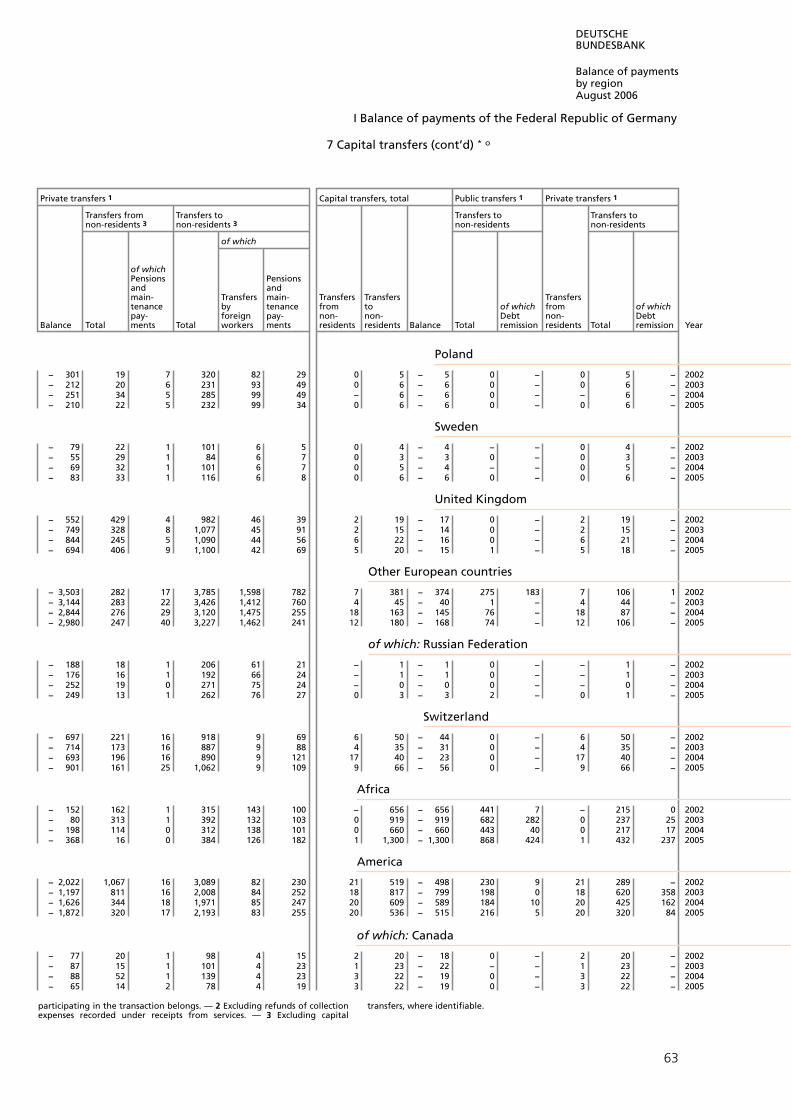
DEUTSCHEBUNDESBANK
Balance of paymentsby regionAugust 2006
I Balance of payments of the Federal Republic of Germany
7 Capital transfers (cont’d) * o
Private transfers 1 Capital transfers, total Public transfers 1 Private transfers 1
Transfers from Transfers to Transfers to Transfers tonon-residents 3 non-residents 3 non-residents non-residents
of which
of whichPensions Pensionsand andmain- Transfers main- Transfers Transfers Transferstenance by tenance from to of which from of whichpay- foreign pay- non- non- Debt non- Debt
Balance Total ments Total workers ments residents residents Balance Total remission residents Total remission Year
Poland
− 301 19 7 320 82 29 0 5 − 5 0 − 0 5 − 2002− 212 20 6 231 93 49 0 6 − 6 0 − 0 6 − 2003− 251 34 5 285 99 49 − 6 − 6 0 − − 6 − 2004− 210 22 5 232 99 34 0 6 − 6 0 − 0 6 − 2005
Sweden
− 79 22 1 101 6 5 0 4 − 4 − − 0 4 − 2002− 55 29 1 84 6 7 0 3 − 3 0 − 0 3 − 2003− 69 32 1 101 6 7 0 5 − 4 − − 0 5 − 2004− 83 33 1 116 6 8 0 6 − 6 0 − 0 6 − 2005
United Kingdom
− 552 429 4 982 46 39 2 19 − 17 0 − 2 19 − 2002− 749 328 8 1,077 45 91 2 15 − 14 0 − 2 15 − 2003− 844 245 5 1,090 44 56 6 22 − 16 0 − 6 21 − 2004− 694 406 9 1,100 42 69 5 20 − 15 1 − 5 18 − 2005
Other European countries
− 3,503 282 17 3,785 1,598 782 7 381 − 374 275 183 7 106 1 2002− 3,144 283 22 3,426 1,412 760 4 45 − 40 1 − 4 44 − 2003− 2,844 276 29 3,120 1,475 255 18 163 − 145 76 − 18 87 − 2004− 2,980 247 40 3,227 1,462 241 12 180 − 168 74 − 12 106 − 2005
of which: Russian Federation
− 188 18 1 206 61 21 − 1 − 1 0 − − 1 − 2002− 176 16 1 192 66 24 − 1 − 1 0 − − 1 − 2003− 252 19 0 271 75 24 − 0 − 0 0 − − 0 − 2004− 249 13 1 262 76 27 0 3 − 3 2 − 0 1 − 2005
Switzerland
− 697 221 16 918 9 69 6 50 − 44 0 − 6 50 − 2002− 714 173 16 887 9 88 4 35 − 31 0 − 4 35 − 2003− 693 196 16 890 9 121 17 40 − 23 0 − 17 40 − 2004− 901 161 25 1,062 9 109 9 66 − 56 0 − 9 66 − 2005
Africa
− 152 162 1 315 143 100 − 656 − 656 441 7 − 215 0 2002− 80 313 1 392 132 103 0 919 − 919 682 282 0 237 25 2003− 198 114 0 312 138 101 0 660 − 660 443 40 0 217 17 2004− 368 16 0 384 126 182 1 1,300 − 1,300 868 424 1 432 237 2005
America
− 2,022 1,067 16 3,089 82 230 21 519 − 498 230 9 21 289 − 2002− 1,197 811 16 2,008 84 252 18 817 − 799 198 0 18 620 358 2003− 1,626 344 18 1,971 85 247 20 609 − 589 184 10 20 425 162 2004− 1,872 320 17 2,193 83 255 20 536 − 515 216 5 20 320 84 2005
of which: Canada
− 77 20 1 98 4 15 2 20 − 18 0 − 2 20 − 2002− 87 15 1 101 4 23 1 23 − 22 − − 1 23 − 2003− 88 52 1 139 4 23 3 22 − 19 0 − 3 22 − 2004− 65 14 2 78 4 19 3 22 − 19 0 − 3 22 − 2005
participating in the transaction belongs. — 2 Excluding refunds of collection transfers, where identifiable. expenses recorded under receipts from services. — 3 Excluding capital
63
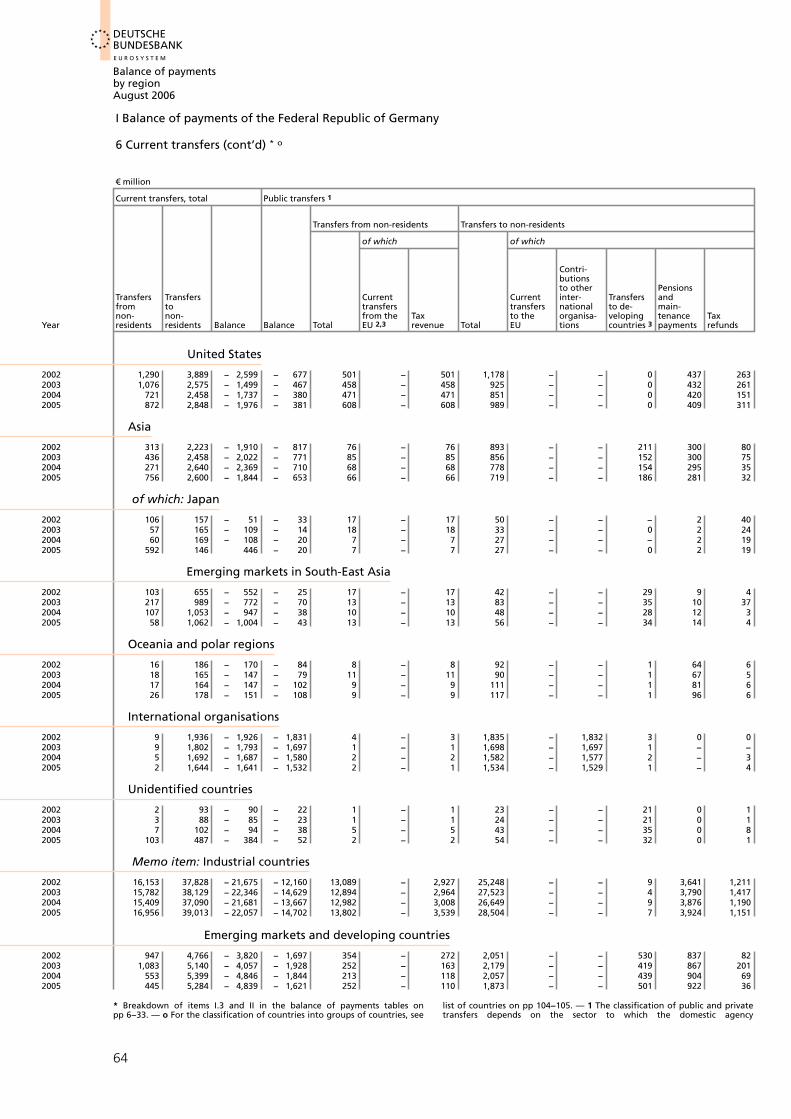
DEUTSCHEBUNDESBANKE U R O S Y S T E M
Balance of paymentsby regionAugust 2006
I Balance of payments of the Federal Republic of Germany
6 Current transfers (cont’d) * o
€ million
Current transfers, total Public transfers 1
Transfers from non-residents Transfers to non-residents
of which of which
Contri-butionsto other Pensions
Transfers Transfers Current Current inter- Transfers andfrom to transfers transfers national to de- main-non- non- from the Tax to the organisa- veloping tenance Tax
Year residents residents Balance Balance Total EU 2,3 revenue Total EU tions payments refundscountries 3
United States
2002 1,290 3,889 − 2,599 − 677 501 − 501 1,178 − − 0 437 2632003 1,076 2,575 − 1,499 − 467 458 − 458 925 − − 0 432 2612004 721 2,458 − 1,737 − 380 471 − 471 851 − − 0 420 1512005 872 2,848 − 1,976 − 381 608 − 608 989 − − 0 409 311
Asia
2002 313 2,223 − 1,910 − 817 76 − 76 893 − − 211 300 802003 436 2,458 − 2,022 − 771 85 − 85 856 − − 152 300 752004 271 2,640 − 2,369 − 710 68 − 68 778 − − 154 295 352005 756 2,600 − 1,844 − 653 66 − 66 719 − − 186 281 32
of which: Japan
2002 106 157 − 51 − 33 17 − 17 50 − − − 2 402003 57 165 − 109 − 14 18 − 18 33 − − 0 2 242004 60 169 − 108 − 20 7 − 7 27 − − − 2 192005 592 146 446 − 20 7 − 7 27 − − 0 2 19
Emerging markets in South-East Asia
2002 103 655 − 552 − 25 17 − 17 42 − − 29 9 42003 217 989 − 772 − 70 13 − 13 83 − − 35 10 372004 107 1,053 − 947 − 38 10 − 10 48 − − 28 12 32005 58 1,062 − 1,004 − 43 13 − 13 56 − − 34 14 4
Oceania and polar regions
2002 16 186 − 170 − 84 8 − 8 92 − − 1 64 62003 18 165 − 147 − 79 11 − 11 90 − − 1 67 52004 17 164 − 147 − 102 9 − 9 111 − − 1 81 62005 26 178 − 151 − 108 9 − 9 117 − − 1 96 6
International organisations
2002 9 1,936 − 1,926 − 1,831 4 − 3 1,835 − 1,832 3 0 02003 9 1,802 − 1,793 − 1,697 1 − 1 1,698 − 1,697 1 − −2004 5 1,692 − 1,687 − 1,580 2 − 2 1,582 − 1,577 2 − 32005 2 1,644 − 1,641 − 1,532 2 − 1 1,534 − 1,529 1 − 4
Unidentified countries
2002 2 93 − 90 − 22 1 − 1 23 − − 21 0 12003 3 88 − 85 − 23 1 − 1 24 − − 21 0 12004 7 102 − 94 − 38 5 − 5 43 − − 35 0 82005 103 487 − 384 − 52 2 − 2 54 − − 32 0 1
Memo item: Industrial countries
2002 16,153 37,828 − 21,675 − 12,160 13,089 − 2,927 25,248 − − 9 3,641 1,2112003 15,782 38,129 − 22,346 − 14,629 12,894 − 2,964 27,523 − − 4 3,790 1,4172004 15,409 37,090 − 21,681 − 13,667 12,982 − 3,008 26,649 − − 9 3,876 1,1902005 16,956 39,013 − 22,057 − 14,702 13,802 − 3,539 28,504 − − 7 3,924 1,151
Emerging markets and developing countries
2002 947 4,766 − 3,820 − 1,697 354 − 272 2,051 − − 530 837 822003 1,083 5,140 − 4,057 − 1,928 252 − 163 2,179 − − 419 867 2012004 553 5,399 − 4,846 − 1,844 213 − 118 2,057 − − 439 904 692005 445 5,284 − 4,839 − 1,621 252 − 110 1,873 − − 501 922 36
* Breakdown of items I.3 and II in the balance of payments tables on list of countries on pp 104−105. — 1 The classification of public and privatepp 6−33. — o For the classification of countries into groups of countries, see transfers depends on the sector to which the domestic agency
64

DEUTSCHEBUNDESBANK
Balance of paymentsby regionAugust 2006
I Balance of payments of the Federal Republic of Germany
7 Capital transfers (cont’d) * o
Private transfers 1 Capital transfers, total Public transfers 1 Private transfers 1
Transfers from Transfers to Transfers to Transfers tonon-residents 3 non-residents 3 non-residents non-residents
of which
of whichPensions Pensionsand andmain- Transfers main- Transfers Transfers Transferstenance by tenance from to of which from of whichpay- foreign pay- non- non- Debt non- Debt
Balance Total ments Total workers ments residents residents Balance Total remission residents Total remission Year
United States
− 1,922 789 13 2,711 53 113 19 82 − 62 0 − 19 82 − 2002− 1,033 618 14 1,650 52 127 16 82 − 66 0 − 16 82 − 2003− 1,357 250 16 1,608 51 128 18 97 − 80 0 − 18 97 − 2004− 1,594 264 14 1,859 49 121 17 91 − 74 1 − 17 91 − 2005
Asia
− 1,093 237 4 1,330 279 127 0 640 − 640 410 0 0 230 6 2002− 1,251 352 4 1,602 287 139 1 540 − 539 302 0 1 237 62 2003− 1,659 202 3 1,862 307 181 1 545 − 544 303 − 1 241 54 2004− 1,190 691 7 1,881 302 297 1 2,481 − 2,480 2,202 1,803 1 279 9 2005
of which: Japan
− 18 89 0 107 7 5 0 0 0 − − 0 0 − 2002− 94 38 0 133 7 6 0 0 0 0 − 0 0 − 2003− 89 53 1 142 9 12 1 0 0 − − 1 0 − 2004
467 585 1 118 6 12 1 1 0 0 − 1 1 − 2005
Emerging markets in South-East Asia
− 526 86 2 613 35 32 − 110 − 110 62 − − 48 − 2002− 703 204 2 907 37 30 0 100 − 100 60 − 0 40 − 2003− 908 97 1 1,005 39 44 0 96 − 96 49 − 0 48 − 2004− 962 45 3 1,006 43 72 0 127 − 127 66 − 0 61 − 2005
Oceania and polar regions
− 86 7 0 93 3 20 0 22 − 22 2 − 0 20 − 2002− 68 6 0 75 3 24 0 19 − 19 2 − 0 18 − 2003− 45 8 1 53 3 23 1 22 − 21 2 − 1 21 − 2004− 43 17 0 60 3 24 2 22 − 20 1 − 2 21 − 2005
International organisations
− 95 6 5 101 − 1 − 9 − 9 8 − − 2 − 2002− 96 7 6 103 − 0 − 4 − 4 3 − − 1 − 2003− 108 2 0 110 − 0 − 5 − 5 5 − − 0 − 2004− 109 0 − 110 − 0 − 3 − 3 3 − − − − 2005
Unidentified countries
− 68 1 0 69 30 38 0 93 − 93 50 − 0 43 − 2002− 62 1 0 64 30 32 0 95 − 95 50 − 0 46 − 2003− 56 2 0 58 30 27 0 118 − 118 81 − 0 37 − 2004− 331 101 0 432 19 12 0 69 − 69 51 − 0 17 − 2005
Memo item: Industrial countries
− 9,515 3,065 383 12,580 2,612 1,193 2,222 304 1,918 15 − 2,222 289 1 2002− 7,717 2,888 403 10,605 2,461 1,262 2,860 268 2,592 0 − 2,860 268 − 2003− 8,014 2,427 440 10,441 2,100 805 2,666 317 2,349 14 − 2,666 302 − 2004− 7,355 3,154 460 10,509 1,841 719 3,465 360 3,105 13 − 3,465 347 − 2005
Emerging markets and developing countries
− 2,123 592 8 2,715 828 412 0 2,028 − 2,028 1,344 199 0 684 6 2002− 2,129 832 9 2,961 841 488 1 2,181 − 2,180 1,184 282 1 997 445 2003− 3,002 340 16 3,342 1,050 466 1 1,798 − 1,797 994 50 1 804 232 2004− 3,218 193 21 3,411 1,066 684 2 4,304 − 4,302 3,351 2,232 2 953 330 2005
participating in the transaction belongs. — 2 Excluding refunds of collection transfers, where identifiable. expenses recorded under receipts from services. — 3 Excluding capital
65

DEUTSCHEBUNDESBANKE U R O S Y S T E M
Balance of paymentsby regionAugust 2006
I Balance of payments of the Federal Republic of Germany
8 Financial transactions with non-residents (excluding reserve assets)* o(a) Total
Up to end-1998 DM million; from 1999 € million
Net German investment abroad (increase/capital exports: −)
Portfolio investmentDirect investment and financial derivatives Other investment 1
of which of whichCredit
Un- Monetarytransactionsdistributed of German financial Enterprises
Equity direct Bonds institu- and General(reinvested)Year Total Total capital earnings investors Total Shares and notes Total tions 2 households government
All countries
1994 − 91,643 − 30,605 − 31,302 86 612 − 65,404 − 11,987 − 27,281 4,366 30,413 − 28,291 1,982
1995 − 169,369 − 55,962 − 51,791 − 1,609 − 2,562 − 26,363 1,727 − 24,072 − 87,044 − 77,821 1,593 − 11,2181996 − 192,796 − 76,449 − 44,146 − 7,518 − 24,786 − 55,075 − 21,970 − 20,849 − 61,271 − 60,231 836 − 2,3911997 − 387,149 − 72,480 − 52,482 − 5,012 − 14,986 − 171,175 − 66,492 − 81,850 − 143,494 − 139,892 1,431 − 5,5331998 − 577,308 − 156,302 − 118,321 − 3,726 − 34,255 − 269,535 − 121,037 − 110,639 − 151,471 − 136,210 − 10,014 − 5,0961999 − 346,737 − 102,018 − 93,809 − 1,667 − 6,542 − 179,562 − 68,032 − 94,595 − 65,158 − 42,144 17,563 6,966
2000 − 364,291 − 61,387 − 69,802 5,205 3,210 − 216,002 − 102,279 − 70,130 − 86,902 − 101,500 − 6,760 − 20,6142001 − 273,994 − 44,347 − 80,357 19,786 16,225 − 117,681 − 10,673 − 95,067 − 111,965 − 130,691 − 20,668 15,3782002 − 258,503 − 20,132 − 54,249 13,269 20,848 − 64,135 − 4,760 − 47,469 − 174,236 − 132,610 − 12,197 6,5802003 − 203,813 − 5,470 − 33,417 3,784 24,163 − 43,621 4,468 − 53,224 − 154,722 − 122,352 − 33,329 7282004 − 262,346 − 1,516 17,642 − 5,605 − 13,553 − 116,004 3,520 − 90,734 − 144,826 − 121,833 − 22,284 2,143
2005 − 370,743 − 36,695 − 16,779 − 9,715 − 10,201 − 215,587 − 22,884 − 143,604 − 118,461 − 85,781 − 13,763 3,156
Europe
2002 − 219,685 − 23,722 − 42,861 7,962 11,176 − 57,242 − 4,403 − 40,911 − 138,720 − 99,860 − 10,013 7,1632003 − 173,826 3,655 − 22,888 1,469 25,074 − 40,686 9,284 − 50,631 − 136,794 − 109,846 − 27,948 7692004 − 232,343 − 3,520 22,575 − 3,703 − 22,392 − 90,305 3,014 − 75,567 − 138,518 − 117,175 − 20,945 2,4532005 − 302,113 − 35,393 − 27,544 − 7,717 − 132 − 186,448 − 14,153 − 127,291 − 80,272 − 50,422 − 9,393 1,579
EU member states (25)
2002 − 226,817 − 23,865 − 42,668 8,334 10,469 − 61,622 − 5,816 − 43,021 − 141,329 − 102,811 − 9,184 6,6762003 − 147,856 4,084 − 23,037 1,383 25,738 − 41,893 7,756 − 50,445 − 110,047 − 86,696 − 23,893 3122004 − 235,060 − 2,550 21,595 − 2,449 − 21,696 − 92,461 3,088 − 78,052 − 140,049 − 117,715 − 21,354 1,8722005 − 279,471 − 25,402 − 23,161 − 6,401 4,159 − 180,756 − 13,944 − 121,314 − 73,313 − 38,729 − 9,123 − 3,426
Euro-area member states
2002 − 158,622 − 6,542 − 24,548 4,223 13,783 − 57,688 − 2,705 − 40,206 − 94,392 − 67,735 2,333 7,0212003 − 59,448 11,697 − 9,811 1,320 20,189 − 39,106 3,296 − 38,966 − 32,040 − 22,354 − 9,131 − 7862004 − 121,318 666 21,907 − 2,662 − 18,579 − 74,557 3,154 − 65,502 − 47,426 − 20,475 − 25,463 1,3632005 − 249,353 − 14,465 − 13,516 − 5,132 4,184 − 150,846 − 10,516 − 98,705 − 84,042 − 53,840 − 4,142 − 4,024
of which: Belgium
2002 − 815 − 398 219 615 − 1,232 − 1,993 171 − 1,701 1,576 − 552 2,157 − 292003 − 738 2,614 − 1,108 − 438 4,161 1,225 − 196 1,700 − 4,577 − 4,484 − 88 − 42004 8,056 2,082 5,138 − 482 − 2,574 2,580 − 330 2,272 3,394 4,250 − 854 − 22005 3,482 3,543 − 616 − 800 4,960 − 847 − 745 − 242 785 1,170 − 113 − 271
Finland
2002 − 3,423 − 765 − 284 − 40 − 441 − 2,406 − 2,080 − 671 − 252 − 38 − 214 −2003 − 1,672 − 73 − 127 − 53 107 − 2,088 394 − 2,437 489 479 10 −2004 − 3,352 − 629 − 591 − 82 44 − 999 8 − 860 − 1,723 − 1,537 − 186 −2005 − 473 − 233 − 116 − 108 − 9 − 826 480 − 1,231 585 737 − 102 − 50
France
2002 − 42,381 − 8,728 − 8,302 335 − 761 − 14,175 1,939 − 12,285 − 19,478 − 17,334 − 2,008 − 32003 − 24,970 − 1,409 − 897 601 − 1,112 − 13,677 1,644 − 9,917 − 9,883 − 6,565 − 2,999 02004 − 17,197 − 5,086 − 4,264 − 424 − 397 3,258 5,161 906 − 15,369 − 12,553 − 2,818 22005 − 7,407 4,663 6,697 − 928 − 1,106 − 24,023 − 2,529 − 8,394 11,953 11,006 2,234 − 1,285
Greece
2002 − 2,756 − 99 − 179 10 71 − 1,445 − 113 − 1,355 − 1,212 − 1,715 503 − 02003 − 3,476 − 65 22 − 7 − 79 − 2,581 179 − 2,760 − 830 − 982 152 −2004 − 4,829 − 144 − 161 − 26 43 − 4,909 − 435 − 4,161 224 − 59 283 02005 − 7,559 − 59 − 23 − 63 27 − 7,906 − 135 − 7,573 406 460 − 54 − 1
* Breakdown of item III in the balance of payments tables on pp 6−33. — countries on pp 104−105. — 1 Loans and trade credits, bank deposits ando For the classification of countries into groups of countries, see list of other capital investment. — 2 Excluding Bundesbank.
66

DEUTSCHEBUNDESBANK
Balance of paymentsby regionAugust 2006
I Balance of payments of the Federal Republic of Germany
Net foreign investment in Germany (increase/capital imports: +)
Direct investment Portfolio investment Other investment 1
of which of whichCredit
Un- Monetarytransactionsdistributed of foreign financial Enterprises
Equity direct Bonds institu- and General(reinvested)Total Total capital earnings investors Total Shares and notes Total tions 2 households government Year
All countries
149,505 11,578 6,371 − 3,176 8,383 14,894 1,259 22,605 123,033 111,542 11,761 3,232 1994
229,840 17,233 13,411 − 5,266 9,088 75,145 − 1,697 86,029 137,463 120,293 18,794 2,120 1995215,203 9,890 7,989 − 10,893 12,795 141,347 22,064 102,137 63,966 55,387 6,029 4,323 1996387,180 21,233 11,378 − 2,697 12,552 158,017 27,308 122,489 207,930 204,335 17,275 − 13,038 1997610,119 43,276 12,190 − 2,504 33,591 265,147 101,313 153,456 301,696 279,294 18,764 49 1998323,806 52,634 24,131 − 5,789 34,293 168,090 22,619 97,594 103,082 95,394 20,933 − 11,255 1999
392,634 215,209 118,404 − 6,883 103,688 51,093 − 34,733 74,519 126,332 115,352 10,040 526 2000256,167 29,518 34,718 − 21,252 16,053 156,708 86,812 80,315 69,942 54,330 12,101 879 2001217,989 56,871 37,924 − 6,990 25,937 130,154 15,916 88,899 30,964 28,453 3,483 − 1,625 2002155,315 25,873 44,233 − 3,163 − 15,197 112,629 23,093 69,628 16,813 10,708 429 3,693 2003146,180 − 12,172 27,493 677 − 40,343 120,068 − 12,763 142,689 38,285 32,337 11,057 − 2,658 2004
268,145 26,264 12,103 6,530 7,632 196,987 40,030 158,690 44,893 22,455 20,803 3,740 2005
Europe
217,928 49,911 36,804 − 7,434 20,542 112,304 13,303 82,748 55,712 54,313 3,167 − 1,568 2002153,623 22,793 37,675 − 3,915 − 10,967 96,192 22,392 62,280 34,639 32,709 − 1,962 3,737 2003171,727 − 14,468 24,608 − 1,639 − 37,438 136,057 2,915 137,048 50,138 45,661 7,404 − 2,865 2004251,973 26,196 11,318 4,485 10,392 175,129 40,764 137,501 50,649 27,617 19,590 3,540 2005
EU member states (25)
209,179 46,518 33,035 − 6,675 20,158 103,786 14,055 78,255 58,875 58,055 2,274 − 1,480 2002113,538 17,946 30,943 − 3,454 − 9,543 72,250 12,982 53,206 23,342 21,858 − 2,461 3,835 2003152,796 − 12,725 23,246 − 1,733 − 34,238 114,258 − 3,980 127,703 51,263 47,069 6,954 − 2,564 2004214,867 23,834 12,008 4,241 7,585 161,614 40,061 131,328 29,420 6,915 18,917 3,542 2005
Euro-area member states
− 135,862 35,939 29,085 − 5,768 12,622 − 207,748 5,165 − 74,298 35,947 29,866 5,692 406 2002− 190,765 21,880 24,232 − 851 − 1,500 − 213,896 − 3,301 − 52,319 1,250 5,974 − 9,536 4,835 2003− 207,632 − 17,998 15,310 − 2,137 − 31,172 − 206,581 − 2,261 − 47,142 16,947 10,146 6,368 430 2004− 153,970 22,918 5,733 4,480 12,704 − 186,713 13,838 − 64,255 9,825 454 4,639 4,730 2005
of which: Belgium
− 146,749 5,292 1,848 − 1,810 5,254 − 156,538 1,329 − 63,633 4,496 4,482 27 − 10 2002− 226,548 − 6,191 − 685 − 81 − 5,424 − 218,828 − 298 − 85,524 − 1,530 − 1,403 − 127 − 2003− 218,394 − 3,429 − 524 426 − 3,331 − 216,605 108 − 79,262 1,640 1,043 597 − 0 2004− 213,403 − 2,327 − 2,491 978 − 814 − 213,401 245 − 84,452 2,325 2,308 17 − 2005
Finland
− 2,396 − 1,057 2,061 894 − 4,012 − 253 − 24 − 363 − 1,086 − 1,268 183 − 2002600 219 601 219 − 601 995 36 792 − 614 64 − 679 − 2003
1,282 − 479 22 39 − 539 1,557 − 2 882 203 72 133 − 20042,587 177 111 242 − 177 1,056 48 810 1,354 751 489 114 2005
France
24,712 2,415 2,634 − 1,585 1,367 14,853 − 683 3,188 7,445 4,668 2,783 − 200286,476 10,579 10,701 − 999 876 63,656 7,606 37,536 12,241 12,183 − 470 528 200389,683 3,354 3,457 835 − 938 71,472 8,716 47,093 14,857 10,607 4,218 29 200425,802 − 19,640 − 18,668 894 − 1,866 53,553 4,302 37,071 − 8,112 − 9,878 1,656 113 2005
Greece
1,063 216 244 − 21 − 7 308 6 − 8 539 423 117 − 20021,684 − 9 0 − 10 2 2,051 6 1,632 − 359 − 423 65 − 20032,135 − 6 − 1 − 4 − 1 2,367 − 2 1,891 − 226 − 394 168 − 20042,301 5 − 1 − 5 11 2,375 − 12 2,073 − 79 − 76 − 3 − 2005
67

DEUTSCHEBUNDESBANKE U R O S Y S T E M
Balance of paymentsby regionAugust 2006
I Balance of payments of the Federal Republic of Germany
8 Financial transactions with non-residents (excluding reserve assets)* o(a) Total (cont’d)
€ million
Net German investment abroad (increase/capital exports: −)
Portfolio investmentDirect investment and financial derivatives Other investment 1
of which of whichCredit
Un- Monetarytransactionsdistributed of German financial Enterprises
Equity direct Bonds institu- and General(reinvested)Year Total Total capital earnings investors Total Shares and notes Total tions 2 households government
Ireland
2002 − 8,841 1,032 1,314 325 − 606 − 1,499 − 472 − 1,850 − 8,375 − 6,838 − 1,451 − 852003 − 12,522 264 297 359 − 392 − 9,089 − 91 − 8,162 − 3,698 − 4,152 331 1242004 − 30,110 − 574 − 323 − 28 − 223 − 14,960 − 48 − 12,752 − 14,576 − 4,366 − 10,131 − 792005 − 25,247 − 1,062 − 398 − 146 − 518 − 11,758 − 990 − 9,316 − 12,426 − 9,092 − 3,456 122
Italy
2002 − 12,512 − 4,283 − 4,253 − 55 25 − 3,334 763 − 397 − 4,896 − 5,387 489 12003 11,075 1,350 − 972 − 4 2,326 7,943 496 2,958 1,782 1,717 65 − 02004 − 4,606 19,656 21,879 − 480 − 1,743 − 20,813 − 1,028 − 18,990 − 3,449 − 2,916 − 533 12005 − 45,197 − 3,532 − 10,137 − 446 7,051 − 22,791 − 9,235 − 20,885 − 18,874 − 15,365 − 2,633 − 875
Luxembourg
2002 − 13,181 − 1,479 − 2,140 909 − 248 − 6,113 − 626 − 1,720 − 5,590 − 18,041 5,334 7,1172003 − 7,814 826 − 180 230 775 29 13 1,740 − 8,668 − 4,685 − 3,034 − 9502004 − 9,013 − 3,220 − 254 103 − 3,069 − 8,840 168 − 2,563 3,047 6,942 − 5,286 1,3902005 − 64,795 − 2,013 − 4,483 15 2,454 − 40,399 − 135 − 7,362 − 22,383 − 26,052 4,781 − 1,112
Netherlands
2002 − 10,391 9,687 − 7,808 1,818 15,677 − 16,207 − 2,478 − 9,323 − 3,872 − 2,587 − 1,306 222003 − 1,918 6,650 − 7,896 961 13,585 − 6,021 1,457 − 8,897 − 2,548 − 1,833 − 697 − 172004 − 10,974 − 11,231 − 544 − 385 − 10,302 1,955 181 1,308 − 1,698 − 1,650 − 99 522005 − 11,893 − 8,881 − 977 − 1,249 − 6,655 − 1,663 3,516 − 5,431 − 1,350 − 1,290 92 − 152
Austria
2002 − 6,641 − 495 − 490 63 − 68 − 3,574 − 434 − 2,709 − 2,572 − 1,447 − 1,127 −2003 − 2,303 1,071 892 − 273 452 − 2,645 139 − 2,056 − 729 − 11 − 719 02004 − 12,281 − 1,218 − 889 − 315 − 15 − 6,604 33 − 6,112 − 4,459 − 2,204 − 2,254 − 12005 − 24,829 − 4,591 − 2,953 − 561 − 1,077 − 4,610 − 109 − 3,648 − 15,628 − 7,890 − 7,339 − 399
Portugal
2002 − 3,629 − 234 − 212 164 − 187 − 2,347 34 − 2,260 − 1,048 − 807 − 242 02003 401 739 636 − 16 118 1,319 75 1,446 − 1,657 215 − 1,873 02004 − 3,491 − 75 123 − 128 − 71 − 109 6 − 183 − 3,308 249 − 3,556 −2005 − 4,551 − 386 − 128 − 94 − 165 − 3,347 − 151 − 3,050 − 818 − 3,141 2,323 0
Spain
2002 − 18,196 − 781 − 2,412 78 1,553 − 4,593 594 − 5,933 − 12,822 − 12,990 199 − 12003 − 16,033 − 270 − 479 − 40 248 − 13,521 − 814 − 12,582 − 2,241 − 2,053 − 280 622004 − 30,668 1,106 1,793 − 415 − 271 − 25,116 − 562 − 24,368 − 6,658 − 6,629 − 28 − 12005 − 38,849 − 1,914 − 382 − 753 − 780 − 32,676 − 484 − 31,574 − 4,259 − 4,383 125 − 1
Other EU member states
2002 − 68,195 − 17,323 − 18,120 4,111 − 3,314 − 3,934 − 3,111 − 2,815 − 46,938 − 35,076 − 11,517 − 3452003 − 88,408 − 7,613 − 13,226 63 5,549 − 2,787 4,460 − 11,480 − 78,007 − 64,342 − 14,763 1,0982004 − 113,743 − 3,216 − 312 213 − 3,117 − 17,904 − 66 − 12,550 − 92,623 − 97,241 4,109 5092005 − 30,119 − 10,937 − 9,645 − 1,269 − 24 − 29,910 − 3,428 − 22,609 10,729 15,112 − 4,981 598
of which: Denmark
2002 − 2,547 − 54 − 3 − 43 − 9 525 129 446 − 3,018 − 2,006 − 1,013 12003 − 3,668 − 307 − 199 − 159 51 − 955 83 − 1,127 − 2,406 − 1,739 − 667 − 12004 − 2,075 − 755 − 535 − 152 − 68 1,264 − 94 1,307 − 2,584 − 2,848 264 − 02005 − 8,909 − 711 − 245 − 220 − 245 − 3,601 − 82 − 3,289 − 4,597 − 4,804 207 − 0
* Breakdown of item III in the balance of payments tables on pp 6−33. — countries on pp 104−105. — 1 Loans and trade credits, bank deposits ando For the classification of countries into groups of countries, see list of other capital investment. — 2 Excluding Bundesbank.
68

DEUTSCHEBUNDESBANK
Balance of paymentsby regionAugust 2006
I Balance of payments of the Federal Republic of Germany
Net foreign investment in Germany (increase/capital imports: +)
Direct investment Portfolio investment Other investment 1
of which of whichCredit
Un- Monetarytransactionsdistributed of foreign financial Enterprises
Equity direct Bonds institu- and General(reinvested)Total Total capital earnings investors Total Shares and notes Total tions 2 households government Year
Ireland
5,211 2,741 1,805 646 290 − 132 − 16 − 395 2,602 2,839 229 − 464 20029,486 184 42 209 − 67 910 82 271 8,392 5,600 − 1,630 4,422 20039,798 − 475 247 − 91 − 632 3,984 − 235 3,787 6,289 3,456 1,906 926 2004
16,237 4,262 67 409 3,785 2,689 − 832 3,229 9,286 4,535 12 4,735 2005
Italy
7,003 685 363 − 210 532 − 633 821 − 1,086 6,951 6,352 544 55 20028,020 − 303 − 90 − 378 164 8,717 3 8,470 − 394 − 58 − 391 55 20038,169 495 247 115 133 4,646 596 4,628 3,028 3,021 9 − 2004
25,640 19,080 19,314 51 − 286 6,736 − 199 5,979 − 176 60 − 235 − 2005
Luxembourg
− 68,278 6,852 12,358 − 796 − 4,710 − 103,936 5 − 32,122 28,807 27,348 1,139 321 2002− 97,181 8,293 8,077 643 − 427 − 99,824 1,080 − 35,429 − 5,650 1,866 − 7,345 − 171 2003− 106,251 − 21,229 − 979 366 − 20,615 − 81,587 1,576 − 34,802 − 3,435 − 1,258 − 1,579 − 599 2004− 58,311 10,064 5,955 80 4,029 − 79,042 − 1,570 − 38,458 10,666 9,735 1,549 − 618 2005
Netherlands
34,392 16,246 1,820 − 3,249 17,674 28,700 3,384 12,048 − 10,554 − 11,268 184 508 200210,743 7,558 5,349 − 2,065 4,274 11,675 − 11,945 7,716 − 8,490 − 9,805 1,339 − 2003
− 6,618 3,480 11,889 − 3,264 − 5,144 − 1,467 − 13,475 548 − 8,632 − 8,891 228 28 200423,027 7,895 584 649 6,662 25,855 12,240 − 1,651 − 10,722 − 11,606 661 225 2005
Austria
2,975 352 − 134 295 192 6,330 244 5,152 − 3,707 − 4,180 497 − 20025,597 − 168 20 54 − 242 3,716 30 2,674 2,049 2,376 − 349 22 20033,584 366 155 187 24 3,185 164 3,725 34 − 243 231 46 20049,866 1,402 582 339 481 3,928 − 564 4,131 4,535 3,871 500 161 2005
Portugal
− 287 − 81 − 1 4 − 84 285 39 240 − 492 − 487 − 4 − 2002732 − 210 8 3 − 221 332 9 440 610 671 − 61 − 2003858 − 63 14 6 − 83 − 363 − 4 − 327 1,284 966 317 − 2004
8 170 − 0 8 162 892 − 3 801 − 1,054 − 1,030 − 23 − 2005
Spain
6,681 2,277 6,088 64 − 3,875 3,458 59 2,870 946 957 − 7 − 20029,715 1,927 208 1,553 165 12,794 91 9,192 − 5,006 − 5,097 112 − 20037,905 − 14 783 − 751 − 45 6,043 296 4,508 1,875 1,767 108 − 2004
12,214 1,830 280 834 716 8,583 183 6,145 1,800 1,784 16 − 2005
Other EU member states
345,041 10,580 3,950 − 907 7,536 311,534 8,890 152,553 22,928 28,190 − 3,419 − 1,886 2002304,303 − 3,934 6,712 − 2,602 − 8,043 286,145 16,283 105,526 22,092 15,884 7,075 − 1,001 2003360,428 5,273 7,936 404 − 3,067 320,839 − 1,719 174,845 34,316 36,923 586 − 2,994 2004368,837 916 6,275 − 240 − 5,120 348,326 26,223 195,583 19,595 6,460 14,277 − 1,188 2005
of which: Denmark
2,672 600 751 − 446 296 1,329 − 19 751 743 723 22 − 20023,967 797 533 397 − 133 3,673 113 2,887 − 504 − 461 − 43 − 20034,226 485 695 220 − 430 2,989 71 2,375 752 731 21 − 0 20041,831 637 146 242 250 471 1,651 − 1,494 724 907 − 183 − 2005
69
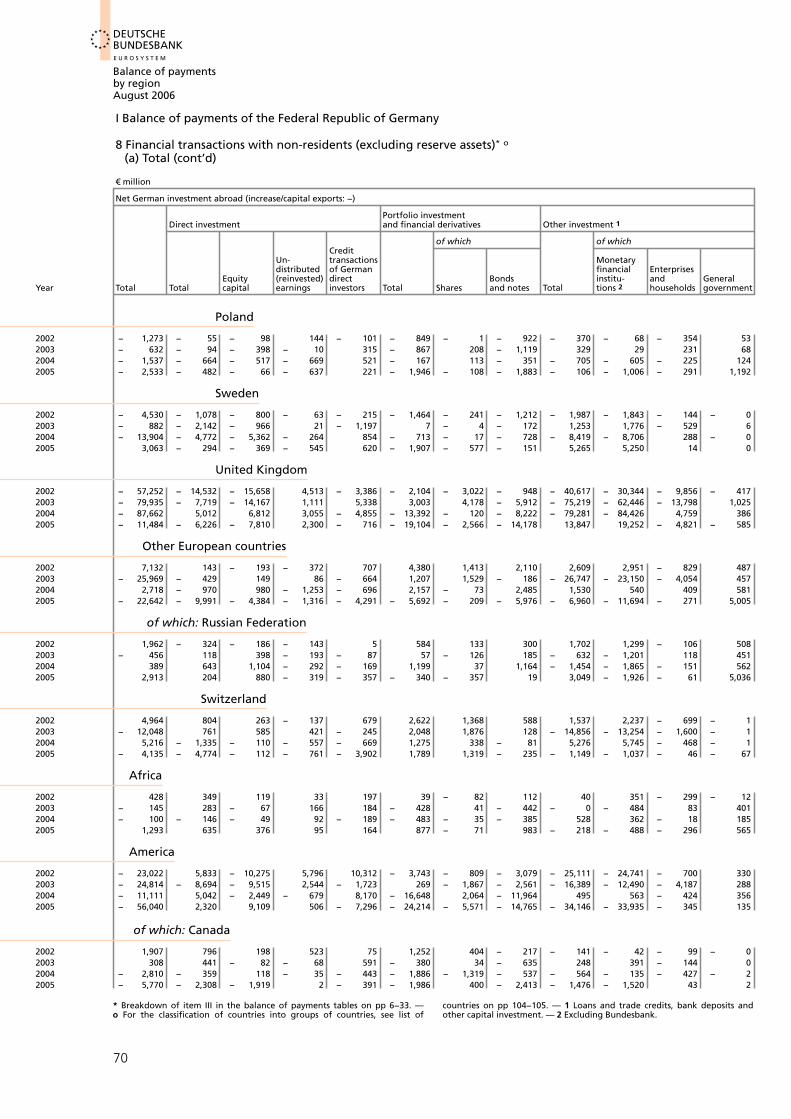
DEUTSCHEBUNDESBANKE U R O S Y S T E M
Balance of paymentsby regionAugust 2006
I Balance of payments of the Federal Republic of Germany
8 Financial transactions with non-residents (excluding reserve assets)* o(a) Total (cont’d)
€ million
Net German investment abroad (increase/capital exports: −)
Portfolio investmentDirect investment and financial derivatives Other investment 1
of which of whichCredit
Un- Monetarytransactionsdistributed of German financial Enterprises
Equity direct Bonds institu- and General(reinvested)Year Total Total capital earnings investors Total Shares and notes Total tions 2 households government
Poland
2002 − 1,273 − 55 − 98 144 − 101 − 849 − 1 − 922 − 370 − 68 − 354 532003 − 632 − 94 − 398 − 10 315 − 867 208 − 1,119 329 29 231 682004 − 1,537 − 664 − 517 − 669 521 − 167 113 − 351 − 705 − 605 − 225 1242005 − 2,533 − 482 − 66 − 637 221 − 1,946 − 108 − 1,883 − 106 − 1,006 − 291 1,192
Sweden
2002 − 4,530 − 1,078 − 800 − 63 − 215 − 1,464 − 241 − 1,212 − 1,987 − 1,843 − 144 − 02003 − 882 − 2,142 − 966 21 − 1,197 7 − 4 − 172 1,253 1,776 − 529 62004 − 13,904 − 4,772 − 5,362 − 264 854 − 713 − 17 − 728 − 8,419 − 8,706 288 − 02005 3,063 − 294 − 369 − 545 620 − 1,907 − 577 − 151 5,265 5,250 14 0
United Kingdom
2002 − 57,252 − 14,532 − 15,658 4,513 − 3,386 − 2,104 − 3,022 − 948 − 40,617 − 30,344 − 9,856 − 4172003 − 79,935 − 7,719 − 14,167 1,111 5,338 3,003 4,178 − 5,912 − 75,219 − 62,446 − 13,798 1,0252004 − 87,662 5,012 6,812 3,055 − 4,855 − 13,392 − 120 − 8,222 − 79,281 − 84,426 4,759 3862005 − 11,484 − 6,226 − 7,810 2,300 − 716 − 19,104 − 2,566 − 14,178 13,847 19,252 − 4,821 − 585
Other European countries
2002 7,132 143 − 193 − 372 707 4,380 1,413 2,110 2,609 2,951 − 829 4872003 − 25,969 − 429 149 86 − 664 1,207 1,529 − 186 − 26,747 − 23,150 − 4,054 4572004 2,718 − 970 980 − 1,253 − 696 2,157 − 73 2,485 1,530 540 409 5812005 − 22,642 − 9,991 − 4,384 − 1,316 − 4,291 − 5,692 − 209 − 5,976 − 6,960 − 11,694 − 271 5,005
of which: Russian Federation
2002 1,962 − 324 − 186 − 143 5 584 133 300 1,702 1,299 − 106 5082003 − 456 118 398 − 193 − 87 57 − 126 185 − 632 − 1,201 118 4512004 389 643 1,104 − 292 − 169 1,199 37 1,164 − 1,454 − 1,865 − 151 5622005 2,913 204 880 − 319 − 357 − 340 − 357 19 3,049 − 1,926 − 61 5,036
Switzerland
2002 4,964 804 263 − 137 679 2,622 1,368 588 1,537 2,237 − 699 − 12003 − 12,048 761 585 421 − 245 2,048 1,876 128 − 14,856 − 13,254 − 1,600 − 12004 5,216 − 1,335 − 110 − 557 − 669 1,275 338 − 81 5,276 5,745 − 468 − 12005 − 4,135 − 4,774 − 112 − 761 − 3,902 1,789 1,319 − 235 − 1,149 − 1,037 − 46 − 67
Africa
2002 428 349 119 33 197 39 − 82 112 40 351 − 299 − 122003 − 145 283 − 67 166 184 − 428 41 − 442 − 0 − 484 83 4012004 − 100 − 146 − 49 92 − 189 − 483 − 35 − 385 528 362 − 18 1852005 1,293 635 376 95 164 877 − 71 983 − 218 − 488 − 296 565
America
2002 − 23,022 5,833 − 10,275 5,796 10,312 − 3,743 − 809 − 3,079 − 25,111 − 24,741 − 700 3302003 − 24,814 − 8,694 − 9,515 2,544 − 1,723 269 − 1,867 − 2,561 − 16,389 − 12,490 − 4,187 2882004 − 11,111 5,042 − 2,449 − 679 8,170 − 16,648 2,064 − 11,964 495 563 − 424 3562005 − 56,040 2,320 9,109 506 − 7,296 − 24,214 − 5,571 − 14,765 − 34,146 − 33,935 − 345 135
of which: Canada
2002 1,907 796 198 523 75 1,252 404 − 217 − 141 − 42 − 99 − 02003 308 441 − 82 − 68 591 − 380 34 − 635 248 391 − 144 02004 − 2,810 − 359 118 − 35 − 443 − 1,886 − 1,319 − 537 − 564 − 135 − 427 − 22005 − 5,770 − 2,308 − 1,919 2 − 391 − 1,986 400 − 2,413 − 1,476 − 1,520 43 2
* Breakdown of item III in the balance of payments tables on pp 6−33. — countries on pp 104−105. — 1 Loans and trade credits, bank deposits ando For the classification of countries into groups of countries, see list of other capital investment. — 2 Excluding Bundesbank.
70

DEUTSCHEBUNDESBANK
Balance of paymentsby regionAugust 2006
I Balance of payments of the Federal Republic of Germany
Net foreign investment in Germany (increase/capital imports: +)
Direct investment Portfolio investment Other investment 1
of which of whichCredit
Un- Monetarytransactionsdistributed of foreign financial Enterprises
Equity direct Bonds institu- and General(reinvested)Total Total capital earnings investors Total Shares and notes Total tions 2 households government Year
Poland
− 1,553 20 1 3 16 − 1,024 1 − 1,030 − 550 − 598 48 − 2002− 1,110 217 120 8 89 − 554 1 − 588 − 772 − 768 − 3 − 2003
1,163 72 50 7 16 39 − 1 24 1,052 927 125 − 20041,993 183 − 2 6 179 898 − 8 790 912 858 54 − 2005
Sweden
4,132 788 860 − 174 102 725 12 607 2,619 2,316 305 − 2002− 186 384 474 68 − 158 2,283 76 1,912 − 2,853 − 2,262 − 592 − 2003
10,270 1,621 643 315 663 2,884 422 916 5,764 5,680 56 30 20044,118 771 334 548 − 111 1,326 280 − 103 2,021 1,800 236 − 15 2005
United Kingdom
331,185 9,117 2,323 − 280 7,075 303,889 8,875 148,069 18,179 22,418 − 3,876 − 363 2002293,791 − 5,342 5,578 − 3,078 − 7,843 275,056 16,088 97,137 24,078 17,077 6,994 8 2003334,072 2,862 6,550 − 129 − 3,559 308,514 − 2,218 166,520 22,696 24,020 − 211 − 1,113 2004344,163 − 4,359 5,789 − 1,015 − 9,132 337,964 24,308 191,224 10,558 − 1,957 13,547 − 1,032 2005
Other European countries
8,749 3,393 3,769 − 759 384 8,519 − 751 4,493 − 3,163 − 3,742 894 − 88 200240,085 4,846 6,731 − 461 − 1,424 23,942 9,410 9,073 11,297 10,851 499 − 98 200318,930 − 1,744 1,362 94 − 3,200 21,799 6,895 9,345 − 1,125 − 1,408 450 − 300 200437,106 2,362 − 690 245 2,808 13,515 703 6,173 21,229 20,703 673 − 2 2005
of which: Russian Federation
199 − 81 − 18 121 − 184 − 1,418 − 1 − 1,435 1,698 1,391 307 − 20021,130 37 1 99 − 64 79 2 249 1,014 827 187 − 20033,465 130 6 106 19 1,026 − 1 719 2,308 2,472 − 164 − 2004
11,203 102 3 141 − 43 1,501 57 1,123 9,600 8,683 917 − 2005
Switzerland
5,216 1,697 1,820 − 844 721 5,244 − 797 2,999 − 1,724 − 2,392 757 − 88 200225,500 5,119 6,730 − 616 − 995 19,109 9,306 8,818 1,272 1,912 − 543 − 98 200317,608 81 1,536 − 63 − 1,392 19,807 9,773 4,519 − 2,279 − 2,011 − 210 − 62 200411,157 3,284 637 − 9 2,656 342 312 − 1,544 7,531 7,004 482 49 2005
Africa
1 − 299 0 − 7 − 292 814 10 289 − 515 − 259 − 213 − 20024,568 110 81 1 28 2,877 − 7 1,679 1,582 1,323 231 − 20036,451 141 98 10 33 3,229 − 8 1,322 3,081 2,727 339 − 2004
12,956 − 172 75 10 − 258 5,361 − 31 3,537 7,767 7,924 − 249 − 2005
America
− 852 5,971 − 350 511 5,809 7,566 2,482 − 3,396 − 14,388 − 14,641 − 621 − 51 2002− 3,983 1,835 5,736 753 − 4,653 6,558 765 1,705 − 12,376 − 15,035 1,013 − 39 2003− 26,968 530 2,611 2,112 − 4,194 − 9,725 − 15,224 5,423 − 17,772 − 17,393 1,950 147 2004− 9,219 − 444 399 1,798 − 2,641 7,205 − 597 692 − 15,979 − 16,741 233 108 2005
of which: Canada
− 597 38 28 61 − 51 − 803 1,127 − 1,919 168 − 62 233 − 20021,137 251 210 65 − 25 144 244 − 110 743 622 120 − 2003
617 297 169 77 51 549 − 166 241 − 229 − 632 404 − 20041,003 762 181 116 465 72 329 − 433 169 144 26 − 2005
71

DEUTSCHEBUNDESBANKE U R O S Y S T E M
Balance of paymentsby regionAugust 2006
I Balance of payments of the Federal Republic of Germany
8 Financial transactions with non-residents (excluding reserve assets)* o(a) Total (cont’d)
€ million
Net German investment abroad (increase/capital exports: −)
Portfolio investmentDirect investment and financial derivatives Other investment 1
of which of whichCredit
Un- Monetarytransactionsdistributed of German financial Enterprises
Equity direct Bonds institu- and General(reinvested)Year Total Total capital earnings investors Total Shares and notes Total tions 2 households government
United States
2002 − 15,731 2,899 − 8,899 4,386 7,412 − 1,431 − 899 79 − 17,199 − 17,474 − 17 2912003 − 32,659 − 8,634 − 7,894 2,049 − 2,789 − 6,105 − 1,673 − 5,377 − 17,920 − 14,297 − 3,901 2792004 − 6,396 7,080 − 1,903 − 129 9,112 − 9,335 3,417 − 10,349 − 4,141 − 3,397 − 1,036 2932005 − 18,627 5,591 11,153 915 − 6,477 − 18,853 − 5,054 − 11,156 − 5,365 − 5,915 422 128
Asia
2002 − 17,198 − 2,689 − 1,703 − 521 − 464 − 4,032 356 − 4,526 − 10,477 − 8,855 − 1,290 − 3322003 − 3,994 − 1,514 − 790 − 317 − 408 − 2,854 − 3,316 917 374 1,740 − 1,167 − 1982004 − 17,446 − 3,913 − 1,964 − 1,616 − 333 − 7,094 − 1,368 − 1,743 − 6,439 − 5,772 − 552 − 1142005 − 9,010 − 5,556 − 72 − 2,628 − 2,856 − 4,248 − 2,774 − 1,001 793 2,177 − 2,941 1,557
of which: Japan
2002 − 10,387 − 854 − 343 − 386 − 125 − 4,195 643 − 4,622 − 5,338 − 5,179 − 159 −2003 − 5,387 − 725 − 805 155 − 75 − 2,005 − 2,665 1,010 − 2,657 − 2,600 − 56 −2004 − 8,970 − 360 − 540 233 − 53 − 6,428 − 1,325 − 1,293 − 2,181 − 1,668 − 513 −2005 2,903 1,638 1,838 207 − 408 − 2,949 − 2,601 240 4,215 6,306 − 2,092 −
Emerging markets in South-East Asia
2002 − 4,640 − 883 − 586 − 108 − 189 − 213 − 266 − 36 − 3,544 − 3,043 − 280 − 2222003 3,839 1,146 766 − 77 457 − 569 − 460 − 48 3,262 4,026 − 655 − 1082004 − 2,847 − 1,767 − 277 − 1,242 − 248 − 253 92 − 217 − 827 − 851 138 − 1142005 − 4,457 − 2,969 − 422 − 1,840 − 708 − 177 134 − 628 − 1,311 − 1,348 214 − 177
Oceania and polar regions
2002 313 98 471 − 0 − 372 − 162 177 32 377 571 − 194 − 02003 − 237 800 − 157 − 78 1,035 − 34 324 − 718 − 1,004 − 888 − 116 − 02004 − 290 1,020 − 471 302 1,190 − 1,421 − 154 − 1,207 111 446 − 334 − 02005 − 3,218 1,300 1,353 28 − 82 − 1,361 − 315 − 1,323 − 3,156 − 2,348 − 800 − 9
International organisations
2002 360 − − − − 1,005 1 902 − 645 − 75 − − 5702003 − 648 − − − − 113 1 212 − 761 − 230 − − 5312004 − 994 − − − − − 53 − 1 133 − 941 − 184 − 20 − 7372005 − 1,741 − − − − − 193 − − 207 − 1,547 − 839 0 − 671
Unidentified countries
2002 300 − − − − − − − 300 − 0 300 −2003 − 150 − − − − − 2 − − − 148 − 154 6 −2004 − 62 − − − − − − − − 62 − 72 10 −2005 86 − − − − − − − 86 74 12 −
Memo item: Industrial countries
2002 − 244,456 − 20,079 − 51,098 12,705 18,314 − 62,162 − 4,162 − 45,806 − 162,215 − 122,773 − 10,397 6,9652003 − 209,648 − 4,328 − 32,219 3,806 24,085 − 49,089 5,437 − 56,366 − 156,231 − 124,988 − 32,056 5832004 − 249,307 3,908 19,077 − 2,911 − 12,259 − 110,919 3,592 − 90,454 − 142,296 − 118,741 − 22,878 2,1752005 − 321,255 − 23,968 − 11,157 − 6,317 − 6,494 − 211,334 − 21,345 − 142,071 − 85,952 − 49,042 − 11,512 − 3,361
Emerging markets and developing countries
2002 − 14,706 − 53 − 3,151 564 2,535 − 2,978 − 599 − 2,565 − 11,676 − 9,762 − 2,099 1862003 6,632 − 1,142 − 1,198 − 22 78 5,357 − 970 2,930 2,417 3,019 − 1,279 6772004 − 11,982 − 5,424 − 1,436 − 2,694 − 1,294 − 5,031 − 71 − 414 − 1,527 − 2,836 604 7052005 − 47,833 − 12,726 − 5,622 − 3,398 − 3,707 − 4,060 − 1,538 − 1,326 − 31,047 − 35,973 − 2,263 7,189
* Breakdown of item III in the balance of payments tables on pp 6−33. — countries on pp 104−105. — 1 Loans and trade credits, bank deposits ando For the classification of countries into groups of countries, see list of other capital investment. — 2 Excluding Bundesbank.
72
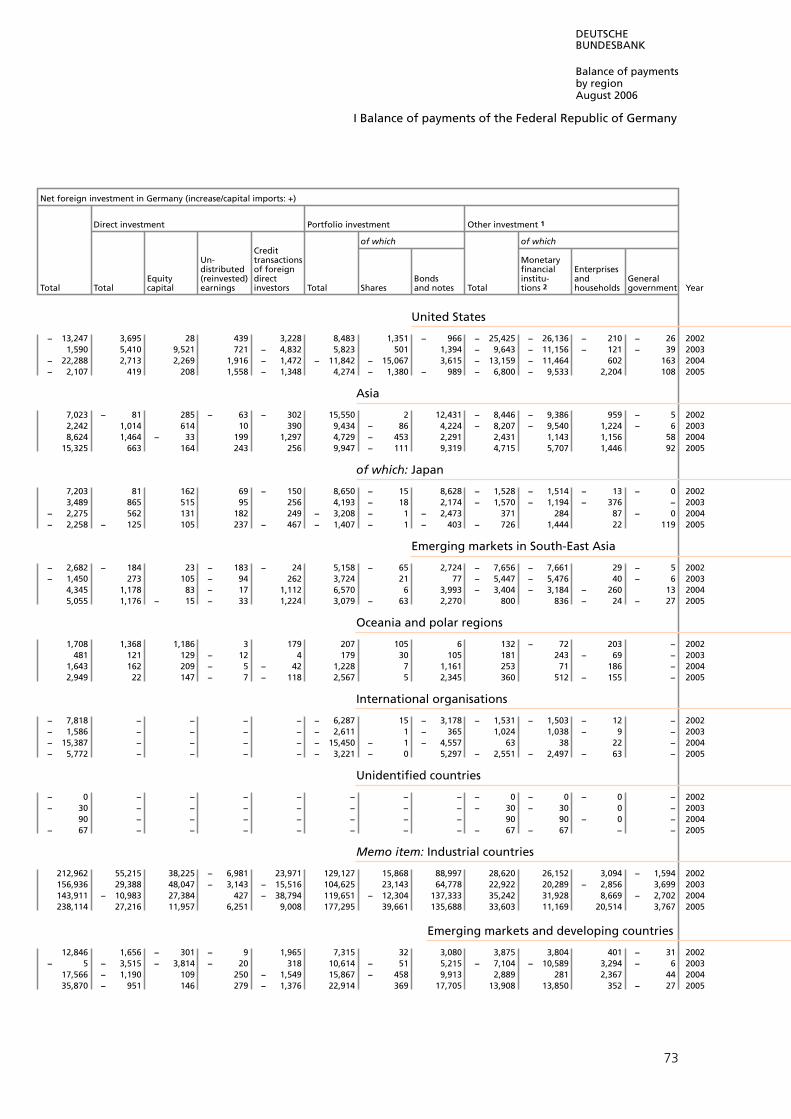
DEUTSCHEBUNDESBANK
Balance of paymentsby regionAugust 2006
I Balance of payments of the Federal Republic of Germany
Net foreign investment in Germany (increase/capital imports: +)
Direct investment Portfolio investment Other investment 1
of which of whichCredit
Un- Monetarytransactionsdistributed of foreign financial Enterprises
Equity direct Bonds institu- and General(reinvested)Total Total capital earnings investors Total Shares and notes Total tions 2 households government Year
United States
− 13,247 3,695 28 439 3,228 8,483 1,351 − 966 − 25,425 − 26,136 − 210 − 26 20021,590 5,410 9,521 721 − 4,832 5,823 501 1,394 − 9,643 − 11,156 − 121 − 39 2003
− 22,288 2,713 2,269 1,916 − 1,472 − 11,842 − 15,067 3,615 − 13,159 − 11,464 602 163 2004− 2,107 419 208 1,558 − 1,348 4,274 − 1,380 − 989 − 6,800 − 9,533 2,204 108 2005
Asia
7,023 − 81 285 − 63 − 302 15,550 2 12,431 − 8,446 − 9,386 959 − 5 20022,242 1,014 614 10 390 9,434 − 86 4,224 − 8,207 − 9,540 1,224 − 6 20038,624 1,464 − 33 199 1,297 4,729 − 453 2,291 2,431 1,143 1,156 58 2004
15,325 663 164 243 256 9,947 − 111 9,319 4,715 5,707 1,446 92 2005
of which: Japan
7,203 81 162 69 − 150 8,650 − 15 8,628 − 1,528 − 1,514 − 13 − 0 20023,489 865 515 95 256 4,193 − 18 2,174 − 1,570 − 1,194 − 376 − 2003
− 2,275 562 131 182 249 − 3,208 − 1 − 2,473 371 284 87 − 0 2004− 2,258 − 125 105 237 − 467 − 1,407 − 1 − 403 − 726 1,444 22 119 2005
Emerging markets in South-East Asia
− 2,682 − 184 23 − 183 − 24 5,158 − 65 2,724 − 7,656 − 7,661 29 − 5 2002− 1,450 273 105 − 94 262 3,724 21 77 − 5,447 − 5,476 40 − 6 2003
4,345 1,178 83 − 17 1,112 6,570 6 3,993 − 3,404 − 3,184 − 260 13 20045,055 1,176 − 15 − 33 1,224 3,079 − 63 2,270 800 836 − 24 − 27 2005
Oceania and polar regions
1,708 1,368 1,186 3 179 207 105 6 132 − 72 203 − 2002481 121 129 − 12 4 179 30 105 181 243 − 69 − 2003
1,643 162 209 − 5 − 42 1,228 7 1,161 253 71 186 − 20042,949 22 147 − 7 − 118 2,567 5 2,345 360 512 − 155 − 2005
International organisations
− 7,818 − − − − − 6,287 15 − 3,178 − 1,531 − 1,503 − 12 − 2002− 1,586 − − − − − 2,611 1 − 365 1,024 1,038 − 9 − 2003− 15,387 − − − − − 15,450 − 1 − 4,557 63 38 22 − 2004− 5,772 − − − − − 3,221 − 0 5,297 − 2,551 − 2,497 − 63 − 2005
Unidentified countries
− 0 − − − − − − − − 0 − 0 − 0 − 2002− 30 − − − − − − − − 30 − 30 0 − 2003
90 − − − − − − − 90 90 − 0 − 2004− 67 − − − − − − − − 67 − 67 − − 2005
Memo item: Industrial countries
212,962 55,215 38,225 − 6,981 23,971 129,127 15,868 88,997 28,620 26,152 3,094 − 1,594 2002156,936 29,388 48,047 − 3,143 − 15,516 104,625 23,143 64,778 22,922 20,289 − 2,856 3,699 2003143,911 − 10,983 27,384 427 − 38,794 119,651 − 12,304 137,333 35,242 31,928 8,669 − 2,702 2004238,114 27,216 11,957 6,251 9,008 177,295 39,661 135,688 33,603 11,169 20,514 3,767 2005
Emerging markets and developing countries
12,846 1,656 − 301 − 9 1,965 7,315 32 3,080 3,875 3,804 401 − 31 2002− 5 − 3,515 − 3,814 − 20 318 10,614 − 51 5,215 − 7,104 − 10,589 3,294 − 6 2003
17,566 − 1,190 109 250 − 1,549 15,867 − 458 9,913 2,889 281 2,367 44 200435,870 − 951 146 279 − 1,376 22,914 369 17,705 13,908 13,850 352 − 27 2005
73

DEUTSCHEBUNDESBANKE U R O S Y S T E M
Balance of paymentsby regionAugust 2006
I Balance of payments of the Federal Republic of Germany
8 Financial transactions with non-residents o(b) Portfolio investment (excluding direct investment) and financial derivatives
Up to end-1998 DM million; from 1999 € million
German investment in foreign securities (increase/capital exports: −) 1
Total Shares 3 Mutual fund shares 4
of which: Money market funds
Balanceof port-folio in-
Year vestment 2 Purchases Sales Balance Purchases Sales Balance Purchases Sales Balance Purchases Sales Balance
All countries
1994 − 52,013 648,450 581,543 − 66,907 74,221 62,234 − 11,987 83,454 61,373 − 22,081 26,584 10,229 − 16,355
1995 49,595 757,954 732,405 − 25,550 61,865 63,592 1,727 83,350 82,175 − 1,175 30,485 29,628 − 8571996 95,013 1,031,023 984,689 − 46,334 122,881 100,911 − 21,970 83,512 79,237 − 4,274 23,718 29,112 5,3941997 2,025 1,586,532 1,430,539 − 155,993 356,051 289,559 − 66,492 101,528 94,668 − 6,860 28,112 30,481 2,3691998 8,971 2,475,913 2,219,737 − 256,176 580,975 459,938 − 121,037 125,588 107,696 − 17,892 31,907 28,295 − 3,6131999 − 9,293 1,625,306 1,447,922 − 177,384 387,937 319,905 − 68,032 81,324 67,238 − 14,086 17,552 17,091 − 461
2000 − 152,446 2,343,908 2,140,369 − 203,539 813,196 710,917 − 102,279 136,274 103,412 − 32,862 20,965 21,822 8572001 32,197 2,690,816 2,566,305 − 124,511 562,829 552,156 − 10,673 127,213 106,947 − 20,266 27,600 22,847 − 4,7532002 66,945 2,499,835 2,436,626 − 63,209 422,776 418,016 − 4,760 144,222 137,134 − 7,088 31,178 28,831 − 2,3472003 70,909 2,658,744 2,617,024 − 41,720 362,256 366,723 4,468 158,280 155,484 − 2,795 43,009 40,910 − 2,0992004 9,476 2,924,329 2,813,737 − 110,592 496,995 500,515 3,520 192,298 181,365 − 10,933 37,805 39,049 1,243
2005 − 13,904 3,151,822 2,940,931 − 210,891 633,248 610,364 − 22,884 249,355 209,492 − 39,864 18,777 18,779 3
Europe
2002 58,015 1,915,293 1,861,003 − 54,290 317,369 312,966 − 4,403 140,664 134,107 − 6,557 30,946 28,829 − 2,1182003 58,814 2,107,155 2,069,777 − 37,377 256,740 266,025 9,284 154,377 151,996 − 2,381 43,007 40,909 − 2,0982004 47,975 2,335,790 2,247,709 − 88,082 340,257 343,272 3,014 175,919 165,636 − 10,283 37,610 38,990 1,3792005 − 7,134 2,571,280 2,389,017 − 182,263 432,476 418,323 − 14,153 221,072 181,502 − 39,571 18,768 18,655 − 112
EU member states (25)
2002 45,728 1,818,848 1,760,790 − 58,058 242,462 236,646 − 5,816 140,104 133,474 − 6,629 30,792 28,673 − 2,1192003 33,537 2,007,204 1,968,491 − 38,713 201,453 209,209 7,756 153,503 150,834 − 2,669 42,899 40,801 − 2,0982004 25,010 2,180,103 2,090,855 − 89,248 232,151 235,238 3,088 174,813 164,466 − 10,347 37,508 38,886 1,3782005 − 13,814 2,429,217 2,253,790 − 175,428 346,724 332,780 − 13,944 218,837 179,402 − 39,435 18,299 18,190 − 109
Euro-area member states
2002 − 258,558 1,592,172 1,541,362 − 50,810 198,239 195,534 − 2,705 138,411 132,407 − 6,004 30,746 28,667 − 2,0792003 − 246,484 1,791,895 1,759,307 − 32,589 174,115 177,411 3,296 152,448 150,042 − 2,406 42,743 40,749 − 1,9942004 − 281,141 1,905,155 1,830,595 − 74,560 197,412 200,566 3,154 173,437 163,724 − 9,713 37,073 38,885 1,8122005 − 335,888 2,122,831 1,973,656 − 149,175 292,908 282,392 − 10,516 217,093 178,025 − 39,068 17,814 17,989 175
of which: Belgium
2002 − 158,869 116,724 114,393 − 2,331 3,618 3,789 171 9 8 − 1 0 1 02003 − 217,918 94,555 95,464 910 3,890 3,693 − 196 11 8 − 3 1 0 − 02004 − 214,305 63,068 65,368 2,300 5,171 4,841 − 330 10 7 − 3 − 1 12005 − 214,329 89,565 88,638 − 927 10,439 9,694 − 745 29 14 − 15 − − −
Finland
2002 − 2,932 49,122 46,444 − 2,679 27,376 25,296 − 2,080 − − − − − −2003 − 1,035 49,121 47,092 − 2,030 17,392 17,786 394 − − − − − −2004 334 55,539 54,317 − 1,223 16,562 16,570 8 49 39 − 10 − − −2005 212 65,208 64,363 − 844 18,922 19,402 480 55 32 − 24 1 − − 1
France
2002 4,910 379,796 369,853 − 9,943 84,199 86,137 1,939 14,349 13,223 − 1,126 4,964 3,833 − 1,1312003 55,593 445,386 437,322 − 8,063 74,381 76,025 1,644 18,110 17,336 − 773 16,401 15,652 − 7492004 76,241 460,483 465,252 4,769 74,436 79,596 5,161 23,367 22,527 − 840 21,837 21,166 − 6712005 37,325 454,149 437,921 − 16,228 96,269 93,740 − 2,529 7,673 4,779 − 2,895 4,013 3,208 − 805
Greece
2002 − 1,182 47,895 46,405 − 1,491 378 265 − 113 0 0 − 0 0 − − 02003 − 529 72,358 69,777 − 2,580 577 757 179 − − − − − −2004 − 2,230 141,310 136,714 − 4,596 1,297 861 − 435 0 0 0 − − −2005 − 5,333 117,180 109,472 − 7,707 1,833 1,698 − 135 0 0 0 − − −
o For the classification of countries into groups of countries, see list of coun- debtor (issuer). — 2 Excluding financial derivatives. — 3 Including participa-tries on pp 104−105. — 1 Regional attribution to the country of the foreign tion rights. — 4 From 1991 including retained profits.— 5 Balance
74
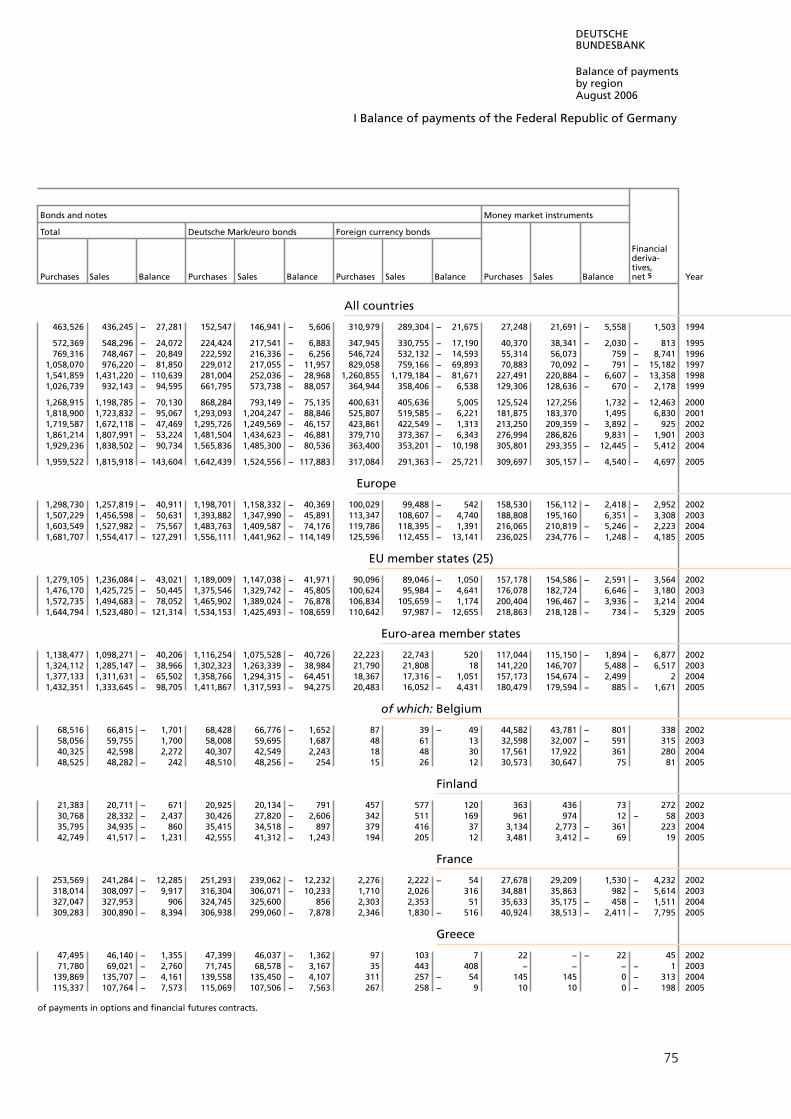
DEUTSCHEBUNDESBANK
Balance of paymentsby regionAugust 2006
I Balance of payments of the Federal Republic of Germany
Bonds and notes Money market instruments
Total Deutsche Mark/euro bonds Foreign currency bonds
Financial deriva- tives,
Purchases Sales Balance Purchases Sales Balance Purchases Sales Balance Purchases Sales Balance net 5 Year
All countries
463,526 436,245 − 27,281 152,547 146,941 − 5,606 310,979 289,304 − 21,675 27,248 21,691 − 5,558 1,503 1994
572,369 548,296 − 24,072 224,424 217,541 − 6,883 347,945 330,755 − 17,190 40,370 38,341 − 2,030 − 813 1995769,316 748,467 − 20,849 222,592 216,336 − 6,256 546,724 532,132 − 14,593 55,314 56,073 759 − 8,741 1996
1,058,070 976,220 − 81,850 229,012 217,055 − 11,957 829,058 759,166 − 69,893 70,883 70,092 − 791 − 15,182 19971,541,859 1,431,220 − 110,639 281,004 252,036 − 28,968 1,260,855 1,179,184 − 81,671 227,491 220,884 − 6,607 − 13,358 19981,026,739 932,143 − 94,595 661,795 573,738 − 88,057 364,944 358,406 − 6,538 129,306 128,636 − 670 − 2,178 1999
1,268,915 1,198,785 − 70,130 868,284 793,149 − 75,135 400,631 405,636 5,005 125,524 127,256 1,732 − 12,463 20001,818,900 1,723,832 − 95,067 1,293,093 1,204,247 − 88,846 525,807 519,585 − 6,221 181,875 183,370 1,495 6,830 20011,719,587 1,672,118 − 47,469 1,295,726 1,249,569 − 46,157 423,861 422,549 − 1,313 213,250 209,359 − 3,892 − 925 20021,861,214 1,807,991 − 53,224 1,481,504 1,434,623 − 46,881 379,710 373,367 − 6,343 276,994 286,826 9,831 − 1,901 20031,929,236 1,838,502 − 90,734 1,565,836 1,485,300 − 80,536 363,400 353,201 − 10,198 305,801 293,355 − 12,445 − 5,412 2004
1,959,522 1,815,918 − 143,604 1,642,439 1,524,556 − 117,883 317,084 291,363 − 25,721 309,697 305,157 − 4,540 − 4,697 2005
Europe
1,298,730 1,257,819 − 40,911 1,198,701 1,158,332 − 40,369 100,029 99,488 − 542 158,530 156,112 − 2,418 − 2,952 20021,507,229 1,456,598 − 50,631 1,393,882 1,347,990 − 45,891 113,347 108,607 − 4,740 188,808 195,160 6,351 − 3,308 20031,603,549 1,527,982 − 75,567 1,483,763 1,409,587 − 74,176 119,786 118,395 − 1,391 216,065 210,819 − 5,246 − 2,223 20041,681,707 1,554,417 − 127,291 1,556,111 1,441,962 − 114,149 125,596 112,455 − 13,141 236,025 234,776 − 1,248 − 4,185 2005
EU member states (25)
1,279,105 1,236,084 − 43,021 1,189,009 1,147,038 − 41,971 90,096 89,046 − 1,050 157,178 154,586 − 2,591 − 3,564 20021,476,170 1,425,725 − 50,445 1,375,546 1,329,742 − 45,805 100,624 95,984 − 4,641 176,078 182,724 6,646 − 3,180 20031,572,735 1,494,683 − 78,052 1,465,902 1,389,024 − 76,878 106,834 105,659 − 1,174 200,404 196,467 − 3,936 − 3,214 20041,644,794 1,523,480 − 121,314 1,534,153 1,425,493 − 108,659 110,642 97,987 − 12,655 218,863 218,128 − 734 − 5,329 2005
Euro-area member states
1,138,477 1,098,271 − 40,206 1,116,254 1,075,528 − 40,726 22,223 22,743 520 117,044 115,150 − 1,894 − 6,877 20021,324,112 1,285,147 − 38,966 1,302,323 1,263,339 − 38,984 21,790 21,808 18 141,220 146,707 5,488 − 6,517 20031,377,133 1,311,631 − 65,502 1,358,766 1,294,315 − 64,451 18,367 17,316 − 1,051 157,173 154,674 − 2,499 2 20041,432,351 1,333,645 − 98,705 1,411,867 1,317,593 − 94,275 20,483 16,052 − 4,431 180,479 179,594 − 885 − 1,671 2005
of which: Belgium
68,516 66,815 − 1,701 68,428 66,776 − 1,652 87 39 − 49 44,582 43,781 − 801 338 200258,056 59,755 1,700 58,008 59,695 1,687 48 61 13 32,598 32,007 − 591 315 200340,325 42,598 2,272 40,307 42,549 2,243 18 48 30 17,561 17,922 361 280 200448,525 48,282 − 242 48,510 48,256 − 254 15 26 12 30,573 30,647 75 81 2005
Finland
21,383 20,711 − 671 20,925 20,134 − 791 457 577 120 363 436 73 272 200230,768 28,332 − 2,437 30,426 27,820 − 2,606 342 511 169 961 974 12 − 58 200335,795 34,935 − 860 35,415 34,518 − 897 379 416 37 3,134 2,773 − 361 223 200442,749 41,517 − 1,231 42,555 41,312 − 1,243 194 205 12 3,481 3,412 − 69 19 2005
France
253,569 241,284 − 12,285 251,293 239,062 − 12,232 2,276 2,222 − 54 27,678 29,209 1,530 − 4,232 2002318,014 308,097 − 9,917 316,304 306,071 − 10,233 1,710 2,026 316 34,881 35,863 982 − 5,614 2003327,047 327,953 906 324,745 325,600 856 2,303 2,353 51 35,633 35,175 − 458 − 1,511 2004309,283 300,890 − 8,394 306,938 299,060 − 7,878 2,346 1,830 − 516 40,924 38,513 − 2,411 − 7,795 2005
Greece
47,495 46,140 − 1,355 47,399 46,037 − 1,362 97 103 7 22 − − 22 45 200271,780 69,021 − 2,760 71,745 68,578 − 3,167 35 443 408 − − − − 1 2003
139,869 135,707 − 4,161 139,558 135,450 − 4,107 311 257 − 54 145 145 0 − 313 2004115,337 107,764 − 7,573 115,069 107,506 − 7,563 267 258 − 9 10 10 0 − 198 2005
of payments in options and financial futures contracts.
75
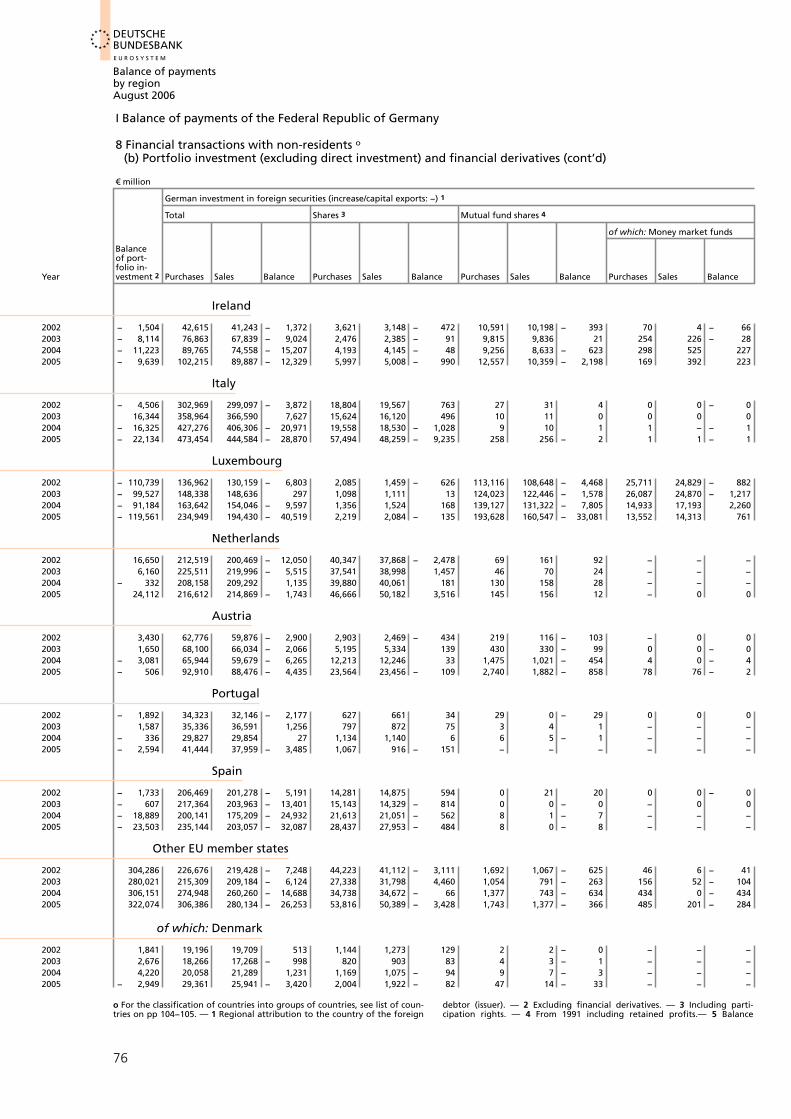
DEUTSCHEBUNDESBANKE U R O S Y S T E M
Balance of paymentsby regionAugust 2006
I Balance of payments of the Federal Republic of Germany
8 Financial transactions with non-residents o(b) Portfolio investment (excluding direct investment) and financial derivatives (cont’d)
€ million
German investment in foreign securities (increase/capital exports: −) 1
Total Shares 3 Mutual fund shares 4
of which: Money market funds
Balanceof port-folio in-
Year vestment 2 Purchases Sales Balance Purchases Sales Balance Purchases Sales Balance Purchases Sales Balance
Ireland
2002 − 1,504 42,615 41,243 − 1,372 3,621 3,148 − 472 10,591 10,198 − 393 70 4 − 662003 − 8,114 76,863 67,839 − 9,024 2,476 2,385 − 91 9,815 9,836 21 254 226 − 282004 − 11,223 89,765 74,558 − 15,207 4,193 4,145 − 48 9,256 8,633 − 623 298 525 2272005 − 9,639 102,215 89,887 − 12,329 5,997 5,008 − 990 12,557 10,359 − 2,198 169 392 223
Italy
2002 − 4,506 302,969 299,097 − 3,872 18,804 19,567 763 27 31 4 0 0 − 02003 16,344 358,964 366,590 7,627 15,624 16,120 496 10 11 0 0 0 02004 − 16,325 427,276 406,306 − 20,971 19,558 18,530 − 1,028 9 10 1 1 − − 12005 − 22,134 473,454 444,584 − 28,870 57,494 48,259 − 9,235 258 256 − 2 1 1 − 1
Luxembourg
2002 − 110,739 136,962 130,159 − 6,803 2,085 1,459 − 626 113,116 108,648 − 4,468 25,711 24,829 − 8822003 − 99,527 148,338 148,636 297 1,098 1,111 13 124,023 122,446 − 1,578 26,087 24,870 − 1,2172004 − 91,184 163,642 154,046 − 9,597 1,356 1,524 168 139,127 131,322 − 7,805 14,933 17,193 2,2602005 − 119,561 234,949 194,430 − 40,519 2,219 2,084 − 135 193,628 160,547 − 33,081 13,552 14,313 761
Netherlands
2002 16,650 212,519 200,469 − 12,050 40,347 37,868 − 2,478 69 161 92 − − −2003 6,160 225,511 219,996 − 5,515 37,541 38,998 1,457 46 70 24 − − −2004 − 332 208,158 209,292 1,135 39,880 40,061 181 130 158 28 − − −2005 24,112 216,612 214,869 − 1,743 46,666 50,182 3,516 145 156 12 − 0 0
Austria
2002 3,430 62,776 59,876 − 2,900 2,903 2,469 − 434 219 116 − 103 − 0 02003 1,650 68,100 66,034 − 2,066 5,195 5,334 139 430 330 − 99 0 0 − 02004 − 3,081 65,944 59,679 − 6,265 12,213 12,246 33 1,475 1,021 − 454 4 0 − 42005 − 506 92,910 88,476 − 4,435 23,564 23,456 − 109 2,740 1,882 − 858 78 76 − 2
Portugal
2002 − 1,892 34,323 32,146 − 2,177 627 661 34 29 0 − 29 0 0 02003 1,587 35,336 36,591 1,256 797 872 75 3 4 1 − − −2004 − 336 29,827 29,854 27 1,134 1,140 6 6 5 − 1 − − −2005 − 2,594 41,444 37,959 − 3,485 1,067 916 − 151 − − − − − −
Spain
2002 − 1,733 206,469 201,278 − 5,191 14,281 14,875 594 0 21 20 0 0 − 02003 − 607 217,364 203,963 − 13,401 15,143 14,329 − 814 0 0 − 0 − 0 02004 − 18,889 200,141 175,209 − 24,932 21,613 21,051 − 562 8 1 − 7 − − −2005 − 23,503 235,144 203,057 − 32,087 28,437 27,953 − 484 8 0 − 8 − − −
Other EU member states
2002 304,286 226,676 219,428 − 7,248 44,223 41,112 − 3,111 1,692 1,067 − 625 46 6 − 412003 280,021 215,309 209,184 − 6,124 27,338 31,798 4,460 1,054 791 − 263 156 52 − 1042004 306,151 274,948 260,260 − 14,688 34,738 34,672 − 66 1,377 743 − 634 434 0 − 4342005 322,074 306,386 280,134 − 26,253 53,816 50,389 − 3,428 1,743 1,377 − 366 485 201 − 284
of which: Denmark
2002 1,841 19,196 19,709 513 1,144 1,273 129 2 2 − 0 − − −2003 2,676 18,266 17,268 − 998 820 903 83 4 3 − 1 − − −2004 4,220 20,058 21,289 1,231 1,169 1,075 − 94 9 7 − 3 − − −2005 − 2,949 29,361 25,941 − 3,420 2,004 1,922 − 82 47 14 − 33 − − −
o For the classification of countries into groups of countries, see list of coun- debtor (issuer). — 2 Excluding financial derivatives. — 3 Including parti-tries on pp 104−105. — 1 Regional attribution to the country of the foreign cipation rights. — 4 From 1991 including retained profits.— 5 Balance
76

DEUTSCHEBUNDESBANK
Balance of paymentsby regionAugust 2006
I Balance of payments of the Federal Republic of Germany
Bonds and notes Money market instruments
Total Deutsche Mark/euro bonds Foreign currency bonds
Financial deriva- tives,
Purchases Sales Balance Purchases Sales Balance Purchases Sales Balance Purchases Sales Balance net 5 Year
Ireland
18,554 16,705 − 1,850 17,788 15,390 − 2,398 766 1,315 548 9,849 11,192 1,343 − 127 200245,941 37,779 − 8,162 44,893 36,657 − 8,236 1,048 1,123 74 18,631 17,839 − 791 − 65 200352,636 39,884 − 12,752 50,754 37,928 − 12,826 1,882 1,957 75 23,680 21,896 − 1,784 247 200454,950 45,635 − 9,316 51,144 43,241 − 7,902 3,807 2,393 − 1,413 28,711 28,886 175 570 2005
Italy
269,535 269,138 − 397 265,796 265,621 − 175 3,739 3,517 − 222 14,602 10,361 − 4,241 538 2002332,627 335,584 2,958 328,206 331,316 3,110 4,421 4,268 − 153 10,702 14,875 4,173 316 2003375,636 356,647 − 18,990 371,663 352,715 − 18,948 3,974 3,931 − 42 32,073 31,119 − 954 158 2004379,848 358,963 − 20,885 377,014 356,302 − 20,712 2,834 2,661 − 173 35,853 37,105 1,252 6,079 2005
Luxembourg
18,341 16,621 − 1,720 17,007 15,226 − 1,781 1,334 1,395 61 3,420 3,431 11 690 200217,860 19,601 1,740 15,741 17,631 1,890 2,119 1,969 − 150 5,357 5,479 122 − 269 200317,583 15,020 − 2,563 14,837 13,182 − 1,656 2,746 1,838 − 908 5,576 6,180 604 757 200430,319 22,957 − 7,362 26,909 20,360 − 6,549 3,410 2,597 − 813 8,783 8,841 58 120 2005
Netherlands
156,848 147,525 − 9,323 149,623 140,224 − 9,399 7,225 7,301 77 15,256 14,915 − 341 − 4,157 2002152,271 143,374 − 8,897 146,550 138,144 − 8,407 5,721 5,230 − 491 35,653 37,554 1,901 − 506 2003131,800 133,108 1,308 127,623 128,958 1,335 4,176 4,149 − 27 36,348 35,965 − 383 820 2004142,987 137,556 − 5,431 138,327 133,866 − 4,462 4,659 3,690 − 969 26,815 26,975 160 80 2005
Austria
58,936 56,227 − 2,709 53,858 51,353 − 2,505 5,078 4,874 − 204 718 1,065 347 − 674 200261,300 59,244 − 2,056 56,385 54,488 − 1,897 4,915 4,756 − 159 1,176 1,126 − 50 − 579 200351,014 44,903 − 6,112 49,215 43,499 − 5,716 1,799 1,403 − 396 1,242 1,509 267 − 339 200466,015 62,367 − 3,648 64,180 61,103 − 3,076 1,835 1,264 − 571 591 771 180 − 176 2005
Portugal
33,262 31,002 − 2,260 33,015 30,746 − 2,269 247 256 9 404 483 79 − 170 200233,388 34,834 1,446 33,149 34,561 1,412 239 273 34 1,148 881 − 267 63 200327,122 26,939 − 183 26,930 26,761 − 169 193 179 − 14 1,565 1,770 205 − 136 200435,885 32,835 − 3,050 35,840 32,750 − 3,090 45 85 40 4,492 4,208 − 284 138 2005
Spain
192,036 186,104 − 5,933 191,121 184,960 − 6,162 915 1,144 229 152 279 127 598 2002202,107 189,525 − 12,582 200,916 188,378 − 12,537 1,192 1,147 − 45 113 109 − 4 − 120 2003178,305 153,937 − 24,368 177,720 153,154 − 24,565 586 783 197 215 221 5 − 184 2004206,452 174,879 − 31,574 205,381 173,836 − 31,545 1,072 1,042 − 29 246 225 − 21 − 589 2005
Other EU member states
140,628 137,813 − 2,815 72,755 71,510 − 1,245 67,873 66,303 − 1,570 40,133 39,436 − 697 3,313 2002152,058 140,578 − 11,480 73,223 66,403 − 6,821 78,835 74,176 − 4,659 34,859 36,017 1,158 3,337 2003195,603 183,052 − 12,550 107,136 94,709 − 12,427 88,467 88,343 − 123 43,231 41,793 − 1,438 − 3,216 2004212,444 189,834 − 22,609 122,285 107,900 − 14,385 90,158 81,934 − 8,224 38,383 38,534 151 − 3,658 2005
of which: Denmark
17,191 17,637 446 4,392 3,592 − 800 12,799 14,044 1,246 860 798 − 62 13 200216,992 15,865 − 1,127 4,895 3,826 − 1,069 12,097 12,039 − 58 450 498 48 42 200318,323 19,630 1,307 4,916 4,540 − 377 13,406 15,090 1,684 558 577 20 33 200425,431 22,142 − 3,289 9,050 7,251 − 1,799 16,381 14,891 − 1,490 1,878 1,863 − 15 − 182 2005
of payments in options and financial futures contracts.
77
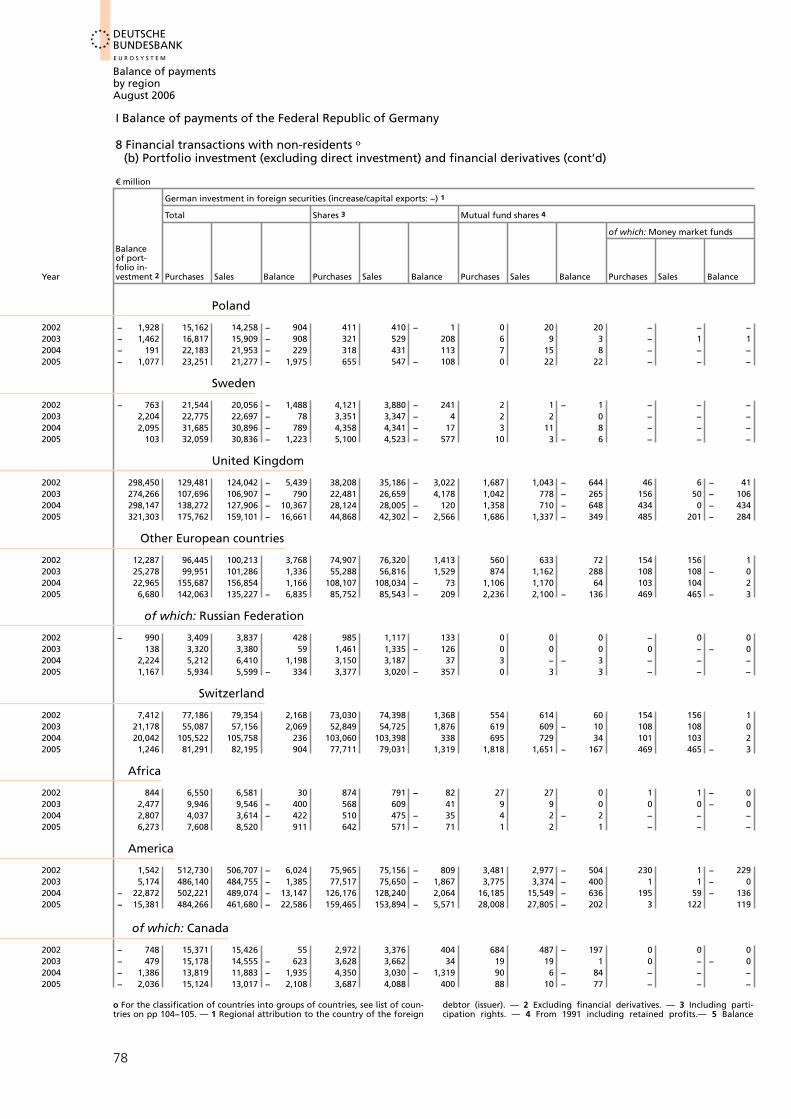
DEUTSCHEBUNDESBANKE U R O S Y S T E M
Balance of paymentsby regionAugust 2006
I Balance of payments of the Federal Republic of Germany
8 Financial transactions with non-residents o(b) Portfolio investment (excluding direct investment) and financial derivatives (cont’d)
€ million
German investment in foreign securities (increase/capital exports: −) 1
Total Shares 3 Mutual fund shares 4
of which: Money market funds
Balanceof port-folio in-
Year vestment 2 Purchases Sales Balance Purchases Sales Balance Purchases Sales Balance Purchases Sales Balance
Poland
2002 − 1,928 15,162 14,258 − 904 411 410 − 1 0 20 20 − − −2003 − 1,462 16,817 15,909 − 908 321 529 208 6 9 3 − 1 12004 − 191 22,183 21,953 − 229 318 431 113 7 15 8 − − −2005 − 1,077 23,251 21,277 − 1,975 655 547 − 108 0 22 22 − − −
Sweden
2002 − 763 21,544 20,056 − 1,488 4,121 3,880 − 241 2 1 − 1 − − −2003 2,204 22,775 22,697 − 78 3,351 3,347 − 4 2 2 0 − − −2004 2,095 31,685 30,896 − 789 4,358 4,341 − 17 3 11 8 − − −2005 103 32,059 30,836 − 1,223 5,100 4,523 − 577 10 3 − 6 − − −
United Kingdom
2002 298,450 129,481 124,042 − 5,439 38,208 35,186 − 3,022 1,687 1,043 − 644 46 6 − 412003 274,266 107,696 106,907 − 790 22,481 26,659 4,178 1,042 778 − 265 156 50 − 1062004 298,147 138,272 127,906 − 10,367 28,124 28,005 − 120 1,358 710 − 648 434 0 − 4342005 321,303 175,762 159,101 − 16,661 44,868 42,302 − 2,566 1,686 1,337 − 349 485 201 − 284
Other European countries
2002 12,287 96,445 100,213 3,768 74,907 76,320 1,413 560 633 72 154 156 12003 25,278 99,951 101,286 1,336 55,288 56,816 1,529 874 1,162 288 108 108 − 02004 22,965 155,687 156,854 1,166 108,107 108,034 − 73 1,106 1,170 64 103 104 22005 6,680 142,063 135,227 − 6,835 85,752 85,543 − 209 2,236 2,100 − 136 469 465 − 3
of which: Russian Federation
2002 − 990 3,409 3,837 428 985 1,117 133 0 0 0 − 0 02003 138 3,320 3,380 59 1,461 1,335 − 126 0 0 0 0 − − 02004 2,224 5,212 6,410 1,198 3,150 3,187 37 3 − − 3 − − −2005 1,167 5,934 5,599 − 334 3,377 3,020 − 357 0 3 3 − − −
Switzerland
2002 7,412 77,186 79,354 2,168 73,030 74,398 1,368 554 614 60 154 156 12003 21,178 55,087 57,156 2,069 52,849 54,725 1,876 619 609 − 10 108 108 02004 20,042 105,522 105,758 236 103,060 103,398 338 695 729 34 101 103 22005 1,246 81,291 82,195 904 77,711 79,031 1,319 1,818 1,651 − 167 469 465 − 3
Africa
2002 844 6,550 6,581 30 874 791 − 82 27 27 0 1 1 − 02003 2,477 9,946 9,546 − 400 568 609 41 9 9 0 0 0 − 02004 2,807 4,037 3,614 − 422 510 475 − 35 4 2 − 2 − − −2005 6,273 7,608 8,520 911 642 571 − 71 1 2 1 − − −
America
2002 1,542 512,730 506,707 − 6,024 75,965 75,156 − 809 3,481 2,977 − 504 230 1 − 2292003 5,174 486,140 484,755 − 1,385 77,517 75,650 − 1,867 3,775 3,374 − 400 1 1 − 02004 − 22,872 502,221 489,074 − 13,147 126,176 128,240 2,064 16,185 15,549 − 636 195 59 − 1362005 − 15,381 484,266 461,680 − 22,586 159,465 153,894 − 5,571 28,008 27,805 − 202 3 122 119
of which: Canada
2002 − 748 15,371 15,426 55 2,972 3,376 404 684 487 − 197 0 0 02003 − 479 15,178 14,555 − 623 3,628 3,662 34 19 19 1 0 − − 02004 − 1,386 13,819 11,883 − 1,935 4,350 3,030 − 1,319 90 6 − 84 − − −2005 − 2,036 15,124 13,017 − 2,108 3,687 4,088 400 88 10 − 77 − − −
o For the classification of countries into groups of countries, see list of coun- debtor (issuer). — 2 Excluding financial derivatives. — 3 Including parti-tries on pp 104−105. — 1 Regional attribution to the country of the foreign cipation rights. — 4 From 1991 including retained profits.— 5 Balance
78

DEUTSCHEBUNDESBANK
Balance of paymentsby regionAugust 2006
I Balance of payments of the Federal Republic of Germany
Bonds and notes Money market instruments
Total Deutsche Mark/euro bonds Foreign currency bonds
Financial deriva- tives,
Purchases Sales Balance Purchases Sales Balance Purchases Sales Balance Purchases Sales Balance net 5 Year
Poland
14,735 13,813 − 922 891 684 − 207 13,844 13,129 − 715 16 14 − 2 56 200216,445 15,326 − 1,119 2,406 1,909 − 497 14,040 13,417 − 622 45 45 0 41 200321,853 21,502 − 351 3,449 3,372 − 77 18,404 18,130 − 274 6 6 0 63 200422,565 20,682 − 1,883 7,356 5,923 − 1,433 15,209 14,759 − 450 31 25 − 6 29 2005
Sweden
16,384 15,172 − 1,212 4,932 4,146 − 787 11,452 11,027 − 425 1,037 1,002 − 35 24 200218,474 18,302 − 172 5,444 5,073 − 371 13,030 13,229 199 949 1,046 97 86 200325,385 24,656 − 728 7,414 6,622 − 793 17,970 18,035 64 1,940 1,888 − 52 76 200423,520 23,369 − 151 7,689 7,018 − 671 15,831 16,352 520 3,429 2,940 − 488 − 684 2005
United Kingdom
52,208 51,260 − 948 35,495 35,807 312 16,712 15,453 − 1,260 37,379 36,553 − 826 3,336 200252,803 46,891 − 5,912 32,776 29,197 − 3,580 20,027 17,695 − 2,332 31,370 32,579 1,209 3,793 200370,129 61,907 − 8,222 49,381 42,162 − 7,219 20,748 19,744 − 1,003 38,662 37,284 − 1,377 − 3,026 200498,361 84,183 − 14,178 70,545 61,991 − 8,554 27,816 22,191 − 5,625 30,847 31,279 432 − 2,443 2005
Other European countries
19,625 21,735 2,110 9,692 11,294 1,602 9,933 10,441 508 1,352 1,525 173 612 200231,059 30,873 − 186 18,336 18,249 − 87 12,723 12,624 − 100 12,730 12,436 − 295 − 128 200330,813 33,299 2,485 17,861 20,563 2,701 12,952 12,736 − 216 15,661 14,352 − 1,310 990 200436,913 30,937 − 5,976 21,959 16,469 − 5,490 14,954 14,468 − 486 17,162 16,648 − 514 1,143 2005
of which: Russian Federation
2,419 2,720 300 394 469 75 2,025 2,251 225 5 − − 5 156 20021,859 2,045 185 253 339 86 1,606 1,706 100 − − − − 2 20032,059 3,223 1,164 201 1,461 1,259 1,858 1,762 − 96 − − − 2 20042,556 2,576 19 18 265 247 2,538 2,311 − 228 1 0 − 1 − 5 2005
Switzerland
2,798 3,387 588 869 1,097 228 1,930 2,289 360 803 956 152 454 20021,103 1,231 128 236 181 − 56 867 1,051 184 516 591 75 − 21 20031,498 1,417 − 81 171 149 − 22 1,327 1,268 − 59 269 213 − 56 1,039 20041,274 1,040 − 235 224 131 − 93 1,050 909 − 141 488 474 − 14 885 2005
Africa
5,650 5,762 112 240 337 97 5,410 5,425 15 − − − 9 20029,369 8,928 − 442 1,283 856 − 426 8,087 8,071 − 15 − − − − 28 20033,523 3,138 − 385 736 474 − 262 2,787 2,664 − 124 − − − − 61 20046,963 7,946 983 724 648 − 76 6,240 7,298 1,058 2 1 − 2 − 35 2005
America
379,992 376,913 − 3,079 92,603 85,684 − 6,919 287,390 291,229 3,840 53,292 51,660 − 1,632 2,281 2002318,961 316,400 − 2,561 81,830 81,403 − 427 237,131 234,997 − 2,134 85,887 89,330 3,443 1,654 2003293,541 281,577 − 11,964 73,438 69,194 − 4,243 220,103 212,382 − 7,721 66,319 63,708 − 2,611 − 3,501 2004245,067 230,302 − 14,765 77,138 75,094 − 2,044 167,929 155,208 − 12,721 51,727 49,680 − 2,047 − 1,628 2005
of which: Canada
11,498 11,280 − 217 2,799 2,778 − 21 8,699 8,502 − 197 218 284 66 1,197 200210,983 10,348 − 635 2,599 2,327 − 272 8,384 8,021 − 364 549 525 − 23 243 20038,947 8,409 − 537 2,683 2,495 − 188 6,264 5,914 − 349 432 437 5 49 2004
10,824 8,411 − 2,413 6,458 4,781 − 1,677 4,366 3,630 − 737 526 508 − 18 122 2005
of payments in options and financial futures contracts.
79

DEUTSCHEBUNDESBANKE U R O S Y S T E M
Balance of paymentsby regionAugust 2006
I Balance of payments of the Federal Republic of Germany
8 Financial transactions with non-residents o(b) Portfolio investment (excluding direct investment) and financial derivatives (cont’d)
€ million
German investment in foreign securities (increase/capital exports: −) 1
Total Shares 3 Mutual fund shares 4
of which: Money market funds
Balanceof port-folio in-
Year vestment 2 Purchases Sales Balance Purchases Sales Balance Purchases Sales Balance Purchases Sales Balance
United States
2002 5,626 460,910 458,054 − 2,857 70,699 69,800 − 899 2,265 2,037 − 229 230 1 − 2302003 − 785 428,227 421,618 − 6,609 71,555 69,882 − 1,673 2,995 2,757 − 238 1 1 − 02004 − 17,680 448,188 442,351 − 5,837 117,591 121,008 3,417 15,401 15,122 − 279 124 19 − 1062005 − 13,091 428,197 410,832 − 17,365 149,105 144,051 − 5,054 26,823 27,439 615 1 116 115
Asia
2002 11,333 45,585 41,368 − 4,217 26,406 26,762 356 49 21 − 28 0 1 12003 7,020 39,295 36,880 − 2,415 26,163 22,847 − 3,316 104 91 − 13 0 0 02004 − 2,341 62,261 55,190 − 7,071 28,632 27,264 − 1,368 185 173 − 12 0 − − 02005 5,028 67,921 63,002 − 4,919 38,398 35,625 − 2,774 261 172 − 89 6 2 − 4
of which: Japan
2002 4,647 37,076 33,073 − 4,003 20,246 20,889 643 40 16 − 24 − − −2003 2,528 32,022 30,357 − 1,665 20,548 17,884 − 2,665 101 91 − 11 − − −2004 − 9,572 52,491 46,126 − 6,364 22,436 21,111 − 1,325 164 164 − 0 − − −2005 − 4,793 54,139 50,753 − 3,386 30,090 27,490 − 2,601 187 160 − 26 − − −
Emerging markets in South-East Asia
2002 4,834 7,304 6,981 − 323 5,443 5,177 − 266 5 3 − 1 0 0 02003 3,216 5,886 5,378 − 508 4,586 4,127 − 460 1 0 − 1 − 0 02004 6,241 7,240 6,911 − 329 4,817 4,908 92 21 9 − 11 0 − − 02005 2,598 9,753 9,272 − 481 6,521 6,655 134 66 9 − 56 5 − − 5
Oceania and polar regions
2002 581 8,128 8,502 374 2,161 2,338 177 2 3 1 − − −2003 − 182 9,283 8,923 − 360 1,267 1,591 324 15 14 − 1 − − −2004 − 745 15,554 13,581 − 1,973 1,419 1,264 − 154 5 5 0 − − −2005 709 17,718 15,861 − 1,858 2,267 1,952 − 315 14 11 − 2 − − −
International organisations
2002 − 5,369 11,548 12,465 918 1 2 1 − − − − − −2003 − 2,393 6,925 7,142 217 0 1 1 0 − − 0 − − −2004 − 15,348 4,466 4,569 103 1 − − 1 − − − − − −2005 − 3,398 3,029 2,852 − 177 − − − − − − − − −
Unidentified countries
2002 − − − − − − − − − − − − −2003 − − − − − − − − − − − − −2004 − − − − − − − − − − − − −2005 − − − − − − − − − − − − −
Memo item: Industrial countries
2002 68,154 2,430,034 2,369,061 − 60,973 412,299 408,137 − 4,162 143,652 136,639 − 7,013 31,176 28,829 − 2,3472003 58,108 2,584,692 2,538,175 − 46,517 352,201 357,638 5,437 157,507 154,875 − 2,632 43,009 40,910 − 2,0992004 13,920 2,857,544 2,751,813 − 105,731 482,795 486,387 3,592 191,576 180,933 − 10,643 37,735 39,009 1,2742005 − 29,439 3,077,348 2,870,614 − 206,733 614,039 592,694 − 21,345 248,183 209,119 − 39,064 18,768 18,771 3
Emerging markets and developing countries
2002 4,160 58,253 55,099 − 3,154 10,475 9,876 − 599 569 494 − 75 2 2 12003 15,194 67,127 71,706 4,580 10,055 9,084 − 970 773 609 − 163 0 0 − 02004 10,903 62,319 57,355 − 4,964 14,199 14,128 − 71 722 432 − 290 70 40 − 302005 18,933 71,445 67,465 − 3,980 19,209 17,670 − 1,538 1,172 373 − 799 8 8 − 0
o For the classification of countries into groups of countries, see list of coun- debtor (issuer). — 2 Excluding financial derivatives. — 3 Including parti-tries on pp 104−105. — 1 Regional attribution to the country of the foreign cipation rights. — 4 From 1991 including retained profits.— 5 Balance
80

DEUTSCHEBUNDESBANK
Balance of paymentsby regionAugust 2006
I Balance of payments of the Federal Republic of Germany
Bonds and notes Money market instruments
Total Deutsche Mark/euro bonds Foreign currency bonds
Financial deriva- tives,
Purchases Sales Balance Purchases Sales Balance Purchases Sales Balance Purchases Sales Balance net 5 Year
United States
338,745 338,824 79 71,404 66,119 − 5,286 267,340 272,705 5,365 49,201 47,393 − 1,808 1,426 2002280,643 275,266 − 5,377 62,440 59,544 − 2,896 218,203 215,722 − 2,481 73,035 73,713 678 504 2003259,935 249,586 − 10,349 56,287 52,570 − 3,717 203,647 197,016 − 6,631 55,262 56,635 1,372 − 3,497 2004208,541 197,386 − 11,156 57,049 56,375 − 674 151,492 141,011 − 10,481 43,728 41,957 − 1,771 − 1,488 2005
Asia
19,071 14,545 − 4,526 1,836 2,277 441 17,235 12,268 − 4,967 60 41 − 20 185 200212,901 13,818 917 918 1,426 507 11,983 12,392 409 127 124 − 3 − 439 200315,747 14,003 − 1,743 2,321 1,688 − 634 13,425 12,316 − 1,110 17,697 13,750 − 3,947 − 23 200412,787 11,786 − 1,001 2,824 1,906 − 919 9,963 9,880 − 83 16,474 15,419 − 1,055 671 2005
of which: Japan
16,790 12,167 − 4,622 1,159 1,497 339 15,631 10,670 − 4,961 − 1 1 − 192 200211,372 12,382 1,010 543 1,104 561 10,829 11,278 448 − − − − 339 200313,084 11,791 − 1,293 1,347 911 − 436 11,738 10,881 − 857 16,807 13,061 − 3,746 − 64 20047,856 8,096 240 1,321 809 − 512 6,535 7,286 751 16,006 15,007 − 999 437 2005
Emerging markets in South-East Asia
1,796 1,760 − 36 373 386 13 1,424 1,375 − 49 60 40 − 20 111 20021,180 1,131 − 48 243 228 − 15 936 903 − 33 119 120 1 − 61 20031,552 1,335 − 217 305 260 − 45 1,247 1,075 − 172 851 659 − 192 75 20042,894 2,267 − 628 841 604 − 237 2,054 1,663 − 391 273 341 68 304 2005
Oceania and polar regions
4,636 4,668 32 1,022 939 − 83 3,614 3,729 115 1,330 1,493 163 − 535 20025,829 5,111 − 718 2,180 1,561 − 619 3,650 3,550 − 100 2,172 2,207 36 327 20038,521 7,314 − 1,207 4,930 3,612 − 1,318 3,591 3,701 110 5,610 4,998 − 612 552 20049,983 8,661 − 1,323 5,110 4,368 − 742 4,873 4,293 − 581 5,455 5,237 − 218 497 2005
International organisations
11,508 12,410 902 1,325 2,000 675 10,184 10,410 226 38 53 15 87 20026,925 7,137 212 1,412 1,387 − 25 5,513 5,750 237 − 5 5 − 104 20034,355 4,489 133 648 745 97 3,708 3,744 36 110 80 − 30 − 156 20043,014 2,807 − 207 532 578 46 2,482 2,229 − 253 15 45 30 − 16 2005
Unidentified countries
− − − − − − − − − − − − − 2002− − − − − − − − − − − − − 2 2003− − − − − − − − − − − − − 2004− − − − − − − − − − − − − 2005
Memo item: Industrial countries
1,664,808 1,619,002 − 45,806 1,271,975 1,226,641 − 45,334 392,834 392,362 − 472 209,274 205,282 − 3,992 − 1,189 20021,810,429 1,754,063 − 56,366 1,458,203 1,409,050 − 49,153 352,226 345,013 − 7,213 264,555 271,598 7,043 − 2,572 20031,889,030 1,798,576 − 90,454 1,546,343 1,465,118 − 81,225 342,687 333,458 − 9,229 294,144 285,918 − 8,226 − 5,188 20041,913,387 1,771,317 − 142,071 1,623,581 1,505,439 − 118,143 289,806 265,878 − 23,928 301,738 297,485 − 4,253 − 4,601 2005
Emerging markets and developing countries
43,271 40,705 − 2,565 22,427 20,928 − 1,498 20,844 19,777 − 1,067 3,938 4,023 85 177 200243,860 46,790 2,930 21,890 24,186 2,297 21,970 22,604 633 12,439 15,222 2,783 777 200335,851 35,437 − 414 18,845 19,437 592 17,005 16,000 − 1,006 11,547 7,358 − 4,189 − 68 200443,121 41,795 − 1,326 18,326 18,539 213 24,795 23,256 − 1,539 7,944 7,627 − 317 − 80 2005
of payments in options and financial futures contracts.
81
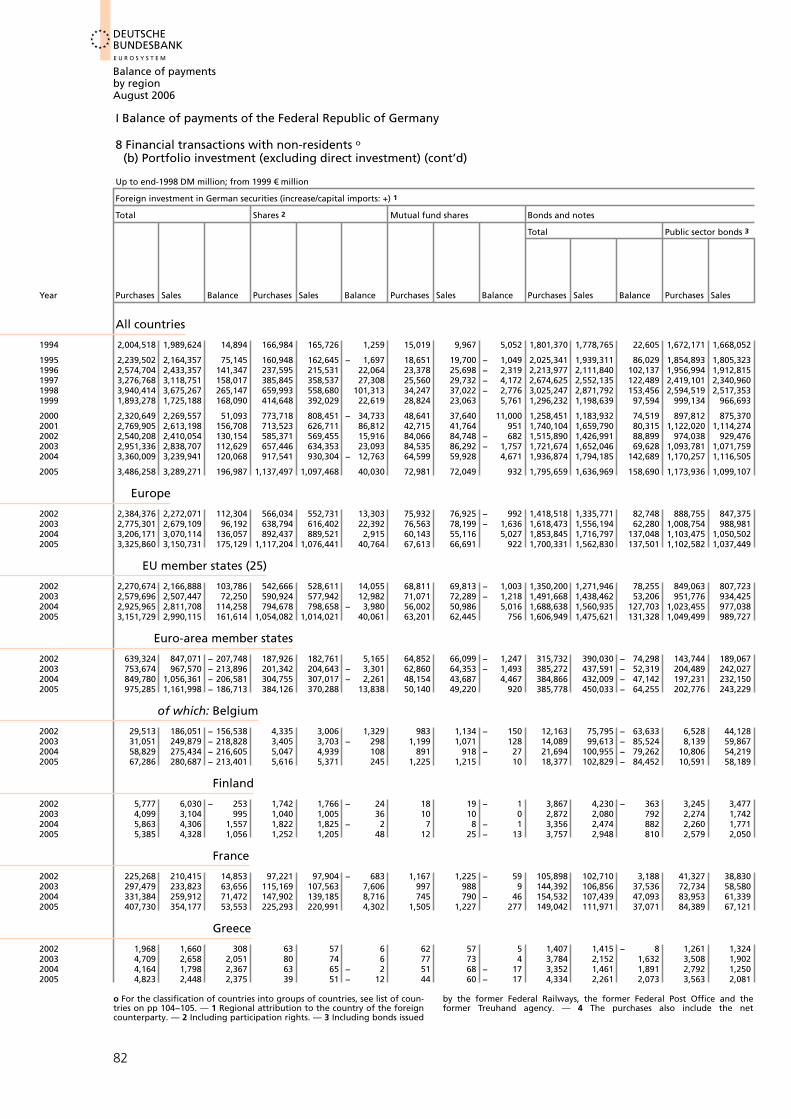
DEUTSCHEBUNDESBANKE U R O S Y S T E M
Balance of paymentsby regionAugust 2006
I Balance of payments of the Federal Republic of Germany
8 Financial transactions with non-residents o(b) Portfolio investment (excluding direct investment) (cont’d)
Up to end-1998 DM million; from 1999 € million
Foreign investment in German securities (increase/capital imports: +) 1
Total Shares 2 Mutual fund shares Bonds and notes
Total Public sector bonds 3
Year Purchases Sales Balance Purchases Sales Balance Purchases Sales Balance Purchases Sales Balance Purchases Sales
All countries
1994 2,004,518 1,989,624 14,894 166,984 165,726 1,259 15,019 9,967 5,052 1,801,370 1,778,765 22,605 1,672,171 1,668,052
1995 2,239,502 2,164,357 75,145 160,948 162,645 − 1,697 18,651 19,700 − 1,049 2,025,341 1,939,311 86,029 1,854,893 1,805,3231996 2,574,704 2,433,357 141,347 237,595 215,531 22,064 23,378 25,698 − 2,319 2,213,977 2,111,840 102,137 1,956,994 1,912,8151997 3,276,768 3,118,751 158,017 385,845 358,537 27,308 25,560 29,732 − 4,172 2,674,625 2,552,135 122,489 2,419,101 2,340,9601998 3,940,414 3,675,267 265,147 659,993 558,680 101,313 34,247 37,022 − 2,776 3,025,247 2,871,792 153,456 2,594,519 2,517,3531999 1,893,278 1,725,188 168,090 414,648 392,029 22,619 28,824 23,063 5,761 1,296,232 1,198,639 97,594 999,134 966,693
2000 2,320,649 2,269,557 51,093 773,718 808,451 − 34,733 48,641 37,640 11,000 1,258,451 1,183,932 74,519 897,812 875,3702001 2,769,905 2,613,198 156,708 713,523 626,711 86,812 42,715 41,764 951 1,740,104 1,659,790 80,315 1,122,020 1,114,2742002 2,540,208 2,410,054 130,154 585,371 569,455 15,916 84,066 84,748 − 682 1,515,890 1,426,991 88,899 974,038 929,4762003 2,951,336 2,838,707 112,629 657,446 634,353 23,093 84,535 86,292 − 1,757 1,721,674 1,652,046 69,628 1,093,781 1,071,7592004 3,360,009 3,239,941 120,068 917,541 930,304 − 12,763 64,599 59,928 4,671 1,936,874 1,794,185 142,689 1,170,257 1,116,505
2005 3,486,258 3,289,271 196,987 1,137,497 1,097,468 40,030 72,981 72,049 932 1,795,659 1,636,969 158,690 1,173,936 1,099,107
Europe
2002 2,384,376 2,272,071 112,304 566,034 552,731 13,303 75,932 76,925 − 992 1,418,518 1,335,771 82,748 888,755 847,3752003 2,775,301 2,679,109 96,192 638,794 616,402 22,392 76,563 78,199 − 1,636 1,618,473 1,556,194 62,280 1,008,754 988,9812004 3,206,171 3,070,114 136,057 892,437 889,521 2,915 60,143 55,116 5,027 1,853,845 1,716,797 137,048 1,103,475 1,050,5022005 3,325,860 3,150,731 175,129 1,117,204 1,076,441 40,764 67,613 66,691 922 1,700,331 1,562,830 137,501 1,102,582 1,037,449
EU member states (25)
2002 2,270,674 2,166,888 103,786 542,666 528,611 14,055 68,811 69,813 − 1,003 1,350,200 1,271,946 78,255 849,063 807,7232003 2,579,696 2,507,447 72,250 590,924 577,942 12,982 71,071 72,289 − 1,218 1,491,668 1,438,462 53,206 951,776 934,4252004 2,925,965 2,811,708 114,258 794,678 798,658 − 3,980 56,002 50,986 5,016 1,688,638 1,560,935 127,703 1,023,455 977,0382005 3,151,729 2,990,115 161,614 1,054,082 1,014,021 40,061 63,201 62,445 756 1,606,949 1,475,621 131,328 1,049,499 989,727
Euro-area member states
2002 639,324 847,071 − 207,748 187,926 182,761 5,165 64,852 66,099 − 1,247 315,732 390,030 − 74,298 143,744 189,0672003 753,674 967,570 − 213,896 201,342 204,643 − 3,301 62,860 64,353 − 1,493 385,272 437,591 − 52,319 204,489 242,0272004 849,780 1,056,361 − 206,581 304,755 307,017 − 2,261 48,154 43,687 4,467 384,866 432,009 − 47,142 197,231 232,1502005 975,285 1,161,998 − 186,713 384,126 370,288 13,838 50,140 49,220 920 385,778 450,033 − 64,255 202,776 243,229
of which: Belgium
2002 29,513 186,051 − 156,538 4,335 3,006 1,329 983 1,134 − 150 12,163 75,795 − 63,633 6,528 44,1282003 31,051 249,879 − 218,828 3,405 3,703 − 298 1,199 1,071 128 14,089 99,613 − 85,524 8,139 59,8672004 58,829 275,434 − 216,605 5,047 4,939 108 891 918 − 27 21,694 100,955 − 79,262 10,806 54,2192005 67,286 280,687 − 213,401 5,616 5,371 245 1,225 1,215 10 18,377 102,829 − 84,452 10,591 58,189
Finland
2002 5,777 6,030 − 253 1,742 1,766 − 24 18 19 − 1 3,867 4,230 − 363 3,245 3,4772003 4,099 3,104 995 1,040 1,005 36 10 10 0 2,872 2,080 792 2,274 1,7422004 5,863 4,306 1,557 1,822 1,825 − 2 7 8 − 1 3,356 2,474 882 2,260 1,7712005 5,385 4,328 1,056 1,252 1,205 48 12 25 − 13 3,757 2,948 810 2,579 2,050
France
2002 225,268 210,415 14,853 97,221 97,904 − 683 1,167 1,225 − 59 105,898 102,710 3,188 41,327 38,8302003 297,479 233,823 63,656 115,169 107,563 7,606 997 988 9 144,392 106,856 37,536 72,734 58,5802004 331,384 259,912 71,472 147,902 139,185 8,716 745 790 − 46 154,532 107,439 47,093 83,953 61,3392005 407,730 354,177 53,553 225,293 220,991 4,302 1,505 1,227 277 149,042 111,971 37,071 84,389 67,121
Greece
2002 1,968 1,660 308 63 57 6 62 57 5 1,407 1,415 − 8 1,261 1,3242003 4,709 2,658 2,051 80 74 6 77 73 4 3,784 2,152 1,632 3,508 1,9022004 4,164 1,798 2,367 63 65 − 2 51 68 − 17 3,352 1,461 1,891 2,792 1,2502005 4,823 2,448 2,375 39 51 − 12 44 60 − 17 4,334 2,261 2,073 3,563 2,081
o For the classification of countries into groups of countries, see list of coun- by the former Federal Railways, the former Federal Post Office and thetries on pp 104−105. — 1 Regional attribution to the country of the foreign former Treuhand agency. — 4 The purchases also include the netcounterparty. — 2 Including participation rights. — 3 Including bonds issued
82

DEUTSCHEBUNDESBANK
Balance of paymentsby regionAugust 2006
I Balance of payments of the Federal Republic of Germany
Money market instruments
Private sector bonds Total Public sector issuers Private sector issuers
Balance Purchases Sales Balance Purchases Sales Balance Sales Balance Purchases Sales BalancePurchases 4 Year
All countries
4,119 129,199 110,713 18,486 21,144 35,166 − 14,022 − 11,631 789 − 12,420 32,776 34,378 − 1,602 1994
49,570 170,448 133,988 36,460 34,562 42,700 − 8,138 − 3,855 113 − 3,968 38,417 42,587 − 4,170 199544,178 256,983 199,025 57,959 99,754 80,289 19,465 27,720 12,829 14,891 72,034 67,459 4,575 199678,141 255,524 211,175 44,348 190,738 178,347 12,391 70,051 63,284 6,767 120,687 115,063 5,624 199777,166 430,728 354,439 76,289 220,927 207,773 13,155 63,743 70,868 − 7,124 157,184 136,905 20,279 199832,442 297,098 231,946 65,152 153,573 111,457 42,116 27,168 27,005 162 126,405 84,452 41,954 1999
22,442 360,638 308,562 52,077 239,840 239,534 306 26,989 26,843 146 212,851 212,692 160 20007,745 618,085 545,515 72,570 273,563 284,932 − 11,369 39,399 32,694 6,705 234,164 252,239 − 18,075 2001
44,562 541,852 497,514 44,338 354,881 328,860 26,021 61,751 55,038 6,713 293,130 273,822 19,308 200222,022 627,894 580,287 47,606 487,681 466,016 21,665 87,999 82,657 5,342 399,682 383,359 16,323 200353,752 766,617 677,680 88,937 440,995 455,524 − 14,529 92,876 94,599 − 1,723 348,119 360,925 − 12,806 2004
74,829 621,724 537,862 83,862 480,120 482,785 − 2,665 99,917 96,855 3,062 380,203 385,930 − 5,727 2005
Europe
41,380 529,763 488,396 41,368 323,891 306,645 17,246 55,685 46,458 9,227 268,206 260,187 8,019 200219,773 609,719 567,213 42,507 441,471 428,314 13,156 73,348 68,813 4,535 368,122 359,502 8,621 200352,973 750,370 666,296 84,075 399,746 408,680 − 8,933 78,016 71,250 6,766 321,730 337,429 − 15,700 200465,133 597,748 525,381 72,368 440,712 444,770 − 4,058 88,953 77,880 11,073 351,759 366,890 − 15,131 2005
EU member states
41,340 501,137 464,222 36,915 308,997 296,519 12,479 43,416 37,639 5,777 265,581 258,880 6,702 200217,352 539,892 504,037 35,855 426,033 418,754 7,279 62,851 62,653 198 363,182 356,101 7,081 200346,417 665,183 583,897 81,286 386,647 401,129 − 14,481 70,626 66,121 4,505 316,021 335,007 − 18,986 200459,772 557,450 485,894 71,556 427,497 438,028 − 10,531 83,717 75,645 8,073 343,780 362,383 − 18,604 2005
Euro-area member states − 45,323 171,987 200,963 − 28,975 70,814 208,182 − 137,368 9,213 25,731 − 16,518 61,601 182,451 − 120,850 2002− 37,537 180,782 195,564 − 14,782 104,201 260,984 − 156,783 15,200 42,009 − 26,809 89,001 218,975 − 129,974 2003− 34,919 187,636 199,859 − 12,223 112,004 273,649 − 161,645 13,700 51,332 − 37,632 98,304 222,317 − 124,012 2004− 40,453 183,002 206,804 − 23,802 155,241 292,456 − 137,216 18,675 61,196 − 42,521 136,566 231,260 − 94,695 2005
of which: Belgium − 37,600 5,635 31,668 − 26,033 12,032 106,116 − 94,084 1,163 16,336 − 15,173 10,869 89,780 − 78,911 2002− 51,729 5,950 39,746 − 33,796 12,358 145,492 − 133,134 1,718 27,733 − 26,015 10,640 117,759 − 107,120 2003− 43,412 10,887 46,736 − 35,849 31,198 168,622 − 137,424 1,731 30,436 − 28,705 29,467 138,187 − 108,719 2004− 47,597 7,786 44,640 − 36,855 42,068 171,273 − 129,205 3,192 38,729 − 35,537 38,876 132,544 − 93,668 2005
Finland − 232 622 753 − 131 150 15 135 150 − 150 0 15 − 15 2002
532 598 338 259 177 9 167 − − − 177 9 167 2003489 1,096 703 393 678 0 678 20 − 20 658 0 658 2004529 1,179 898 281 363 150 212 − 150 − 150 363 0 362 2005
France
2,497 64,571 63,880 691 20,982 8,575 12,406 3,000 1,717 1,283 17,982 6,858 11,123 200214,154 71,658 48,275 23,382 36,922 18,416 18,506 8,183 4,075 4,108 28,739 14,341 14,398 200322,614 70,580 46,101 24,479 28,205 12,497 15,709 7,370 3,908 3,462 20,835 8,589 12,246 200417,268 64,653 44,850 19,803 31,891 19,988 11,903 10,737 5,502 5,235 21,153 14,486 6,667 2005
Greece − 63 146 91 56 436 131 305 425 130 295 11 1 10 2002
1,605 276 249 27 768 359 409 740 356 384 28 3 25 20031,542 559 211 348 699 204 495 686 195 491 13 9 4 20041,482 771 180 590 406 75 331 335 40 295 71 35 35 2005
balances of liquidity paper sold to non-residents by the Bundesbank up to between March 1993 and March 1995. They are derived from changes inend-1998 and the Bundesbank discount liquidity paper sold to non-residents levels and cannot be broken down into purchases and sales.
83

DEUTSCHEBUNDESBANKE U R O S Y S T E M
Balance of paymentsby regionAugust 2006
I Balance of payments of the Federal Republic of Germany
8 Financial transactions with non-residents o(b) Portfolio investment (excluding direct investment) (cont’d)
€ million
Foreign investment in German securities (increase/capital imports: +) 1
Total Shares 2 Mutual fund shares Bonds and notes
Total Public sector bonds 3
Year Purchases Sales Balance Purchases Sales Balance Purchases Sales Balance Purchases Sales Balance Purchases Sales
Ireland
2002 16,001 16,133 − 132 1,796 1,812 − 16 3,682 3,686 − 4 9,657 10,051 − 395 6,572 6,3342003 19,906 18,997 910 825 743 82 4,634 4,542 92 13,841 13,569 271 10,659 10,1282004 23,604 19,620 3,984 914 1,149 − 235 3,551 3,389 161 18,648 14,861 3,787 14,484 11,5542005 16,890 14,200 2,689 950 1,781 − 832 1,761 1,699 62 13,787 10,558 3,229 7,997 7,707
Italy
2002 38,295 38,929 − 633 7,658 6,836 821 366 426 − 60 29,678 30,764 − 1,086 19,823 22,4442003 44,761 36,043 8,717 12,901 12,899 3 581 550 31 30,731 22,261 8,470 23,666 18,2492004 43,659 39,013 4,646 12,290 11,694 596 439 482 − 43 30,261 25,633 4,628 22,286 20,0522005 54,828 48,092 6,736 13,410 13,609 − 199 545 540 6 38,696 32,717 5,979 25,594 23,242
Luxembourg
2002 148,254 252,190 − 103,936 6,491 6,486 5 51,988 52,973 − 985 71,727 103,849 − 32,122 17,261 33,2472003 182,848 282,672 − 99,824 7,717 6,637 1,080 50,217 51,954 − 1,737 95,371 130,800 − 35,429 34,798 56,5092004 159,687 241,274 − 81,587 8,068 6,492 1,576 33,713 29,488 4,226 86,145 120,948 − 34,802 18,094 42,1622005 175,315 254,357 − 79,042 10,833 12,403 − 1,570 31,498 31,458 40 80,257 118,715 − 38,458 16,113 34,907
Netherlands
2002 117,590 88,890 28,700 62,121 58,737 3,384 1,602 1,690 − 88 39,440 27,392 12,048 28,251 21,3412003 110,636 98,961 11,675 52,626 64,571 − 11,945 2,381 2,525 − 144 38,129 30,413 7,716 25,156 18,3302004 166,969 168,435 − 1,467 117,643 131,118 − 13,475 4,186 4,261 − 75 31,338 30,790 548 22,625 22,1502005 176,686 150,831 25,855 114,576 102,336 12,240 9,593 9,661 − 68 31,460 33,111 − 1,651 23,063 23,871
Austria
2002 26,243 19,913 6,330 4,672 4,428 244 1,431 1,379 51 18,693 13,541 5,152 6,071 4,7722003 27,191 23,474 3,716 5,903 5,873 30 1,665 1,660 5 17,562 14,887 2,674 6,243 5,1792004 30,992 27,807 3,185 8,563 8,399 164 3,753 3,607 146 16,409 12,684 3,725 6,374 5,9852005 37,146 33,217 3,928 10,654 11,218 − 564 2,861 2,588 273 22,123 17,992 4,131 11,241 10,115
Portugal
2002 7,508 7,223 285 156 118 39 3,327 3,338 − 11 3,999 3,759 240 3,311 3,4842003 6,713 6,381 332 107 98 9 522 586 − 65 6,036 5,595 440 5,072 5,1112004 5,600 5,963 − 363 162 166 − 4 224 229 − 5 5,054 5,381 − 327 4,288 4,9002005 4,216 3,324 892 161 165 − 3 291 209 82 3,743 2,941 801 2,768 2,672
Spain
2002 22,599 19,141 3,458 1,669 1,610 59 226 171 55 18,896 16,026 2,870 9,978 9,3242003 23,739 10,945 12,794 1,568 1,477 91 578 393 185 17,924 8,732 9,192 11,935 6,0232004 18,498 12,455 6,043 2,281 1,985 296 593 446 148 13,547 9,039 4,508 8,979 6,5972005 23,815 15,232 8,583 1,342 1,160 183 806 538 267 19,067 12,922 6,145 14,292 10,758
Other EU member states
2002 1,631,350 1,319,817 311,534 354,739 345,850 8,890 3,959 3,714 244 1,034,469 881,916 152,553 705,319 618,6562003 1,826,022 1,539,877 286,145 389,582 373,299 16,283 8,212 7,937 275 1,106,396 1,000,871 105,526 747,287 692,3982004 2,076,186 1,755,347 320,839 489,923 491,641 − 1,719 7,848 7,299 549 1,303,771 1,128,927 174,845 826,225 744,8892005 2,176,444 1,828,117 348,326 669,956 643,733 26,223 13,061 13,224 − 164 1,221,171 1,025,588 195,583 846,723 746,497
of which: Denmark
2002 18,130 16,802 1,329 160 179 − 19 32 33 − 1 17,312 16,561 751 11,870 11,4062003 20,244 16,571 3,673 391 278 113 19 24 − 5 18,440 15,553 2,887 12,661 11,2152004 17,754 14,765 2,989 296 225 71 13 19 − 6 16,895 14,519 2,375 10,447 9,9682005 26,490 26,019 471 3,073 1,421 1,651 15 22 − 7 23,053 24,547 − 1,494 18,384 19,955
o For the classification of countries into groups of countries, see list of coun- by the former Federal Railways, the former Federal Post Office and thetries on pp 104−105. — 1 Regional attribution to the country of the foreign former Treuhand agency. — 4 The purchases also include the netcounterparty. — 2 Including participation rights. — 3 Including bonds issued
84
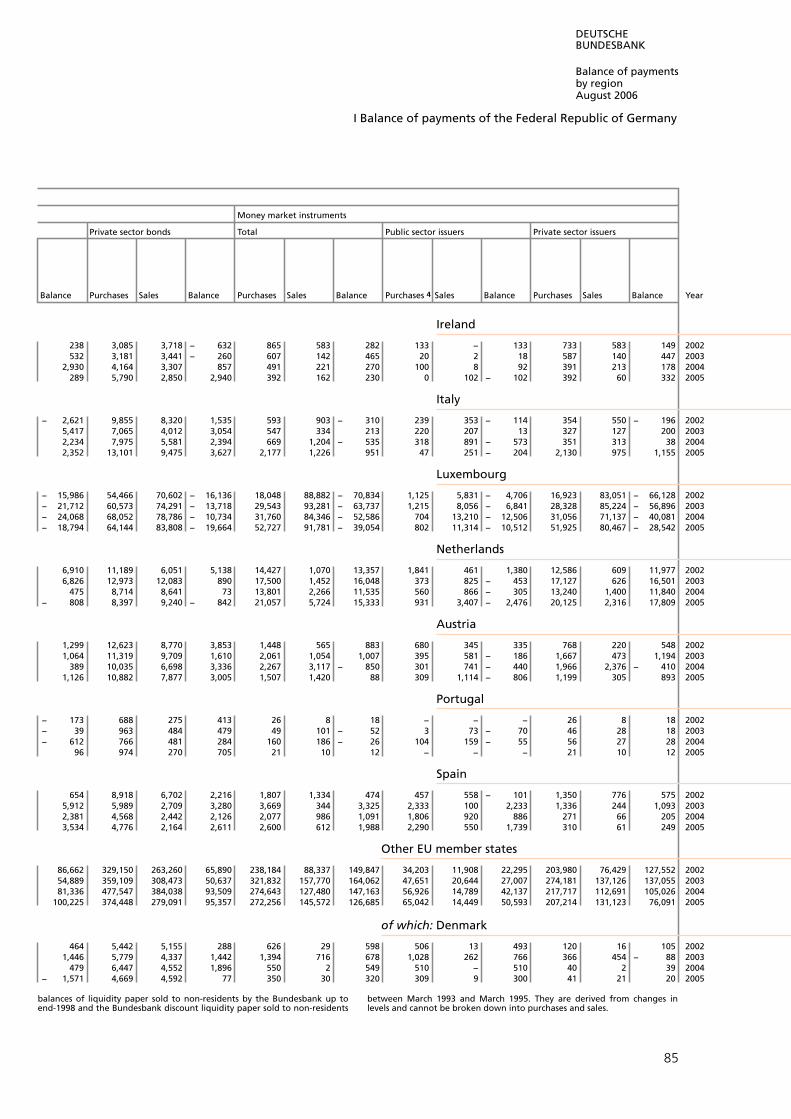
DEUTSCHEBUNDESBANK
Balance of paymentsby regionAugust 2006
I Balance of payments of the Federal Republic of Germany
Money market instruments
Private sector bonds Total Public sector issuers Private sector issuers
Balance Purchases Sales Balance Purchases Sales Balance Sales Balance Purchases Sales BalancePurchases 4 Year
Ireland
238 3,085 3,718 − 632 865 583 282 133 − 133 733 583 149 2002532 3,181 3,441 − 260 607 142 465 20 2 18 587 140 447 2003
2,930 4,164 3,307 857 491 221 270 100 8 92 391 213 178 2004289 5,790 2,850 2,940 392 162 230 0 102 − 102 392 60 332 2005
Italy − 2,621 9,855 8,320 1,535 593 903 − 310 239 353 − 114 354 550 − 196 2002
5,417 7,065 4,012 3,054 547 334 213 220 207 13 327 127 200 20032,234 7,975 5,581 2,394 669 1,204 − 535 318 891 − 573 351 313 38 20042,352 13,101 9,475 3,627 2,177 1,226 951 47 251 − 204 2,130 975 1,155 2005
Luxembourg − 15,986 54,466 70,602 − 16,136 18,048 88,882 − 70,834 1,125 5,831 − 4,706 16,923 83,051 − 66,128 2002− 21,712 60,573 74,291 − 13,718 29,543 93,281 − 63,737 1,215 8,056 − 6,841 28,328 85,224 − 56,896 2003− 24,068 68,052 78,786 − 10,734 31,760 84,346 − 52,586 704 13,210 − 12,506 31,056 71,137 − 40,081 2004− 18,794 64,144 83,808 − 19,664 52,727 91,781 − 39,054 802 11,314 − 10,512 51,925 80,467 − 28,542 2005
Netherlands
6,910 11,189 6,051 5,138 14,427 1,070 13,357 1,841 461 1,380 12,586 609 11,977 20026,826 12,973 12,083 890 17,500 1,452 16,048 373 825 − 453 17,127 626 16,501 2003
475 8,714 8,641 73 13,801 2,266 11,535 560 866 − 305 13,240 1,400 11,840 2004− 808 8,397 9,240 − 842 21,057 5,724 15,333 931 3,407 − 2,476 20,125 2,316 17,809 2005
Austria
1,299 12,623 8,770 3,853 1,448 565 883 680 345 335 768 220 548 20021,064 11,319 9,709 1,610 2,061 1,054 1,007 395 581 − 186 1,667 473 1,194 2003
389 10,035 6,698 3,336 2,267 3,117 − 850 301 741 − 440 1,966 2,376 − 410 20041,126 10,882 7,877 3,005 1,507 1,420 88 309 1,114 − 806 1,199 305 893 2005
Portugal − 173 688 275 413 26 8 18 − − − 26 8 18 2002− 39 963 484 479 49 101 − 52 3 73 − 70 46 28 18 2003− 612 766 481 284 160 186 − 26 104 159 − 55 56 27 28 2004
96 974 270 705 21 10 12 − − − 21 10 12 2005
Spain
654 8,918 6,702 2,216 1,807 1,334 474 457 558 − 101 1,350 776 575 20025,912 5,989 2,709 3,280 3,669 344 3,325 2,333 100 2,233 1,336 244 1,093 20032,381 4,568 2,442 2,126 2,077 986 1,091 1,806 920 886 271 66 205 20043,534 4,776 2,164 2,611 2,600 612 1,988 2,290 550 1,739 310 61 249 2005
Other EU member states
86,662 329,150 263,260 65,890 238,184 88,337 149,847 34,203 11,908 22,295 203,980 76,429 127,552 200254,889 359,109 308,473 50,637 321,832 157,770 164,062 47,651 20,644 27,007 274,181 137,126 137,055 200381,336 477,547 384,038 93,509 274,643 127,480 147,163 56,926 14,789 42,137 217,717 112,691 105,026 2004
100,225 374,448 279,091 95,357 272,256 145,572 126,685 65,042 14,449 50,593 207,214 131,123 76,091 2005
of which: Denmark
464 5,442 5,155 288 626 29 598 506 13 493 120 16 105 20021,446 5,779 4,337 1,442 1,394 716 678 1,028 262 766 366 454 − 88 2003
479 6,447 4,552 1,896 550 2 549 510 − 510 40 2 39 2004− 1,571 4,669 4,592 77 350 30 320 309 9 300 41 21 20 2005
balances of liquidity paper sold to non-residents by the Bundesbank up to between March 1993 and March 1995. They are derived from changes inend-1998 and the Bundesbank discount liquidity paper sold to non-residents levels and cannot be broken down into purchases and sales.
85

DEUTSCHEBUNDESBANKE U R O S Y S T E M
Balance of paymentsby regionAugust 2006
I Balance of payments of the Federal Republic of Germany
8 Financial transactions with non-residents o(b) Portfolio investment (excluding direct investment) (cont’d)
€ million
Foreign investment in German securities (increase/capital imports: +) 1
Total Shares 2 Mutual fund shares Bonds and notes
Total Public sector bonds 3
Year Purchases Sales Balance Purchases Sales Balance Purchases Sales Balance Purchases Sales Balance Purchases Sales
Poland
2002 3,165 4,189 − 1,024 6 5 1 20 14 6 2,230 3,260 − 1,030 2,032 3,1212003 2,039 2,593 − 554 7 6 1 19 15 4 1,215 1,803 − 588 1,150 1,7842004 1,580 1,541 39 32 33 − 1 16 19 − 3 1,003 979 24 965 9682005 3,501 2,603 898 67 75 − 8 12 18 − 6 2,677 1,887 790 2,403 1,733
Sweden
2002 6,290 5,565 725 1,914 1,901 12 72 65 7 4,204 3,598 607 2,977 2,7852003 11,805 9,522 2,283 2,895 2,819 76 301 464 − 164 8,150 6,238 1,912 6,495 5,3122004 11,436 8,551 2,884 1,014 592 422 547 306 241 8,374 7,458 916 6,225 6,6562005 8,421 7,095 1,326 1,658 1,378 280 50 82 − 33 5,525 5,628 − 103 4,173 4,277
United Kingdom
2002 1,592,281 1,288,392 303,889 352,580 343,705 8,875 3,714 3,494 220 1,003,088 855,019 148,069 682,792 598,7962003 1,775,953 1,500,897 275,056 386,064 369,976 16,088 7,722 7,292 430 1,066,676 969,539 97,137 720,247 667,6562004 2,033,511 1,724,997 308,514 488,377 490,595 − 2,218 7,145 6,821 323 1,268,325 1,101,805 166,520 804,719 724,5782005 2,122,907 1,784,943 337,964 665,039 640,731 24,308 12,813 12,923 − 110 1,178,832 987,608 191,224 816,849 715,903
Other European countries
2002 113,702 105,183 8,519 23,369 24,120 − 751 7,122 7,111 10 68,318 63,825 4,493 39,692 39,6522003 195,604 171,662 23,942 47,870 38,460 9,410 5,491 5,910 − 418 126,805 117,732 9,073 56,978 54,5562004 280,206 258,407 21,799 97,759 90,863 6,895 4,141 4,130 11 165,207 155,862 9,345 80,020 73,4632005 174,131 160,616 13,515 63,122 62,419 703 4,412 4,246 166 93,382 87,209 6,173 53,083 47,722
of which: Russian Federation
2002 1,044 2,462 − 1,418 5 6 − 1 46 28 18 993 2,428 − 1,435 554 5462003 1,327 1,248 79 39 37 2 56 44 12 1,232 982 249 707 6692004 1,992 965 1,026 39 40 − 1 31 33 − 2 1,612 892 719 854 4532005 2,346 845 1,501 155 98 57 35 34 1 1,836 713 1,123 759 480
Switzerland
2002 82,285 77,041 5,244 22,402 23,199 − 797 6,799 6,849 − 49 48,203 45,203 2,999 24,414 24,9782003 158,506 139,397 19,109 42,018 32,712 9,306 5,135 5,574 − 439 105,321 96,503 8,818 43,143 38,2542004 246,364 226,558 19,807 90,474 80,701 9,773 3,747 3,794 − 47 143,848 139,329 4,519 64,820 61,2502005 133,000 132,658 342 55,403 55,091 312 3,946 3,857 90 67,271 68,814 − 1,544 35,112 34,857
Africa
2002 2,288 1,474 814 109 100 10 185 165 20 1,440 1,151 289 809 9162003 4,009 1,133 2,877 118 125 − 7 252 250 2 2,349 669 1,679 1,013 4582004 5,923 2,694 3,229 65 73 − 8 190 210 − 20 3,206 1,883 1,322 1,803 1,4532005 7,313 1,951 5,361 76 106 − 31 166 177 − 11 5,020 1,483 3,537 3,562 938
America
2002 81,584 74,019 7,566 17,868 15,386 2,482 7,178 6,943 235 34,016 37,412 − 3,396 28,774 34,8082003 90,028 83,470 6,558 17,466 16,701 765 7,076 7,185 − 110 36,948 35,242 1,705 27,800 29,3192004 84,448 94,173 − 9,725 23,983 39,207 − 15,224 3,808 4,001 − 193 32,734 27,311 5,423 27,926 22,7632005 80,398 73,194 7,205 18,780 19,377 − 597 4,735 4,613 123 30,885 30,193 692 20,771 22,519
of which: Canada
2002 17,180 17,983 − 803 1,884 757 1,127 126 135 − 9 15,169 17,087 − 1,919 14,851 16,9072003 8,360 8,215 144 857 613 244 110 104 6 7,374 7,484 − 110 6,039 6,0502004 2,658 2,109 549 641 807 − 166 79 89 − 9 1,453 1,212 241 1,086 9612005 2,693 2,621 72 751 422 329 50 56 − 5 1,684 2,117 − 433 955 1,549
o For the classification of countries into groups of countries, see list of coun- by the former Federal Railways, the former Federal Post Office and thetries on pp 104−105. — 1 Regional attribution to the country of the foreign former Treuhand agency. — 4 The purchases also include the netcounterparty. — 2 Including participation rights. — 3 Including bonds issued
86
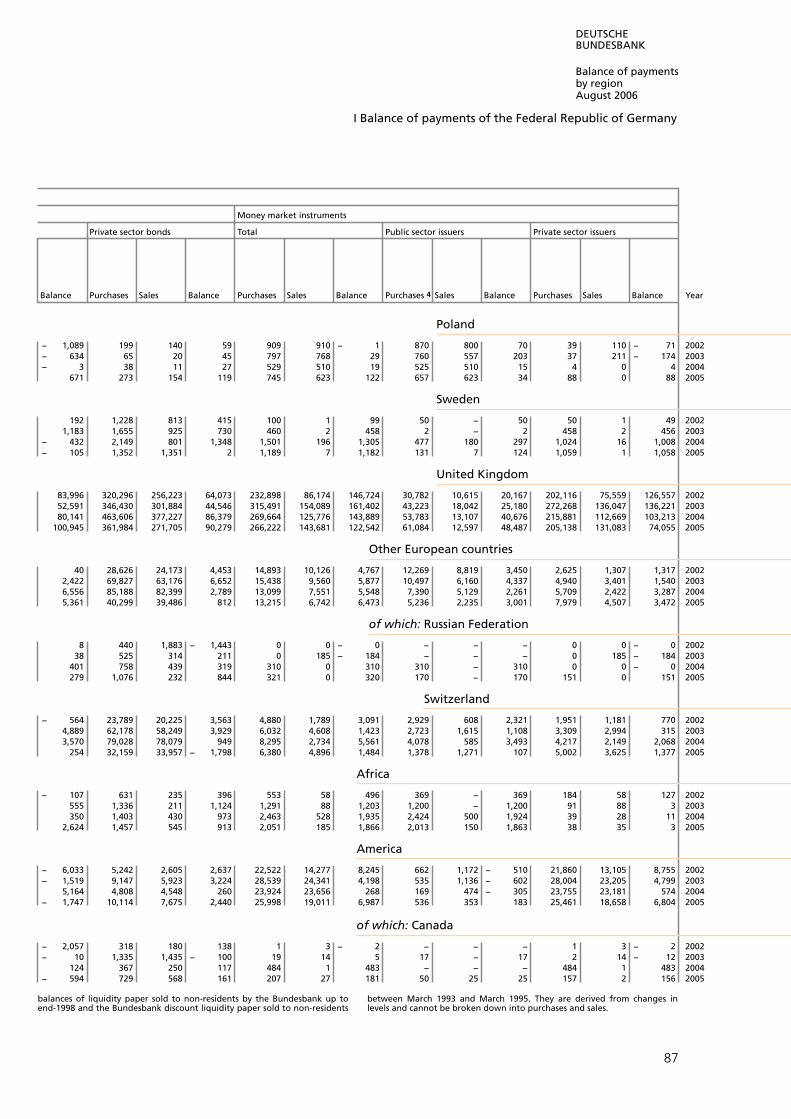
DEUTSCHEBUNDESBANK
Balance of paymentsby regionAugust 2006
I Balance of payments of the Federal Republic of Germany
Money market instruments
Private sector bonds Total Public sector issuers Private sector issuers
Balance Purchases Sales Balance Purchases Sales Balance Sales Balance Purchases Sales BalancePurchases 4 Year
Poland − 1,089 199 140 59 909 910 − 1 870 800 70 39 110 − 71 2002− 634 65 20 45 797 768 29 760 557 203 37 211 − 174 2003− 3 38 11 27 529 510 19 525 510 15 4 0 4 2004
671 273 154 119 745 623 122 657 623 34 88 0 88 2005
Sweden
192 1,228 813 415 100 1 99 50 − 50 50 1 49 20021,183 1,655 925 730 460 2 458 2 − 2 458 2 456 2003
− 432 2,149 801 1,348 1,501 196 1,305 477 180 297 1,024 16 1,008 2004− 105 1,352 1,351 2 1,189 7 1,182 131 7 124 1,059 1 1,058 2005
United Kingdom
83,996 320,296 256,223 64,073 232,898 86,174 146,724 30,782 10,615 20,167 202,116 75,559 126,557 200252,591 346,430 301,884 44,546 315,491 154,089 161,402 43,223 18,042 25,180 272,268 136,047 136,221 200380,141 463,606 377,227 86,379 269,664 125,776 143,889 53,783 13,107 40,676 215,881 112,669 103,213 2004
100,945 361,984 271,705 90,279 266,222 143,681 122,542 61,084 12,597 48,487 205,138 131,083 74,055 2005
Other European countries
40 28,626 24,173 4,453 14,893 10,126 4,767 12,269 8,819 3,450 2,625 1,307 1,317 20022,422 69,827 63,176 6,652 15,438 9,560 5,877 10,497 6,160 4,337 4,940 3,401 1,540 20036,556 85,188 82,399 2,789 13,099 7,551 5,548 7,390 5,129 2,261 5,709 2,422 3,287 20045,361 40,299 39,486 812 13,215 6,742 6,473 5,236 2,235 3,001 7,979 4,507 3,472 2005
of which: Russian Federation
8 440 1,883 − 1,443 0 0 − 0 − − − 0 0 − 0 200238 525 314 211 0 185 − 184 − − − 0 185 − 184 2003
401 758 439 319 310 0 310 310 − 310 0 0 − 0 2004279 1,076 232 844 321 0 320 170 − 170 151 0 151 2005
Switzerland − 564 23,789 20,225 3,563 4,880 1,789 3,091 2,929 608 2,321 1,951 1,181 770 2002
4,889 62,178 58,249 3,929 6,032 4,608 1,423 2,723 1,615 1,108 3,309 2,994 315 20033,570 79,028 78,079 949 8,295 2,734 5,561 4,078 585 3,493 4,217 2,149 2,068 2004
254 32,159 33,957 − 1,798 6,380 4,896 1,484 1,378 1,271 107 5,002 3,625 1,377 2005
Africa − 107 631 235 396 553 58 496 369 − 369 184 58 127 2002
555 1,336 211 1,124 1,291 88 1,203 1,200 − 1,200 91 88 3 2003350 1,403 430 973 2,463 528 1,935 2,424 500 1,924 39 28 11 2004
2,624 1,457 545 913 2,051 185 1,866 2,013 150 1,863 38 35 3 2005
America − 6,033 5,242 2,605 2,637 22,522 14,277 8,245 662 1,172 − 510 21,860 13,105 8,755 2002− 1,519 9,147 5,923 3,224 28,539 24,341 4,198 535 1,136 − 602 28,004 23,205 4,799 2003
5,164 4,808 4,548 260 23,924 23,656 268 169 474 − 305 23,755 23,181 574 2004− 1,747 10,114 7,675 2,440 25,998 19,011 6,987 536 353 183 25,461 18,658 6,804 2005
of which: Canada − 2,057 318 180 138 1 3 − 2 − − − 1 3 − 2 2002− 10 1,335 1,435 − 100 19 14 5 17 − 17 2 14 − 12 2003
124 367 250 117 484 1 483 − − − 484 1 483 2004− 594 729 568 161 207 27 181 50 25 25 157 2 156 2005
balances of liquidity paper sold to non-residents by the Bundesbank up to between March 1993 and March 1995. They are derived from changes inend-1998 and the Bundesbank discount liquidity paper sold to non-residents levels and cannot be broken down into purchases and sales.
87

DEUTSCHEBUNDESBANKE U R O S Y S T E M
Balance of paymentsby regionAugust 2006
I Balance of payments of the Federal Republic of Germany
8 Financial transactions with non-residents o(b) Portfolio investment (excluding direct investment) (cont’d)
€ million
Foreign investment in German securities (increase/capital imports: +) 1
Total Shares 2 Mutual fund shares Bonds and notes
Total Public sector bonds 3
Year Purchases Sales Balance Purchases Sales Balance Purchases Sales Balance Purchases Sales Balance Purchases Sales
United States
2002 54,639 46,156 8,483 15,316 13,965 1,351 321 350 − 29 16,943 17,909 − 966 13,045 16,0902003 70,269 64,446 5,823 15,953 15,452 501 306 329 − 23 26,371 24,977 1,394 19,799 21,4242004 72,263 84,106 − 11,842 22,241 37,307 − 15,067 345 383 − 38 26,626 23,011 3,615 23,080 19,2952005 60,149 55,875 4,274 15,527 16,907 − 1,380 307 271 36 19,114 20,103 − 989 11,912 14,262
Asia
2002 69,137 53,587 15,550 994 992 2 729 684 45 60,088 47,657 12,431 54,694 42,1722003 74,389 64,955 9,434 764 850 − 86 600 596 4 60,843 56,618 4,224 53,854 50,1842004 54,208 49,479 4,729 836 1,288 − 453 423 563 − 140 43,283 40,992 2,291 35,691 35,7762005 53,085 43,138 9,947 1,282 1,393 − 111 424 527 − 103 47,077 37,758 9,319 37,699 34,014
of which: Japan
2002 39,415 30,765 8,650 32 47 − 15 28 50 − 22 36,123 27,494 8,628 34,696 24,2072003 44,840 40,647 4,193 40 58 − 18 38 34 4 37,853 35,678 2,174 35,803 33,1002004 24,198 27,406 − 3,208 18 19 − 1 19 30 − 10 18,941 21,413 − 2,473 16,547 19,6452005 19,459 20,866 − 1,407 20 22 − 1 18 25 − 8 17,846 18,249 − 403 15,731 16,621
Emerging markets in South-East Asia
2002 20,713 15,555 5,158 514 579 − 65 374 371 3 16,609 13,884 2,724 14,052 12,4102003 20,418 16,694 3,724 177 155 21 240 271 − 31 15,318 15,241 77 11,539 12,2982004 21,271 14,701 6,570 136 130 6 177 279 − 102 17,859 13,866 3,993 14,713 11,0892005 18,217 15,138 3,079 158 221 − 63 196 278 − 82 16,783 14,513 2,270 13,866 13,087
Oceania and polar regions
2002 1,277 1,070 207 333 229 105 34 31 3 741 736 6 457 5212003 815 637 179 292 262 30 45 40 5 406 301 105 376 2152004 2,582 1,354 1,228 221 213 7 33 37 − 3 2,172 1,011 1,161 76 972005 2,914 347 2,567 155 150 5 42 40 2 2,454 109 2,345 108 36
International organisations
2002 1,546 7,833 − 6,287 32 17 15 8 0 7 1,086 4,264 − 3,178 548 3,6852003 6,794 9,404 − 2,611 13 12 1 0 22 − 22 2,656 3,022 − 365 1,983 2,6012004 6,676 22,126 − 15,450 0 2 − 1 2 1 1 1,633 6,191 − 4,557 1,286 5,9142005 16,688 19,909 − 3,221 0 1 − 0 − 1 − 1 9,893 4,596 5,297 9,212 4,151
Unidentified countries
2002 − − − − − − − − − − − − − −2003 − − − − − − − − − − − − − −2004 − − − − − − − − − − − − − −2005 − − − − − − − − − − − − − −
Memo item: Industrial countries
2002 2,490,774 2,361,647 129,127 583,581 567,712 15,868 76,330 77,414 − 1,084 1,481,905 1,392,908 88,997 947,368 901,4392003 2,893,410 2,788,785 104,625 655,863 632,720 23,143 76,921 78,600 − 1,679 1,685,644 1,620,866 64,778 1,066,952 1,046,7572004 3,300,703 3,181,052 119,651 915,505 927,808 − 12,304 60,507 55,553 4,955 1,897,508 1,760,175 137,333 1,140,818 1,088,0862005 3,404,128 3,226,833 177,295 1,133,417 1,093,756 39,661 67,916 66,987 929 1,736,185 1,600,497 135,688 1,128,307 1,067,762
Emerging markets and developing countries
2002 47,889 40,574 7,315 1,758 1,726 32 7,729 7,334 395 32,898 29,818 3,080 26,122 24,3532003 51,132 40,518 10,614 1,571 1,622 − 51 7,613 7,670 − 56 33,374 28,159 5,215 24,846 22,4012004 52,630 36,763 15,867 2,036 2,494 − 458 4,089 4,374 − 284 37,732 27,819 9,913 28,153 22,5042005 65,442 42,528 22,914 4,080 3,712 369 5,065 5,062 4 49,581 31,876 17,705 36,417 27,194
o For the classification of countries into groups of countries, see list of coun- by the former Federal Railways, the former Federal Post Office and thetries on pp 104−105. — 1 Regional attribution to the country of the foreign former Treuhand agency. — 4 The purchases also include the netcounterparty. — 2 Including participation rights. — 3 Including bonds issued
88

DEUTSCHEBUNDESBANK
Balance of paymentsby regionAugust 2006
I Balance of payments of the Federal Republic of Germany
Money market instruments
Private sector bonds Total Public sector issuers Private sector issuers
Balance Purchases Sales Balance Purchases Sales Balance Sales Balance Purchases Sales BalancePurchases 4 Year
United States − 3,045 3,898 1,819 2,079 22,059 13,932 8,127 493 1,061 − 568 21,566 12,871 8,695 2002− 1,625 6,572 3,553 3,019 27,640 23,688 3,952 328 1,073 − 745 27,312 22,615 4,697 2003
3,785 3,546 3,716 − 170 23,051 23,404 − 353 131 474 − 344 22,920 22,929 − 9 2004− 2,350 7,202 5,842 1,361 25,202 18,594 6,608 349 253 97 24,852 18,341 6,511 2005
Asia
12,523 5,393 5,485 − 91 7,326 4,254 3,072 4,575 3,911 664 2,751 343 2,408 20023,670 6,988 6,434 554 12,183 6,890 5,293 8,737 6,374 2,363 3,446 516 2,930 2003
− 85 7,593 5,216 2,376 9,667 6,636 3,031 7,394 6,406 988 2,273 229 2,043 20043,685 9,378 3,744 5,634 4,302 3,460 842 1,844 3,154 − 1,309 2,457 307 2,151 2005
of which: Japan
10,489 1,427 3,287 − 1,860 3,232 3,173 59 3,052 3,028 24 180 145 35 20022,703 2,050 2,578 − 528 6,909 4,877 2,032 6,390 4,800 1,590 519 77 442 2003
− 3,098 2,394 1,768 625 5,221 5,944 − 723 4,533 5,800 − 1,267 688 144 544 2004− 890 2,115 1,628 487 1,576 2,570 − 994 1,014 2,392 − 1,378 562 178 384 2005
Emerging markets in South-East Asia
1,643 2,557 1,475 1,082 3,216 720 2,495 956 605 351 2,260 115 2,144 2002− 759 3,779 2,943 836 4,683 1,026 3,657 2,014 808 1,207 2,669 218 2,451 2003
3,624 3,146 2,777 369 3,099 426 2,673 1,872 359 1,513 1,227 67 1,160 2004779 2,917 1,425 1,491 1,080 126 954 106 29 77 974 97 877 2005
Oceania and polar regions − 64 285 215 70 169 74 94 40 10 30 129 64 64 2002
161 30 86 − 56 73 34 39 63 33 30 10 1 9 2003− 21 2,096 914 1,182 156 93 62 − 59 − 59 156 34 121 2004
72 2,345 73 2,272 263 48 215 − 47 − 47 263 1 262 2005
International organisations − 3,136 538 580 − 42 420 3,552 − 3,132 420 3,487 − 3,067 − 65 − 65 2002− 618 673 420 253 4,125 6,349 − 2,224 4,116 6,302 − 2,185 9 47 − 39 2003− 4,628 348 277 71 5,040 15,932 − 10,892 4,873 15,909 − 11,037 168 23 144 2004
5,061 681 445 235 6,795 15,311 − 8,517 6,571 15,272 − 8,701 224 39 185 2005
Unidentified countries
− − − − − − − − − − − − − 2002− − − − − − − − − − − − − 2003− − − − − − − − − − − − − 2004− − − − − − − − − − − − − 2005
Memo item: Industrial countries
45,929 534,538 491,470 43,068 348,958 323,612 25,345 58,886 50,410 8,476 290,072 273,202 16,870 200220,195 618,692 574,109 44,583 474,982 456,599 18,383 79,040 74,586 4,455 395,942 382,013 13,929 200352,732 756,691 672,089 84,602 427,183 437,516 − 10,333 81,242 77,051 4,192 345,940 360,465 − 14,524 200460,545 607,879 532,735 75,144 466,610 465,594 1,016 89,190 80,204 8,987 377,420 385,390 − 7,971 2005
Emerging markets and developing countries
1,769 6,776 5,465 1,311 5,503 1,696 3,808 2,445 1,141 1,304 3,058 555 2,504 20022,445 8,528 5,758 2,770 8,574 3,068 5,506 4,843 1,770 3,073 3,732 1,298 2,433 20035,649 9,579 5,314 4,264 8,772 2,076 6,696 6,761 1,639 5,122 2,011 437 1,574 20049,223 13,164 4,682 8,482 6,715 1,879 4,836 4,156 1,379 2,777 2,559 500 2,059 2005
balances of liquidity paper sold to non-residents by the Bundesbank up to between March 1993 and March 1995. They are derived from changes inend-1998 and the Bundesbank discount liquidity paper sold to non-residents levels and cannot be broken down into purchases and sales.
89

DEUTSCHEBUNDESBANKE U R O S Y S T E M
Balance of paymentsby regionAugust 2006
I Balance of payments of the Federal Republic of Germany
8 Financial transactions with non-residents o(c) Other investment +
Up to end-1998 DM million; from 1999 € million
Other German investment abroad (increase/capital exports: −)
Loans 1,2 Bank deposits
Monetary MonetaryBalance of financial Enterprises financial Enterprisesother institu- and General Bundes- institu- and General Bundes-
Year investment Total Total tions 3 households government bank Total tions 3 households government bank 4
All countries
1994 127,399 4,366 17,165 30,262 − 8,261 − 5,096 261 2,389 − 11 − 5,977 8,377 −
1995 50,419 − 87,044 − 91,050 − 77,777 − 11,269 − 2,405 402 16,611 − 45 23,238 − 6,582 −1996 2,694 − 61,271 − 66,267 − 60,068 − 5,307 − 1,407 515 11,156 − 148 10,431 872 −1997 64,436 − 143,494 − 144,488 − 139,598 − 2,309 − 3,081 500 14,083 − 74 14,642 − 484 −1998 150,224 − 151,471 − 140,070 − 135,415 − 2,619 − 1,886 − 151 − 8,062 − 62 − 8,188 188 −1999 37,924 − 65,158 − 46,240 − 42,766 − 3,102 − 500 128 − 15,456 323 24,310 7,582 − 47,671
2000 39,430 − 86,902 − 111,106 − 101,543 − 8,151 − 1,112 − 300 34,264 10 11,324 − 19,343 42,2722001 − 42,024 − 111,965 − 127,942 − 130,601 2,402 257 − 15,294 − 47 − 24,156 15,483 24,0152002 − 143,272 − 174,236 − 136,738 − 132,523 − 4,433 218 − − 35,656 − 13 − 6,293 6,660 − 36,0102003 − 137,909 − 154,722 − 126,200 − 122,322 − 4,573 694 − − 27,984 17 − 28,525 293 2302004 − 106,541 − 144,826 − 122,509 − 121,435 − 1,877 803 − − 17,326 45 − 16,264 1,786 − 2,893
2005 − 73,568 − 118,461 − 77,240 − 85,667 0 8,427 − − 30,033 − 6 − 3,218 − 4,773 − 22,036
Europe
2002 − 83,008 − 138,720 − 103,490 − 99,792 − 4,220 521 − − 34,584 4 − 5,237 6,659 − 36,0102003 − 102,156 − 136,794 − 113,599 − 109,897 − 4,185 483 − − 23,348 20 − 23,891 293 2302004 − 88,380 − 138,518 − 117,936 − 116,988 − 1,618 670 − − 17,555 33 − 16,484 1,789 − 2,8932005 − 29,624 − 80,272 − 45,055 − 50,331 − 1,021 6,297 − − 29,066 − 15 − 2,302 − 4,714 − 22,036
EU member states (25)
2002 − 82,454 − 141,329 − 106,985 − 102,733 − 4,286 34 − − 34,058 − 6 − 4,702 6,659 − 36,0102003 − 86,705 − 110,047 − 90,252 − 86,734 − 3,532 15 − − 20,304 5 − 20,843 303 2302004 − 88,785 − 140,049 − 119,031 − 117,543 − 1,587 99 − − 18,244 7 − 17,137 1,779 − 2,8932005 − 43,893 − 73,313 − 38,430 − 38,673 − 1,049 1,291 − − 30,404 − 2 − 3,653 − 4,714 − 22,036
Euro-area member states
2002 − 58,444 − 94,392 − 69,721 − 67,717 − 1,992 − 12 − − 24,482 − 4,478 7,050 − 36,0102003 − 30,790 − 32,040 − 25,620 − 22,409 − 3,153 − 58 − − 7,173 − − 6,678 − 725 2302004 − 30,479 − 47,426 − 21,285 − 20,433 − 848 − 4 − − 24,392 − − 22,872 1,373 − 2,8932005 − 74,217 − 84,042 − 55,176 − 53,814 − 1,413 52 − − 26,578 − − 470 − 4,073 − 22,036
of which: Belgium
2002 6,072 1,576 − 686 − 552 − 122 − 12 − 2,159 − 2,159 0 02003 − 6,106 − 4,577 − 4,757 − 4,484 − 272 − 1 − 164 − 164 − 0 02004 5,034 3,394 4,341 4,250 87 4 − − 748 − − 748 0 02005 3,111 785 1,714 1,172 535 7 − − 653 − − 378 − 275 − 0
Finland
2002 − 1,338 − 252 − 158 − 38 − 121 − − − 82 − − 82 − 02003 − 125 489 391 479 − 88 − − 93 − 93 − − 02004 − 1,520 − 1,723 − 1,536 − 1,534 − 2 − − − 98 − − 98 − 02005 1,940 585 760 737 23 − − − 70 − − 20 − 50 −
France
2002 − 12,034 − 19,478 − 18,417 − 17,327 − 1,090 0 − − 1,208 − − 1,071 − 3 − 1332003 2,357 − 9,883 − 7,581 − 6,565 − 1,016 0 − − 2,664 − − 2,344 0 − 3202004 − 513 − 15,369 − 13,319 − 12,549 − 774 5 − − 1,537 − − 1,534 − 3 − 12005 3,842 11,953 10,813 11,006 − 193 1 − 2,019 − 3,307 − 1,286 − 2
Greece
2002 − 673 − 1,212 − 1,161 − 1,715 555 − 0 − 2 − 2 − 02003 − 1,189 − 830 − 961 − 982 21 − − 7 − 7 − − 02004 − 2 224 − 49 − 59 10 0 − 122 − 122 − 02005 327 406 477 460 18 − 1 − 42 − 42 − − 0
o For the classification of countries into groups of countries, see list of debtor. — 1 Credits, borrowers’ note loans, assets acquired by way of assign-countries on pp 104−105. — + Sector classification by domestic creditor or ment and similar. — 2 The data are broken down by the domestic
90

DEUTSCHEBUNDESBANK
Balance of paymentsby regionAugust 2006
I Balance of payments of the Federal Republic of Germany
Other foreign investment in Germany (increase/capital imports: + )
Loans 1,2 Bank deposits
Monetary MonetaryTrade Other financial Enterprises General financial Trade Othercredits, investment, institu- and govern- institu- Bundes- credits, investment,total 5 total 2 Total Total tions 3,6 households ment Total tions 3 bank total 5 total 2 Year
All countries − 13,077 − 2,112 123,033 105,889 103,591 − 934 3,232 4,489 7,990 − 3,501 11,729 926 1994
− 7,862 − 4,744 137,463 129,285 113,752 13,414 2,120 2,793 6,538 − 3,744 6,262 − 878 1995− 1,990 − 4,170 63,966 47,608 40,350 2,934 4,323 13,323 15,096 − 1,773 3,015 21 1996− 8,293 − 4,796 207,930 185,201 188,120 10,119 − 13,037 15,520 16,163 − 643 7,977 − 768 1997
4,551 − 7,890 301,696 279,469 258,200 21,220 49 24,826 21,237 3,588 − 2,371 − 227 1998− 1,713 − 1,748 103,082 81,195 72,740 19,709 − 11,255 20,663 22,654 − 1,991 1,268 − 45 1999
− 8,410 − 1,651 126,332 110,044 106,075 3,443 526 9,633 9,219 414 6,324 331 20001,828 − 1,146 69,942 31,851 22,683 8,288 879 34,289 31,658 2,631 3,755 47 2001
− 447 − 1,395 30,964 33,755 32,119 3,260 − 1,625 − 3,013 − 3,666 653 140 83 20022,299 − 2,837 16,813 − 8,041 − 10,520 − 1,214 3,693 23,204 21,221 1,983 1,638 12 2003
− 1,649 − 3,341 38,285 8,070 4,214 6,514 − 2,658 25,627 28,078 − 2,451 3,935 653 2004
− 6,884 − 4,304 44,893 25,080 6,558 14,781 3,740 13,786 15,891 − 2,105 5,636 391 2005
Europe − 240 − 406 55,712 52,234 50,503 3,299 − 1,568 3,612 3,812 − 200 − 179 46 2002
851 − 699 34,639 19,788 17,835 − 1,784 3,737 15,021 14,867 154 − 193 22 2003− 1,718 − 1,309 50,138 22,085 20,707 4,242 − 2,865 24,846 24,909 − 63 2,559 648 2004− 4,098 − 2,053 50,649 29,770 10,534 15,696 3,540 16,985 17,083 − 98 3,531 363 2005
EU member states (25) − 40 − 246 58,875 54,097 52,887 2,690 − 1,480 5,196 5,170 26 − 467 50 2002
1,065 − 556 23,342 11,858 10,403 − 2,381 3,835 11,565 11,455 110 − 105 25 2003− 1,836 − 937 51,263 22,170 20,163 4,571 − 2,564 26,669 26,865 − 196 2,018 406 2004− 3,106 − 1,372 29,420 13,169 − 6,415 16,042 3,542 13,376 13,330 46 2,554 321 2005
Euro-area member states − 6 − 182 35,947 35,222 29,066 5,750 406 784 801 − 17 − 110 51 2002
985 − 233 1,250 − 3,722 895 − 9,452 4,835 5,056 5,080 − 24 − 108 24 2003− 1,232 − 518 16,947 16,658 11,336 4,892 430 − 1,233 − 1,236 3 1,183 340 2004− 1,416 − 872 9,825 6,062 − 1,202 2,533 4,730 1,657 1,656 1 1,710 396 2005
of which: Belgium
122 − 19 4,496 4,560 4,437 133 − 10 43 45 − 2 − 108 1 200244 − 27 − 1,530 − 1,616 − 1,422 − 194 − 19 19 − 0 75 − 8 2003
− 177 − 23 1,640 1,836 1,274 562 − 0 − 231 − 231 0 38 − 3 2004− 263 − 12 2,325 2,137 2,445 − 308 − − 137 − 137 0 348 − 23 2005
Finland − 11 − 0 − 1,086 − 1,537 − 1,664 127 − 395 396 − 1 58 − 2 2002
6 − 2 − 614 − 473 336 − 809 − − 270 − 272 2 129 − 0 2003− 84 − 5 203 88 69 19 − 1 3 − 2 110 4 2004− 110 5 1,354 516 390 13 114 361 361 − 477 − 0 2005
France
190 − 43 7,445 6,458 3,484 2,974 − 1,177 1,184 − 7 − 188 − 3 2002375 − 13 12,241 7,740 7,902 − 690 528 4,281 4,281 − 0 205 15 2003
− 447 − 67 14,857 15,989 11,681 4,279 29 − 1,072 − 1,074 2 − 63 2 2004− 567 − 312 − 8,112 − 10,261 − 11,694 1,321 113 1,814 1,816 − 2 349 − 14 2005
Greece − 64 10 539 171 167 4 − 255 256 − 1 114 − 1 2002
133 − 9 − 359 − 56 − 52 − 4 − − 371 − 371 − 0 70 − 1 2003151 − 1 − 226 − 360 − 362 2 − − 32 − 32 0 167 − 1 2004
− 112 − 1 − 79 − 10 − 45 35 − − 31 − 31 − 0 − 36 − 2 2005
sector of the creditor or the debtor. — 3 Excluding Bundesbank. — 4 Mainly granted and advance payments made in goods and service transactions. —TARGET balances. — 5 Assets and liabilities arising from credit terms 6 Also includes long-term bank deposits of foreign non-banks.
91

DEUTSCHEBUNDESBANKE U R O S Y S T E M
Balance of paymentsby regionAugust 2006
I Balance of payments of the Federal Republic of Germany
8 Financial transactions with non-residents o(c) Other investment (cont’d) +
€ million
Other German investment abroad (increase/capital exports: −)
Loans 1,2 Bank deposits
Monetary MonetaryBalance of financial Enterprises financial Enterprisesother institu- and General Bundes- institu- and General Bundes-
Year investment Total Total tions 3 households government bank Total tions 3 households government bank 4
Ireland
2002 − 5,773 − 8,375 − 6,944 − 6,838 − 106 − − − 1,403 − − 1,318 − 85 02003 4,694 − 3,698 − 4,282 − 4,177 − 91 − 14 − 571 − 433 138 − 02004 − 8,287 − 14,576 − 3,928 − 4,365 492 − 55 − − 10,661 − − 10,636 − 25 − 02005 − 3,140 − 12,426 − 10,117 − 9,092 − 1,060 35 − − 2,417 − − 2,504 87 0
Italy
2002 2,056 − 4,896 − 4,731 − 5,387 656 0 − − 89 − − 91 1 12003 1,388 1,782 1,428 1,717 − 289 0 − − 9 − − 8 − 1 − 02004 − 420 − 3,449 − 3,243 − 2,914 − 329 0 − 87 − 86 1 02005 − 19,050 − 18,874 − 16,525 − 15,356 − 1,169 0 − − 2,120 − − 1,245 − 875 − 0
Luxembourg
2002 23,217 − 5,590 − 18,167 − 18,029 − 138 − − 12,823 − 5,705 7,117 02003 − 14,318 − 8,668 − 5,059 − 4,725 − 230 − 105 − − 3,698 − − 2,853 − 845 − 02004 − 388 3,047 7,012 6,944 67 1 − − 3,633 − − 5,022 1,390 − 02005 − 11,717 − 22,383 − 26,142 − 26,050 − 94 2 − 4,185 − 5,299 − 1,115 0
Netherlands
2002 − 14,426 − 3,872 − 3,336 − 2,588 − 749 0 − − 623 − − 645 22 02003 − 11,038 − 2,548 − 1,669 − 1,829 160 0 − − 838 − − 821 − 17 02004 − 10,329 − 1,698 − 1,004 − 1,631 587 41 − − 571 − − 582 11 − 02005 − 12,072 − 1,350 − 852 − 1,280 430 − 2 − − 132 − 18 − 150 0
Austria
2002 − 6,279 − 2,572 − 2,210 − 1,447 − 763 − − − 346 − − 348 − 22003 1,319 − 729 − 1,116 − 10 − 1,105 0 − 660 − 660 0 02004 − 4,425 − 4,459 − 3,119 − 2,194 − 925 − − − 1,084 − − 1,083 − 1 − 02005 − 11,093 − 15,628 − 7,857 − 7,887 20 10 − − 7,815 − − 7,406 − 409 0
Portugal
2002 − 1,540 − 1,048 − 767 − 807 40 0 − − 305 − − 305 − 02003 − 1,047 − 1,657 174 215 − 41 0 − − 1,854 − − 1,854 − 02004 − 2,024 − 3,308 246 249 − 3 − − − 3,581 − − 3,581 − − 02005 − 1,871 − 818 − 3,120 − 3,141 21 0 − 2,292 − 2,292 − 0
Spain
2002 − 11,876 − 12,822 − 13,144 − 12,990 − 153 − 0 − 441 − 471 − 1 − 292003 − 7,247 − 2,241 − 2,187 − 2,048 − 200 61 − − 125 − − 156 1 292004 − 4,783 − 6,658 − 6,687 − 6,629 − 58 − 1 − 204 − 203 − 02005 − 2,459 − 4,259 − 4,327 − 4,383 57 − 1 − 125 − 125 0 − 0
Other EU member states
2002 − 24,010 − 46,938 − 37,264 − 35,016 − 2,294 46 − − 9,577 − 6 − 9,180 − 391 −2003 − 55,915 − 78,007 − 64,633 − 64,326 − 380 73 − − 13,132 5 − 14,165 1,028 −2004 − 58,306 − 92,623 − 97,746 − 97,111 − 739 103 − 6,148 7 5,735 406 −2005 30,324 10,729 16,745 15,141 365 1,239 − − 3,826 − 2 − 3,183 − 641 −
of which: Denmark
2002 − 2,275 − 3,018 − 1,969 − 2,005 36 − − − 923 − 1 − 922 1 −2003 − 2,910 − 2,406 − 1,814 − 1,739 − 75 0 − − 641 0 − 640 − 1 −2004 − 1,832 − 2,584 − 2,869 − 2,849 − 19 − 0 − 343 1 342 − −2005 − 3,874 − 4,597 − 4,805 − 4,803 − 2 − 0 − 441 − 1 442 0 −
o For the classification of countries into groups of countries, see list of debtor. — 1 Credits, borrowers’ note loans, assets acquired by way of assign-countries on pp 104−105. — + Sector classification by domestic creditor or ment and similar. — 2 The data are broken down by the domestic
92
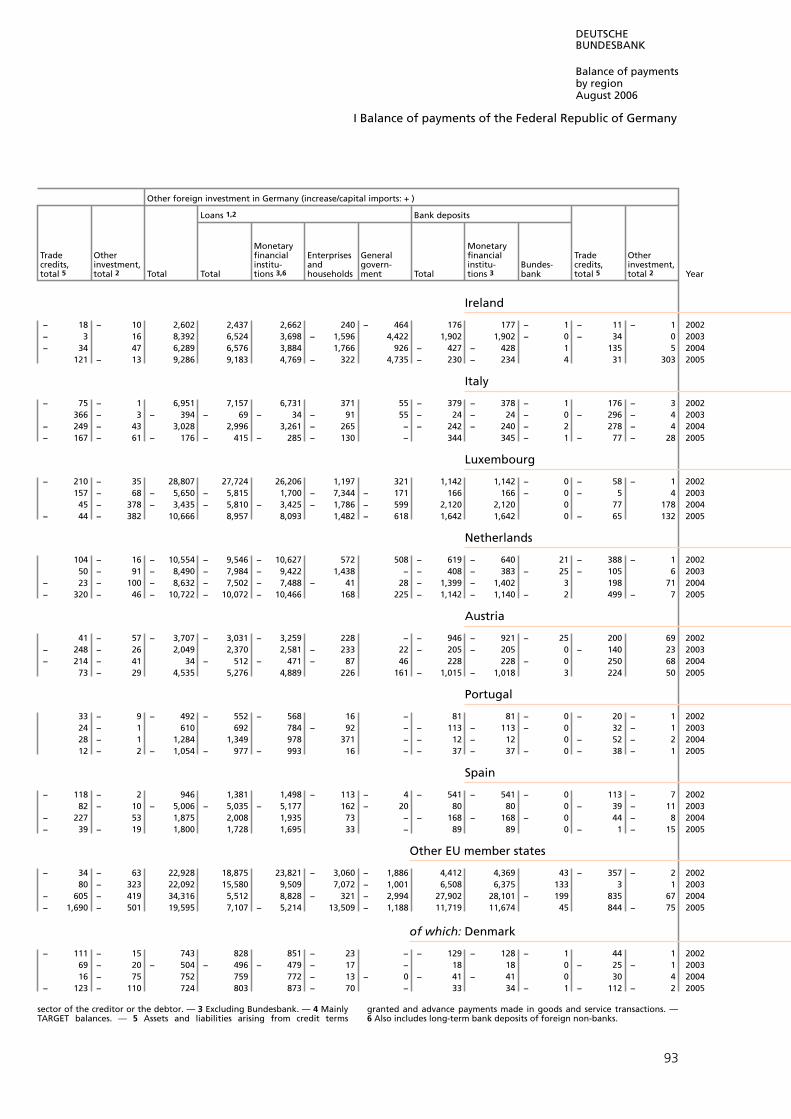
DEUTSCHEBUNDESBANK
Balance of paymentsby regionAugust 2006
I Balance of payments of the Federal Republic of Germany
Other foreign investment in Germany (increase/capital imports: + )
Loans 1,2 Bank deposits
Monetary MonetaryTrade Other financial Enterprises General financial Trade Othercredits, investment, institu- and govern- institu- Bundes- credits, investment,total 5 total 2 Total Total tions 3,6 households ment Total tions 3 bank total 5 total 2 Year
Ireland − 18 − 10 2,602 2,437 2,662 240 − 464 176 177 − 1 − 11 − 1 2002− 3 16 8,392 6,524 3,698 − 1,596 4,422 1,902 1,902 − 0 − 34 0 2003− 34 47 6,289 6,576 3,884 1,766 926 − 427 − 428 1 135 5 2004
121 − 13 9,286 9,183 4,769 − 322 4,735 − 230 − 234 4 31 303 2005
Italy − 75 − 1 6,951 7,157 6,731 371 55 − 379 − 378 − 1 176 − 3 2002
366 − 3 − 394 − 69 − 34 − 91 55 − 24 − 24 − 0 − 296 − 4 2003− 249 − 43 3,028 2,996 3,261 − 265 − − 242 − 240 − 2 278 − 4 2004− 167 − 61 − 176 − 415 − 285 − 130 − 344 345 − 1 − 77 − 28 2005
Luxembourg − 210 − 35 28,807 27,724 26,206 1,197 321 1,142 1,142 − 0 − 58 − 1 2002
157 − 68 − 5,650 − 5,815 1,700 − 7,344 − 171 166 166 − 0 − 5 4 200345 − 378 − 3,435 − 5,810 − 3,425 − 1,786 − 599 2,120 2,120 0 77 178 2004
− 44 − 382 10,666 8,957 8,093 1,482 − 618 1,642 1,642 0 − 65 132 2005
Netherlands
104 − 16 − 10,554 − 9,546 − 10,627 572 508 − 619 − 640 21 − 388 − 1 200250 − 91 − 8,490 − 7,984 − 9,422 1,438 − − 408 − 383 − 25 − 105 6 2003
− 23 − 100 − 8,632 − 7,502 − 7,488 − 41 28 − 1,399 − 1,402 3 198 71 2004− 320 − 46 − 10,722 − 10,072 − 10,466 168 225 − 1,142 − 1,140 − 2 499 − 7 2005
Austria
41 − 57 − 3,707 − 3,031 − 3,259 228 − − 946 − 921 − 25 200 69 2002− 248 − 26 2,049 2,370 2,581 − 233 22 − 205 − 205 0 − 140 23 2003− 214 − 41 34 − 512 − 471 − 87 46 228 228 − 0 250 68 2004
73 − 29 4,535 5,276 4,889 226 161 − 1,015 − 1,018 3 224 50 2005
Portugal
33 − 9 − 492 − 552 − 568 16 − 81 81 − 0 − 20 − 1 200224 − 1 610 692 784 − 92 − − 113 − 113 − 0 32 − 1 200328 − 1 1,284 1,349 978 371 − − 12 − 12 0 − 52 − 2 200412 − 2 − 1,054 − 977 − 993 16 − − 37 − 37 − 0 − 38 − 1 2005
Spain − 118 − 2 946 1,381 1,498 − 113 − 4 − 541 − 541 − 0 113 − 7 2002
82 − 10 − 5,006 − 5,035 − 5,177 162 − 20 80 80 0 − 39 − 11 2003− 227 53 1,875 2,008 1,935 73 − − 168 − 168 − 0 44 − 8 2004− 39 − 19 1,800 1,728 1,695 33 − 89 89 0 − 1 − 15 2005
Other EU member states − 34 − 63 22,928 18,875 23,821 − 3,060 − 1,886 4,412 4,369 43 − 357 − 2 2002
80 − 323 22,092 15,580 9,509 7,072 − 1,001 6,508 6,375 133 3 1 2003− 605 − 419 34,316 5,512 8,828 − 321 − 2,994 27,902 28,101 − 199 835 67 2004− 1,690 − 501 19,595 7,107 − 5,214 13,509 − 1,188 11,719 11,674 45 844 − 75 2005
of which: Denmark − 111 − 15 743 828 851 − 23 − − 129 − 128 − 1 44 1 2002
69 − 20 − 504 − 496 − 479 − 17 − 18 18 0 − 25 − 1 200316 − 75 752 759 772 − 13 − 0 − 41 − 41 0 30 4 2004
− 123 − 110 724 803 873 − 70 − 33 34 − 1 − 112 − 2 2005
sector of the creditor or the debtor. — 3 Excluding Bundesbank. — 4 Mainly granted and advance payments made in goods and service transactions. —TARGET balances. — 5 Assets and liabilities arising from credit terms 6 Also includes long-term bank deposits of foreign non-banks.
93

DEUTSCHEBUNDESBANKE U R O S Y S T E M
Balance of paymentsby regionAugust 2006
I Balance of payments of the Federal Republic of Germany
8 Financial transactions with non-residents o(c) Other investment (cont’d) +
€ million
Other German investment abroad (increase/capital exports: −)
Loans 1,2 Bank deposits
Monetary MonetaryBalance of financial Enterprises financial Enterprisesother institu- and General Bundes- institu- and General Bundes-
Year investment Total Total tions 3 households government bank Total tions 3 households government bank 4
Poland
2002 − 919 − 370 − 295 − 69 − 279 53 − 2 − 2 − −2003 − 443 329 347 29 246 71 − 1 − 1 − −2004 346 − 705 − 561 − 605 − 80 124 − 5 − 5 − −2005 806 − 106 197 − 1,006 11 1,192 − − 1 − − 1 − −
Sweden
2002 632 − 1,987 − 1,856 − 1,842 − 14 − − − 41 − 1 − 40 − 0 −2003 − 1,600 1,253 1,760 1,775 − 21 6 − − 533 1 − 534 − 0 −2004 − 2,654 − 8,419 − 8,760 − 8,707 − 53 − 0 − 456 1 455 0 −2005 7,285 5,265 5,304 5,251 53 0 − 2 − 1 3 0 −
United Kingdom
2002 − 22,438 − 40,617 − 32,327 − 30,285 − 2,017 − 25 − − 8,571 − 4 − 8,175 − 392 −2003 − 51,141 − 75,219 − 63,077 − 62,428 − 645 − 4 − − 11,997 4 − 13,030 1,029 −2004 − 56,585 − 79,281 − 84,475 − 84,297 − 157 − 20 − 5,444 5 5,033 406 −2005 24,404 13,847 19,498 19,280 162 56 − − 4,335 0 − 3,694 − 641 −
Other European countries
2002 − 554 2,609 3,494 2,941 66 487 − − 526 10 − 536 − −2003 − 15,451 − 26,747 − 23,346 − 23,162 − 652 468 − − 3,043 15 − 3,048 − 10 −2004 405 1,530 1,095 555 − 31 571 − 689 26 653 10 −2005 14,269 − 6,960 − 6,625 − 11,658 28 5,005 − 1,338 − 13 1,351 − −
of which: Russian Federation
2002 3,399 1,702 1,783 1,299 − 25 508 − − 11 − − 11 − −2003 382 − 632 − 721 − 1,201 29 451 − 10 − 10 − −2004 854 − 1,454 − 1,299 − 1,866 5 562 − − 40 − − 40 − −2005 12,649 3,049 3,132 − 1,926 23 5,036 − 5 − 5 − −
Switzerland
2002 − 187 1,537 2,293 2,226 68 − 1 − − 542 11 − 553 − −2003 − 13,584 − 14,856 − 13,800 − 13,268 − 530 − 1 − − 816 14 − 830 0 −2004 2,996 5,276 5,374 5,726 − 351 − 1 − 56 25 31 − −2005 6,382 − 1,149 − 1,176 − 1,024 − 86 − 66 − 1,022 − 12 1,034 − −
Africa
2002 − 475 40 219 351 − 120 − 11 − 17 − 17 − −2003 1,582 − 0 20 − 485 104 401 − 29 − 29 − −2004 3,609 528 540 363 − 8 185 − − 4 − − 4 − −2005 7,548 − 218 140 − 488 62 565 − − 4 − − 4 − −
America
2002 − 39,499 − 25,111 − 24,412 − 24,722 271 40 − − 953 − 17 − 936 − −2003 − 28,766 − 16,389 − 12,732 − 12,408 − 333 9 − − 4,369 − 3 − 4,366 − −2004 − 17,277 495 535 726 − 254 63 − 355 12 347 − 3 −2005 − 50,125 − 34,146 − 33,387 − 33,914 510 17 − 2,199 9 2,250 − 59 −
of which: Canada
2002 27 − 141 − 49 − 35 − 13 − 0 − − 79 − 3 − 76 − −2003 990 248 404 397 7 0 − − 254 1 − 255 − −2004 − 793 − 564 − 498 − 119 − 379 − − − 50 1 − 49 − 2 −2005 − 1,306 − 1,476 − 1,537 − 1,525 − 12 − − 78 1 76 2 −
o For the classification of countries into groups of countries, see list of debtor. — 1 Credits, borrowers’ note loans, assets acquired by way of assign-countries on pp 104−105. — + Sector classification by domestic creditor or ment and similar. — 2 The data are broken down by the domestic
94

DEUTSCHEBUNDESBANK
Balance of paymentsby regionAugust 2006
I Balance of payments of the Federal Republic of Germany
Other foreign investment in Germany (increase/capital imports: + )
Loans 1,2 Bank deposits
Monetary MonetaryTrade Other financial Enterprises General financial Trade Othercredits, investment, institu- and govern- institu- Bundes- credits, investment,total 5 total 2 Total Total tions 3,6 households ment Total tions 3 bank total 5 total 2 Year
Poland − 53 − 24 − 550 − 501 − 488 − 12 − − 110 − 110 0 61 − 0 2002
5 − 24 − 772 − 792 − 797 5 − 28 29 − 1 − 7 − 1 2003− 23 − 127 1,052 871 884 − 13 − 43 43 − 0 138 − 0 2004− 264 − 37 912 680 691 − 11 − 167 167 − 0 66 − 1 2005
Sweden − 92 2 2,619 2,264 2,042 222 − 272 274 − 2 84 − 1 2002
35 − 8 − 2,853 − 3,040 − 2,545 − 495 − 284 283 1 − 97 − 0 2003− 108 − 7 5,764 2,867 2,849 − 12 30 2,830 2,831 − 1 69 − 2 2004− 62 21 2,021 3,575 3,442 148 − 15 − 1,642 − 1,642 0 89 − 0 2005
United Kingdom
292 − 10 18,179 15,090 18,773 − 3,320 − 363 3,645 3,645 0 − 556 − 0 200258 − 203 24,078 17,973 10,805 7,161 8 6,272 6,272 − 0 − 169 2 2003
− 81 − 169 22,696 − 1,179 302 − 368 − 1,113 23,724 23,724 0 85 66 2004− 955 − 362 10,558 − 3,980 − 15,814 12,865 − 1,032 13,856 13,857 − 1 749 − 68 2005
Other European countries − 200 − 160 − 3,163 − 1,863 − 2,384 609 − 88 − 1,584 − 1,358 − 226 288 − 4 2002− 215 − 143 11,297 7,930 7,431 597 − 98 3,457 3,412 45 − 88 − 3 2003
119 − 372 − 1,125 − 86 544 − 329 − 300 − 1,823 − 1,956 133 541 242 2004− 992 − 680 21,229 16,601 16,950 − 346 − 2 3,608 3,753 − 145 977 42 2005
of which: Russian Federation − 70 0 1,698 1,273 1,258 16 − 133 133 0 291 1 2002
80 − 0 1,014 880 895 − 15 − − 68 − 68 0 203 − 0 2003− 114 − 0 2,308 2,442 2,453 − 11 − 19 19 − − 152 − 0 2004− 86 − 3 9,600 9,040 8,664 376 − 19 19 − 541 − 0 2005
Switzerland − 64 − 150 − 1,724 − 606 − 1,195 677 − 88 − 1,198 − 1,196 − 2 99 − 18 2002− 157 − 84 1,272 − 1,981 − 1,721 − 162 − 98 3,633 3,633 0 − 364 − 17 2003
89 − 243 − 2,279 − 271 295 − 504 − 62 − 2,302 − 2,305 3 318 − 25 2004− 557 − 438 7,531 5,088 4,787 252 49 2,214 2,217 − 3 247 − 17 2005
Africa − 57 − 139 − 515 − 460 − 435 − 26 − 133 175 − 42 − 186 − 1 2002
412 − 462 1,582 1,019 1,048 − 29 − 303 275 28 262 − 2 200333 − 41 3,081 2,620 2,600 19 1 141 127 14 322 − 2 2004
− 494 139 7,767 7,440 7,430 10 − 586 494 92 − 257 − 3 2005
America
218 36 − 14,388 − 7,242 − 6,873 − 317 − 51 − 6,843 − 7,768 925 − 359 55 2002988 − 276 − 12,376 − 19,593 − 20,753 1,198 − 39 7,402 5,718 1,684 − 186 2 2003168 − 563 − 17,772 − 16,727 − 19,226 2,352 147 − 644 1,833 − 2,477 − 391 − 10 2004
− 1,522 − 1,437 − 15,979 − 16,163 − 16,060 − 211 108 − 267 − 687 421 401 49 2005
of which: Canada − 10 − 4 168 109 − 124 233 − 59 62 − 3 1 − 1 2002
107 − 8 743 745 615 130 − 8 7 1 − 10 − 1 2003− 12 − 3 − 229 − 158 − 527 369 − − 106 − 105 − 1 38 − 3 2004− 8 − 9 169 75 128 − 53 − 16 16 − 0 82 − 4 2005
sector of the creditor or the debtor. — 3 Excluding Bundesbank. — 4 Mainly granted and advance payments made in goods and service transactions. —TARGET balances. — 5 Assets and liabilities arising from credit terms 6 Also includes long-term bank deposits of foreign non-banks.
95
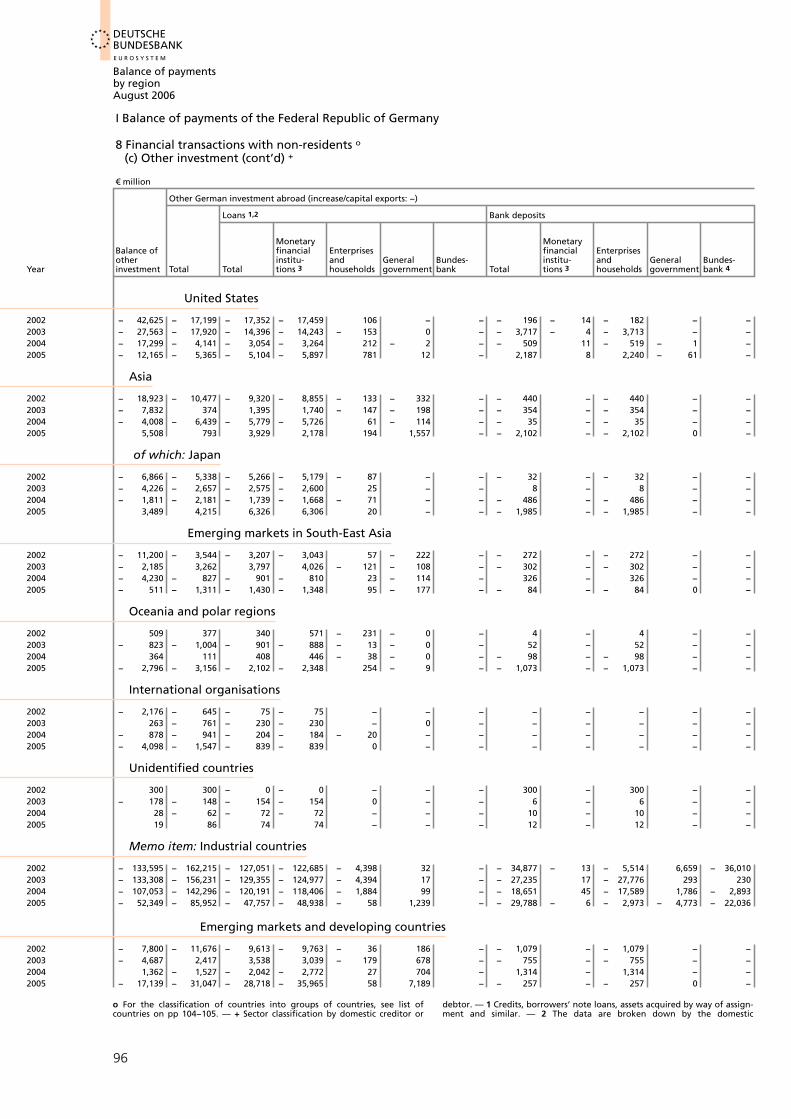
DEUTSCHEBUNDESBANKE U R O S Y S T E M
Balance of paymentsby regionAugust 2006
I Balance of payments of the Federal Republic of Germany
8 Financial transactions with non-residents o(c) Other investment (cont’d) +
€ million
Other German investment abroad (increase/capital exports: −)
Loans 1,2 Bank deposits
Monetary MonetaryBalance of financial Enterprises financial Enterprisesother institu- and General Bundes- institu- and General Bundes-
Year investment Total Total tions 3 households government bank Total tions 3 households government bank 4
United States
2002 − 42,625 − 17,199 − 17,352 − 17,459 106 − − − 196 − 14 − 182 − −2003 − 27,563 − 17,920 − 14,396 − 14,243 − 153 0 − − 3,717 − 4 − 3,713 − −2004 − 17,299 − 4,141 − 3,054 − 3,264 212 − 2 − − 509 11 − 519 − 1 −2005 − 12,165 − 5,365 − 5,104 − 5,897 781 12 − 2,187 8 2,240 − 61 −
Asia
2002 − 18,923 − 10,477 − 9,320 − 8,855 − 133 − 332 − − 440 − − 440 − −2003 − 7,832 374 1,395 1,740 − 147 − 198 − − 354 − − 354 − −2004 − 4,008 − 6,439 − 5,779 − 5,726 61 − 114 − − 35 − − 35 − −2005 5,508 793 3,929 2,178 194 1,557 − − 2,102 − − 2,102 0 −
of which: Japan
2002 − 6,866 − 5,338 − 5,266 − 5,179 − 87 − − − 32 − − 32 − −2003 − 4,226 − 2,657 − 2,575 − 2,600 25 − − 8 − 8 − −2004 − 1,811 − 2,181 − 1,739 − 1,668 − 71 − − − 486 − − 486 − −2005 3,489 4,215 6,326 6,306 20 − − − 1,985 − − 1,985 − −
Emerging markets in South-East Asia
2002 − 11,200 − 3,544 − 3,207 − 3,043 57 − 222 − − 272 − − 272 − −2003 − 2,185 3,262 3,797 4,026 − 121 − 108 − − 302 − − 302 − −2004 − 4,230 − 827 − 901 − 810 23 − 114 − 326 − 326 − −2005 − 511 − 1,311 − 1,430 − 1,348 95 − 177 − − 84 − − 84 0 −
Oceania and polar regions
2002 509 377 340 571 − 231 − 0 − 4 − 4 − −2003 − 823 − 1,004 − 901 − 888 − 13 − 0 − 52 − 52 − −2004 364 111 408 446 − 38 − 0 − − 98 − − 98 − −2005 − 2,796 − 3,156 − 2,102 − 2,348 254 − 9 − − 1,073 − − 1,073 − −
International organisations
2002 − 2,176 − 645 − 75 − 75 − − − − − − − −2003 263 − 761 − 230 − 230 − 0 − − − − − −2004 − 878 − 941 − 204 − 184 − 20 − − − − − − −2005 − 4,098 − 1,547 − 839 − 839 0 − − − − − − −
Unidentified countries
2002 300 300 − 0 − 0 − − − 300 − 300 − −2003 − 178 − 148 − 154 − 154 0 − − 6 − 6 − −2004 28 − 62 − 72 − 72 − − − 10 − 10 − −2005 19 86 74 74 − − − 12 − 12 − −
Memo item: Industrial countries
2002 − 133,595 − 162,215 − 127,051 − 122,685 − 4,398 32 − − 34,877 − 13 − 5,514 6,659 − 36,0102003 − 133,308 − 156,231 − 129,355 − 124,977 − 4,394 17 − − 27,235 17 − 27,776 293 2302004 − 107,053 − 142,296 − 120,191 − 118,406 − 1,884 99 − − 18,651 45 − 17,589 1,786 − 2,8932005 − 52,349 − 85,952 − 47,757 − 48,938 − 58 1,239 − − 29,788 − 6 − 2,973 − 4,773 − 22,036
Emerging markets and developing countries
2002 − 7,800 − 11,676 − 9,613 − 9,763 − 36 186 − − 1,079 − − 1,079 − −2003 − 4,687 2,417 3,538 3,039 − 179 678 − − 755 − − 755 − −2004 1,362 − 1,527 − 2,042 − 2,772 27 704 − 1,314 − 1,314 − −2005 − 17,139 − 31,047 − 28,718 − 35,965 58 7,189 − − 257 − − 257 0 −
o For the classification of countries into groups of countries, see list of debtor. — 1 Credits, borrowers’ note loans, assets acquired by way of assign-countries on pp 104−105. — + Sector classification by domestic creditor or ment and similar. — 2 The data are broken down by the domestic
96
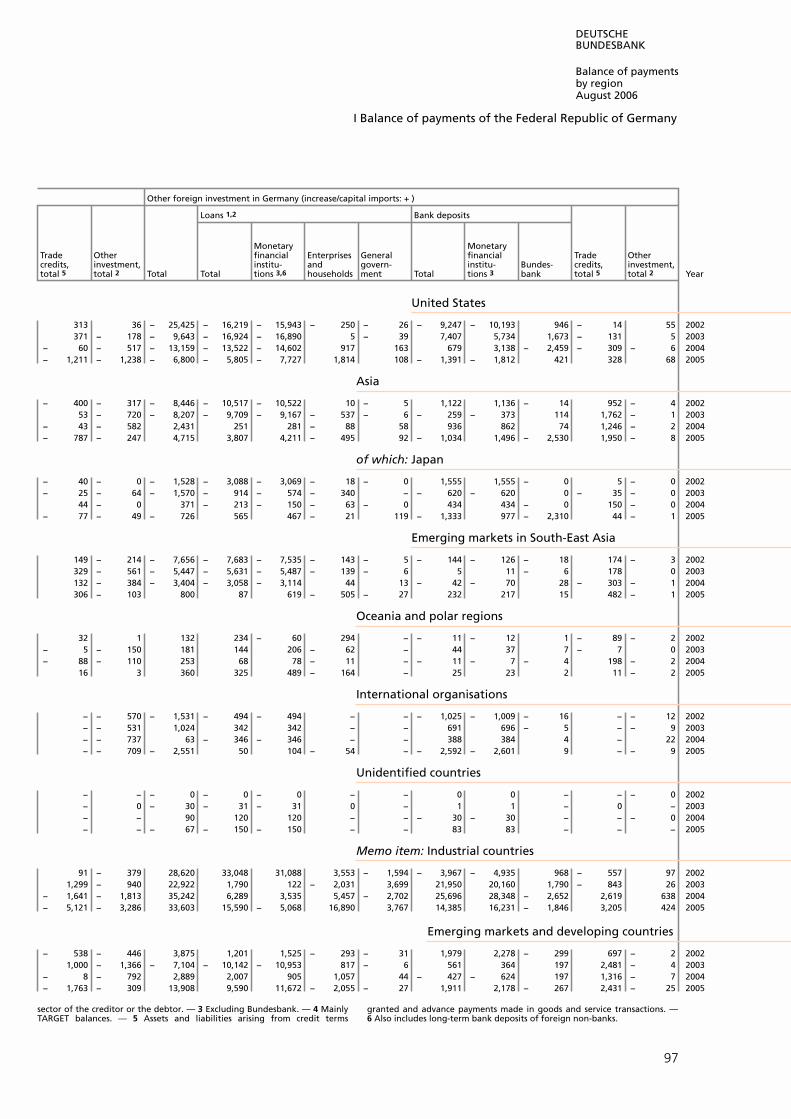
DEUTSCHEBUNDESBANK
Balance of paymentsby regionAugust 2006
I Balance of payments of the Federal Republic of Germany
Other foreign investment in Germany (increase/capital imports: + )
Loans 1,2 Bank deposits
Monetary MonetaryTrade Other financial Enterprises General financial Trade Othercredits, investment, institu- and govern- institu- Bundes- credits, investment,total 5 total 2 Total Total tions 3,6 households ment Total tions 3 bank total 5 total 2 Year
United States
313 36 − 25,425 − 16,219 − 15,943 − 250 − 26 − 9,247 − 10,193 946 − 14 55 2002371 − 178 − 9,643 − 16,924 − 16,890 5 − 39 7,407 5,734 1,673 − 131 5 2003
− 60 − 517 − 13,159 − 13,522 − 14,602 917 163 679 3,138 − 2,459 − 309 − 6 2004− 1,211 − 1,238 − 6,800 − 5,805 − 7,727 1,814 108 − 1,391 − 1,812 421 328 68 2005
Asia − 400 − 317 − 8,446 − 10,517 − 10,522 10 − 5 1,122 1,136 − 14 952 − 4 2002
53 − 720 − 8,207 − 9,709 − 9,167 − 537 − 6 − 259 − 373 114 1,762 − 1 2003− 43 − 582 2,431 251 281 − 88 58 936 862 74 1,246 − 2 2004− 787 − 247 4,715 3,807 4,211 − 495 92 − 1,034 1,496 − 2,530 1,950 − 8 2005
of which: Japan − 40 − 0 − 1,528 − 3,088 − 3,069 − 18 − 0 1,555 1,555 − 0 5 − 0 2002− 25 − 64 − 1,570 − 914 − 574 − 340 − − 620 − 620 0 − 35 − 0 2003
44 − 0 371 − 213 − 150 − 63 − 0 434 434 − 0 150 − 0 2004− 77 − 49 − 726 565 467 − 21 119 − 1,333 977 − 2,310 44 − 1 2005
Emerging markets in South-East Asia
149 − 214 − 7,656 − 7,683 − 7,535 − 143 − 5 − 144 − 126 − 18 174 − 3 2002329 − 561 − 5,447 − 5,631 − 5,487 − 139 − 6 5 11 − 6 178 0 2003132 − 384 − 3,404 − 3,058 − 3,114 44 13 − 42 − 70 28 − 303 − 1 2004306 − 103 800 87 619 − 505 − 27 232 217 15 482 − 1 2005
Oceania and polar regions
32 1 132 234 − 60 294 − − 11 − 12 1 − 89 − 2 2002− 5 − 150 181 144 206 − 62 − 44 37 7 − 7 0 2003− 88 − 110 253 68 78 − 11 − − 11 − 7 − 4 198 − 2 2004
16 3 360 325 489 − 164 − 25 23 2 11 − 2 2005
International organisations
− − 570 − 1,531 − 494 − 494 − − − 1,025 − 1,009 − 16 − − 12 2002− − 531 1,024 342 342 − − 691 696 − 5 − − 9 2003− − 737 63 − 346 − 346 − − 388 384 4 − 22 2004− − 709 − 2,551 50 104 − 54 − − 2,592 − 2,601 9 − − 9 2005
Unidentified countries
− − − 0 − 0 − 0 − − 0 0 − − − 0 2002− 0 − 30 − 31 − 31 0 − 1 1 − 0 − 2003− − 90 120 120 − − − 30 − 30 − − − 0 2004− − − 67 − 150 − 150 − − 83 83 − − − 2005
Memo item: Industrial countries
91 − 379 28,620 33,048 31,088 3,553 − 1,594 − 3,967 − 4,935 968 − 557 97 20021,299 − 940 22,922 1,790 122 − 2,031 3,699 21,950 20,160 1,790 − 843 26 2003
− 1,641 − 1,813 35,242 6,289 3,535 5,457 − 2,702 25,696 28,348 − 2,652 2,619 638 2004− 5,121 − 3,286 33,603 15,590 − 5,068 16,890 3,767 14,385 16,231 − 1,846 3,205 424 2005
Emerging markets and developing countries − 538 − 446 3,875 1,201 1,525 − 293 − 31 1,979 2,278 − 299 697 − 2 2002
1,000 − 1,366 − 7,104 − 10,142 − 10,953 817 − 6 561 364 197 2,481 − 4 2003− 8 − 792 2,889 2,007 905 1,057 44 − 427 − 624 197 1,316 − 7 2004− 1,763 − 309 13,908 9,590 11,672 − 2,055 − 27 1,911 2,178 − 267 2,431 − 25 2005
sector of the creditor or the debtor. — 3 Excluding Bundesbank. — 4 Mainly granted and advance payments made in goods and service transactions. —TARGET balances. — 5 Assets and liabilities arising from credit terms 6 Also includes long-term bank deposits of foreign non-banks.
97

DEUTSCHEBUNDESBANKE U R O S Y S T E M
Balance of paymentsby regionAugust 2006
II Supplementary data on the balance of payments 1 Merchanting trade with non-residents *
(a) By group of countries and country o € million
Sales/receipts Purchases/expenditure
Group of countries/country 1 2002 2003 2004 2005 2002 2003 2004 2005
All countries 94,174 67,162 74,447 102,974 90,484 65,295 70,675 98,015
Europe 63,062 43,740 49,649 71,154 56,768 41,318 47,134 70,224
EU member states (25) 55,967 37,070 40,321 59,837 49,125 34,061 38,289 58,434
Euro-area member states 24,662 20,445 23,646 35,240 20,378 17,305 21,299 24,026
Belgium 2,020 1,703 2,502 3,172 4,150 4,302 6,282 6,863Finland 263 411 402 583 168 169 170 195France 9,236 5,789 5,494 9,495 6,727 3,752 3,280 5,629Greece 396 329 423 504 125 96 136 185Ireland 481 377 455 525 227 258 329 393Italy 4,467 4,168 4,183 4,752 1,775 1,980 1,747 1,970Luxembourg 540 547 1,731 1,169 578 417 1,419 1,086Netherlands 2,755 2,363 3,304 7,364 1,690 1,974 2,653 2,993Austria 1,289 1,213 1,381 1,633 761 426 524 766Portugal 1,043 1,085 642 846 1,620 1,020 1,094 779Spain 2,170 2,461 3,129 5,197 2,556 2,913 3,664 3,167
Other EU member states 31,306 16,625 16,675 24,597 28,747 16,756 16,990 34,408
Denmark 413 377 627 661 202 235 236 300Estonia 21 19 40 84 2 10 14 13Latvia 23 43 49 83 16 16 26 36Lithuania 48 36 51 122 52 62 64 100Malta 35 15 14 21 42 29 59 24Poland 793 667 827 957 386 469 1,776 1,981Sweden 448 583 652 849 210 167 184 167Slovakia 203 249 281 268 1,128 2,112 1,677 2,392Slovenia 135 136 122 136 30 53 35 31Czech Republic 296 349 664 682 653 761 1,056 1,095Hungary 335 383 635 775 396 346 634 550United Kingdom 28,315 13,653 12,507 19,853 25,308 12,356 11,058 27,474Cyprus 240 114 206 106 324 139 170 246EU organisations (excluding ECB) − − − − − − − −
Other European countries 7,094 6,670 9,328 11,318 7,643 7,257 8,845 11,790
of which: Bulgaria 62 73 70 74 51 41 91 70Norway 271 237 325 365 448 195 183 116Romania 154 200 255 271 115 138 114 162Russian Federation 851 1,423 2,171 2,761 1,119 1,062 1,935 3,269Switzerland 4,809 3,442 4,173 4,889 4,860 4,391 5,168 6,923Turkey 444 813 1,797 2,363 315 375 610 595
Africa 3,062 2,307 2,494 2,421 3,894 2,317 2,599 2,450
America 15,813 11,305 11,929 15,102 18,240 13,168 11,463 13,293
North America 13,538 9,276 8,095 9,878 15,101 10,015 7,339 8,393
of which: Canada 569 309 430 944 797 328 318 760United States 12,968 8,967 7,666 8,934 14,304 9,687 7,021 7,633
Central America 1,109 1,047 2,258 2,939 1,493 1,599 2,138 2,155
of which: Mexico 387 381 592 663 517 451 439 500
South America 1,167 982 1,576 2,285 1,646 1,554 1,986 2,746
of which: Argentina 85 118 213 166 211 233 531 1,180Brazil 458 580 752 658 781 746 839 646Chile 48 61 56 58 46 35 35 29
Asia 9,541 8,698 9,255 12,662 9,023 7,502 8,631 10,856
Near and Middle Eastern countries 1,565 1,854 1,958 2,654 740 446 670 683
Other Asian countries 7,976 6,844 7,297 10,008 8,283 7,057 7,961 10,173
of which: Japan 1,179 1,128 1,328 1,343 2,358 1,981 2,553 2,149China, People’s Republic of 963 1,169 908 1,204 1,118 959 986 1,050Emerging markets in South-East Asia 5,394 4,064 4,471 6,616 4,233 3,589 3,551 6,517
of which: Hong Kong 952 1,111 903 979 728 1,310 1,036 1,412Korea, Republic of 541 688 822 1,159 570 496 951 1,638Singapore 2,957 1,460 1,711 2,816 2,058 763 612 1,894Taiwan 345 278 359 319 124 90 217 148
Oceania and polar regions 2,696 1,111 1,120 1,635 2,560 989 848 1,191
Unidentified countries − − − − − − − −
Memo item: Industrial countries 78,930 53,131 57,202 80,355 75,156 52,486 55,086 77,854
Emerging markets and developing countries 15,244 14,031 17,244 22,619 15,329 12,809 15,589 20,161
Opec countries 1,861 1,957 2,315 2,766 1,509 868 1,214 1,124
o For the classification of countries into groups of countries, see list of ment operations. — 1 Country in which the foreign payee or payer iscountries on pp 104−105. — * Resident enterprises’ purchases of goods from domiciled. The regional balances of sales and purchases cannot be com-and resales of goods to non-residents are designated as “merchanting pared with the breakdown of the balance of merchanting trade by group oftrade”. The statistical recording of merchanting trade links up with the pay- countries and country in the balance of payments (Table I.4 ); the balance of
98

DEUTSCHEBUNDESBANK
Balance of paymentsby regionAugust 2006
II Supplementary data on the balance of payments 1 Merchanting trade with non-residents *
(b) By category of goods € million
Sales/receipts Purchases/expenditure
Category of goods 2 2002 2003 2004 2005 2002 2003 2004 2005
I By payment flow
Total 94,174 67,162 74,447 102,974 90,484 65,295 70,675 98,015
Cereals and cereal residues 2,751 2,644 3,626 2,789 2,539 2,487 2,982 2,327
Products of vegetable and animal origin,food, beverages, tobacco 3,398 3,187 3,698 4,861 2,993 3,098 3,098 4,123
Minerals, ores, coal 365 291 305 458 316 345 394 489
Petroleum and mineral oil 6,683 6,917 8,792 22,459 6,892 7,054 8,857 24,141
Products of the chemical industry, plastics,natural rubber 9,438 9,433 13,829 14,964 6,987 8,352 11,104 12,453
Hides, leather, wood, paper, spun fabrics,clothing, shoes 1,390 1,319 1,445 1,422 1,212 1,155 1,238 1,226
Stone products, gypsum, cement, glass andglassware 94 97 148 176 119 135 203 259
Pearls, precious stones, precious metals, coins 45,012 18,433 14,435 23,212 44,937 18,730 14,034 22,368
Iron, steel, iron and steel products 3,440 3,835 5,465 5,666 3,052 3,655 5,058 5,339
Non-ferrous metals and goods made thereof, tools 2,149 795 613 736 2,012 772 562 611
Machinery, equipment, vehicles, optical goods 18,832 19,763 21,349 25,418 17,611 18,071 21,340 22,685
Miscellaneous goods (furniture, toys,sports equipment, etc) 249 192 258 248 291 193 260 233
Incidental expenses 3 373 256 484 564 1,522 1,249 1,547 1,762
II By net result 4
Total 7,430 4,691 6,775 7,683 3,741 2,825 3,004 2,724
Cereals and cereal residues 745 376 698 400 664 316 159 17
Products of vegetable and animal origin,food, drink, tobacco 504 187 555 602 240 218 61 −
Minerals, ores, coal 54 8 29 25 12 70 126 64
Petroleum and mineral oil 128 92 157 70 511 376 391 2,131
Products of the chemical industry, plastics,natural rubber 2,465 1,165 2,561 2,332 174 257 14 −
Hides, leather, wood, paper, spun fabrics,clothing, shoes 179 167 211 197 − 3 4 0
Stone products, gypsum, cement, glass andglassware 3 5 13 6 27 42 68 89
Pearls, precious stones, precious metals, coins 1,866 651 727 1,104 1,806 948 325 259
Iron, steel, iron and steel products 311 218 382 287 − 115 67 43
Non-ferrous metals and goods made thereof, tools 179 50 68 127 42 27 16 2
Machinery, equipment, vehicles, optical goods 983 1,752 1,344 2,501 208 431 1,736 101
Miscellaneous goods (furniture, toys,sports equipment, etc) 15 21 32 32 58 21 34 17
payments includes only such net receipts of German merchanting traders as by or to merchanting traders for services of different kinds which are notare to be regionally attributed to purchasing countries. — 2 The categories attributable to individual merchanting trade transactions. — 4 Monthlyof goods were formed by combining related items on the list of goods for surplus or deficit for the category of goods concerned. the official external trade statistics. — 3 Incidental expenses are payments
99

DEUTSCHEBUNDESBANKE U R O S Y S T E M
Balance of paymentsby regionAugust 2006
II Supplementary data on the balance of payments 2 Transfers between the Federal Republic of Germany and the
European Communities in connection with the EU budget * € million
Item 2000 2001 2002 2003 2004 2005
Net contribution of the Federal Republic
of Germany to the EU budget 1 − 12,742 − 9,977 − 7,436 − 9,653 − 8,754 − 9,788
Transfers to the EU budget, total 22,226 20,138 18,915 21,100 20,082 22,166
Own receipts of the EU, total 22,163 20,039 18,862 21,099 19,776 21,930
Customs duties, levies under
the common agricultural policy 2 3,724 3,499 3,199 3,050 3,194 3,596
EU share in value added tax revenue 9,496 8,509 5,145 5,209 2,985 3,258
GNI-related financing 3 8,943 8,031 10,518 12,840 13,596 15,075
Other transfers, total 4 63 99 52 1 306 236
Transfers from the EU budget, total 1 9,484 10,161 11,479 11,446 11,329 12,378
Under the common agricultural policy, total 1 5,977 6,333 6,219 6,454 6,459 6,453
of which
Refunds on exports to third countries 715 568 494 456 470 726
Interventions in the single market 5,356 5,857 5,786 6,057 5,722 7,483
Food aid (refund element) 3 1 0 0 0 −
Refund of collection costs 5 372 350 1,234 763 799 899
Transfers under the structural policy regulations, total 3,134 3,478 4,026 4,230 4,071 5,026
EAGGF Guidance Section 6 623 464 504 560 582 639
Social fund 1,250 1,459 1,831 1,370 1,457 1,612
Regional fund 1,205 1,465 1,617 2,106 1,921 2,645
Fisheries guidance fund 30 15 13 25 16 −
Trans-European networks 13 69 55 142 95 130
Other 13 6 6 27 − −
* Payments from the EU budget, which are shown as combined figures here, cluding sugar levies. — 3 Additional EU receipt for the residual financing ofare mainly current transfers. Refunds of collection costs are regarded as re- the EU budget; it is calculated using the German share of total EU GNI. —ceipts from services in the balance of payments statistics; payments from the 4 Primarily co-responsibility and super levies for milk, milk products andregional fund and the guidance fund of the EAGGF are included under cereals. — 5 Refund of collection costs at 10% between 1988 and 2000; 25%capital transfers. — 1 Excluding special monetary compensation for exports from 2001 customs duties and levies in the context of the agricultural policy;to the United Kingdom and Italy. The monetary compensation amounts on back payments are included in August 2002. Since 1988 the memberthe imports of these countries from other EU countries are paid through the countries have retained this sum when transferring capital resources to theexporting and not (as is usual) through the importing member state. — 2 In- EU. — 6 Including direct payments by the EU to the final beneficiaries.
100

DEUTSCHEBUNDESBANK
Balance of paymentsby regionAugust 2006
II Supplementary data to the balance of payments 3 Supplementary data on current
and capital transfers Up to end-1998 DM million; from 1999 € million
Item 1998 1999 2000 2001 2002 2003 2004 2005
Country breakdown oftransfers by foreign workersto their home countries 1
Total 6,936 3,429 3,458 3,520 3,470 3,332 3,180 2,926
Greece 720 332 370 250 220 220 190 162Italy 850 384 300 300 240 300 297 282Portugal 300 143 140 140 120 120 88 64Former Yugoslavia 550 256 257 257 257 257 412 438Spain 420 204 220 220 300 300 200 79Turkey 2,400 1,227 1,200 1,200 1,200 1,000 879 837Other countries 1,696 883 971 1,153 1,133 1,135 1,113 1,063
Capital transfers 2
Total
to non-residents 4,540 2,985 3,506 2,452 2,434 2,548 2,237 4,736
from non-residents 5,829 2,831 1,907 2,065 2,223 2,861 2,668 3,468
Balance 1,289 − 154 − 1,599 − 387 − 212 312 430 − 1,268
Public
to non-residents, total 2,441 1,351 1,189 1,361 1,416 1,238 1,094 3,419
Capital refunds 2,299 1,249 1,118 1,359 1,218 956 1,044 1,187
Federal Government’s debt remission, total 142 102 71 2 199 282 50 2,232
of which
Egypt 2 0 − − − − − −Ethiopia 7 2 − − 3 1 12 1Bolivia − 4 − − 8 0 − −Bosnia-Herzegovina − − 50 − − − − −Côte d’Ivoire − 5 0 − − 12 − −Yemen − − − − − − − −Congo, DemRep − 1 − − − 142 − −Madagascar 9 1 − 0 0 8 − 15Mauritania 0 − 1 0 2 − − −Peru − 36 − − − − − −Poland 55 26 − − − − − −Zambia 20 17 16 − − 35 − 26Serbia and Montenegro − − − − 183 − − −Sierra Leone − − − − 0 0 0 −South Africa − 5 − − − − − −Togo 0 0 − − − − − −
Private
to non-residents 2,099 1,634 2,317 1,091 1,018 1,311 1,143 1,317
Inheritance, immigration 2,083 1,634 1,149 1,053 1,011 866 911 987
Debt remission 16 − 1,168 37 7 445 232 330
of which
Bulgaria − − − − − − − −Nicaragua 15 − − − − 26 135 −Poland − − − − − − − −Russian Federation − − 737 − − − − −Slovakia − − − − − − − −Czech Republic − − − − − − − −
from non-residents 5,829 2,831 1,907 2,065 2,223 2,861 2,668 3,468
of which
Inheritance, emigration 639 31 34 50 37 35 57 54
EU regional fund 5,059 2,183 1,828 1,929 2,121 2,666 2,503 3,284
1 Estimated, after allowing for currency exported by non-residents travel- vidual capital formation schemes and other transfers which lead to a break-ling home. — 2 As far as discernible. Investment grants, taxes under indi- down of savings and assets between residents and non-residents.
101

DEUTSCHEBUNDESBANKE U R O S Y S T E M
Balance of paymentsby regionAugust 2006
III External stocks
1 External position of the Bundesbank up to end-1998 *
DM million
Foreign reserves and other claims on non-residents Liabilities to non-residents
Foreign reserves
Reservepositionin theInter- Liabilitiesnational arising NetLiabilitiesMonetary arising from externalFund and Claims Loans and from Treasury position
End of Foreign special on the external discount (col 1other claimsreporting currency drawing ECB 2 on non- trans- liquidity lessperiod Total Total Gold rights (net) Total paper col 8)balances 1 residents 3 actions 4
1 2 3 4 5 6 7 8 9 10 11
1975 86,417 74,614 14,002 51,303 9,309 − 11,804 1,869 1,869 − 84,5481976 88,503 76,655 14,002 52,004 10,650 − 11,848 2,738 2,738 − 85,7661977 90,227 80,971 14,065 58,310 8,595 − 9,256 1,977 1,977 − 88,2491978 107,211 102,814 17,083 74,584 11,147 − 4,397 6,868 6,868 − 100,3431979 97,974 93,943 13,693 51,826 9,007 19,417 4,031 5,009 5,009 − 92,965
1980 83,007 78,972 13,687 42,624 8,100 14,561 4,034 15,579 10,215 − 67,4281981 80,304 76,716 13,688 37,272 9,186 16,571 3,588 11,419 11,419 − 68,8851982 86,939 84,483 13,688 38,981 12,219 19,596 2,456 15,387 15,387 − 71,5521983 84,009 81,554 13,688 37,819 14,603 15,444 2,456 14,101 14,101 − 69,9081984 84,079 81,623 13,688 37,500 16,094 14,341 2,456 15,152 15,152 − 68,927
1985 86,004 83,555 13,688 39,502 13,180 17,186 2,449 18,338 18,338 − 67,6661986 94,036 91,592 13,688 50,195 11,389 16,321 2,444 23,556 23,556 − 70,4801987 122,630 120,192 13,688 68,280 9,273 28,953 2,437 20,234 20,234 − 102,3961988 97,126 94,689 13,688 50,183 9,264 21,554 2,437 27,249 27,249 − 69,8771989 99,959 97,527 13,688 58,308 8,229 17,303 2,432 51,642 51,642 − 48,317
1990 106,446 104,023 13,688 64,517 7,373 18,445 2,423 52,259 52,259 − 54,1881991 97,345 94,754 13,688 55,424 8,314 17,329 2,592 42,335 42,335 − 55,0101992 143,959 141,351 13,688 85,845 8,199 33,619 2,608 26,506 26,506 − 117,4531993 122,763 120,143 13,688 61,784 8,496 36,176 2,620 39,541 23,179 16,362 83,2221994 115,965 113,605 13,688 60,209 7,967 31,742 2,360 24,192 19,581 4,611 91,774
1995 123,261 121,307 13,688 68,484 10,337 28,798 1,954 16,390 16,390 − 106,8711996 120,985 119,544 13,688 72,364 11,445 22,048 1,441 15,604 15,604 − 105,3811997 127,849 126,884 13,688 76,673 13,874 22,649 966 16,931 16,931 − 110,9181998 135,085 134,005 17,109 100,363 16,533 − 1,079 15,978 15,978 − 119,107
* Valuation of gold holdings and external assets in accordance with section Cooperation Fund (EMCF)). — 3 Including loans to the World Bank. —26 (2) of the Bundesbank Act and the provisions of the German Commercial 4 Including liquidity paper sold to non-residents by the Bundesbank;Code, in particular section 253. In the course of the year, valuation at the excluding Treasury discount liquidity paper sold to non-residents betweenpreceding year‘s balance sheet rates. — 1 Mainly US dollar assets. — March 1993 and March 1995 (shown in column 10). 2 European Central Bank (up to 1993 claims on the European Monetary
2 External position of the Bundesbank in European monetary union o
€ million
Foreign reserves and other external assets
Foreign reserves
Reserveposition
Otherin the Inter-national claims onMonetary Other residents Net externalFund and claims on Claims in other position of the
End of Gold special Foreign non-euro- within the euro-area BundesbankLiabilitiesreporting and gold drawing currency area Eurosystem member to non- (col 1 lessperiod Total Total rights reserves (net) 2 states col 9)receivables residents 1,3 residents 3
1 2 3 4 5 6 7 8 9 10
1999 141,958 93,039 32,287 8,332 52,420 9,162 39,746 11 6,179 135,779
2000 100,762 93,815 32,676 7,762 53,377 313 6,620 14 6,592 94,1702001 76,147 93,215 35,005 8,721 49,489 312 − 17,385 5 8,752 67,3962002 103,948 85,002 36,208 8,272 40,522 312 18,466 167 9,005 94,9422003 95,394 76,680 36,533 7,609 32,538 312 17,945 456 10,443 84,9512004 93,110 71,335 35,495 6,548 29,292 312 20,796 667 7,935 85,175
2005 130,268 86,181 47,924 4,549 33,708 350 42,830 906 6,285 123,983
o Assets and liabilities vis-à-vis all euro-area and non-euro-area member From November 2000 including the TARGET positions which were previouslystates. The stock figures are shown on the basis of revaluation at market shown (in columns 6 and 9) as bilateral assets and liabilities vis-à-vis nationalrates. — 1 Including loans to the World Bank. — 2 Including the balances in central banks outside the Eurosystem. — 3 See footnote 2. the Deutsche Bundesbank’s cross-border payments within the Eurosystem.
102

DEUTSCHEBUNDESBANK
Balance of paymentsby regionAugust 2006
III External stocks 3 Germany’s international investment position *
General survey € million
End of reporting period
2001 2002 2003 2004
Item Assets Liabilities Assets Liabilities Assets Liabilities Assets Liabilities
I Total (II to VI) 3,055,885 2,871,059 3,003,888 2,892,634 3,178,200 3,034,569 3,402,416 3,204,776
II Monetary financial institutions(excluding Bundesbank),total 1,248,963 1,437,482 1,332,674 1,467,755 1,433,154 1,475,785 1,596,211 1,568,410
Direct investment 1 66,121 8,911 64,393 10,257 67,023 9,658 58,002 10,473
Portfolio investment 310,343 452,491 317,179 521,673 343,109 565,659 412,185 641,087
of which
Shares 23,303 33,306 12,923 15,870 14,351 26,708 12,286 25,417
Bonds and notes 272,719 380,993 283,004 447,441 307,770 468,553 369,215 556,146
Loans, currency and deposits 2 870,964 975,206 949,489 934,952 1,021,325 899,595 1,123,872 915,930
of which: Short-term 485,572 661,481 562,359 635,445 627,398 619,713 744,352 652,311
Other investment 1,535 874 1,613 873 1,697 873 2,152 920
III Enterprises and households,total 1,679,957 977,036 1,523,628 892,538 1,607,672 1,010,357 1,668,694 1,002,409
Direct investment 559,193 464,062 510,333 494,505 508,750 509,413 496,009 485,547
Equity capital 1 441,734 197,766 410,685 223,895 410,180 256,320 384,945 270,373
Direct investment credit 3 51,738 261,371 21,525 265,785 7,020 248,466 4,106 210,453
Real property 65,721 4,925 78,123 4,825 91,550 4,627 106,958 4,721
Portfolio investment 796,857 322,181 712,198 210,050 752,636 294,576 806,749 305,614
of which
Shares 397,320 279,818 276,590 166,351 297,261 243,444 317,817 253,088
Mutual fund shares 129,591 17,095 118,374 18,186 134,936 16,898 150,065 19,491
Bonds and notes 268,747 18,059 313,828 18,355 316,164 19,874 333,177 19,454
Loans, currency and deposits 214,939 135,284 195,478 134,768 237,434 151,016 253,288 151,899
of which: Short-term 196,835 82,525 176,740 70,334 210,850 76,050 221,471 75,169
Trade credits 82,660 53,861 78,322 51,484 78,927 53,574 80,641 57,163
Other investment 26,308 1,648 27,297 1,731 29,925 1,778 32,007 2,186
IV General government,total 50,818 447,789 43,638 523,336 41,980 537,984 44,401 626,022
Securities − 432,352 − 505,389 − 520,943 − 606,907
Loans, currency and deposits 4 33,709 14,925 27,104 17,533 26,010 16,602 28,291 18,633
Other investment 17,109 512 16,534 414 15,970 439 16,110 482
V Bundesbank 76,147 8,752 103,948 9,005 95,394 10,443 93,110 7,935
Reserve assets 93,215 − 85,002 − 76,680 − 71,335 −
Other investment − 17,068 8,752 18,946 9,005 18,714 10,443 21,775 7,935
VI Other external liabilities − − − − − − − −
* From 1949 the asset and liability position is shown as a general survey, figures for equity capital and loans in the context of direct investment arefrom 1984 by currency; up to end−1998 Deutsche Mark/foreign currency; based mainly on the balance sheet for investment objects. — 1 Shares ofeuro/foreign currency, and by group of countries (classification of countries 10% or more in the capital of foreign or German enterprises (from 1999). —on the basis of the current position). Valuations are based on market prices; 2 Credits, borrowers’ note loans, bank balances, assets acquired by way ofthe positions denominated in foreign currencies therefore take due account assignment, etc. — 3 The presentation of direct investment credit includesof foreign exchange rates, and the securities positions also take account of lending of foreign subsidiaries to their German parent companies orstock market prices. Up to end−1998 the external position of the lending of German subsidiaries to their foreign parent companies (“reverseBundesbank is consistent with the valuations shown on the annual balance investment”). — 4 Liabilities: borrowers’ note loans. sheet; from 1999 the foreign reserves are valued at market prices. The
103

104
IV List of countries as in the regional breakdown of the balance of payments*
As at the start of 20061
I Europe
1 EU member states
1.1 Euro-area member states
Austria2
BelgiumFinlandFrance
(incl French Guiana, Guadeloupe,Martinique, Mayotte, Monaco,Reunion and St Pierre andMiquelon)
GreeceIrelandItalyLuxembourgNetherlandsPortugalSpain
(incl Canary Islands, Ceuta andMelilla)
European Central Bank
1.2 Other EU member states
CyprusCzech RepublicDenmarkEstoniaHungaryLatviaLithuaniaMaltaPolandSlovakiaSloveniaSwedenUnited Kingdom3
(Great Britain andNorthern Ireland)
EU organisations
European CommunitiesEuropean Economic
CommunityEuropean Atomic
Energy CommunityEuropean Coal and
Steel CommunityEuropean Investment Bank
2 Other European countries
AlbaniaAndorraBelarusBosnia and HerzegovinaBulgariaCroatiaFaroe IslandsGibraltarGuernsey4
Holy SeeIcelandIsle of Man4
Jersey4
LiechtensteinMacedonia,
Former Yugoslav Republic ofMoldova, Republic ofNorwayRomaniaRussian FederationSan MarinoSerbia and MontenegroSwitzerlandTurkeyUkraine
II Africa
AlgeriaAngolao
Benino
Botswanao
British Indian Ocean Territory(Chagos Archipelago)
Burkina Fasoo
Burundio
Cameroono
Cape Verdeo
Central African Republico
Chado
Comoroso
Congo, Democratic Republic of theo
Congo, Republic of theo
C�te d’Ivoireo
Djiboutio
EgyptEquatorial Guineao
Eritreao
Ethiopiao
Gabono
Gambiao
Ghanao
Guineao
Guinea-Bissauo
Kenyao
Lesothoo
Liberiao
Libyan Arab JamahiriyaMadagascaro
Malawio
Malio
Mauritaniao
Mauritiuso
MoroccoMozambiqueo
Namibiao
Nigero
Nigeriao
Rwandao
Saint HelenaS¼o Tom� and Principeo
Senegalo
Seychelleso
Sierra Leoneo
Somaliao
South Africao
Sudano
Swazilando
Tanzania, United Republic ofo
Togoo
TunisiaUgandao
Zambiao
Zimbabweo
III America
1 North America
CanadaGreenlandUnited States5
2 Central America
AnguillaAntigua and Barbudao
ArubaBahamaso
Barbadoso
Belizeo
BermudaCayman IslandsCosta RicaCubaDominicao
Dominican Republico
El SalvadorGrenadao
GuatemalaHaitio
HondurasJamaicao
MexicoMontserratNetherlands AntillesNicaraguaPanamaSaint Kitts and Neviso
Saint Luciao
Saint Vincent and the Grenadineso
Trinidad and Tobagoo
Turks and Caicos IslandsVirgin Islands, BritishVirgin Islands of the United States
3 South America
ArgentinaBoliviaBrazilChileColombiaEcuadorFalkland IslandsGuyanao
ParaguayPeruSurinameo
UruguayVenezuela
* Nomenclature according to the list of countries for the official foreign tradestatistics. — o ACP countries; countries in Africa, America, Oceania and polar
regions. — 1 Countries attributed to individual groups of countries accordingto the latest position at the beginning of the year. Changes occurring during
DEUTSCHEBUNDESBANKE U R O S Y S T E M
Balance of paymentsby regionAugust 2006

105
IV List of countries as in the regional breakdown of the balance of payments *
As at the start of 20061
IV Asia
1 Near and Middle Eastern countries
ArmeniaAzerbaijanBahrainGeorgiaIran, Islamic Republic ofIraqIsraelJordanKuwaitLebanonOccupied Palestinian TerritoriesOmanQatarSaudi ArabiaSyrian Arab RepublicUnited Arab EmiratesYemen
2 Other Asian countries
AfghanistanBangladeshBhutanCambodiaChina, People’s Republic ofIndiaJapanKazakhstanKorea, Democratic People’s Republic ofKyrgyzstanLaos, Democratic People’s Republic ofMacaoMaldivesMongoliaMyanmarNepalPakistanSri LankaTajikistanTimor-LesteTurkmenistanUzbekistanViet Nam
Emerging markets in South-East Asia
Brunei DarussalamHong KongIndonesiaKorea, Republic ofMalaysiaPhilippinesSingaporeTaiwanThailand
V Oceania and polar regions
American outlying islands, minorAmerican SamoaAntarcticaAustraliaBouvet IslandChristmas IslandsCocos Islands (Keeling Islands)Cook Islandso
Fijio
French Southern TerritoriesGuamHeard and McDonald IslandsKiribatio
Marshall Islandso
Micronesia, Federated States ofo
(Yap, Kosrae, Chuuk, Pohnpei)Nauruo
New CaledoniaNew ZealandNiueo
Norfolk IslandsNorthern Mariana IslandsPalauo
Papua New Guineao
Pitcairn IslandsPolynesia, FrenchSamoao
Solomon Islandso
South Georgia and SouthSandwich Islands
TokelauTongao
Tuvaluo
Vanuatuo
Wallis and Futuna
VI International organisations
All international organisations,excluding EU organisations
Supplementary data
Industrial countries
AndorraAustraliaAustria2
BelgiumCanadaCyprusCzech RepublicDenmarkEstoniaEuropean Atomic Energy CommunityEuropean Central BankEuropean Coal and Steel CommunityEuropean Economic CommunityEuropean Investment BankFaroe IslandsFinlandFranceGibraltarGreeceGreenland
Guernsey4
Holy SeeHungaryIcelandIrelandIsle of Man4
ItalyJapanJersey4
LatviaLiechtensteinLithuaniaLuxembourgMaltaNetherlandsNew ZealandNorwayPolandPortugalSan MarinoSlovakiaSloveniaSpainSwedenSwitzerlandTurkeyUnited Kingdom3
United States5
Emerging markets anddeveloping countries
All countries in Africa, America, Asia,Oceania and polar regions excluding
AustraliaCanadaGreenlandJapanNew ZealandUnited States5
plus
AlbaniaBelarusBosnia and HerzegovinaBulgariaCroatiaMacedonia,
Former Yugoslav Republic ofMoldova, Republic ofRomaniaRussian FederationSerbia and MontenegroUkraine
OPEC countries
AlgeriaIndonesiaIran, Islamic Republic ofIraqKuwaitLibyan Arab JamahiriyaNigeriaQatarSaudi ArabiaUnited Arab EmiratesVenezuela
the year cannot be taken into account until the following year. — 2 Up toend-2004 excluding Jungholz and Mittelberg. — 3 Up to end-2002 including
Guernsey, Jersey and Isle of Man. — 4 See footnote 3. — 5 Excluding VirginIslands of the United States.
DEUTSCHEBUNDESBANK
Balance of paymentsby regionAugust 2006

DEUTSCHEBUNDESBANKE U R O S Y S T E M
Balance of paymentsby regionAugust 2006
106

DEUTSCHEBUNDESBANK
Balance of paymentsby regionAugust 2006
107
Explanatory notes Balance of payments*
Contents of the balance of payments
The German balance of payments is a systematic presen-
tation of all economic transactions between residents
and non-residents in a given period. Pursuant to the prin-
ciple of double-entry accounting, each balance of pay-
ments transaction is reflected once with a positive and
once with a negative entry so that the balances of all
sub-accounts of the balance of payments add up to zero.
The breakdown of the balance of payments reflects the
economic character of the individual transactions.
Important sub-accounts are
1 Current account
2 Capital transfers
3 Financial account
The current account shows all movements of goods and
services to and from non-residents as well as income and
current transfer payments. In contrast to current trans-
fers, capital transfers comprise those unrequited transfers
which do not directly affect the income or expenditure of
the countries concerned (eg debt remission). The balance
on financial account including the change in the reserve
assets of the Bundesbank encompass all transactions
which change international financial positions (eg credit
balances, securities and participating interests).
The sub-accounts of the balance of payments are inter-
related. If the current account and capital transfers are
taken together, a surplus is associated with net capital ex-
ports in the financial account (capital exports: increase in
assets or decrease in liabilities vis-�-vis non-residents);
conversely, a deficit is associated with net capital imports
(capital import: decrease in assets or increase in liabilities
vis-�-vis non-residents). The breakdown of the financial
account including the change in the reserve assets of the
Bundesbank indicate which of Germany’s external assets
and liabilities have increased or decreased.
* An account of the methodological changes in the struc-ture of the balance of payments which were introducedafter December 1994 was published in Deutsche Bundes-bank, Changes in the methodology of the balance ofpayments, Monthly Report, March 1995, p 33-43.
DEUTSCHEBUNDESBANKE U R O S Y S T E M
Balance of paymentsby regionAugust 2006
108
The balance on financial account including the change in
the Bundesbank’s reserve assets is, by definition, equal to
the balance on current account plus the balance on cap-
ital transfers. In practice, however, there is no such cor-
respondence because transactions cannot always be cor-
rectly ascribed to the respective periods and because
there are gaps in the statistical coverage of all sub-
accounts (other than the reserve assets and other assets
and liabilities of the Bundesbank). All discrepancies are
reflected in the “balance of unclassifiable transactions”
(residual items).
From July 1990 the German balance of payments in-
cludes the transactions of the former GDR with non-resi-
dents.
Sources and legal bases
The Bundesbank is required to draw up the balance of
payments. The primary sources and legal bases of the
data are as follows.
1 Trade in goods
Special trade as in the foreign trade statistics of the
Federal Statistical Office, supplemented by, among
other things, warehouse transactions. The legal bases
of the foreign trade statistics are Council Regulation
(EC) No 638/04 on Community statistics relating to
the trading of goods between Member States, Coun-
cil Regulation (EC) No 1172/95 on the statistics relat-
ing to the trading of goods by the Community and its
Member States with non-member countries and the
Act on statistics on cross-border trade of 1 May 1957.
2 Services, income, current and capital transfers,
portfolio investment, long-term components of
direct investment and other long-term financial
transactions
Statistics of the Bundesbank on external payments
(Foreign Trade and Payments Act (Außenwirtschafts-
gesetz) of 28 April 1961, and supplementary provi-
sions, especially section 59 et seq of the Foreign Trade
and Payments Regulation (Außenwirtschaftsverord-
nung)), supplemented by estimates.
3 Short-term components of credit transactions,
reserve assets and other assets and liabilities of
the Bundesbank
Statistics of the Bundesbank on the external position
of banks (section 18 of the Bundesbank Act and sup-
plementary provisions) and on short-term external
assets and liabilities (financial operations and trade
credits, section 62 of the Foreign Trade and Payments
Regulation) of domestic non-banks. The change in
the reserve assets and other assets and liabilities of
the Bundesbank is computed from internal records of
the Bundesbank.
Frequency and publication of the figures
The German balance of payments is published monthly in
press releases of the Bundesbank, in its Monthly Report
and in the Statistical Supplement to the Monthly Report 3,
Balance of payments statistics; merchandise trade and
services are computed on the basis of “exports fob/
imports cif”, ie imports are shown at their value at the
German border. Monthly data with a minor time lag are
available in the customary international definition “ex-
ports fob/imports fob” (imports are shown at their value
at the border of the country of origin). Annual figures in
this definition with a relatively detailed regional break-
down are presented in this Special Statistical Publication.
Auditing policy for the balanceof payments and the internationalinvestment position
The timing and frequency of audits of the balance of pay-
ments and the international investment position are
chosen in line with users’ needs and the availability of the
data.
When the provisional balance of payments data are pub-
lished, the corresponding data of the previous reporting
month are revised (month-by-month revision). These cor-
rections take account of new foreign trade figures from
the Federal Statistical Office, late and revised reports on
foreign trade and payments from parties required to re-
port as well as other delayed information.
The figures from the previous reporting year and the
three preceding years are revised annually in the March
DEUTSCHEBUNDESBANK
Balance of paymentsby regionAugust 2006
109
issue of the Monthly Report. This annual revision general-
ly incorporates new information stemming from second-
ary sources and late reports, and provisional estimates are
revised or replaced. As a rule, methodological amend-
ments for earlier periods are likewise carried out in the
March issue.
Regional shifts in the balance of payments data may arise
in the Balance of payments by region published annually
in July. In addition, new data from secondary sources may
be included (as a rule, these are figures relating to foreign
trade and to expenditure on foreign travel in the previous
year).
In the case of the international investment position, the
data for the previous quarter are revised with the publica-
tion of the current reporting quarter. Owing to the avail-
ability of more detailed data sources, all quarterly figures
of the preceding year are revised in September with the
publication of the international investment position for
the preceding year-end. In addition, the quarterly and
year-end figures for the three preceding years are revised
and reconciled with the balance of payments figures. In
this connection further changes to the balance of pay-
ments data may likewise be necessary.
Unscheduled revisions of the balance of payments may
also be made in addition to those already mentioned. In
the event of fairly extensive revisions or the discovery of
serious errors, an assessment is made on a case-by-case
basis as to whether the analysis of the balance of pay-
ments is impaired as a result of the errors and therefore
whether a correction is necessary in the next publication
or whether it will suffice to make a correction at the next
regular revision date.
External stock statistics
The transactions shown in the balance of payments stat-
istics are augmented by stock statistics on the external
assets and liabilities of banks in Germany and of their for-
eign affiliates as well as on those of enterprises in Ger-
many and by the external position of the Bundesbank.
These stocks are published monthly in the Statistical Sup-
plement to the Monthly Report 3, Balance of payments
statistics. Together with the statistics on the level of direct
investment and completed by some other additional in-
formation, these provide the basis for computing Germa-
ny’s external asset and liability position. Being a survey of
assets and liabilities at a specific point in time, this corres-
ponds to the flow account of the balance of payments.
The balance on current account shows to what extent
current external transactions change the stock of external
assets and liabilities. In addition, the stocks are also af-
fected by capital transfers and by non-transaction-related
changes in value.
Germany’s external asset and liability position is based
mainly on stocks reported. Data on assets and liabilities in
the form of portfolio securities, however, are partly ob-
tained from cumulative transactions in the absence of ori-
ginal sources and are matched with the banks’ monthly
stock statistics and with the securities deposit statistics.
The informational value of the securities components of
the stock statistics and of the corresponding flow ac-
count is impaired on account of the globalisation of se-
curities transactions. The positions of private non-banks
cannot always be ascertained with the desired accuracy
from the existing reporting system. As the transactions
conducted abroad are not always reported, the value of
foreign securities held by residents (assets) is probably not
captured correctly. On the other hand, the holdings of
domestic securities ascribed to non-residents (liabilities)
may possibly be estimated incorrectly, since the figures
on purchases by non-residents include orders from resi-
dents placed abroad. To offset these recording gaps, pre-
liminary additional estimates are made on the basis of
the banks’ stock statistics and of the securities deposit
statistics. However, these are subject to some uncer-
tainty.
The external position of the Bundesbank and its asset
and liability position vis-�-vis non-residents can be found
in Part III of this publication.
From December 1990 Germany’s external asset and liabil-
ity position includes the external assets and liabilities of
credit institutions and enterprises in the former GDR.
Changeover to the accrual principlefor interest income
Since the annual revision in the Monthly Report of March
2005, interest income on debt securities and other debt

DEUTSCHEBUNDESBANKE U R O S Y S T E M
Balance of paymentsby regionAugust 2006
110
instruments shown under income in the current account
has been calculated in accordance with the accrual prin-
ciple. The figures have been calculated retroactively to
1971.
The IMF Balance of Payments Manual1 and the ECB
guideline2 stipulate that interest earned on debt secur-
ities (bonds and notes as well as money market instru-
ments) and other debt instruments should not be record-
ed in the current account only at the time of payment
but should be distributed evenly across the interest
period.3 In addition to recording interest as income in the
current account on an accrual basis, an offsetting entry is
required under the relevant instrument in the financial ac-
count pursuant to the principle of double-entry account-
ing. This captures the income-related increase in assets. If
interest is actually paid out, it is not recorded as income
in the current account; instead, a liquidation should be
recorded under the interest-bearing financial instrument
in the financial account, offsetting the payment flow.
Pursuant to the provisions of the IMF and the ECB, inter-
est is to be calculated on an accrual basis by applying
suitable reference rates to the relevant assets. The de-
tailed implementation of these provisions requires the se-
curities holdings to be shown on a security-by-security
basis. As the database needed for this is still being de-
veloped, the following procedures are being used as a
temporary solution.
A simplified back-calculation method was used to con-
vert interest payments statistics from the period between
1971 and the start of the past reporting year to accrual-
based statistics. The interest payments that were original-
ly recorded were divided equally across the immediately
preceding interest period, usually a 12-month period.
Thus, a monthly figure calculated on an accrual basis
comprises one-twelfth of the interest payments of the
month concerned and one-twelfth of the interest pay-
ments of each of the following eleven months.4
As no figures can be calculated yet for the previous year
using the aforementioned back-accounting prodcedure,
the interest income series has to be estimated using ag-
gregated stocks5 and reference rates. After one year the
interest flows calculated in this way for the previous year
can be adjusted using the back-accounting procedure.
For technical reasons, it has not yet been possible to
make the entries in the relevant financial instrument of
the financial account necessary to offset the interest
claims in the current account. Instead, the resulting dis-
crepancies between the financial account and the current
account have been recorded under the position of statis-
tically unclassifiable transactions (as a balancing item).
When the interest claims are replaced by the actual pay-
ment at the end of the interest period, these discrepan-
cies cancel each other out.
Further information can be found in Deutsche Bundes-
bank, German balance of payments in 2004, Monthly Re-
port, March 2005, pages 25-41.
1 IMF, Balance of Payments Manual, Fifth Edition, 1993.2 ECB, Guideline ECB/2004/15, 2004.3 Dividends are not subject to the accrual principle; in-stead, they must be recorded as of the dates on whichthey are payable.4 This is based on the assumption that the majority of se-curities considered have annual coupon dates. Only inthe case of money market instruments were three-monthly coupons assumed on the assets side and six-monthly coupons on the liabilities side.5 As an expedient, the monthly stock data were derivedfrom the annual international investment position andthe monthly balance of payments transactions.

DEUTSCHEBUNDESBANK
Balance of paymentsby regionAugust 2006
Special StatisticalPublications*
1 Banking statistics guidelines and custom-
er classification, July 20031
2 Bankenstatistik Kundensystematik Fir-
menverzeichnisse, June 20062,3
3 Aufbau der bankstatistischen Tabellen,
January 20003
4 Financial accounts for Germany 1991 to
2005, July 2006
5 Extrapolated results from financial state-
ments of German enterprises 1994 to
2003, March 2006
6 Ratios from annual accounts of German
enterprises 2002 and 2003, December
2005
7 Erl�uterungen zum Leistungsverzeichnis
f�r die Zahlungsbilanz, February 20053
8 Balance of payments statistics of the
Federal Republic of Germany, 2nd edi-
tion, February 1991o
9 Securities deposits, August 2005
111
* Except where otherwise indicated, these publicationsare available in both English and German, and on theinternet.o Not available on the internet.1 Solely available on the internet, updated at half-yearlyintervals. Only the sections “Monthly balance sheet stat-istics”, “External position” and “Customer classification”(“Overall survey on sectoral classification”, “Survey onbreakdown by industry or activity – Explanatory notes”and the relevant texts are available in English.2 Current version available on the internet only at quar-terly intervals.3 Available in German only.4 Only the headings and explanatory notes to the datacontained in the German originals are available in English.

DEUTSCHEBUNDESBANKE U R O S Y S T E M
Balance of paymentsby regionAugust 2006
112
10 International capital links, April 20054
11 Balance of payments by region,
August 2006
12 Technologische Dienstleistungen in der
Zahlungsbilanz, June 20063
For footnotes, see page 111.


