68
BALANCE OF PAYMENTS OF BULGARIA January - February 2013 16 April 2013

BALANCE OF PAYMENTS OF BULGARIA
January - February 2013
16 April 2013


TABLE OF CONTENTS
I. Balance of Payments (January – February 2013) ........................................................................................ 3
Direct Investment, January – February 2013. ......................................................................................... 7
Tables… ....................................................................................................................................................... 9
Balance of Payments, Analytic Presentation (comparison table) .......................................................... 10
Balance of Payments, Analytic Presentation (monthly data) ................................................................. 12
Balance of Payments, Analytic Presentation (quarterly data) ............................................................... 14
Balance of Payments, Analytic Presentation (annual data) ................................................................... 16
Balance of Payments, Standard Presentation (monthly data) ............................................................... 18
Balance of Payments, Standard Presentation (annual data) ................................................................. 20
Services ................................................................................................................................................ 22
Income .................................................................................................................................................. 23
Current and Capital Transfers ............................................................................................................... 24
Direct Investment .................................................................................................................................. 25
Portfolio Investment .............................................................................................................................. 26
Other Investment (Standard Presentation) ............................................................................................ 27
Geographical Breakdown ...................................................................................................................... 28
External Sector Indicators (table and graphs) ....................................................................................... 30
II. External Trade .......................................................................................................................................... 37
External Trade of Bulgaria (January 2013) ............................................................................................ 39
Contribution to the Change of Total Exports and Total Imports ............................................................ 42
Tables ................................................................................................................................................... 45
Exports (by End Use) ............................................................................................................................ 47
Exports (by Commodity Groups) ........................................................................................................... 48
Exports (by Main Trade Partners and Regions) .................................................................................... 49
Imports (by End Use) ............................................................................................................................ 50
Imports (by Commodity Groups) ........................................................................................................... 51
Imports (by Main Trade Partners and Regions) .................................................................................... 52
Methodological Notes on the Compilation of the Balance of Payments of Bulgaria ...................................... 53
External Sector Data, Published on the Internet Site of the BNB .................................................................. 63
1

2

BALANCE OF PAYMENTS1
February 2013
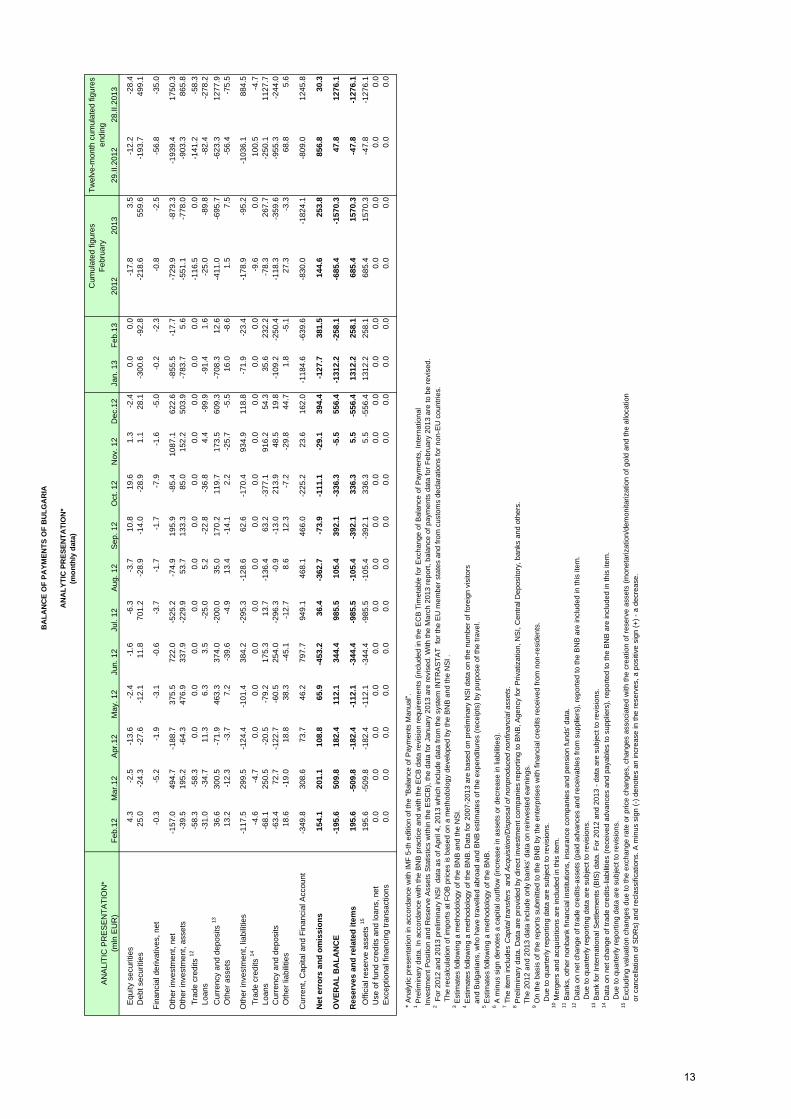
Current and Capital Account The current and capital account recorded a deficit of EUR 352.4 million in February 2013,
against a negative balance of EUR 348.4 million in February 2012. In January – February 2013 the
current and capital account was negative amounting to EUR 372.6 million (0.9% of GDP2)
against a deficit of EUR 598.1 million (1.5% of GDP) in January – February 2012.
Current Account The current account recorded a deficit of EUR 356.7 million, against a negative balance of
EUR 353 million in February 2012. The deficit on the current account was mainly due to the
negative trade balance (EUR 321.3 million). In January – February 2013 the current account was
negative and amounted to EUR 376.8 million (0.9% of GDP), its deficit decreasing by EUR 229.8
million from January – February 2012 (a deficit of EUR 606.5 million, 1.5% of GDP).
The trade balance recorded a deficit of EUR 321.3 million in February 2013, against a
deficit of EUR 303.7 million in February 2012. The trade balance deficit for January – February
2013 amounted to EUR 367.3 million (0.9% of GDP), decreasing by EUR 214.8 million from
January – February 2012 (a deficit of EUR 582.1 million, 1.5% of GDP).
Exports (FOB) amounted to EUR 1,656.2 million in February 2013, increasing by
EUR 192.9 million (13.2%) from February 2012 (EUR 1,463.3 million). In January – February 2013
exports (FOB) totalled EUR 3,434.4 million, growing by EUR 534.3 million (18.4%) year-on-year.
The exports for January – February 2012 decreased by 5.3% year-on-year.
Imports (FOB) amounted to EUR 1,977.5 million in February 2013, growing by EUR 210.5
million (11.9%) against February 2012 (EUR 1,767 million). For January – February 2013 imports
(FOB) amounted to EUR 3,801.7, growing by EUR 319.6 million (9.2%) year-on-year (from
EUR 3,482.1 million). The imports for January – February 2012 increased by 8.9% year-on-year.
The balance on services was positive and amounted to EUR 44.9 million in February 2013,
increasing by EUR 10.3 million (29.9%) against February 2012 (a positive balance of EUR 34.5
million). The surplus was mostly due to the positive balance on travel amounting to EUR 34.6
million (growing by EUR 4.3 million, 14.3% year-on-year). The balance on other services was
positive, equalling EUR 23.4 million (growing by EUR 16.1 million year-on-year), and the deficit on
1 The analysis is based on the analytical table of the Balance of Payments. Preliminary data. In accordance with the BNB practice and with the ECB data revision requirements (included in the ECB Timetable for Exchange of Balance of Payments, International Investment Position and Reserve Assets Statistics within the ESCB), the data for January 2013 have been revised. With the January – March 2013 report revisions for February 2013 will be presented.
3

transportation totalled EUR 13.2 million, growing by EUR 10.1 million year-on-year. For January –
February 2013 the services balance recorded a surplus of EUR 77.8 million (0.2% of GDP), down
by EUR 11.8 million (13.2%) year-on-year (from EUR 89.7 million, 0.2% of GDP).
The income balance was negative amounting to EUR 23.3 million in February 2013
against a deficit of EUR 128.4 million in February 2012. The income balance was negative for
January – February 2013 too, totalling EUR 81.5 million (0.2% of GDP), against a deficit of
EUR 219.3 (0.6% of GDP) for January – February 20123.
The net current transfers recorded a deficit of EUR 57 million in February 2013, against a
surplus of EUR 44.6 million in February 2012. The receipts from the European Union (EUR 23.5
million) increased by EUR 0.3 million year-on-year (from EUR 23.2 million). The current transfer
payments to the EU amounted to EUR 86.6 million against EUR 93.2 million in February 2012. For
January – February 2013 the net current transfers recorded a deficit of EUR 5.9 million (0.01% of
GDP), compared with a surplus of EUR 105.1 million (0.3% of GDP) in the same period of 2011.
Capital Account
The capital account4 was positive and amounted to EUR 4.3 million in February 2013,
against EUR 4.6 million in February 2012. The net capital transfers from EU funds were negative
amounting to EUR 0.1 million in February 2013 against a positive value of EUR 7.4 million in
February 2012. For January – February 2013 the capital account recorded a surplus of EUR 4.1
million against a positive balance of EUR 8.4 million for January – February 2012.
Financial Account
The financial account balance was negative and amounted to EUR 287.2 million in
February 2013 against a negative one of EUR 1.4 million in February 2012. For January –
February 2013 the financial account was negative totalling EUR 1,451.5 million (3.5% of GDP)
against a negative balance of EUR 231.9 million (0.6% of GDP) in January – February 2012.
Direct investment abroad increased by EUR 6.1 million in February 2013, against an
increase of EUR 10.7 million in February 2012. In January – February 2013 the direct investment
abroad totalled EUR 6.8 million, compared with EUR 23.8 million in the same period of 2012.
Foreign direct investment in Bulgaria amounted to EUR 10.9 million according to
preliminary data, compared with EUR 197.8 million in February 2012. The equity capital totalled
EUR 26.5 million against EUR 44.7 million in February 2012. The receipts from real estate
investment of non-residents amounted to EUR 8.4 million against EUR 17.3 million in the same
month of 2012. The net other capital was negative and amounted to EUR 21.9 million, against a
2 GDP amounting to EUR 41,319 million for 2013 (BNB estimate), and EUR 39,667.1 million for 2012 (NSI data as of 6 March, 2013). 3 The lower investment income payments for the period can partially be explained with the fact that the data are preliminary and are subject to revisions.
4

positive one of EUR 144.6 million in February 2012. In January – February 2013 the foreign direct
investment in the country equalled EUR 40.3 million (0.1% of GDP), compared with
EUR 524.3 million (1.3% of GDP) in the same period of 2012. The equity capital totalled
EUR 50.1 million compared with EUR 127.1 million in January – February 2012. The receipts from
real estate investment of non-residents decreased by EUR 18.7 million year-on-year and equalled
EUR 14.7 million (from EUR 33.5 million). The net other capital was negative and amounted to
EUR 22.5 million, against a positive item of EUR 380.2 million in January – February 2012.
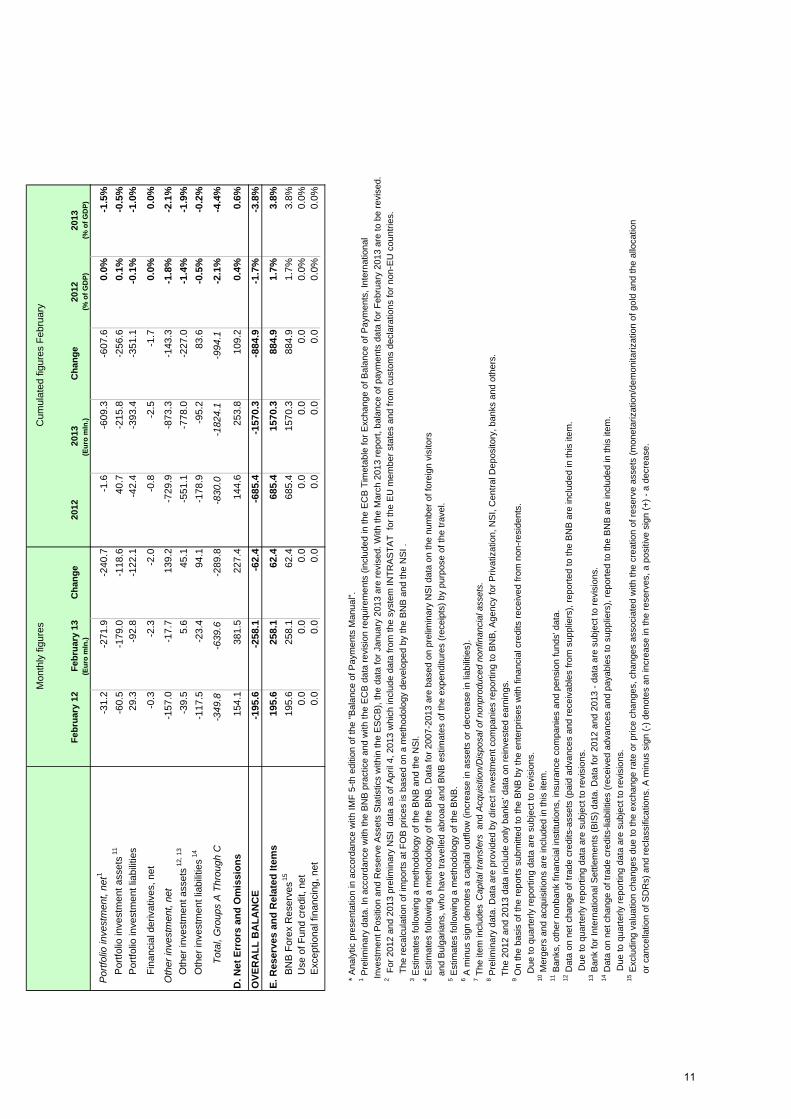
Portfolio investment assets increased by EUR 179 million, compared with an increase of
EUR 60.5 million in February 2012. Banks increased their portfolio investment assets by
EUR 143 million against an increase of EUR 2.6 million in February 2012. For January – February
2013 portfolio investment assets increased by EUR 215.8 million compared with a decline of
EUR 40.7 million in the same period of 2012.
Portfolio investment liabilities decreased by EUR 92.8 million against an increase of
EUR 29.3 million in February 2012. In January – February 2013 portfolio investment liabilities
dropped by EUR 393.4 million, against a decline of EUR 42.4 million in the same period of 2012.
Other investment assets decreased by EUR 5.6 million in February 2013, against an
increase of EUR 39.5 million in February 2012. The currency and deposits of banks decreased by
EUR 12.6 million against an increase of EUR 18.2 million in February 2012. For January –
February 2013 other investment assets increased by EUR 778 million compared with an
increase of EUR 551.1 million for the same period in 2012.
Other investment liabilities decreased by EUR 23.4 million against a decline of
EUR 117.5 million in February 2012. The decrease for the reporting month was mainly due to the
decrease of deposits of nonresidents in local banks (by EUR 250.4 million). For January –
February 2013 other investment liabilities decreased by EUR 95.2 million compared with a
decline of EUR 178.9 million in January – February 2012.
The net errors and omissions were positive, amounting to EUR 381.5 million against a
positive value of EUR 154.1 million in February 2012. The item was positive for January –
February 2013 and totalled EUR 253.8 million (0.6% of GDP), compared with a positive value of
EUR 144.6 million (0.4% of GDP) in the same period of 2012.
The overall balance was negative totalling EUR 258.1 million against a negative one of
EUR 195.6 million in February 2012. The overall balance for January – February 2013 was
negative and amounted to EUR 1,570.3 million (3.8% of GDP) against a negative overall balance
of EUR 685.4 million (1.7% of GDP) in the same period of 2012.
4 The Capital Account comprises items Capital Transfers and Acquisition or Disposal of Non-Produced Non-financial Assets.
5

In February 2013 the BNB reserve assets5 decreased by EUR 258.1 million, compared
with a decline of EUR 195.6 in February 2012. For January – February 2013 they declined by EUR
1,570.3 million, against a decrease of EUR 685.4 million in the same period of 2012.
5 Excluding valuation changes due to exchange rate or price changes, changes associated with the creation of reserve assets (monetisation/demonetisation of gold and allocation or cancellation of SDRs), and reclassifications.
6

DIRECT INVESTMENT
(January - February 2013)1
According to preliminary data, the Foreign direct investment in Bulgaria for January - February 2013 increased
by EUR 40.3 million (0.1% of GDP), compared to an increase of EUR 524.3 million (1.3% of GDP) for January -
February 2012.
(EUR million)2013 - 2012
Jan Feb Jan-Feb Q1 Q2 Q3 Q4 Total Jan Feb Jan-Feb Jan-Feb
Direct investment, net 313.4 187.1 500.5 640.6 410.3 480.0 -229.3 1301.6 28.7 4.8 33.5 -467.0
Direct investment abroad * -13.1 -10.7 -23.8 -32.2 -51.2 -21.9 -71.4 -176.7 -0.7 -6.1 -6.8 17.0
Equity capital -10.4 -9.6 -19.9 -24.6 -48.3 -4.5 -57.1 -134.5 -1.9 -6.0 -7.9 12.0
Other capital 1.6 3.3 4.9 5.6 -12.7 -3.5 -14.3 -24.9 1.3 -0.1 1.1 -3.8
Reinvested earnings -4.4 -4.4 -8.7 -13.1 9.7 -13.9 0.0 -17.3 0.0 0.0 0.0 8.7
Foreign Direct Investment 326.5 197.8 524.3 672.8 461.6 501.9 -157.9 1478.3 29.4 10.9 40.3 -483.9
Equity capital, incl. 82.4 44.7 127.1 213.3 213.5 249.9 374.3 1051.0 23.6 26.5 50.1 -77.0
from privatisation 0.0 0.0 0.0 0.0 0.0 0.0 28.2 28.2 0.0 0.0 0.0 0.0
non-privatisation flows 82.4 44.7 127.1 213.3 213.5 249.9 346.1 1022.8 23.6 26.5 50.1 -77.0
Other capital 235.7 144.6 380.2 434.1 221.9 229.7 -535.0 350.7 -0.6 -21.9 -22.5 -402.8
Reinvested earnings 8.5 8.5 16.9 25.4 26.1 22.3 2.7 76.6 6.4 6.4 12.8 -4.2
20132012
Source: direct investment companies, banks, notaries, National Statistical Institute, Central Depository, Privatisation Agency. * For assets, a minus sign denotes an increase in holdings, and a positive figure represents a decrease.
The attracted Equity Capital (acquisition/disposal of shares and equities in cash and contributions in kind by
non-residents in/from the capital and reserves of Bulgarian enterprises and receipts/payments from/for real estate
deals in the country) for January - February 2013 amounted to EUR 50.1. It decreased by EUR 77 million compared
to that attracted in the same period of 2012 (EUR 127.1 million). The receipts from real estate investments of non-
residents amounted to EUR 14.7 million, compared to EUR 33.5 million attracted in January - February 2012.
524.3
127.1
380.2
16.940.3 50.1
-22.5
12.8
-100
0
100
200
300
400
500
600
Total Equity capital Other capital Reinvested earnings
(Euro mln.)
Foreign Direct Investment January - February
(2012 and 2013)
2012 2013
The other capital, net (the change in the net liabilities of the direct investment enterprise to the direct investor
on financial loans, suppliers’ credits and debt securities) was negative, amounting to EUR -22.5 million in January -
February 2013, compared to a positive other capital, net of EUR 380.2 million in January - February 2012.
Based on preliminary data on profit/loss, the Reinvested Earnings2 (the share of non-residents in the
undistributed earnings/ loss of the enterprise) in January 2013 were estimated at EUR 12.8 million, against EUR
7

16.9 million in the same period of 2012.
By country, the largest direct investments in Bulgaria in January - February 2013 were those of Greece (EUR
9.4 million), Luxembourg (EUR 7.9 million), Russia (EUR 6.7 million) and Austria (EUR 6.1 million).
9.0 9.07.4
8.9
5.2
23.5
0.4
-1.0-0.6
-2.8
-15.1
-3.4
-20.0
-15.0
-10.0
-5.0
0.0
5.0
10.0
15.0
20.0
25.0
30.0
FDI Flows Geographical Breakdown (January - February 2013)
Equity capital and reinvested earnings Other capital
(Euro mln.)
According to preliminary data in January - February 2013 Direct investment abroad increased by EUR 6.8 million,
compared to an increase of EUR 23.8 million in January - February 2012.
1 Preliminary data for 2012 and 2013. The data for January 2013 are revised.
When comparing the data yoy it should be taken into account that the initial data on the January - February 2012 FDI, published in a BNB press release as of April 18, 2012 (www.bnb.bg, section Press Releases/Statistical Press Releases/Balance of Payments), was subsequently revised.
With the January - March 2013 report revisions for February 2013 data will be presented.
The 2012 and 2013 data are subject to revisions with the quarterly reports to the BNB from foreign direct investment enterprises and with the annual NSI data.
GDP amounting to EUR 41,319 million for 2013 (BNB estimate), and EUR 39,667.1 million for 2012 (NSI data as of 6 March, 2013). 2 The 2012 and 2013 data include only estimates of banks’ data on reinvested earnings.
8

TABLES
9

BA
LAN
CE
OF
PAYM
ENTS
OF
BU
LGA
RIA
AN
ALY
TIC
AL
PRES
ENTA
TIO
N *
Mon
thly
figu
res
Cum
ulat
ed fi
gure
s F
ebru
ary
Febr
uary
12
Febr
uary
13
Cha
nge
2012
2013
Cha
nge
2012
2013
(Eur
o m
ln.)
(Eur
o m
ln.)
(% o
f GD
P)(%
of G
DP)
Cur
rent
and
Cap
ital a
ccou
nt (A
+ B
)-3
48.4
-352
.4-4
.0-5
98.1
-372
.622
5.5
-1.5
%-0
.9%
A. C
urre
nt A
ccou
nt 1
-353
.0-3
56.7
-3.7
-606
.5-3
76.8
229.
8-1
.5%
-0.9
%
G
oods
: cre
dit
1463
.316
56.2
192.
929
00.1
3434
.453
4.3
7.3%
8.3%
G
oods
: deb
it-1
767.
0-1
977.
5-2
10.5
-348
2.1
-380
1.7
-319
.6-8
.8%
-9.2
%
B
alan
ce o
n G
oods
2-3
03.7
-321
.3-1
7.6
-582
.1-3
67.3
214.
8-1
.5%
-0.9
%
S
ervi
ces:
cre
dit
257.
625
7.5
-0.2
537.
751
2.9
-24.
71.
4%1.
2%
T
rans
port
atio
n 3
61.8
61.0
-0.8
127.
812
5.8
-1.9
0.3%
0.3%
Tra
vel 4
88.4
100.
111
.719
9.1
213.
414
.40.
5%0.
5%
O
ther
ser
vice
s10
7.4
96.3
-11.
121
0.9
173.
7-3
7.2
0.5%
0.4%
S
ervi
ces:
deb
it-2
23.1
-212
.610
.5-4
48.0
-435
.112
.9-1
.1%
-1.1
%
T
rans
port
atio
n 3
-64.
9-7
4.2
-9.3
-128
.1-1
44.9
-16.
9-0
.3%
-0.4
%
T
rave
l 4-5
8.2
-65.
6-7
.4-1
21.1
-132
.2-1
1.1
-0.3
%-0
.3%
Oth
er s
ervi
ces
-100
.1-7
2.9
27.2
-198
.8-1
58.0
40.8
-0.5
%-0
.4%
B
alan
ce o
n S
ervi
ces
34.5
44.9
10.3
89.7
77.8
-11.
80.
2%0.
2%
T
rans
port
atio
n, n
et-3
.1-1
3.2
-10.
1-0
.3-1
9.1
-18.
80.
0%0.
0%
T
rave
l, ne
t30
.234
.64.
377
.981
.23.
30.
2%0.
2%
O
ther
ser
vice
s, n
et7.
423
.416
.112
.015
.73.
70.
0%0.
0%
B
alan
ce o
n go
ods
and
serv
ices
-269
.2-2
76.4
-7.2
-492
.4-2
89.5
202.
9-1
.2%
-0.7
%
I
ncom
e: c
redi
t50
.846
.8-4
.096
.610
1.1
4.6
0.2%
0.2%
Com
pens
atio
n of
em
ploy
ees:
cre
dit 5
18.1
19.3
1.3
32.5
35.1
2.7
0.1%
0.1%
Oth
er in
vest
men
t inc
ome:
cre
dit
32.7
27.5
-5.2
64.1
66.0
1.9
0.2%
0.2%
I
ncom
e: d
ebit
-179
.2-7
0.1
109.
1-3
15.9
-182
.613
3.3
-0.8
%-0
.4%
Com
pens
atio
n of
em
ploy
ees:
deb
it-0
.8-1
.9-1
.1-1
.7-3
.0-1
.30.
0%0.
0%
O
ther
inve
stm
ent i
ncom
e: d
ebit
-178
.4-6
8.1
110.
3-3
14.2
-179
.613
4.6
-0.8
%-0
.4%
B
alan
ce o
n In
com
e-1
28.4
-23.
310
5.1
-219
.3-8
1.5
137.
8-0
.6%
-0.2
%
B
alan
ce o
n go
ods,
ser
vice
s an
d in
com
e-3
97.6
-299
.797
.9-7
11.7
-370
.934
0.8
-1.8
%-0
.9%
C
urre
nt tr
ansf
ers,
net
44
.6-5
7.0
-101
.610
5.1
-5.9
-111
.00.
3%0.
0%
Cur
rent
tran
sfer
s: c
redi
t16
4.0
107.
6-5
6.3
282.
823
6.6
-46.
20.
7%0.
6%
Cur
rent
tran
sfer
s: d
ebit
-119
.4-1
64.7
-45.
3-1
77.6
-242
.5-6
4.8
-0.4
%-0
.6%
B. C
apita
l Acc
ount
1, 6
, 74.
64.
3-0
.38.
44.
1-4
.30.
0%0.
0%
C
apita
l tra
nsfe
rs, n
et8.
0-0
.1-8
.09.
8-3
.9-1
3.7
0.0%
0.0%
T
otal
, Gro
ups
A P
lus
B-3
48.4
-352
.4-4
.0-5
98.1
-372
.622
5.5
-1.5
%-0
.9%
C. F
inan
cial
Acc
ount
1, 6
-1.4
-287
.2-2
85.8
-231
.9-1
451.
5-1
219.
6-0
.6%
-3.5
%
D
irect
inve
stm
ent,
net
818
7.1
4.8
-182
.350
0.5
33.5
-467
.01.
3%0.
1%
Dire
ct in
vest
men
t abr
oad
-10.
7-6
.14.
5-2
3.8
-6.8
17.0
-0.1
%0.
0%
Dire
ct in
vest
men
t in
repo
rtin
g ec
onom
y 919
7.8
10.9
-186
.852
4.3
40.3
-483
.91.
3%0.
1%
Mer
gers
and
acq
uisi
tions
100.
00.
00.
00.
00.
00.
00.
0%0.
0%
10
Mon
thly
figu
res
Cum
ulat
ed fi
gure
s F
ebru
ary
Febr
uary
12
Febr
uary
13
Cha
nge
2012
2013
Cha
nge
2012
2013
(Eur
o m
ln.)
(Eur
o m
ln.)
(% o
f GD
P)(%
of G
DP)
Por
tfolio
inve
stm
ent,
net1
-31.
2-2
71.9
-240
.7-1
.6-6
09.3
-607
.60.
0%-1
.5%
P
ortfo
lio in
vest
men
t ass
ets
11-6
0.5
-179
.0-1
18.6
40.7
-215
.8-2
56.6
0.1%
-0.5
%
Por
tfolio
inve
stm
ent l
iabi
litie
s29
.3-9
2.8
-122
.1-4
2.4
-393
.4-3
51.1
-0.1
%-1
.0%
F
inan
cial
der
ivat
ives
, net
-0.3
-2.3
-2.0
-0.8
-2.5
-1.7
0.0%
0.0%
Oth
er in
vest
men
t, ne
t-1
57.0
-17.
713
9.2
-729
.9-8
73.3
-143
.3-1
.8%
-2.1
%
Oth
er in
vest
men
t ass
ets
12, 1
3-3
9.5
5.6
45.1
-551
.1-7
78.0
-227
.0-1
.4%
-1.9
%
Oth
er in
vest
men
t lia
bilit
ies
14-1
17.5
-23.
494
.1-1
78.9
-95.
283
.6-0
.5%
-0.2
%
T
otal
, Gro
ups
A T
hrou
gh C
-349
.8-6
39.6
-289
.8-8
30.0
-182
4.1
-994
.1-2
.1%
-4.4
%
D. N
et E
rror
s an
d O
mis
sion
s15
4.1
381.
522
7.4
144.
625
3.8
109.
20.
4%0.
6%
OVE
RA
LL B
ALA
NC
E-1
95.6
-258
.1-6
2.4
-685
.4-1
570.
3-8
84.9
-1.7
%-3
.8%
E. R
eser
ves
and
Rel
ated
Item
s19
5.6
258.
162
.468
5.4
1570
.388
4.9
1.7%
3.8%
B
NB
For
ex R
eser
ves 1
519
5.6
258.
162
.468
5.4
1570
.388
4.9
1.7%
3.8%
U
se o
f Fun
d cr
edit,
net
0.0
0.0
0.0
0.0
0.0
0.0
0.0%
0.0%
E
xcep
tiona
l fin
anci
ng, n
et
0.0
0.0
0.0
0.0
0.0
0.0
0.0%
0.0%
* A
naly
tic p
rese
ntat
ion
in a
ccor
danc
e w
ith IM
F 5
-th
editi
on o
f the
"B
alan
ce o
f Pay
men
ts M
anua
l".
1 Pre
limin
ary
data
. In
acco
rdan
ce w
ith th
e B
NB
pra
ctic
e an
d w
ith th
e E
CB
dat
a re
visi
on r
equi
rem
ents
(in
clud
ed in
the
EC
B T
imet
able
for
Exc
hang
e of
Bal
ance
of P
aym
ents
, Int
erna
tiona
l
Inve
stm
ent P
ositi
on a
nd R
eser
ve A
sset
s S
tatis
tics
with
in th
e E
SC
B),
the
data
for
Janu
ary
2013
are
rev
ised
. With
the
Mar
ch 2
013
rep
ort,
bala
nce
of p
aym
ents
dat
a fo
r F
ebru
ary
2013
are
to b
e re
vise
d.2 F
or 2
012
and
2013
pre
limin
ary
NS
I da
ta a
s of
Apr
il 4,
201
3 w
hich
incl
ude
data
from
the
syst
em IN
TR
AS
TA
T f
or th
e E
U m
embe
r st
ates
and
from
cus
tom
s de
clar
atio
ns fo
r no
n-E
U c
ount
ries.
T
he r
ecal
cula
tion
of im
port
s at
FO
B p
rices
is b
ased
on
a m
etho
dolo
gy d
evel
oped
by
the
BN
B a
nd th
e N
SI .
3 Est
imat
es fo
llow
ing
a m
etho
dolo
gy o
f the
BN
B a
nd th
e N
SI.
4 Est
imat
es fo
llow
ing
a m
etho
dolo
gy o
f the
BN
B. D
ata
for
2007
-201
3 ar
e ba
sed
on p
relim
inar
y N
SI d
ata
on th
e nu
mbe
r of
fore
ign
visi
tors
and
Bul
garia
ns, w
ho h
ave
trav
elle
d ab
road
and
BN
B e
stim
ates
of t
he e
xpen
ditu
res
(rec
eipt
s) b
y pu
rpos
e of
the
trav
el.
5 Est
imat
es fo
llow
ing
a m
etho
dolo
gy o
f the
BN
B.
6 A m
inus
sig
n de
note
s a
capi
tal o
utflo
w (
incr
ease
in a
sset
s or
dec
reas
e in
liab
ilitie
s).
7 The
item
incl
udes
Cap
ital t
rans
fers
and
Acq
uisi
tion/
Dis
posa
l of n
onpr
oduc
ed n
onfin
anci
al a
sset
s.
8 Pre
limin
ary
data
. Dat
a ar
e pr
ovid
ed b
y di
rect
inve
stm
ent c
ompa
nies
rep
ortin
g to
BN
B, A
genc
y fo
r P
rivat
izat
ion,
NS
I, C
entr
al D
epo
sito
ry, b
anks
and
oth
ers.
The
201
2 an
d 20
13 d
ata
incl
ude
only
ban
ks’ d
ata
on r
einv
este
d ea
rnin
gs.
9 On
the
basi
s of
the
repo
rts
subm
itted
to th
e B
NB
by
the
ente
rpris
es w
ith fi
nanc
ial c
redi
ts r
ecei
ved
from
non
-res
iden
ts.
D
ue to
qua
rter
ly r
epor
ting
data
are
sub
ject
to r
evis
ions
.10
Mer
gers
and
acq
uisi
tions
are
incl
uded
in th
is it
em.
11 B
anks
, oth
er n
onba
nk fi
nanc
ial i
nstit
utio
ns, i
nsur
ance
com
pani
es a
nd p
ensi
on fu
nds'
dat
a.12
Dat
a on
net
cha
nge
of tr
ade
cred
its-a
sset
s (p
aid
adva
nces
and
rec
eiva
bles
from
sup
plie
rs),
rep
orte
d to
the
BN
B a
re in
clud
ed in
this
item
.
D
ue to
qua
rter
ly r
epor
ting
data
are
sub
ject
to r
evis
ions
. 13
Ban
k fo
r In
tern
atio
nal S
ettle
men
ts (
BIS
) da
ta. D
ata
for
2012
and
201
3 -
data
are
sub
ject
to r
evis
ions
.14
Dat
a on
net
cha
nge
of tr
ade
cred
its-li
abili
ties
(rec
eive
d ad
vanc
es a
nd p
ayab
les
to s
uppl
iers
), r
epor
ted
to th
e B
NB
are
incl
ude
d in
this
item
.
D
ue to
qua
rter
ly r
epor
ting
data
are
sub
ject
to r
evis
ions
. 15
Exc
ludi
ng v
alua
tion
chan
ges
due
to th
e ex
chan
ge r
ate
or p
rice
chan
ges,
cha
nges
ass
ocia
ted
with
the
crea
tion
of r
eser
ve a
sset
s (m
onet
ariz
atio
n/de
mon
itariz
atio
n of
gol
d an
d th
e al
loca
tion
or
can
cella
tion
of S
DR
s) a
nd r
ecla
ssifi
catio
ns. A
min
us s
ign
(-)
deno
tes
an in
crea
se in
the
rese
rves
, a p
ositi
ve s
ign
(+)
- a
decr
ease
.
11

BA
LAN
CE
OF
PAYM
ENTS
OF
BU
LGA
RIA
AN
ALY
TIC
PR
ESEN
TATI
ON
*(m
onth
ly d
ata)
AN
ALI
TIC
PR
ES
EN
TA
TIO
N*
Cum
ulat
ed fi
gure
s
F
ebru
ary
Tw
elve
-mon
th c
umul
ated
figu
res
endi
ng
(mln
EU
R)
Feb
.12
Mar
.12
Apr
.12
May
. 12
Jun.
12
Jul.
12A
ug. 1
2S
ep. 1
2O
ct. 1
2N
ov. 1
2D
ec.1
2Ja
n. 1
3F
eb.1
320
1220
1329
.II.2
012
28.II
.201
3
Cur
rent
acc
ount
1-3
53.0
45.0
-314
.2-1
66.7
97.9
284.
237
4.3
256.
0-1
77.8
34.0
-354
.4-2
0.1
-356
.7-6
06.5
-376
.8-5
63.4
-298
.4
Goo
ds, c
redi
t (F
OB
)14
63.3
1719
.716
20.3
1865
.217
70.7
1865
.518
71.6
1815
.118
60.0
1969
.015
35.9
1778
.216
56.2
2900
.134
34.4
2010
2.0
2132
7.4
Goo
ds, d
ebit
(FO
B)
-176
7.0
-207
9.2
-209
9.9
-229
4.9
-214
2.1
-212
5.5
-200
7.8
-197
1.3
-222
1.1
-212
1.9
-186
9.4
-182
4.2
-197
7.5
-348
2.1
-380
1.7
-227
05.6
-247
34.7
Tra
de B
alan
ce 2
-303
.7-3
59.5
-479
.5-4
29.7
-371
.4-2
59.9
-136
.3-1
56.2
-361
.0-1
52.9
-333
.5-4
6.0
-321
.3-5
82.1
-367
.3-2
603.
6-3
407.
4
Ser
vice
s, c
redi
t25
7.6
301.
029
8.1
386.
272
4.3
915.
288
7.5
618.
738
5.8
302.
830
2.5
255.
525
7.5
537.
751
2.9
5361
.756
35.1
T
rans
port
atio
n 3
61.8
68.0
68.3
75.2
123.
216
3.6
154.
410
8.3
77.2
72.6
59.3
64.8
61.0
127.
812
5.8
1105
.910
96.0
T
rave
l 488
.498
.511
7.4
177.
637
3.8
611.
761
9.3
349.
015
9.8
110.
410
0.1
113.
310
0.1
199.
121
3.4
2849
.229
30.9
O
ther
ser
vice
s10
7.4
134.
611
2.4
133.
422
7.3
139.
811
3.8
161.
414
8.8
119.
814
3.2
77.3
96.3
210.
917
3.7
1406
.616
08.2
Ser
vice
s, d
ebit
-223
.1-3
00.3
-263
.4-2
72.0
-299
.5-3
00.4
-316
.7-2
97.5
-255
.1-2
46.5
-263
.2-2
22.5
-212
.6-4
48.0
-435
.1-3
041.
7-3
249.
6
T
rans
port
atio
n 3
-64.
9-7
1.4
-71.
5-8
1.2
-75.
5-7
8.7
-84.
2-7
6.1
-69.
3-6
5.8
-62.
6-7
0.8
-74.
2-1
28.1
-144
.9-8
37.9
-881
.4
T
rave
l 4-5
8.2
-77.
3-8
5.7
-83.
9-9
3.3
-98.
6-1
25.4
-107
.0-8
0.1
-79.
3-6
4.0
-66.
6-6
5.6
-121
.1-1
32.2
-944
.1-1
026.
8
Oth
er s
ervi
ces
-100
.1-1
51.6
-106
.1-1
07.0
-130
.7-1
23.1
-107
.1-1
14.3
-105
.6-1
01.3
-136
.6-8
5.1
-72.
9-1
98.8
-158
.0-1
259.
7-1
341.
4
Ser
vice
s, n
et34
.50.
834
.711
4.2
424.
861
4.7
570.
832
1.3
130.
756
.339
.433
.044
.989
.777
.823
20.0
2385
.5
Goo
ds a
nd s
ervi
ces,
net
-269
.2-3
58.7
-444
.8-3
15.5
53.4
354.
843
4.5
165.
0-2
30.3
-96.
6-2
94.2
-13.
0-2
76.4
-492
.4-2
89.5
-283
.6-1
021.
9
Inc
ome,
cre
dit
50.8
59.5
57.1
68.3
59.9
68.0
65.2
73.6
69.7
56.6
56.1
54.3
46.8
96.6
101.
161
7.9
735.
2
C
ompe
nsat
ion
of e
mpl
oyee
s 518
.122
.930
.331
.731
.730
.430
.538
.035
.526
.517
.915
.819
.332
.535
.128
8.5
330.
4
Inve
stm
ent i
ncom
e32
.736
.726
.836
.728
.237
.634
.735
.634
.230
.138
.238
.527
.564
.166
.032
9.4
404.
8
D
irect
inve
stm
ent
5.0
6.1
-0.9
5.0
-0.6
5.5
6.2
6.2
1.4
0.6
2.3
1.8
0.8
10.0
2.6
-11.
134
.5
P
ortfo
lio in
vest
men
t 21
.021
.820
.525
.722
.326
.323
.922
.926
.024
.424
.429
.919
.443
.749
.326
0.5
287.
5
O
ther
inve
stm
ent
6.7
8.7
7.2
6.0
6.5
5.8
4.7
6.5
6.8
5.1
11.5
6.8
7.3
10.4
14.1
80.0
82.9
Inc
ome,
deb
it-1
79.2
-152
.5-1
00.6
-149
.2-1
98.3
-260
.4-2
49.3
-122
.3-8
5.7
-97.
4-3
41.2
-112
.5-7
0.1
-315
.9-1
82.6
-246
8.1
-193
9.4
C
ompe
nsat
ion
of e
mpl
oyee
s-0
.8-2
.4-1
.1-0
.7-2
.3-1
.3-0
.7-2
.1-0
.6-0
.8-2
.3-1
.1-1
.9-1
.7-3
.0-1
1.9
-17.
4
Inve
stm
ent i
ncom
e-1
78.4
-150
.0-9
9.5
-148
.5-1
96.0
-259
.1-2
48.6
-120
.2-8
5.1
-96.
6-3
38.8
-111
.4-6
8.1
-314
.2-1
79.6
-245
6.2
-192
2.0
Dire
ct in
vest
men
t -1
40.6
-99.
7-6
7.0
-109
.9-1
37.0
-214
.3-2
07.9
-82.
7-6
0.7
-61.
4-2
73.2
-60.
4-5
5.8
-199
.8-1
16.2
-187
0.0
-143
0.0
Por
tfolio
inve
stm
ent
-0.1
-0.1
-0.1
-0.1
-0.1
-19.
8-0
.1-0
.1-0
.1-0
.1-0
.1-4
1.5
-0.1
-41.
1-4
1.6
-63.
7-6
2.2
Oth
er in
vest
men
t -3
7.7
-50.
2-3
2.4
-38.
5-5
8.9
-24.
9-4
0.6
-37.
5-2
4.3
-35.
1-6
5.5
-9.5
-12.
2-7
3.3
-21.
7-5
22.6
-429
.8
Inco
me,
net
-128
.4-9
2.9
-43.
6-8
0.8
-138
.4-1
92.4
-184
.0-4
8.7
-16.
0-4
0.8
-285
.1-5
8.2
-23.
3-2
19.3
-81.
5-1
850.
2-1
204.
2
Goo
ds, s
ervi
ces
and
inco
me,
net
-397
.6-4
51.7
-488
.3-3
96.3
-85.
016
2.3
250.
511
6.3
-246
.3-1
37.4
-579
.3-7
1.2
-299
.7-7
11.7
-370
.9-2
133
.8-2
226.
0
C
urre
nt tr
ansf
ers,
net
44.6
496.
617
4.1
229.
718
2.9
121.
812
3.8
139.
768
.617
1.4
224.
951
.1-5
7.0
105.
1-5
.915
70.4
1927
.6 C
urre
nt tr
ansf
ers,
cre
ditt
164.
054
1.9
218.
527
5.0
225.
614
9.9
165.
918
7.7
147.
620
6.2
302.
712
9.0
107.
628
2.8
236.
621
62.5
2657
.6 C
urre
nt tr
ansf
ers,
deb
it-1
19.4
-45.
3-4
4.3
-45.
3-4
2.7
-28.
1-4
2.1
-48.
0-7
9.0
-34.
8-7
7.8
-77.
8-1
64.7
-177
.6-2
42.5
-592
.1-7
30.0
Cap
ital a
ccou
nt 1
,6,7
4.6
2.9
1.6
33.5
9.0
120.
610
.333
.3-7
9.8
176.
722
0.2
-0.1
4.3
8.4
4.1
494.
353
2.5
Cap
ital t
rans
fers
, net
8.0
6.5
0.0
33.5
8.1
118.
8-3
.833
.1-8
1.5
163.
722
5.9
-3.8
-0.1
9.8
-3.9
463.
450
0.4
Cur
rent
and
Cap
ital a
ccou
nt-3
48.4
47.8
-312
.6-1
33.2
106.
940
4.8
384.
628
9.3
-257
.621
0.7
-134
.1-2
0.2
-352
.4-5
98.1
-372
.6-6
9.1
234.
0
Fina
ncia
l acc
ount
1,6
-1.4
260.
838
6.3
179.
469
0.7
544.
383
.517
6.7
32.4
-187
.129
6.2
-116
4.3
-287
.2-2
31.9
-145
1.5
-739
.910
11.7
Dire
ct in
vest
men
t18
7.1
140.
138
7.5
-165
.718
8.6
64.1
367.
548
.418
6.1
-165
.0-2
50.4
28.7
4.8
500.
533
.514
38.6
834.
6
Abr
oad
-10.
7-8
.4-8
.8-2
9.9
-12.
6-1
2.9
-6.4
-2.5
-19.
7-4
2.6
-9.1
-0.7
-6.1
-23.
8-6
.8-1
02.1
-159
.7
E
quity
cap
ital
-9.6
-4.7
-9.3
-26.
9-1
2.1
-5.1
-3.5
4.1
-15.
7-3
6.2
-5.3
-1.9
-6.0
-19.
9-7
.9-1
44.1
-122
.5
R
einv
este
d ea
rnin
gs-4
.4-4
.43.
23.
23.
2-4
.6-4
.6-4
.60.
00.
00.
00.
00.
0-8
.70.
033
.0-8
.5
O
ther
cap
ital
3.3
0.7
-2.8
-6.2
-3.7
-3.2
1.6
-2.0
-4.1
-6.4
-3.8
1.3
-0.1
4.9
1.1
9.0
-28.
7
In
the
repo
rtin
g ec
onom
y 8
197.
814
8.5
396.
2-1
35.8
201.
177
.037
4.0
50.9
205.
8-1
22.4
-241
.429
.410
.952
4.3
40.3
1540
.799
4.3
Equ
ity c
apita
l44
.786
.268
.895
.848
.985
.256
.710
8.0
169.
176
.612
8.6
23.6
26.5
127.
150
.110
78.1
974.
0
R
einv
este
d ea
rnin
gs8.
58.
58.
78.
78.
77.
47.
47.
40.
90.
90.
96.
46.
416
.912
.8-1
25.5
72.4
Oth
er c
apita
l 914
4.6
53.9
318.
7-2
40.3
143.
5-1
5.6
309.
9-6
4.5
35.8
-199
.9-3
70.9
-0.6
-21.
938
0.2
-22.
558
8.1
-52.
0
Mer
gers
and
acq
uisi
tions
, net
10
0.0
0.0
0.0
0.0
0.0
0.0
0.0
0.0
0.0
0.0
0.0
0.0
0.0
0.0
0.0
0.0
0.0
Por
tfolio
inve
stm
ent,
net1
-31.
2-3
68.8
189.
5-2
7.3
-219
.210
09.2
-207
.3-6
5.8
-60.
4-1
107.
6-7
1.1
-337
.4-2
71.9
-1.6
-609
.3-1
82.3
-153
8.3
Por
tfolio
inve
stm
ent,
asss
ets
11
-60.
5-3
42.1
230.
7-1
2.8
-229
.431
4.3
-174
.7-6
2.6
-51.
1-1
110.
0-9
6.7
-36.
8-1
79.0
40.7
-215
.853
.5-1
750.
3
Equ
ity s
ecur
ities
7.6
1.8
6.9
12.1
-22.
415
.97.
6-3
3.3
-2.0
-28.
3-1
4.6
-9.5
2.8
17.1
-6.7
97.9
-63.
0
Deb
t sec
uriti
es-6
8.1
-343
.822
3.8
-24.
8-2
07.0
298.
4-1
82.3
-29.
4-4
9.1
-108
1.7
-82.
2-2
7.3
-181
.823
.7-2
09.2
-44.
4-1
687.
3 P
ortfo
lio in
vest
men
t, lia
bilit
ies
29.3
-26.
8-4
1.2
-14.
510
.169
4.9
-32.
6-3
.2-9
.32.
425
.7-3
00.6
-92.
8-4
2.4
-393
.4-2
35.8
212.
0
12
BA
LAN
CE
OF
PAYM
ENTS
OF
BU
LGA
RIA
AN
ALY
TIC
PR
ESEN
TATI
ON
*(m
onth
ly d
ata)
AN
ALI
TIC
PR
ES
EN
TA
TIO
N*
Cum
ulat
ed fi
gure
s
F
ebru
ary
Tw
elve
-mon
th c
umul
ated
figu
res
endi
ng
(mln
EU
R)
Feb
.12
Mar
.12
Apr
.12
May
. 12
Jun.
12
Jul.
12A
ug. 1
2S
ep. 1
2O
ct. 1
2N
ov. 1
2D
ec.1
2Ja
n. 1
3F
eb.1
320
1220
1329
.II.2
012
28.II
.201
3
E
quity
sec
uriti
es4.
3-2
.5-1
3.6
-2.4
-1.6
-6.3
-3.7
10.8
19.6
1.3
-2.4
0.0
0.0
-17.
83.
5-1
2.2
-28.
4
Deb
t sec
uriti
es25
.0-2
4.3
-27.
6-1
2.1
11.8
701.
2-2
8.9
-14.
0-2
8.9
1.1
28.1
-300
.6-9
2.8
-218
.655
9.6
-193
.749
9.1
Fin
anci
al d
eriv
ativ
es, n
et-0
.3-5
.2-1
.9-3
.1-0
.6-3
.7-1
.7-1
.7-7
.9-1
.6-5
.0-0
.2-2
.3-0
.8-2
.5-5
6.8
-35.
0
Oth
er in
vest
men
t, ne
t-1
57.0
494.
7-1
88.7
375.
572
2.0
-525
.2-7
4.9
195.
9-8
5.4
1087
.162
2.6
-855
.5-1
7.7
-729
.9-8
73.3
-193
9.4
1750
.3 O
ther
inve
stm
ent,
asse
ts-3
9.5
195.
2-6
4.3
476.
933
7.9
-229
.953
.713
3.3
85.0
152.
250
3.9
-783
.75.
6-5
51.1
-778
.0-9
03.3
865.
8
T
rade
cre
dits
12
-58.
3-5
8.3
0.0
0.0
0.0
0.0
0.0
0.0
0.0
0.0
0.0
0.0
0.0
-116
.50.
0-1
41.2
-58.
3
Loa
ns-3
1.0
-34.
711
.36.
33.
5-2
5.0
5.2
-22.
8-3
6.8
4.4
-99.
9-9
1.4
1.6
-25.
0-8
9.8
-82.
4-2
78.2
C
urre
ncy
and
depo
sits
13
36.6
300.
5-7
1.9
463.
337
4.0
-200
.035
.017
0.2
119.
717
3.5
609.
3-7
08.3
12.6
-411
.0-6
95.7
-623
.312
77.9
O
ther
ass
ets
13.2
-12.
3-3
.77.
2-3
9.6
-4.9
13.4
-14.
12.
2-2
5.7
-5.5
16.0
-8.6
1.5
7.5
-56.
4-7
5.5
Oth
er in
vest
men
t, lia
bilit
ies
-117
.529
9.5
-124
.4-1
01.4
384.
2-2
95.3
-128
.662
.6-1
70.4
934.
911
8.8
-71.
9-2
3.4
-178
.9-9
5.2
-103
6.1
884.
5
T
rade
cre
dits
14
-4.6
-4.7
0.0
0.0
0.0
0.0
0.0
0.0
0.0
0.0
0.0
0.0
0.0
-9.6
0.0
100.
5-4
.7
Loa
ns-6
8.1
250.
5-2
0.5
-79.
217
5.3
13.7
-136
.463
.2-3
77.1
916.
254
.335
.623
2.2
-78.
326
7.7
-250
.111
27.7
C
urre
ncy
and
depo
sits
-63.
472
.7-1
22.7
-60.
525
4.0
-296
.3-0
.9-1
3.0
213.
948
.519
.8-1
09.2
-250
.4-1
18.3
-359
.6-9
55.3
-244
.0
Oth
er li
abili
ties
18.6
-19.
018
.838
.3-4
5.1
-12.
78.
612
.3-7
.2-2
9.8
44.7
1.8
-5.1
27.3
-3.3
68.8
5.6
Cur
rent
, Cap
ital a
nd F
inan
cial
Acc
ount
-349
.830
8.6
73.7
46.2
797.
794
9.1
468.
146
6.0
-225
.223
.616
2.0
-118
4.6
-639
.6-8
30.0
-182
4.1
-809
.01
245.
8
Net
err
ors
and
omis
sion
s15
4.1
201.
110
8.8
65.9
-453
.236
.4-3
62.7
-73.
9-1
11.1
-29.
139
4.4
-127
.738
1.5
144.
625
3.8
856.
830
.3
OVE
RA
L B
ALA
NC
E-1
95.6
509.
818
2.4
112.
134
4.4
985.
510
5.4
392.
1-3
36.3
-5.5
556.
4-1
312.
2-2
58.1
-685
.4-1
570.
347
.812
76.1
Res
erve
s an
d re
late
d ite
ms
195.
6-5
09.8
-182
.4-1
12.1
-344
.4-9
85.5
-105
.4-3
92.1
336.
35.
5-5
56.4
1312
.225
8.1
685.
415
70.3
-47.
8-1
276.
1
Offi
cial
res
erve
ass
ets
15
195.
6-5
09.8
-182
.4-1
12.1
-344
.4-9
85.5
-105
.4-3
92.1
336.
35.
5-5
56.4
1312
.225
8.1
685.
415
70.3
-47.
8-1
276.
1
Use
of f
und
cred
its a
nd lo
ans,
net
0.0
0.0
0.0
0.0
0.0
0.0
0.0
0.0
0.0
0.0
0.0
0.0
0.0
0.0
0.0
0.0
0.0
E
xcep
tiona
l fin
anci
ng tr
ansa
ctio
ns0.
00.
00.
00.
00.
00.
00.
00.
00.
00.
00.
00.
00.
00.
00.
00.
00.
0
* A
naly
tic p
rese
ntat
ion
in a
ccor
danc
e w
ith IM
F 5
-th
editi
on o
f the
"B
alan
ce o
f Pay
men
ts M
anua
l".
1 Pre
limin
ary
data
. In
acco
rdan
ce w
ith th
e B
NB
pra
ctic
e an
d w
ith th
e E
CB
dat
a re
visi
on r
equi
rem
ents
(in
clud
ed in
the
EC
B T
imet
able
for
Exc
hang
e of
Bal
ance
of P
aym
ents
, Int
erna
tiona
l In
vest
men
t Pos
ition
and
Res
erve
Ass
ets
Sta
tistic
s w
ithin
the
ES
CB
), th
e da
ta fo
r Ja
nuar
y 20
13 a
re r
evis
ed. W
ith th
e M
arch
201
3 r
epor
t, ba
lanc
e of
pay
men
ts d
ata
for
Feb
ruar
y 20
13 a
re to
be
revi
sed.
2 For
201
2 an
d 20
13 p
relim
inar
y N
SI
data
as
of A
pril
4, 2
013
whi
ch in
clud
e da
ta fr
om th
e sy
stem
INT
RA
ST
AT
for
the
EU
mem
ber
stat
es a
nd fr
om c
usto
ms
decl
arat
ions
for
non-
EU
cou
ntrie
s.
The
rec
alcu
latio
n of
impo
rts
at F
OB
pric
es is
bas
ed o
n a
met
hodo
logy
dev
elop
ed b
y th
e B
NB
and
the
NS
I .3 E
stim
ates
follo
win
g a
met
hodo
logy
of t
he B
NB
and
the
NS
I.4 E
stim
ates
follo
win
g a
met
hodo
logy
of t
he B
NB
. Dat
a fo
r 20
07-2
013
are
base
d on
pre
limin
ary
NS
I dat
a on
the
num
ber
of fo
reig
n vi
sito
rs a
nd B
ulga
rians
, who
hav
e tr
avel
led
abro
ad a
nd B
NB
est
imat
es o
f the
exp
endi
ture
s (r
ecei
pts)
by
purp
ose
of th
e tr
avel
.5 E
stim
ates
follo
win
g a
met
hodo
logy
of t
he B
NB
.6 A
min
us s
ign
deno
tes
a ca
pita
l out
flow
(in
crea
se in
ass
ets
or d
ecre
ase
in li
abili
ties)
. 7 T
he it
em in
clud
es C
apita
l tra
nsfe
rs a
nd A
cqui
sitio
n/D
ispo
sal o
f non
prod
uced
non
finan
cial
ass
ets.
8 P
relim
inar
y da
ta. D
ata
are
prov
ided
by
dire
ct in
vest
men
t com
pani
es r
epor
ting
to B
NB
, Age
ncy
for
Priv
atiz
atio
n, N
SI,
Cen
tral
De
posi
tory
, ban
ks a
nd o
ther
s.
The
201
2 an
d 20
13 d
ata
incl
ude
only
ban
ks’ d
ata
on r
einv
este
d ea
rnin
gs.
9 On
the
basi
s of
the
repo
rts
subm
itted
to th
e B
NB
by
the
ente
rpris
es w
ith fi
nanc
ial c
redi
ts r
ecei
ved
from
non
-res
iden
ts.
D
ue to
qua
rter
ly r
epor
ting
data
are
sub
ject
to r
evis
ions
.10
Mer
gers
and
acq
uisi
tions
are
incl
uded
in th
is it
em.
11 B
anks
, oth
er n
onba
nk fi
nanc
ial i
nstit
utio
ns, i
nsur
ance
com
pani
es a
nd p
ensi
on fu
nds'
dat
a.12
Dat
a on
net
cha
nge
of tr
ade
cred
its-a
sset
s (p
aid
adva
nces
and
rec
eiva
bles
from
sup
plie
rs),
rep
orte
d to
the
BN
B a
re in
clud
ed in
this
item
.
Due
to q
uart
erly
rep
ortin
g da
ta a
re s
ubje
ct to
rev
isio
ns.
13 B
ank
for
Inte
rnat
iona
l Set
tlem
ents
(B
IS)
data
. For
201
2 an
d 20
13 -
dat
a ar
e su
bjec
t to
revi
sion
s.14
Dat
a on
net
cha
nge
of tr
ade
cred
its-li
abili
ties
(rec
eive
d ad
vanc
es a
nd p
ayab
les
to s
uppl
iers
), r
epor
ted
to th
e B
NB
are
incl
ude
d in
this
item
.
Due
to q
uart
erly
rep
ortin
g da
ta a
re s
ubje
ct to
rev
isio
ns.
15 E
xclu
ding
val
uatio
n ch
ange
s du
e to
the
exch
ange
rat
e or
pric
e ch
ange
s, c
hang
es a
ssoc
iate
d w
ith th
e cr
eatio
n of
res
erve
ass
ets
(mon
etar
izat
ion/
dem
onita
rizat
ion
of g
old
and
the
allo
catio
n
or c
ance
llatio
n of
SD
Rs)
and
rec
lass
ifica
tions
. A m
inus
sig
n (-
) de
note
s an
incr
ease
in th
e re
serv
es, a
pos
itive
sig
n (+
) -
a de
crea
se.
13

BA
LAN
CE
OF
PAYM
ENTS
OF
BU
LGA
RIA
AN
ALY
TIC
PR
ESEN
TATI
ON
*(Q
uart
erly
dat
a)
AN
ALI
TIC
PR
ES
EN
TA
TIO
N*
2010
2011
20
12
Cha
nge
2012
/201
1
(mln
EU
R)
Q1
Q2
Q3
Q4
Tot
alQ
1Q
2Q
3Q
4T
otal
Q1
Q2
Q3
Q4
Tot
alQ
1Q
2Q
3Q
4T
otal
Cur
rent
acc
ount
1-5
05.9
-333
.911
69.0
-862
.3-5
33.1
-119
.546
.593
5.5
-823
.339
.2-5
61.6
-383
.091
4.5
-498
.1-5
28.2
-442
.1-4
29.5
-21.
032
5.2
-567
.4
Goo
ds, c
redi
t (F
OB
)30
33.5
3799
.344
15.8
4312
.615
561.
247
60.0
4951
.653
88.6
5164
.020
264.
346
19.8
5256
.255
52.2
5364
.920
793.
1-1
40.2
304.
616
3.5
200.
952
8.7
Goo
ds, d
ebit
(FO
B)
-367
8.6
-467
6.6
-461
7.6
-535
2.1
-183
24.8
-504
4.5
-557
4.5
-574
6.9
-605
4.5
-224
20.4
-556
1.3
-653
6.8
-610
4.6
-621
2.4
-244
15.2
-516
.8-9
62.3
-357
.8-1
57.9
-199
4.7
Tra
de B
alan
ce 2
-645
.1-8
77.3
-201
.8-1
039.
5-2
763.
7-2
84.5
-622
.9-3
58.2
-890
.5-2
156.
1-9
41.6
-128
0.6
-552
.4-8
47.5
-362
2.1
-657
.0-6
57.7
-194
.243
.0-1
466.
0
Ser
vice
s, c
redi
t71
0.5
1156
.322
18.8
925.
950
11.5
816.
312
42.4
2323
.497
1.8
5353
.983
8.7
1408
.624
21.4
991.
156
59.9
22.4
166.
298
.019
.330
5.9
T
rans
port
atio
n 315
4.9
234.
039
2.1
205.
598
6.5
204.
227
4.9
415.
321
7.7
1112
.219
5.8
266.
742
6.3
209.
110
97.9
-8.4
-8.2
11.0
-8.6
-14.
3
T
rave
l 427
9.7
621.
415
06.1
339.
927
47.1
301.
266
0.1
1535
.035
6.1
2852
.429
7.5
668.
815
80.0
370.
229
16.6
-3.7
8.7
45.0
14.2
64.2
O
ther
ser
vice
s27
5.8
301.
032
0.6
380.
512
77.9
310.
930
7.4
373.
139
8.0
1389
.334
5.4
473.
241
5.1
411.
816
45.4
34.5
165.
742
.013
.825
6.0
Ser
vice
s, d
ebit
-691
.7-7
58.2
-866
.4-8
27.5
-314
3.7
-671
.8-7
43.6
-809
.6-8
05.7
-303
0.7
-748
.3-8
34.9
-914
.6-7
64.7
-326
2.5
-76.
5-9
1.3
-105
.04
1.0
-231
.8
T
rans
port
atio
n 3-1
37.0
-178
.6-1
92.5
-190
.9-6
99.0
-189
.5-2
07.3
-218
.6-2
14.1
-829
.5-1
99.5
-228
.3-2
39.0
-197
.7-8
64.5
-10.
0-2
0.9
-20.
516
.4-3
5.0
T
rave
l 4-1
98.4
-241
.0-2
84.7
-207
.0-9
31.2
-208
.5-2
45.8
-294
.9-2
09.6
-958
.7-1
98.4
-262
.8-3
31.1
-223
.5-1
015.
710
.1-1
7.1
-36.
2-1
3.9
-57.
0
Oth
er s
ervi
ces
-356
.2-3
38.5
-389
.1-4
29.5
-151
3.4
-273
.8-2
90.5
-296
.2-3
82.0
-124
2.5
-350
.4-3
43.8
-344
.5-3
43.5
-138
2.2
-76.
6-5
3.3
-48.
33
8.5
-139
.8
Ser
vice
s, n
et18
.839
8.1
1352
.498
.518
67.8
144.
649
8.8
1513
.816
6.1
2323
.390
.457
3.7
1506
.822
6.4
2397
.3-5
4.1
74.9
-7.0
60.3
74.1
Goo
ds a
nd s
ervi
ces,
net
-626
.3-4
79.1
1150
.6-9
41.0
-895
.9-1
39.9
-124
.111
55.5
-724
.416
7.1
-851
.1-7
06.9
954.
3-6
21.1
-122
4.8
-711
.2-5
82.
8-2
01.2
103.
2-1
391.
9
Inc
ome,
cre
dit
141.
116
8.4
169.
713
8.5
617.
614
4.9
173.
616
1.0
134.
561
4.0
156.
118
5.3
206.
818
2.4
730.
611
.211
.745
.947
.811
6.7
C
ompe
nsat
ion
of e
mpl
oyee
s 556
.293
.680
.759
.729
0.1
56.9
93.4
81.3
60.3
291.
855
.393
.698
.979
.932
7.7
-1.5
0.2
17.6
19.6
35.9
In
vest
men
t inc
ome
84.9
74.8
88.9
78.8
327.
588
.080
.279
.774
.232
2.1
100.
891
.710
8.0
102.
540
2.9
12.7
11.5
28.3
28.3
80.8
Dire
ct in
vest
men
t -0
.70.
513
.90.
714
.59.
9-4
.1-8
.0-1
2.9
-15.
116
.13.
517
.94.
341
.96.
27.
725
.817
.256
.9
P
ortfo
lio in
vest
men
t 72
.161
.462
.061
.025
6.5
61.8
67.9
62.8
64.4
256.
865
.568
.573
.174
.828
1.9
3.8
0.5
10.3
10.5
25.1
Oth
er in
vest
men
t 13
.612
.912
.917
.156
.616
.416
.424
.922
.780
.419
.119
.717
.023
.379
.12.
83.
3-7
.90.
6-1
.2 I
ncom
e, d
ebit
-394
.3-4
57.8
-547
.4-3
52.4
-175
1.8
-463
.7-6
69.3
-718
.4-5
75.1
-242
6.5
-468
.3-4
48.1
-632
.0-5
24.2
-207
2.6
-4.6
221.
186
.450
.935
3.8
C
ompe
nsat
ion
of e
mpl
oyee
s-3
.3-3
.6-2
.5-2
.5-1
1.9
-3.4
-3.2
-2.0
-3.7
-12.
4-4
.1-4
.1-4
.1-3
.7-1
6.1
-0.7
-0.9
-2.0
0.0
-3.7
In
vest
men
t inc
ome
-391
.0-4
54.1
-544
.9-3
49.9
-173
9.9
-460
.3-6
66.0
-716
.4-5
71.3
-241
4.1
-464
.2-4
44.0
-627
.9-5
20.5
-205
6.6
-3.9
222.
188
.450
.935
7.5
Dire
ct in
vest
men
t -2
21.8
-346
.3-4
13.8
-226
.4-1
208.
3-2
82.9
-533
.6-5
70.1
-425
.1-1
811.
7-2
99.5
-313
.9-5
04.9
-395
.3-1
513.
5-1
6.6
219.
865
.229
.929
8.1
Por
tfolio
inve
stm
ent
-56.
0-0
.3-2
4.2
-0.2
-80.
6-5
4.0
-0.2
-22.
1-0
.2-7
6.5
-41.
2-0
.3-2
0.0
-0.3
-61.
712
.80.
02.
00.
014
.8
O
ther
inve
stm
ent
-113
.2-1
07.5
-106
.9-1
23.3
-451
.0-1
23.5
-132
.2-1
24.2
-146
.0-5
25.9
-123
.5-1
29.8
-103
.0-1
25.0
-481
.3-0
.12.
321
.321
.044
.5
Inco
me,
net
-253
.2-2
89.4
-377
.7-2
13.9
-113
4.2
-318
.8-4
95.7
-557
.4-4
40.6
-181
2.5
-312
.2-2
62.8
-425
.2-3
41.8
-134
2.0
6.6
232.
913
2.3
98.7
470.
5
Goo
ds, s
ervi
ces
and
inco
me,
net
-879
.4-7
68.5
772.
9-1
155.
0-2
030.
0-4
58.8
-619
.759
8.1
-116
4.9
-164
5.4
-116
3.3
-969
.752
9.2
-963
.0-2
566.
8-7
04.6
-349
.9-6
8.9
202.
0-9
21.4
C
urre
nt tr
ansf
ers,
net
373.
643
4.7
396.
129
2.6
1496
.933
9.3
666.
333
7.4
341.
616
84.5
601.
758
6.7
385.
346
4.9
2038
.626
2.4
-79.
648
.012
3.3
354
.1 C
urre
nt tr
ansf
ers,
cre
ditt
541.
757
9.4
512.
141
4.3
2047
.550
6.3
764.
045
4.8
512.
722
37.9
824.
771
9.1
503.
565
6.5
2703
.831
8.4
-45.
048
.714
3.8
465.
9 C
urre
nt tr
ansf
ers,
deb
it-1
68.1
-144
.7-1
16.0
-121
.7-5
50.6
-167
.0-9
7.8
-117
.4-1
71.1
-553
.3-2
22.9
-132
.4-1
18.2
-191
.6-6
65.2
-55.
9-3
4.6
-0.8
-20.
5-1
11.8
Cap
ital a
ccou
nt 1
,6,7
62.3
-89.
517
8.4
139.
729
0.9
18.1
46.9
125.
730
6.2
496.
811
.344
.116
4.2
317.
153
6.8
-6.7
-2.7
38.5
10.9
40.0
Cap
ital t
rans
fers
, net
62.3
-111
.917
3.1
132.
825
6.3
14.2
27.6
120.
130
2.5
464.
416
.341
.514
8.1
308.
151
4.0
2.1
13.9
28.1
5.6
49.6
Cur
rent
and
Cap
ital a
ccou
nt-4
43.6
-423
.413
47.4
-722
.6-2
42.2
-101
.493
.410
61.2
-517
.253
6.0
-550
.3-3
38.8
1078
.7-1
81.0
8.6
-448
.9-4
32.2
17.5
336.
2-5
27.4
Fina
ncia
l acc
ount
1,6
-721
.654
.6-1
42.6
136.
5-6
73.1
-845
.4-1
82.7
-931
.399
1.2
-968
.228
.912
56.4
804.
514
1.5
2231
.387
4.3
1439
.117
35.8
-849
.731
99.5
Dire
ct in
vest
men
t-8
0.6
369.
626
4.6
423.
797
7.3
-151
.810
0.9
267.
998
1.6
1198
.764
0.6
410.
348
0.0
-229
.313
01.6
792.
330
9.4
212.
1-1
210.
910
2.9
A
broa
d-2
3.3
-44.
2-5
3.2
-53.
2-1
73.9
-45.
0-6
.3-7
0.7
6.1
-115
.9-3
2.2
-51.
2-2
1.9
-71.
4-1
76.7
12.9
-45.
048
.8-7
7.5
-60.
8
E
quity
cap
ital
-24.
1-2
0.4
-28.
2-4
3.5
-116
.2-2
6.4
-16.
0-5
5.7
-51.
7-1
49.8
-24.
6-4
8.3
-4.5
-57.
1-1
34.5
1.8
-32.
251
.2-5
.415
.3
R
einv
este
d ea
rnin
gs1.
92.
5-2
.66.
58.
2-5
.78.
111
.024
.638
.0-1
3.1
9.7
-13.
90.
0-1
7.3
-7.4
1.6
-24.
9-2
4.6
-55.
2
O
ther
cap
ital
-1.1
-26.
3-2
2.4
-16.
1-6
5.9
-12.
91.
7-2
6.0
33.2
-4.0
5.6
-12.
7-3
.5-1
4.3
-24.
918
.5-1
4.4
22.5
-47.
5-2
0.9
In
the
repo
rtin
g ec
onom
y 8-5
7.3
413.
831
7.8
476.
911
51.2
-106
.710
7.2
338.
697
5.5
1314
.667
2.8
461.
650
1.9
-157
.914
78.3
779.
535
4.4
163.
2-1
133.
416
3.7
Equ
ity c
apita
l18
9.2
281.
059
8.5
536.
016
04.7
234.
625
.928
0.0
563.
211
03.6
213.
321
3.5
249.
937
4.3
1051
.0-2
1.3
187.
7-3
0.1
-188
.9-5
2.6
Rei
nves
ted
earn
ings
-104
.5-1
00.6
-127
.6-1
12.9
-445
.7-4
6.8
-41.
3-3
6.5
-49.
1-1
73.7
25.4
26.1
22.3
2.7
76.6
72.3
67.4
58.8
51.8
250.
3
Oth
er c
apita
l 9-1
42.0
233.
5-1
53.1
53.7
-7.8
-294
.512
2.6
95.2
461.
438
4.7
434.
122
1.9
229.
7-5
35.0
350.
772
8.6
99.3
134.
5-9
96.4
-34.
0
Mer
gers
and
acq
uisi
tions
, net
10
0.0
0.0
0.0
0.0
0.0
0.0
0.0
0.0
0.0
0.0
0.0
0.0
0.0
0.0
0.0
0.0
0.0
0.0
0.0
0.0
Por
tfolio
inve
stm
ent,
net
-133
.1-3
15.7
-51.
7-1
34.9
-635
.4-1
79.9
-13.
6-2
35.7
71.8
-357
.4-3
70.4
-57.
173
6.0
-123
9.1
-930
.6-1
90.5
-43.
597
1.6
-131
0.8
-573
.2
Por
tfolio
inve
stm
ent,
asss
ets 1
1-9
0.0
-208
.3-8
4.3
-165
.3-5
47.9
-68.
013
.4-1
38.3
145.
4-4
7.6
-301
.3-1
1.5
76.9
-125
7.9
-149
3.7
-233
.4-2
4.9
215.
3-1
403.
2-1
446.
2
Equ
ity s
ecur
ities
-51.
0-4
9.8
-58.
5-0
.3-1
59.6
-8.1
5.9
102.
1-1
3.2
86.8
18.8
-3.4
-9.8
-44.
9-3
9.3
27.0
-9.4
-111
.9-3
1.7
-126
.0
Deb
t sec
uriti
es-3
9.0
-158
.5-2
5.8
-165
.0-3
88.3
-59.
87.
4-2
40.4
158.
5-1
34.3
-320
.2-8
.086
.7-1
213.
0-1
454.
5-2
60.3
-15.
532
7.2
-137
1.5
-132
0.1
Por
tfolio
inve
stm
ent,
liabi
litie
s-4
3.1
-107
.432
.630
.4-8
7.5
-112
.0-2
7.0
-97.
3-7
3.6
-309
.9-6
9.1
-45.
665
9.0
18.8
563.
142
.9-1
8.6
756.
492
.487
3.0
E
quity
sec
uriti
es-1
7.7
1.6
18.4
5.5
7.8
-7.5
-5.8
-4.5
-13.
4-3
1.2
1.8
-17.
70.
818
.53.
59.
3-1
1.8
5.3
31.9
34.7
D
ebt s
ecur
ities
-25.
4-1
09.0
14.2
24.8
-95.
4-1
04.5
-21.
2-9
2.9
-60.
1-2
78.7
-71.
0-2
8.0
658.
20.
355
9.6
33.5
-6.8
751.
160
.583
8.3
Fin
anci
al d
eriv
ativ
es, n
et-1
1.4
-3.5
-10.
10.
4-2
4.7
-10.
9-6
.2-2
8.7
-19.
4-6
5.3
-6.0
-5.6
-7.1
-14.
5-3
3.3
4.8
0.6
21.6
4.9
32.0
14

BA
LAN
CE
OF
PAYM
ENTS
OF
BU
LGA
RIA
AN
ALY
TIC
PR
ESEN
TATI
ON
*(Q
uart
erly
dat
a)
AN
ALI
TIC
PR
ES
EN
TA
TIO
N*
2010
2011
20
12
Cha
nge
2012
/201
1
(mln
EU
R)
Q1
Q2
Q3
Q4
Tot
alQ
1Q
2Q
3Q
4T
otal
Q1
Q2
Q3
Q4
Tot
alQ
1Q
2Q
3Q
4T
otal
Oth
er in
vest
men
t, ne
t-4
96.4
4.2
-345
.5-1
52.7
-990
.3-5
02.8
-263
.8-9
34.8
-42.
7-1
744.
1-2
35.2
908.
8-4
04.3
1624
.318
93.6
267.
611
72.6
530.
516
67.1
3637
.8 O
ther
inve
stm
ent,
asse
ts64
.839
2.3
-176
.5-3
06.7
-26.
2-3
21.9
-459
.3-5
30.9
599.
3-7
12.8
-355
.975
0.4
-42.
974
1.1
1092
.8-3
4.0
1209
.748
8.0
141
.818
05.5
T
rade
cre
dits
12
-6.6
-97.
3-8
1.6
99.3
-86.
2-1
10.9
51.1
-124
.986
.1-9
8.6
-174
.90.
00.
00.
0-1
74.9
-64.
0-5
1.1
124.
9-8
6.1
-76.
3
Loa
ns0.
2-3
5.7
-52.
6-2
2.4
-110
.5-2
6.8
16.5
-67.
35.
6-7
2.0
-59.
721
.2-4
2.5
-132
.4-2
13.4
-32.
94.
624
.8-1
38.0
-141
.5
C
urre
ncy
and
depo
sits
13
72.1
550.
0-1
00.2
-374
.014
7.9
-155
.5-5
02.2
-313
.848
6.8
-484
.8-1
10.5
765.
35.
290
2.5
1562
.545
.012
67.6
319.
041
5.7
2047
.3
Oth
er a
sset
s-1
.0-2
4.7
57.9
-9.5
22.6
-28.
7-2
4.7
-24.
920
.8-5
7.5
-10.
8-3
6.1
-5.6
-29.
0-8
1.4
17.9
-11.
319
.3-4
9.8
-24.
00.
00.
00.
00.
00.
0 O
ther
inve
stm
ent,
liabi
litie
s-5
61.2
-388
.0-1
68.9
154.
1-9
64.1
-181
.019
5.5
-403
.8-6
42.0
-103
1.3
120.
715
8.3
-361
.488
3.2
800.
930
1.6
-37.
24
2.5
1525
.318
32.2
T
rade
cre
dits
14
-95.
049
.7-4
9.7
62.7
-32.
4-8
0.0
89.8
-44.
290
.456
.1-1
4.3
0.0
0.0
0.0
-14.
365
.7-8
9.8
44.2
-90.
4-7
0.3
L
oans
-174
.2-1
86.2
-511
.848
5.7
-386
.534
6.4
97.3
-71.
0-3
89.0
-16.
317
2.2
75.5
-59.
459
3.4
781.
7-1
74.2
-21.
811
.698
2.4
798.
0
Cur
renc
y an
d de
posi
ts-3
11.1
-272
.035
5.7
-414
.6-6
42.0
-487
.017
.4-2
99.6
-348
.6-1
117.
9-4
5.6
70.8
-310
.228
2.2
-2.8
441.
453
.4-1
0.6
630.
81
115.
1
Oth
er li
abili
ties
19.0
20.5
36.9
20.3
96.7
39.6
-9.0
11.0
5.2
46.8
8.3
12.0
8.3
7.6
36.2
-31.
321
.0-2
.72.
4-1
0.5
Cur
rent
, Cap
ital a
nd F
inan
cial
Acc
ount
-116
5.2
-368
.812
04.7
-586
.1-9
15.3
-946
.8-8
9.3
129.
947
4.0
-432
.2-5
21.4
917.
618
83.2
-39.
622
39.9
425
.410
06.8
1753
.4-5
13.6
2672
.1
Net
err
ors
and
omis
sion
s37
5.8
-13.
6-4
82.3
651.
553
1.4
282.
118
1.3
340.
3-2
12.9
590.
934
5.7
-278
.6-4
00.3
254.
2-7
8.9
63.7
-459
.9-7
40.6
467.
0-6
69.8
OVE
RA
L B
ALA
NC
E-7
89.4
-382
.472
2.4
65.4
-383
.9-6
64.7
92.1
470.
226
1.1
158.
7-1
75.6
639.
014
83.0
214.
621
61.0
489.
154
6.9
1012
.8-4
6.5
2002
.3
Res
erve
s an
d re
late
d ite
ms
789.
438
2.4
-722
.4-6
5.4
383.
966
4.7
-92.
1-4
70.2
-261
.1-1
58.7
175.
6-6
39.0
-148
3.0
-214
.6-2
161.
0-4
89.1
-546
.9-1
012.
846
.5-2
002.
3
Offi
cial
res
erve
ass
ets 1
578
9.4
382.
4-7
22.4
-65.
438
3.9
664.
7-9
2.1
-470
.2-2
61.1
-158
.717
5.6
-639
.0-1
483.
0-2
14.6
-216
1.0
-489
.1-5
46.9
-101
2.8
46.5
-200
2.3
U
se o
f fun
d cr
edits
and
loan
s, n
et0.
00.
00.
00.
00.
00.
00.
00.
00.
00.
00.
00.
00.
00.
00.
00.
00.
00.
00.
00.
0
Exc
eptio
nal f
inan
cing
tran
sact
ions
0.0
0.0
0.0
0.0
0.0
0.0
0.0
0.0
0.0
0.0
0.0
0.0
0.0
0.0
0.0
0.0
0.0
0.0
0.0
0.0
* A
naly
tic p
rese
ntat
ion
in a
ccor
danc
e w
ith IM
F 5
-th
editi
on o
f the
"B
alan
ce o
f Pay
men
ts M
anua
l".
1 Pre
limin
ary
data
. In
acco
rdan
ce w
ith th
e B
NB
pra
ctic
e an
d w
ith th
e E
CB
dat
a re
visi
on r
equi
rem
ents
(in
clud
ed in
the
EC
B T
imet
able
for
Exc
hang
e of
Bal
ance
of P
aym
ents
, Int
erna
tiona
l In
vest
men
t Pos
ition
and
Res
erve
Ass
ets
Sta
tistic
s w
ithin
the
ES
CB
), th
e da
ta fo
r Ja
nuar
y 20
13 a
re r
evis
ed. W
ith th
e M
arch
201
3 r
epor
t, ba
lanc
e of
pay
men
ts d
ata
for
Feb
ruar
y 20
13 a
re to
be
revi
sed.
2 For
201
2 an
d 20
13 p
relim
inar
y N
SI
data
as
of A
pril
4, 2
013
whi
ch in
clud
e da
ta fr
om th
e sy
stem
INT
RA
ST
AT
for
the
EU
mem
ber
stat
es a
nd fr
om c
usto
ms
decl
arat
ions
for
non-
EU
cou
ntrie
s.
The
rec
alcu
latio
n of
impo
rts
at F
OB
pric
es is
bas
ed o
n a
met
hodo
logy
dev
elop
ed b
y th
e B
NB
and
the
NS
I .3 E
stim
ates
follo
win
g a
met
hodo
logy
of t
he B
NB
and
the
NS
I.4 E
stim
ates
follo
win
g a
met
hodo
logy
of t
he B
NB
. Dat
a fo
r 20
07-2
013
are
base
d on
pre
limin
ary
NS
I dat
a on
the
num
ber
of fo
reig
n vi
sito
rs a
nd B
ulga
rians
, who
hav
e tr
avel
led
abro
ad a
nd B
NB
est
imat
es o
f the
exp
endi
ture
s (r
ecei
pts)
by
purp
ose
of th
e tr
avel
.5 E
stim
ates
follo
win
g a
met
hodo
logy
of t
he B
NB
.6 A
min
us s
ign
deno
tes
a ca
pita
l out
flow
(in
crea
se in
ass
ets
or d
ecre
ase
in li
abili
ties)
. 7 T
he it
em in
clud
es C
apita
l tra
nsfe
rs a
nd A
cqui
sitio
n/D
ispo
sal o
f non
prod
uced
non
finan
cial
ass
ets.
8 P
relim
inar
y da
ta. D
ata
are
prov
ided
by
dire
ct in
vest
men
t com
pani
es r
epor
ting
to B
NB
, Age
ncy
for
Priv
atiz
atio
n, N
SI,
Cen
tral
De
posi
tory
, ban
ks a
nd o
ther
s.
The
201
2 an
d 20
13 d
ata
incl
ude
only
ban
ks’ d
ata
on r
einv
este
d ea
rnin
gs.
9 On
the
basi
s of
the
repo
rts
subm
itted
to th
e B
NB
by
the
ente
rpris
es w
ith fi
nanc
ial c
redi
ts r
ecei
ved
from
non
-res
iden
ts.
D
ue to
qua
rter
ly r
epor
ting
data
are
sub
ject
to r
evis
ions
.10
Mer
gers
and
acq
uisi
tions
are
incl
uded
in th
is it
em.
11 B
anks
, oth
er n
onba
nk fi
nanc
ial i
nstit
utio
ns, i
nsur
ance
com
pani
es a
nd p
ensi
on fu
nds'
dat
a.12
Dat
a on
net
cha
nge
of tr
ade
cred
its-a
sset
s (p
aid
adva
nces
and
rec
eiva
bles
from
sup
plie
rs),
rep
orte
d to
the
BN
B a
re in
clud
ed in
this
item
.
Due
to q
uart
erly
rep
ortin
g da
ta a
re s
ubje
ct to
rev
isio
ns.
13 B
ank
for
Inte
rnat
iona
l Set
tlem
ents
(B
IS)
data
. For
201
2 an
d 20
13 -
dat
a ar
e su
bjec
t to
revi
sion
s.14
Dat
a on
net
cha
nge
of tr
ade
cred
its-li
abili
ties
(rec
eive
d ad
vanc
es a
nd p
ayab
les
to s
uppl
iers
), r
epor
ted
to th
e B
NB
are
incl
ude
d in
this
item
.
Due
to q
uart
erly
rep
ortin
g da
ta a
re s
ubje
ct to
rev
isio
ns.
15 E
xclu
ding
val
uatio
n ch
ange
s du
e to
the
exch
ange
rat
e or
pric
e ch
ange
s, c
hang
es a
ssoc
iate
d w
ith th
e cr
eatio
n of
res
erve
ass
ets
(mon
etar
izat
ion/
dem
onita
rizat
ion
of g
old
and
the
allo
catio
n
or c
ance
llatio
n of
SD
Rs)
and
rec
lass
ifica
tions
. A m
inus
sig
n (-
) de
note
s an
incr
ease
in th
e re
serv
es, a
pos
itive
sig
n (+
) -
a de
crea
se.
15

BA
LAN
CE
OF
PAYM
ENTS
OF
BU
LGA
RIA
AN
ALY
TIC
PR
ESEN
TATI
ON
*(A
nnua
l dat
a)
AN
ALI
TIC
PR
ES
EN
TA
TIO
N*
(mln
EU
R)
2005
/200
420
06/2
005
2007
/200
620
08/2
007
2009
/200
820
10/2
009
2011
/201
020
12/2
011
Cur
rent
acc
ount
1-1
306.
9-2
705.
7-4
647.
8-7
755.
2-8
182.
5-3
116.
2-5
33.1
39.2
-528
.2-1
398.
8-1
942.
1-3
107.
5-4
27.2
5066
.325
83.1
572.
3-5
67.4
Goo
ds, c
redi
t (F
OB
)79
84.9
9466
.312
011.
913
511.
915
204.
011
699.
215
561.
220
264.
320
793.
114
81.5
2545
.515
00.0
1692
.1-3
504.
838
62.0
4703
.152
8.7
Goo
ds, d
ebit
(FO
B)
-109
38.4
-138
76.1
-175
74.1
-207
57.2
-238
01.7
-158
73.1
-183
24.8
-224
20.4
-244
15.2
-293
7.7
-369
8.0
-318
3.1
-304
4.5
7928
.6-2
451.
7-4
095.
6-1
994.
7
Tra
de B
alan
ce 2
-295
3.5
-440
9.7
-556
2.3
-724
5.3
-859
7.7
-417
3.9
-276
3.7
-215
6.1
-362
2.1
-145
6.2
-115
2.5
-168
3.1
-135
2.4
4423
.814
10.2
607.
6-1
466.
0
Ser
vice
s, c
redi
t32
62.1
3564
.141
86.8
4760
.053
55.4
4916
.350
11.5
5353
.956
59.9
302.
162
2.7
573.
259
5.4
-439
.195
.234
2.5
305.
9
T
rans
port
atio
n 382
5.5
964.
712
60.3
1105
.612
10.6
1007
.698
6.5
1112
.210
97.9
139.
229
5.6
-154
.710
5.0
-202
.9-2
1.2
125.
7-1
4.3
T
rave
l 417
88.6
1955
.720
63.8
2593
.828
73.8
2681
.227
47.1
2852
.429
16.6
167.
110
8.1
530.
028
0.0
-192
.766
.010
5.3
64.2
O
ther
ser
vice
s64
8.0
643.
786
2.7
1060
.612
71.0
1227
.512
77.9
1389
.316
45.4
-4.3
219.
019
7.9
210.
4-4
3.5
50.3
111.
525
6.0
Ser
vice
s, d
ebit
-260
5.8
-274
5.2
-326
3.8
-358
6.5
-404
5.7
-361
6.5
-314
3.7
-303
0.7
-326
2.5
-139
.4-5
18.6
-322
.7-4
59.3
429.
347
2.8
113.
0-2
31.8
T
rans
port
atio
n 3-8
71.0
-882
.4-1
043.
2-8
49.0
-987
.2-8
01.5
-699
.0-8
29.5
-864
.5-1
1.4
-160
.819
4.2
-138
.218
5.7
102.
5-1
30.5
-35.
0
T
rave
l 4-1
098.
9-1
053.
4-1
174.
4-1
303.
0-1
566.
6-1
258.
7-9
31.2
-958
.7-1
015.
745
.5-1
20.9
-128
.7-2
63.6
307.
932
7.5
-27.
5-5
7.0
O
ther
ser
vice
s-6
35.9
-809
.4-1
046.
2-1
434.
4-1
491.
9-1
556.
2-1
513.
4-1
242.
5-1
382.
2-1
73.5
-236
.8-3
88.2
-57.
5-6
4.3
42.8
271.
0-1
39.8
Ser
vice
s, n
et65
6.3
818.
992
3.0
1173
.513
09.6
1299
.918
67.8
2323
.323
97.3
162.
610
4.1
250.
513
6.1
-9.8
567.
945
5.4
74.1
Goo
ds a
nd s
ervi
ces,
net
-229
7.2
-359
0.8
-463
9.2
-607
1.8
-728
8.1
-287
4.0
-895
.916
7.1
-122
4.8
-129
3.6
-104
8.4
-143
2.6
-121
6.3
4414
.019
78.2
1063
.0-1
391.
9
Inc
ome,
cre
dit
1238
.312
18.4
1264
.182
8.1
985.
780
4.3
617.
661
4.0
730.
6-1
9.9
45.7
-436
.015
7.5
-181
.4-1
86.6
-3.6
116.
7
C
ompe
nsat
ion
of e
mpl
oyee
s 510
35.6
925.
610
30.7
551.
360
4.2
425.
729
0.1
291.
832
7.7
-110
.010
5.1
-479
.452
.9-1
78.5
-135
.51.
735
.9
Inve
stm
ent i
ncom
e20
2.7
292.
823
3.4
276.
938
1.5
378.
632
7.5
322.
140
2.9
90.1
-59.
443
.410
4.6
-2.9
-51.
1-5
.380
.8
D
irect
inve
stm
ent
-1.8
-1.3
9.4
1.3
40.8
4.8
14.5
-15.
141
.90.
410
.7-8
.039
.5-3
6.0
9.7
-29.
556
.9
P
ortfo
lio in
vest
men
t 11
2.9
197.
410
0.4
109.
819
4.2
294.
425
6.5
256.
828
1.9
84.5
-97.
19.
484
.410
0.2
-37.
90.
425
.1
O
ther
inve
stm
ent
91.6
96.7
123.
716
5.7
146.
579
.456
.680
.479
.15.
127
.042
.0-1
9.3
-67.
0-2
2.9
23.8
-1.2
Inc
ome,
deb
it-9
92.3
-115
1.2
-194
2.6
-319
2.4
-274
1.3
-200
2.5
-175
1.8
-242
6.5
-207
2.6
-158
.9-7
91.4
-124
9.8
451.
173
8.8
250.
7-6
74.7
353.
8
Com
pens
atio
n of
em
ploy
ees
-8.9
-11.
2-2
2.4
-47.
9-8
8.2
-63.
8-1
1.9
-12.
4-1
6.1
-2.3
-11.
2-2
5.5
-40.
324
.451
.9-0
.5-3
.7
Inve
stm
ent i
ncom
e-9
83.4
-114
0.0
-192
0.2
-314
4.4
-265
3.1
-193
8.7
-173
9.9
-241
4.1
-205
6.6
-156
.6-7
80.2
-122
4.2
491.
371
4.4
198.
8-6
74.2
357.
5
D
irect
inve
stm
ent
-608
.2-7
41.8
-147
3.1
-255
9.6
-184
8.9
-131
1.8
-120
8.3
-181
1.7
-151
3.5
-133
.6-7
31.3
-108
6.5
710.
753
7.1
103.
5-6
03.4
298.
1
P
ortfo
lio in
vest
men
t -1
85.7
-172
.4-1
32.1
-125
.8-9
5.8
-73.
4-8
0.6
-76.
5-6
1.7
13.3
40.3
6.3
30.1
22.4
-7.3
4.1
14.8
Oth
er in
vest
men
t -1
89.5
-225
.8-3
15.0
-459
.0-7
08.4
-553
.6-4
51.0
-525
.9-4
81.3
-36.
3-8
9.2
-144
.0-2
49.4
154.
910
2.6
-74.
944
.5
Inco
me,
net
246.
067
.2-6
78.5
-236
4.3
-175
5.7
-119
8.3
-113
4.2
-181
2.5
-134
2.0
-178
.8-7
45.7
-168
5.8
608.
655
7.4
64.1
-678
.347
0.5
Goo
ds, s
ervi
ces
and
inco
me,
net
-205
1.2
-352
3.6
-531
7.7
-843
6.1
-904
3.8
-407
2.3
-203
0.0
-164
5.4
-256
6.8
-147
2.4
-179
4.1
-311
8.3
-607
.749
71.4
2042
.338
4.7
-921
.4
C
urre
nt tr
ansf
ers,
net
744.
381
7.9
670.
068
0.8
861.
395
6.1
1496
.916
84.5
2038
.673
.7-1
48.0
10.9
180.
494
.854
0.9
187.
635
4.1
Cur
rent
tran
sfer
s, c
redi
tt90
4.1
997.
484
5.8
1254
.616
14.9
1562
.720
47.5
2237
.927
03.8
93.4
-151
.640
8.8
360.
2-5
2.2
484.
819
0.3
465.
9 C
urre
nt tr
ansf
ers,
deb
it-1
59.8
-179
.5-1
75.8
-573
.8-7
53.6
-606
.6-5
50.6
-553
.3-6
65.2
-19.
73.
7-3
98.0
-179
.814
7.0
56.0
-2.8
-111
.8
Cap
ital a
ccou
nt1,
6,7
163.
523
5.5
180.
0-5
87.3
277.
447
7.1
290.
949
6.8
536.
872
.0-5
5.5
-767
.386
4.8
199.
7-1
86.2
205.
940
.0
Cap
ital t
rans
fers
, net
163.
523
5.5
180.
0-5
87.3
277.
447
8.7
256.
346
4.4
514.
072
.0-5
5.5
-767
.386
4.8
201.
3-2
22.4
208.
049
.6
Cur
rent
and
Cap
ital a
ccou
nt-1
143.
5-2
470.
2-4
467.
8-8
342.
6-7
905.
1-2
639.
1-2
42.2
536.
08.
6-1
326.
7-1
997.
6-3
874.
843
7.5
5266
.023
96.9
778.
2-5
27.4
Fina
ncia
l acc
ount
1,6
2294
.939
78.1
7084
.613
676.
411
463.
311
63.4
-673
.1-9
68.2
2231
.316
83.2
3106
.565
91.8
-221
3.1
-103
00.0
-183
6.5
-295
.031
99.5
Dire
ct in
vest
men
t22
52.1
3226
.560
80.7
8838
.262
05.7
2505
.397
7.3
1198
.713
01.6
974.
428
54.2
2757
.5-2
632.
5-3
700.
5-1
528.
022
1.4
102.
9
Abr
oad
165.
6-2
49.1
-140
.9-2
06.2
-522
.168
.3-1
73.9
-115
.9-1
76.7
-414
.710
8.2
-65.
3-3
15.9
590.
5-2
42.3
58.0
-60.
8
E
quity
cap
ital
-26.
5-5
2.8
-76.
0-2
02.5
-552
.810
8.7
-116
.2-1
49.8
-134
.5-2
6.2
-23.
2-1
26.5
-350
.366
1.4
-224
.9-3
3.6
15.3
Rei
nves
ted
earn
ings
0.8
-5.3
-7.4
7.6
-13.
79.
68.
238
.0-1
7.3
-6.1
-2.1
15.0
-21.
323
.3-1
.429
.7-5
5.2
Oth
er c
apita
l19
1.3
-191
.0-5
7.5
-11.
344
.3-4
9.9
-65.
9-4
.0-2
4.9
-382
.413
3.5
46.1
55.7
-94.
3-1
6.0
61.9
-20.
9
In
the
repo
rtin
g ec
onom
y 827
35.9
3152
.162
21.6
9051
.867
27.8
2436
.911
51.2
1314
.614
78.3
416.
230
69.5
2830
.2-2
323.
9-4
290.
9-1
285.
716
3.4
163.
7
E
quity
cap
ital
1831
.917
89.3
3234
.147
65.2
4109
.818
84.0
1604
.711
03.6
1051
.0-4
2.6
1444
.815
31.1
-655
.3-2
225.
9-2
79.2
-501
.1-5
2.6
Rei
nves
ted
earn
ings
441.
440
8.7
957.
515
47.2
-183
.5-2
69.0
-445
.7-1
73.7
76.6
-32.
654
8.7
589.
7-1
730.
7-8
5.5
-176
.627
2.0
250.
3
Oth
er c
apita
l 946
2.7
954.
120
30.0
2739
.528
01.5
822.
0-7
.838
4.7
350.
749
1.4
1076
.070
9.4
62.0
-197
9.5
-829
.839
2.5
-34.
0
Mer
gers
and
acq
uisi
tions
, net
10
-649
.532
3.5
0.0
-7.4
0.0
0.0
0.0
0.0
0.0
973.
0-3
23.5
-7.4
7.4
0.0
0.0
0.0
0.0
Por
tfolio
inve
stm
ent,
net
-417
.4-1
036.
929
2.2
-518
.4-7
30.9
-619
.1-6
35.4
-357
.4-9
30.6
-619
.513
29.1
-810
.6-2
12.6
111.
9-1
6.3
278.
0-5
73.2
Por
tfolio
inve
stm
ent,
asss
ets 1
118
.217
.8-2
89.4
-129
.3-2
52.9
-623
.5-5
47.9
-47.
6-1
493.
7-0
.4-3
07.2
160.
2-1
23.7
-370
.575
.650
0.3
-144
6.2
2012
Cha
nge
2008
2009
2011
2004
2005
2006
2007
2010
16
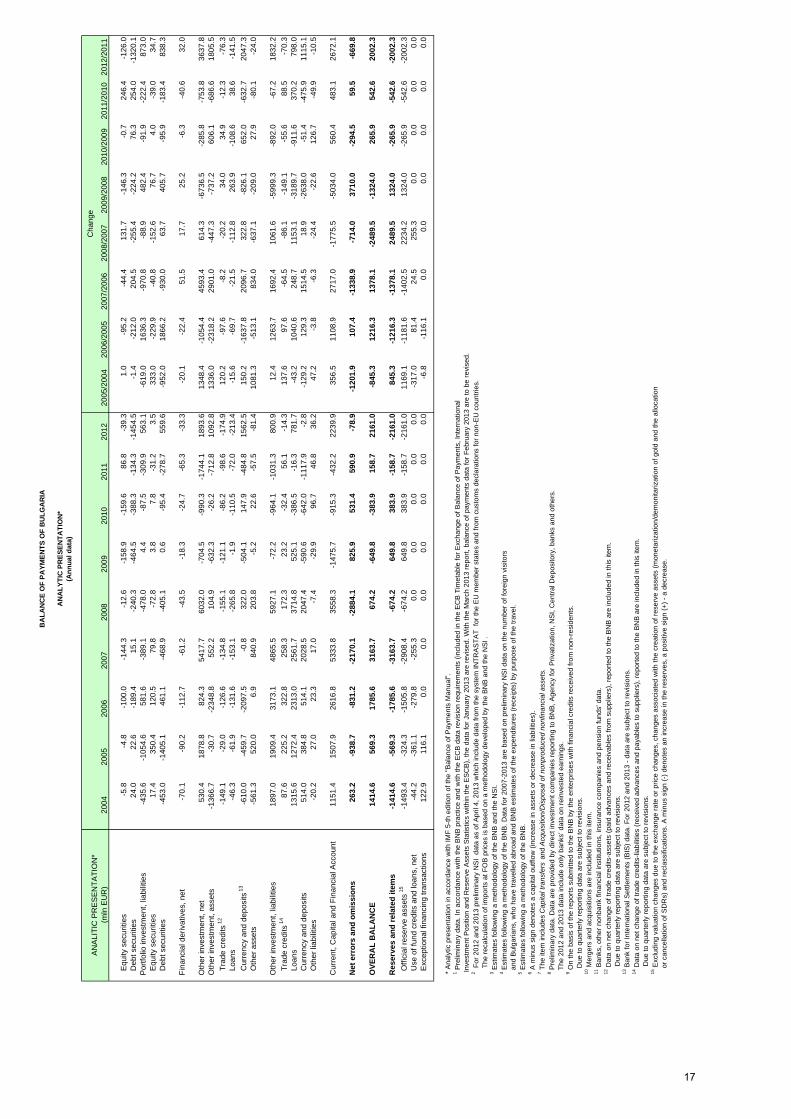
BA
LAN
CE
OF
PAYM
ENTS
OF
BU
LGA
RIA
AN
ALY
TIC
PR
ESEN
TATI
ON
*(A
nnua
l dat
a)
AN
ALI
TIC
PR
ES
EN
TA
TIO
N*
(mln
EU
R)
2005
/200
420
06/2
005
2007
/200
620
08/2
007
2009
/200
820
10/2
009
2011
/201
020
12/2
011
2012
Cha
nge
2008
2009
2011
2004
2005
2006
2007
2010
E
quity
sec
uriti
es-5
.8-4
.8-1
00.0
-144
.3-1
2.6
-158
.9-1
59.6
86.8
-39.
31.
0-9
5.2
-44.
413
1.7
-146
.3-0
.724
6.4
-126
.0
Deb
t sec
uriti
es24
.022
.6-1
89.4
15.1
-240
.3-4
64.5
-388
.3-1
34.3
-145
4.5
-1.4
-212
.020
4.5
-255
.4-2
24.2
76.3
254.
0-1
320.
1 P
ortfo
lio in
vest
men
t, lia
bilit
ies
-435
.6-1
054.
658
1.6
-389
.1-4
78.0
4.4
-87.
5-3
09.9
563.
1-6
19.0
1636
.3-9
70.8
-88.
948
2.4
-91.
9-2
22.4
873.
0
Equ
ity s
ecur
ities
17.4
350.
412
0.5
79.8
-72.
83.
87.
8-3
1.2
3.5
333.
0-2
29.9
-40.
8-1
52.6
76.7
4.0
-39.
034
.7
Deb
t sec
uriti
es-4
53.0
-140
5.1
461.
1-4
68.9
-405
.10.
6-9
5.4
-278
.755
9.6
-952
.018
66.2
-930
.063
.740
5.7
-95.
9-1
83.4
838.
3
Fin
anci
al d
eriv
ativ
es, n
et-7
0.1
-90.
2-1
12.7
-61.
2-4
3.5
-18.
3-2
4.7
-65.
3-3
3.3
-20.
1-2
2.4
51.5
17.7
25.2
-6.3
-40.
632
.0
Oth
er in
vest
men
t, ne
t53
0.4
1878
.882
4.3
5417
.760
32.0
-704
.5-9
90.3
-174
4.1
1893
.613
48.4
-105
4.4
4593
.461
4.3
-673
6.5
-285
.8-7
53.8
3637
.8 O
ther
inve
stm
ent,
asse
ts-1
366.
7-3
0.7
-234
8.8
552.
210
4.9
-632
.3-2
6.2
-712
.810
92.8
1336
.0-2
318.
229
01.0
-447
.3-7
37.2
606.
1-6
86.6
1805
.5
T
rade
cre
dits
12
-149
.1-2
9.0
-126
.6-1
34.8
-155
.1-1
21.1
-86.
2-9
8.6
-174
.912
0.2
-97.
6-8
.2-2
0.2
34.0
34.9
-12.
3-7
6.3
L
oans
-46.
3-6
1.9
-131
.6-1
53.1
-265
.8-1
.9-1
10.5
-72.
0-2
13.4
-15.
6-6
9.7
-21.
5-1
12.8
263.
9-1
08.6
38.6
-141
.5
C
urre
ncy
and
depo
sits
13
-610
.0-4
59.7
-209
7.5
-0.8
322.
0-5
04.1
147.
9-4
84.8
1562
.515
0.2
-163
7.8
2096
.732
2.8
-826
.165
2.0
-632
.720
47.3
O
ther
ass
ets
-561
.352
0.0
6.9
840.
920
3.8
-5.2
22.6
-57.
5-8
1.4
1081
.3-5
13.1
834.
0-6
37.1
-209
.027
.9-8
0.1
-24.
0
Oth
er in
vest
men
t, lia
bilit
ies
1897
.019
09.4
3173
.148
65.5
5927
.1-7
2.2
-964
.1-1
031.
380
0.9
12.4
1263
.716
92.4
1061
.6-5
999.
3-8
92.0
-67.
218
32.
2
T
rade
cre
dits
14
87.6
225.
232
2.8
258.
317
2.3
23.2
-32.
456
.1-1
4.3
137.
697
.6-6
4.5
-86.
1-1
49.1
-55.
688
.5-7
0.3
L
oans
1315
.612
72.4
2313
.025
61.7
3714
.852
5.1
-386
.5-1
6.3
781.
7-4
3.2
1040
.624
8.7
1153
.1-3
189.
7-9
11.6
370.
279
8.0
C
urre
ncy
and
depo
sits
514.
038
4.8
514.
120
28.5
2047
.4-5
90.6
-642
.0-1
117.
9-2
.8-1
29.2
129.
315
14.5
18.9
-263
8.0
-51.
4-4
75.9
1115
.1
Oth
er li
abili
ties
-20.
227
.023
.317
.0-7
.4-2
9.9
96.7
46.8
36.2
47.2
-3.8
-6.3
-24.
4-2
2.6
126.
7-4
9.9
-10.
5
Cur
rent
, Cap
ital a
nd F
inan
cial
Acc
ount
1151
.415
07.9
2616
.853
33.8
3558
.3-1
475.
7-9
15.3
-432
.222
39.9
356.
511
08.9
2717
.0-1
775.
5-5
034.
05
60.4
483.
126
72.1
Net
err
ors
and
omis
sion
s26
3.2
-938
.7-8
31.2
-217
0.1
-288
4.1
825.
953
1.4
590.
9-7
8.9
-120
1.9
107.
4-1
338.
9-7
14.0
3710
.0-2
94.5
59.5
-669
.8
OVE
RA
L B
ALA
NC
E14
14.6
569.
317
85.6
3163
.767
4.2
-649
.8-3
83.9
158.
721
61.0
-845
.312
16.3
1378
.1-2
489.
5-1
324.
026
5.9
542.
620
02.3
Res
erve
s an
d re
late
d ite
ms
-141
4.6
-569
.3-1
785.
6-3
163.
7-6
74.2
649.
838
3.9
-158
.7-2
161.
084
5.3
-121
6.3
-137
8.1
2489
.513
24.0
-265
.9-5
42.6
-200
2.3
O
ffici
al r
eser
ve a
sset
s 15
-149
3.4
-324
.3-1
505.
8-2
908.
4-6
74.2
649.
838
3.9
-158
.7-2
161.
011
69.1
-118
1.6
-140
2.5
2234
.213
24.0
-265
.9-5
42.6
-200
2.3
U
se o
f fun
d cr
edits
and
loan
s, n
et-4
4.2
-361
.1-2
79.8
-255
.30.
00.
00.
00.
00.
0-3
17.0
81.4
24.5
255.
30.
00.
00.
00.
0
Exc
eptio
nal f
inan
cing
tran
sact
ions
122.
911
6.1
0.0
0.0
0.0
0.0
0.0
0.0
0.0
-6.8
-116
.10.
00.
00.
00.
00.
00.
0
* A
naly
tic p
rese
ntat
ion
in a
ccor
danc
e w
ith IM
F 5
-th
editi
on o
f the
"B
alan
ce o
f Pay
men
ts M
anua
l".
1 Pre
limin
ary
data
. In
acco
rdan
ce w
ith th
e B
NB
pra
ctic
e an
d w
ith th
e E
CB
dat
a re
visi
on r
equi
rem
ents
(in
clud
ed in
the
EC
B T
imet
able
for
Exc
hang
e of
Bal
ance
of P
aym
ents
, Int
erna
tiona
l In
vest
men
t Pos
ition
and
Res
erve
Ass
ets
Sta
tistic
s w
ithin
the
ES
CB
), th
e da
ta fo
r Ja
nuar
y 20
13 a
re r
evis
ed. W
ith th
e M
arch
201
3 r
epor
t, ba
lanc
e of
pay
men
ts d
ata
for
Feb
ruar
y 20
13 a
re to
be
revi
sed.
2 For
201
2 an
d 20
13 p
relim
inar
y N
SI
data
as
of A
pril
4, 2
013
whi
ch in
clud
e da
ta fr
om th
e sy
stem
INT
RA
ST
AT
for
the
EU
mem
ber
stat
es a
nd fr
om c
usto
ms
decl
arat
ions
for
non-
EU
cou
ntrie
s.
The
rec
alcu
latio
n of
impo
rts
at F
OB
pric
es is
bas
ed o
n a
met
hodo
logy
dev
elop
ed b
y th
e B
NB
and
the
NS
I .3 E
stim
ates
follo
win
g a
met
hodo
logy
of t
he B
NB
and
the
NS
I.4 E
stim
ates
follo
win
g a
met
hodo
logy
of t
he B
NB
. Dat
a fo
r 20
07-2
013
are
base
d on
pre
limin
ary
NS
I dat
a on
the
num
ber
of fo
reig
n vi
sito
rs a
nd B
ulga
rians
, who
hav
e tr
avel
led
abro
ad a
nd B
NB
est
imat
es o
f the
exp
endi
ture
s (r
ecei
pts)
by
purp
ose
of th
e tr
avel
.5 E
stim
ates
follo
win
g a
met
hodo
logy
of t
he B
NB
.6 A
min
us s
ign
deno
tes
a ca
pita
l out
flow
(in
crea
se in
ass
ets
or d
ecre
ase
in li
abili
ties)
. 7 T
he it
em in
clud
es C
apita
l tra
nsfe
rs a
nd A
cqui
sitio
n/D
ispo
sal o
f non
prod
uced
non
finan
cial
ass
ets.
8 P
relim
inar
y da
ta. D
ata
are
prov
ided
by
dire
ct in
vest
men
t com
pani
es r
epor
ting
to B
NB
, Age
ncy
for
Priv
atiz
atio
n, N
SI,
Cen
tral
De
posi
tory
, ban
ks a
nd o
ther
s.
The
201
2 an
d 20
13 d
ata
incl
ude
only
ban
ks’ d
ata
on r
einv
este
d ea
rnin
gs.
9 On
the
basi
s of
the
repo
rts
subm
itted
to th
e B
NB
by
the
ente
rpris
es w
ith fi
nanc
ial c
redi
ts r
ecei
ved
from
non
-res
iden
ts.
D
ue to
qua
rter
ly r
epor
ting
data
are
sub
ject
to r
evis
ions
.10
Mer
gers
and
acq
uisi
tions
are
incl
uded
in th
is it
em.
11 B
anks
, oth
er n
onba
nk fi
nanc
ial i
nstit
utio
ns, i
nsur
ance
com
pani
es a
nd p
ensi
on fu
nds'
dat
a.12
Dat
a on
net
cha
nge
of tr
ade
cred
its-a
sset
s (p
aid
adva
nces
and
rec
eiva
bles
from
sup
plie
rs),
rep
orte
d to
the
BN
B a
re in
clud
ed in
this
item
.
Due
to q
uart
erly
rep
ortin
g da
ta a
re s
ubje
ct to
rev
isio
ns.
13 B
ank
for
Inte
rnat
iona
l Set
tlem
ents
(B
IS)
data
. For
201
2 an
d 20
13 -
dat
a ar
e su
bjec
t to
revi
sion
s.14
Dat
a on
net
cha
nge
of tr
ade
cred
its-li
abili
ties
(rec
eive
d ad
vanc
es a
nd p
ayab
les
to s
uppl
iers
), r
epor
ted
to th
e B
NB
are
incl
ude
d in
this
item
.
Due
to q
uart
erly
rep
ortin
g da
ta a
re s
ubje
ct to
rev
isio
ns.
15 E
xclu
ding
val
uatio
n ch
ange
s du
e to
the
exch
ange
rat
e or
pric
e ch
ange
s, c
hang
es a
ssoc
iate
d w
ith th
e cr
eatio
n of
res
erve
ass
ets
(mon
etar
izat
ion/
dem
onita
rizat
ion
of g
old
and
the
allo
catio
n
or c
ance
llatio
n of
SD
Rs)
and
rec
lass
ifica
tions
. A m
inus
sig
n (-
) de
note
s an
incr
ease
in th
e re
serv
es, a
pos
itive
sig
n (+
) -
a de
crea
se.
17

BA
LAN
CE
OF
PAYM
ENTS
OF
BU
LGA
RIA
STA
ND
AR
D P
RES
ENTA
TIO
N*
(Mon
thly
dat
a)
ST
AN
DA
RD
PR
ES
EN
TA
TIO
N *
Cum
ulat
ed fi
gure
s
F
ebru
ary
Tw
elve
-mon
th c
umul
ated
fig
ures
end
ing
(mln
EU
R)
Feb
.12
Mar
.12
Apr
.12
May
. 12
Jun.
12
Jul.
12A
ug. 1
2S
ep. 1
2O
ct. 1
2N
ov. 1
2D
ec.1
2Ja
n. 1
3F
eb.1
320
1220
1329
.II.2
012
28.II
.201
3
Cur
rent
Acc
ount
1-3
53.0
45.0
-314
.2-1
66.7
97.9
284.
237
4.3
256.
0-1
77.8
34.0
-354
.4-2
0.1
-356
.7-6
06.5
-376
.8-5
63.4
-298
.4
Goo
ds, s
ervi
ces,
and
inco
me,
net
-397
.6-4
51.7
-488
.3-3
96.3
-85.
016
2.3
250.
511
6.3
-246
.3-1
37.4
-579
.3-7
1.2
-299
.7-7
11.7
-370
.9-2
133.
8-2
226.
0
c
redi
t17
71.7
2080
.319
75.5
2319
.725
54.9
2848
.728
24.3
2507
.423
15.5
2328
.318
94.5
2087
.919
60.5
3534
.340
48.4
2608
1.6
2769
7.7
deb
it-2
169.
3-2
532.
0-2
463.
9-2
716.
1-2
639.
9-2
686.
3-2
573.
8-2
391.
1-2
561.
9-2
465.
7-2
473.
8-2
159.
2-2
260.
2-4
246.
0-4
419.
4-2
8215
.4-2
9923
.7
G
oods
, net
2-3
03.7
-359
.5-4
79.5
-429
.7-3
71.4
-259
.9-1
36.3
-156
.2-3
61.0
-152
.9-3
33.5
-46.
0-3
21.3
-582
.1-3
67.3
-260
3.6
-340
7.4
cre
dit
1463
.317
19.7
1620
.318
65.2
1770
.718
65.5
1871
.618
15.1
1860
.019
69.0
1535
.917
78.2
1656
.229
00.1
3434
.420
102.
021
327.
4
d
ebit
-176
7.0
-207
9.2
-209
9.9
-229
4.9
-214
2.1
-212
5.5
-200
7.8
-197
1.3
-222
1.1
-212
1.9
-186
9.4
-182
4.2
-197
7.5
-348
2.1
-380
1.7
-227
05.6
-247
34.7
S
ervi
ces,
net
34.5
0.8
34.7
114.
242
4.8
614.
757
0.8
321.
313
0.7
56.3
39.4
33.0
44.9
89.7
77.8
2320
.023
85.5
cre
dit
257.
630
1.0
298.
138
6.2
724.
391
5.2
887.
561
8.7
385.
830
2.8
302.
525
5.5
257.
553
7.7
512.
953
61.7
5635
.1
T
rans
port
atio
n 3
61.8
68.0
68.3
75.2
123.
216
3.6
154.
410
8.3
77.2
72.6
59.3
64.8
61.0
127.
812
5.8
1105
.910
96.0
T
rave
l 488
.498
.511
7.4
177.
637
3.8
611.
761
9.3
349.
015
9.8
110.
410
0.1
113.
310
0.1
199.
121
3.4
2849
.229
30.9
O
ther
ser
vice
s 10
7.4
134.
611
2.4
133.
422
7.3
139.
811
3.8
161.
414
8.8
119.
814
3.2
77.3
96.3
210.
917
3.7
1406
.616
08.2
deb
it-2
23.1
-300
.3-2
63.4
-272
.0-2
99.5
-300
.4-3
16.7
-297
.5-2
55.1
-246
.5-2
63.2
-222
.5-2
12.6
-448
.0-4
35.1
-304
1.7
-324
9.6
T
rans
port
atio
n 3
-64.
9-7
1.4
-71.
5-8
1.2
-75.
5-7
8.7
-84.
2-7
6.1
-69.
3-6
5.8
-62.
6-7
0.8
-74.
2-1
28.1
-144
.9-8
37.9
-881
.4
T
rave
l 4-5
8.2
-77.
3-8
5.7
-83.
9-9
3.3
-98.
6-1
25.4
-107
.0-8
0.1
-79.
3-6
4.0
-66.
6-6
5.6
-121
.1-1
32.2
-944
.1-1
026.
8
Oth
er s
ervi
ces
-100
.1-1
51.6
-106
.1-1
07.0
-130
.7-1
23.1
-107
.1-1
14.3
-105
.6-1
01.3
-136
.6-8
5.1
-72.
9-1
98.8
-158
.0-1
259.
7-1
341.
4
In
com
e, n
et
-128
.4-9
2.9
-43.
6-8
0.8
-138
.4-1
92.4
-184
.0-4
8.7
-16.
0-4
0.8
-285
.1-5
8.2
-23.
3-2
19.3
-81.
5-1
850.
2-1
204.
2
c
redi
t 50
.859
.557
.168
.359
.968
.065
.273
.669
.756
.656
.154
.346
.896
.610
1.1
617.
973
5.2
M
onet
ary
auth
oriti
es
16.1
16.8
15.9
19.3
17.2
18.5
17.9
16.9
18.8
17.2
16.1
19.5
16.1
33.6
35.6
206.
821
0.3
G
ener
al g
over
nmen
t 0.
20.
10.
00.
10.
01.
10.
00.
00.
30.
00.
00.
10.
00.
20.
15.
31.
6
Ban
ks7.
07.
58.
06.
55.
85.
75.
77.
17.
16.
07.
99.
06.
610
.515
.562
.782
.7
Oth
er s
ecto
rs
27.5
35.2
33.1
42.5
36.9
42.7
41.6
49.7
43.5
33.4
32.0
25.7
24.1
52.2
49.9
343.
044
0.5
deb
it -1
79.2
-152
.5-1
00.6
-149
.2-1
98.3
-260
.4-2
49.3
-122
.3-8
5.7
-97.
4-3
41.2
-112
.5-7
0.1
-315
.9-1
82.6
-246
8.1
-193
9.4
M
onet
ary
auth
oriti
es
G
ener
al g
over
nmen
t -1
.4-6
.5-2
.9-8
.7-9
.9-2
0.6
-1.2
-6.8
-2.7
-7.3
-9.5
-41.
5-1
.0-4
2.5
-42.
5-1
14.8
-118
.5
Ban
ks
-21.
1-2
0.4
-17.
9-1
7.8
-74.
8-5
7.9
-20.
1-1
5.7
-8.9
-11.
6-8
.5-1
3.3
-12.
3-3
7.9
-25.
5-4
35.1
-279
.2
Oth
er s
ecto
rs
-156
.6-1
25.6
-79.
8-1
22.7
-113
.6-1
81.9
-227
.9-9
9.8
-74.
2-7
8.4
-323
.2-5
7.7
-56.
8-2
35.4
-114
.5-1
918.
2-1
541.
7
C
urre
nt tr
ansf
ers,
net
44.6
496.
617
4.1
229.
718
2.9
121.
812
3.8
139.
768
.617
1.4
224.
951
.1-5
7.0
105.
1-5
.915
70.4
1927
.6
c
redi
t16
4.0
541.
921
8.5
275.
022
5.6
149.
916
5.9
187.
714
7.6
206.
230
2.7
129.
010
7.6
282.
823
6.6
2162
.526
57.6
G
ener
al g
over
nmen
t 89
.246
0.3
140.
918
2.6
146.
265
.793
.911
1.2
75.0
141.
323
1.4
54.2
24.1
143.
178
.312
79.4
1727
.0
Oth
er s
ecto
rs
74.8
81.6
77.5
92.3
79.4
84.2
72.0
76.5
72.6
64.9
71.3
74.8
83.5
139.
715
8.3
883.
193
0.6
deb
it-1
19.4
-45.
3-4
4.3
-45.
3-4
2.7
-28.
1-4
2.1
-48.
0-7
9.0
-34.
8-7
7.8
-77.
8-1
64.7
-177
.6-2
42.5
-592
.1-7
30.0
G
ener
al g
over
nmen
t -1
06.7
-39.
8-3
7.9
-37.
9-3
5.0
-24.
0-3
5.4
-42.
8-6
8.4
-27.
1-4
9.1
-70.
2-9
1.8
-150
.0-1
62.1
-514
.6-5
59.5
O
ther
sec
tors
-1
2.7
-5.5
-6.4
-7.4
-7.7
-4.2
-6.7
-5.2
-10.
7-7
.7-2
8.7
-7.6
-72.
8-2
7.6
-80.
4-7
7.5
-170
.50.
00.
00.
00.
0 C
apita
l and
fina
ncia
l acc
ount
1,5
198.
8-2
46.1
205.
410
0.8
355.
3-3
20.5
-11.
6-1
82.1
288.
9-4
.9-4
0.0
147.
8-2
4.8
461.
912
2.9
-293
.426
8.1
Cap
ital a
ccou
nt1,
5,6
4.6
2.9
1.6
33.5
9.0
120.
610
.333
.3-7
9.8
176.
722
0.2
-0.1
4.3
8.4
4.1
494.
353
2.5
C
apita
l tra
nsfe
rs, n
et8.
06.
50.
033
.58.
111
8.8
-3.8
33.1
-81.
516
3.7
225.
9-3
.8-0
.19.
8-3
.946
3.4
500.
4
c
redi
t8.
06.
70.
333
.57.
911
8.8
9.4
33.1
31.0
163.
722
6.4
-3.7
-0.1
9.8
-3.7
464.
662
7.0
G
ener
al g
over
nmen
t 7.
46.
70.
233
.57.
511
8.4
9.4
33.1
30.4
163.
722
0.3
-3.7
-0.1
7.4
-3.7
456.
761
9.5
O
ther
sec
tors
0.
60.
00.
10.
00.
30.
40.
00.
00.
50.
06.
10.
00.
02.
40.
07.
97.
50.
00.
00.
00.
0
d
ebit
0.0
-0.2
-0.3
0.0
0.2
0.0
-13.
20.
0-1
12.5
0.0
-0.5
-0.1
0.0
0.0
-0.1
-1.1
-126
.7
Gen
eral
gov
ernm
ent
0.0
0.0
0.0
0.0
0.0
0.0
0.0
0.0
-112
.50.
00.
00.
00.
00.
00.
00.
0-1
12.5
O
ther
sec
tors
0.
0-0
.2-0
.30.
00.
20.
0-1
3.2
0.0
0.0
0.0
-0.5
-0.1
0.0
0.0
-0.1
-1.1
-14.
2
Fin
anci
al a
ccou
nt1,
519
4.3
-249
.020
3.8
67.3
346.
3-4
41.2
-21.
9-2
15.4
368.
7-1
81.6
-260
.314
7.9
-29.
145
3.5
118.
8-7
87.7
-264
.3
D
irect
inve
stm
ent,
net
187.
114
0.1
387.
5-1
65.7
188.
664
.136
7.5
48.4
186.
1-1
65.0
-250
.428
.74.
850
0.5
33.5
1438
.683
4.6
Abr
oad
-10.
7-8
.4-8
.8-2
9.9
-12.
6-1
2.9
-6.4
-2.5
-19.
7-4
2.6
-9.1
-0.7
-6.1
-23.
8-6
.8-1
02.1
-159
.7
Equ
ity
-9.6
-4.7
-9.3
-26.
9-1
2.1
-5.1
-3.5
4.1
-15.
7-3
6.2
-5.3
-1.9
-6.0
-19.
9-7
.9-1
44.1
-122
.5
Oth
er c
apita
l3.
30.
7-2
.8-6
.2-3
.7-3
.21.
6-2
.0-4
.1-6
.4-3
.81.
3-0
.14.
91.
19.
0-2
8.7
R
einv
este
d ea
rnin
gs-4
.4-4
.43.
23.
23.
2-4
.6-4
.6-4
.60.
00.
00.
00.
00.
0-8
.70.
033
.0-8
.5
18

BA
LAN
CE
OF
PAYM
ENTS
OF
BU
LGA
RIA
STA
ND
AR
D P
RES
ENTA
TIO
N*
(Mon
thly
dat
a)
ST
AN
DA
RD
PR
ES
EN
TA
TIO
N *
Cum
ulat
ed fi
gure
s
F
ebru
ary
Tw
elve
-mon
th c
umul
ated
fig
ures
end
ing
(mln
EU
R)
Feb
.12
Mar
.12
Apr
.12
May
. 12
Jun.
12
Jul.
12A
ug. 1
2S
ep. 1
2O
ct. 1
2N
ov. 1
2D
ec.1
2Ja
n. 1
3F
eb.1
320
1220
1329
.II.2
012
28.II
.201
3
In r
epor
ting
coun
try 7
197.
814
8.5
396.
2-1
35.8
201.
177
.037
4.0
50.9
205.
8-1
22.4
-241
.429
.410
.952
4.3
40.3
1540
.799
4.3
E
quity
44
.786
.268
.895
.848
.985
.256
.710
8.0
169.
176
.612
8.6
23.6
26.5
127.
150
.110
78.1
974.
0
O
ther
cap
ital 8
144.
653
.931
8.7
-240
.314
3.5
-15.
630
9.9
-64.
535
.8-1
99.9
-370
.9-0
.6-2
1.9
380.
2-2
2.5
588.
1-5
2.0
R
einv
este
d ea
rnin
gs8.
58.
58.
78.
78.
77.
47.
47.
40.
90.
90.
96.
46.
416
.912
.8-1
25.5
72.4
Mer
gers
and
acq
uisi
tions
, net
90.
00.
00.
00.
00.
00.
00.
00.
00.
00.
00.
00.
00.
00.
00.
00.
00.
0
P
ortfo
lio in
vest
men
t, ne
t-3
1.2
-368
.818
9.5
-27.
3-2
19.2
1009
.2-2
07.3
-65.
8-6
0.4
-110
7.6
-71.
1-3
37.4
-271
.9-1
.6-6
09.3
-182
.3-1
538.
3
A
sset
s 1
0-6
0.5
-342
.123
0.7
-12.
8-2
29.4
314.
3-1
74.7
-62.
6-5
1.1
-111
0.0
-96.
7-3
6.8
-179
.040
.7-2
15.8
53.5
-175
0.3
Equ
ity s
ecur
ities
7.6
1.8
6.9
12.1
-22.
415
.97.
6-3
3.3
-2.0
-28.
3-1
4.6
-9.5
2.8
17.1
-6.7
97.9
-63.
0
D
ebt s
ecur
ities
-68.
1-3
43.8
223.
8-2
4.8
-207
.029
8.4
-182
.3-2
9.4
-49.
1-1
081.
7-8
2.2
-27.
3-1
81.8
23.7
-209
.2-4
4.4
-168
7.3
L
iabi
litie
s29
.3-2
6.8
-41.
2-1
4.5
10.1
694.
9-3
2.6
-3.2
-9.3
2.4
25.7
-300
.6-9
2.8
-42.
4-3
93.4
-235
.821
2.0
Equ
ity s
ecur
ities
4.3
-2.5
-13.
6-2
.4-1
.6-6
.3-3
.710
.819
.61.
3-2
.40.
00.
04.
30.
0-2
1.9
-0.8
Deb
t sec
uriti
es25
.0-2
4.3
-27.
6-1
2.1
11.8
701.
2-2
8.9
-14.
0-2
8.9
1.1
28.1
-300
.6-9
2.8
-46.
7-3
93.4
-213
.921
2.9
F
inan
cial
der
ivat
ives
,net
-0.3
-5.2
-1.9
-3.1
-0.6
-3.7
-1.7
-1.7
-7.9
-1.6
-5.0
-0.2
-2.3
-0.8
-2.5
-56.
8-3
5.0
O
ther
inve
stm
ent
-157
.049
4.7
-188
.737
5.5
722.
0-5
25.2
-74.
919
5.9
-85.
410
87.1
622.
6-8
55.5
-17.
7-7
29.9
-873
.3-1
939.
417
50.3
Ass
ets
-39.
519
5.2
-64.
347
6.9
337.
9-2
29.9
53.7
133.
385
.015
2.2
503.
9-7
83.7
5.6
-551
.1-7
78.0
-903
.386
5.8
Tra
de c
redi
ts 1
1-5
8.3
-58.
30.
00.
00.
00.
00.
00.
00.
00.
00.
00.
00.
0-1
16.5
0.0
-141
.2-5
8.3
Loan
s-3
1.0
-34.
711
.36.
33.
5-2
5.0
5.2
-22.
8-3
6.8
4.4
-99.
9-9
1.4
1.6
-25.
0-8
9.8
-82.
4-2
78.2
Cur
renc
y an
d de
posi
ts 1
236
.630
0.5
-71.
946
3.3
374.
0-2
00.0
35.0
170.
211
9.7
173.
560
9.3
-708
.312
.6-4
11.0
-695
.7-6
23.3
1277
.9
O
ther
ass
ets
13.2
-12.
3-3
.77.
2-3
9.6
-4.9
13.4
-14.
12.
2-2
5.7
-5.5
16.0
-8.6
1.5
7.5
-56.
4-7
5.5
Lia
bilit
ies
-117
.529
9.5
-124
.4-1
01.4
384.
2-2
95.3
-128
.662
.6-1
70.4
934.
911
8.8
-71.
9-2
3.4
-178
.9-9
5.2
-103
6.1
884.
5
Tra
de c
redi
ts 1
3-4
.6-4
.70.
00.
00.
00.
00.
00.
00.
00.
00.
00.
00.
0-9
.60.
010
0.5
-4.7
Loan
s-6
8.1
250.
5-2
0.5
-79.
217
5.3
13.7
-136
.463
.2-3
77.1
916.
254
.335
.623
2.2
-78.
326
7.7
-250
.111
27.7
Cur
renc
y an
d de
posi
ts-6
3.4
72.7
-122
.7-6
0.5
254.
0-2
96.3
-0.9
-13.
021
3.9
48.5
19.8
-109
.2-2
50.4
-118
.3-3
59.6
-955
.3-2
44.0
Oth
er li
abili
ties
18.6
-19.
018
.838
.3-4
5.1
-12.
78.
612
.3-7
.2-2
9.8
44.7
1.8
-5.1
27.3
-3.3
68.8
5.6
B
NB
Res
erve
ass
ets
(incr
ease
: -) 1
419
5.6
-509
.8-1
82.4
-112
.1-3
44.4
-985
.5-1
05.4
-392
.133
6.3
5.5
-556
.413
12.2
258.
168
5.4
1570
.3-4
7.8
-127
6.1
M
onet
ary
gold
0.0
0.0
0.0
0.0
0.0
0.0
0.0
0.0
0.0
0.0
0.0
0.0
0.0
0.0
0.0
0.0
0.0
S
peci
al d
raw
ing
right
s0.
2-0
.1-0
.10.
2-0
.1-0
.10.
20.
0-0
.30.
10.
00.
00.
10.
10.
00.
0-0
.2
Res
erve
pos
ition
in th
e F
und
0.0
0.0
0.0
0.0
0.0
0.0
0.0
0.0
0.0
0.0
0.0
0.0
0.0
0.0
0.0
0.0
0.0
F
orei
gn e
xcha
nge
195.
4-5
09.7
-182
.4-1
12.3
-344
.4-9
85.4
-105
.6-3
92.0
336.
65.
4-5
56.4
1312
.325
8.0
685.
315
70.3
-47.
7-1
275.
9
Net
Err
ors
and
Om
issi
ons
154.
120
1.1
108.
865
.9-4
53.2
36.4
-362
.7-7
3.9
-111
.1-2
9.1
394.
4-1
27.7
381.
514
4.6
253.
885
6.8
30.3
* S
tand
ard
pres
enta
tion
in a
ccor
danc
e w
ith IM
F 5
-th
editi
on o
f the
"B
alan
ce o
f Pay
men
ts M
anua
l".
1 Pre
limin
ary
data
. In
acco
rdan
ce w
ith th
e B
NB
pra
ctic
e an
d w
ith th
e E
CB
dat
a re
visi
on r
equi
rem
ents
(in
clud
ed in
the
EC
B T
imet
able
for
Exc
hang
e of
Bal
ance
of P
aym
ents
, Int
erna
tiona
l In
vest
men
t Pos
ition
and
Res
erve
Ass
ets
Sta
tistic
s w
ithin
the
ES
CB
), th
e da
ta fo
r Ja
nuar
y 20
13 a
re r
evis
ed. W
ith th
e M
arch
201
3 r
epor
t, ba
lanc
e of
pay
men
ts d
ata
for
Feb
ruar
y 20
13 a
re to
be
revi
sed.
2 For
201
2 an
d 20
13 p
relim
inar
y N
SI
data
as
of A
pril
4, 2
013
whi
ch in
clud
e da
ta fr
om th
e sy
stem
INT
RA
ST
AT
for
the
EU
mem
ber
stat
es a
nd fr
om c
usto
ms
decl
arat
ions
for
non-
EU
cou
ntrie
s.
The
rec
alcu
latio
n of
impo
rts
at F
OB
pric
es is
bas
ed o
n a
met
hodo
logy
dev
elop
ed b
y th
e B
NB
and
the
NS
I .3 E
stim
ates
follo
win
g a
met
hodo
logy
of t
he B
NB
and
the
NS
I.4 E
stim
ates
follo
win
g a
met
hodo
logy
of t
he B
NB
. Dat
a fo
r 20
07-2
013
are
base
d on
pre
limin
ary
NS
I dat
a on
the
num
ber
of fo
reig
n vi
sito
rs a
nd B
ulga
rians
, who
hav
e tr
avel
led
abro
ad a
nd B
NB
est
imat
es o
f the
exp
endi
ture
s (r
ecei
pts)
by
purp
ose
of th
e tr
avel
.5 E
stim
ates
follo
win
g a
met
hodo
logy
of t
he B
NB
.6 T
he it
em in
clud
es C
apita
l tra
nsfe
rs a
nd A
cqui
sitio
n/D
ispo
sal o
f non
prod
uced
non
finan
cial
ass
ets.
7 P
relim
inar
y da
ta. D
ata
are
prov
ided
by
dire
ct in
vest
men
t com
pani
es r
epor
ting
to B
NB
, Age
ncy
for
Priv
atiz
atio
n, N
SI,
Cen
tral
De
posi
tory
, ban
ks a
nd o
ther
s.
The
201
2 an
d 20
13 d
ata
incl
ude
only
ban
ks’ d
ata
on r
einv
este
d ea
rnin
gs.
8 On
the
basi
s of
the
repo
rts
subm
itted
to th
e B
NB
by
the
ente
rpris
es w
ith fi
nanc
ial c
redi
ts r
ecei
ved
from
non
-res
iden
ts.
D
ue to
qua
rter
ly r
epor
ting
data
are
sub
ject
to r
evis
ions
.9 M
erge
rs a
nd a
cqui
sitio
ns a
re in
clud
ed in
this
item
.10
Ban
ks, o
ther
non
bank
fina
ncia
l ins
titut
ions
, ins
uran
ce c
ompa
nies
and
pen
sion
fund
s' d
ata.
11 D
ata
on n
et c
hang
e of
trad
e cr
edits
-ass
ets
(pai
d ad
vanc
es a
nd r
ecei
vabl
es fr
om s
uppl
iers
), r
epor
ted
to th
e B
NB
are
incl
uded
in th
is it
em.
D
ue to
qua
rter
ly r
epor
ting
data
are
sub
ject
to r
evis
ions
. 12
Ban
k fo
r In
tern
atio
nal S
ettle
men
ts (
BIS
) da
ta. F
or 2
012
and
2013
- d
ata
are
subj
ect t
o re
visi
ons.
13 D
ata
on n
et c
hang
e of
trad
e cr
edits
-liab
ilitie
s (r
ecei
ved
adva
nces
and
pay
able
s to
sup
plie
rs),
rep
orte
d to
the
BN
B a
re in
clud
ed
in th
is it
em.
D
ue to
qua
rter
ly r
epor
ting
data
are
sub
ject
to r
evis
ions
. 14
Exc
ludi
ng v
alua
tion
chan
ges
due
to th
e ex
chan
ge r
ate
or p
rice
chan
ges,
cha
nges
ass
ocia
ted
with
the
crea
tion
of r
eser
ve a
sset
s (m
onet
ariz
atio
n/de
mon
itariz
atio
n of
gol
d an
d th
e al
loca
tion
or
can
cella
tion
of S
DR
s) a
nd r
ecla
ssifi
catio
ns. A
min
us s
ign
(-)
deno
tes
an in
crea
se in
the
rese
rves
, a p
ositi
ve s
ign
(+)
- a
decr
ease
.
19

BA
LAN
CE
OF
PAYM
ENTS
OF
BU
LGA
RIA
STA
ND
AR
D P
RES
ENTA
TIO
N*
(Ann
ual d
ata)
ST
AN
DA
RD
PR
ES
EN
TA
TIO
N *
(mln
EU
R)
2012
2005
/200
420
06/2
005
2007
/200
620
08/2
007
2009
/200
820
10/2
009
2011
/201
020
12/2
011
Cur
rent
Acc
ount
1-1
306.
9-2
705.
7-4
647.
8-7
755.
2-8
182.
5-3
116.
2-5
33.1
39.2
-528
.2-1
398.
8-1
942.
1-3
107.
5-4
27.2
5066
.325
83.1
572.
3-5
67.4
Goo
ds, s
ervi
ces,
and
inco
me,
net
-205
1.2
-352
3.6
-531
7.7
-843
6.1
-904
3.8
-407
2.3
-203
0.0
-164
5.4
-256
6.8
-147
2.4
-179
4.1
-311
8.3
-607
.749
71.
420
42.3
384.
7-9
21.4
cre
dit
1248
5.3
1424
8.9
1746
2.8
1910
0.0
2154
5.0
1741
9.8
2119
0.3
2623
2.3
2718
3.6
1763
.632
13.9
1637
.224
45.0
-412
5.2
3770
.550
42.0
951.
3
d
ebit
-145
36.4
-177
72.5
-227
80.5
-275
36.0
-305
88.7
-214
92.1
-232
20.3
-278
77.6
-297
50.4
-323
6.0
-500
8.0
-475
5.5
-305
2.7
9096
.7-1
728.
2-4
657.
3-1
872.
7
G
oods
, net
2-2
953.
5-4
409.
7-5
562.
3-7
245.
3-8
597.
7-4
173.
9-2
763.
7-2
156.
1-3
622.
1-1
456.
2-1
152.
5-1
683.
1-1
352.
444
23.8
1410
.260
7.6
-146
6.0
cre
dit
7984
.994
66.3
1201
1.9
1351
1.9
1520
4.0
1169
9.2
1556
1.2
2026
4.3
2079
3.1
1481
.525
45.5
1500
.016
92.1
-350
4.8
3862
.047
03.1
528.
7
d
ebit
-109
38.4
-138
76.1
-175
74.1
-207
57.2
-238
01.7
-158
73.1
-183
24.8
-224
20.4
-244
15.2
-293
7.7
-369
8.0
-318
3.1
-304
4.5
7928
.6-2
451.
7-4
095.
6-1
994.
7
S
ervi
ces,
net
656.
381
8.9
923.
011
73.5
1309
.612
99.9
1867
.823
23.3
2397
.316
2.6
104.
125
0.5
136.
1-9
.856
7.9
455.
474
.1
c
redi
t32
62.1
3564
.141
86.8
4760
.053
55.4
4916
.350
11.5
5353
.956
59.9
302.
162
2.7
573.
259
5.4
-439
.195
.234
2.5
305.
9
T
rans
port
atio
n 382
5.5
964.
712
60.3
1105
.612
10.6
1007
.698
6.5
1112
.210
97.9
139.
229
5.6
-154
.710
5.0
-202
.9-2
1.2
125.
7-1
4.3
T
rave
l 417
88.6
1955
.720
63.8
2593
.828
73.8
2681
.227
47.1
2852
.429
16.6
167.
110
8.1
530.
028
0.0
-192
.766
.010
5.3
64.2
O
ther
ser
vice
s 64
8.0
643.
786
2.7
1060
.612
71.0
1227
.512
77.9
1389
.316
45.4
-4.3
219.
019
7.9
210.
4-4
3.5
50.3
111.
525
6.0
deb
it-2
605.
8-2
745.
2-3
263.
8-3
586.
5-4
045.
7-3
616.
5-3
143.
7-3
030.
7-3
262.
5-1
39.4
-518
.6-3
22.7
-459
.342
9.3
472.
811
3.0
-231
.8
T
rans
port
atio
n 3-8
71.0
-882
.4-1
043.
2-8
49.0
-987
.2-8
01.5
-699
.0-8
29.5
-864
.5-1
1.4
-160
.819
4.2
-138
.218
5.7
102.
5-1
30.5
-35.
0
T
rave
l 4-1
098.
9-1
053.
4-1
174.
4-1
303.
0-1
566.
6-1
258.
7-9
31.2
-958
.7-1
015.
745
.5-1
20.9
-128
.7-2
63.6
307.
932
7.5
-27.
5-5
7.0
O
ther
ser
vice
s-6
35.9
-809
.4-1
046.
2-1
434.
4-1
491.
9-1
556.
2-1
513.
4-1
242.
5-1
382.
2-1
73.5
-236
.8-3
88.2
-57.
5-6
4.3
42.8
271.
0-1
39.8
In
com
e, n
et
246.
067
.2-6
78.5
-236
4.3
-175
5.7
-119
8.3
-113
4.2
-181
2.5
-134
2.0
-178
.8-7
45.7
-168
5.8
608.
655
7.4
64.1
-678
.347
0.5
cre
dit
1238
.312
18.4
1264
.182
8.1
985.
780
4.3
617.
661
4.0
730.
6-1
9.9
45.7
-436
.015
7.5
-181
.4-1
86.6
-3.6
116.
7
Mon
etar
y au
thor
ities
11
8.2
171.
513
5.3
164.
820
6.3
227.
818
8.5
202.
720
8.3
53.3
-36.
129
.441
.521
.6-3
9.4
14.3
5.6
G
ener
al g
over
nmen
t 41
.026
.828
.733
.513
.92.
84.
77.
11.
7-1
4.3
2.0
4.7
-19.
5-1
1.1
1.8
2.5
-5.4
B
anks
43.4
92.8
56.3
62.2
75.5
79.4
51.0
62.3
77.8
49.3
-36.
45.
913
.33.
9-2
8.4
11.3
15.5
O
ther
sec
tors
10
35.7
927.
410
43.7
567.
769
0.0
494.
237
3.5
341.
844
2.9
-108
.311
6.3
-476
.012
2.3
-195
.8-1
20.7
-31.
610
1.0
deb
it -9
92.3
-115
1.2
-194
2.6
-319
2.4
-274
1.3
-200
2.5
-175
1.8
-242
6.5
-207
2.6
-158
.9-7
91.4
-124
9.8
451.
173
8.8
250.
7-6
74.7
353.
8
Mon
etar
y au
thor
ities
0.
00.
00.
00.
00.
00.
00.
00.
00.
00.
00.
00.
00.
00.
00.
00.
00.
0
Gen
eral
gov
ernm
ent
-271
.5-2
70.4
-214
.2-2
07.8
-173
.8-1
30.6
-121
.2-1
27.8
-118
.51.
156
.36.
434
.043
.29.
4-6
.69.
3
Ban
ks
-226
.5-2
90.4
-449
.6-5
58.0
-823
.5-4
26.1
-379
.2-4
35.9
-291
.6-6
3.9
-159
.2-1
08.4
-265
.539
7.4
46.9
-56.
714
4.3
O
ther
sec
tors
-4
94.3
-590
.4-1
278.
8-2
426.
5-1
744.
0-1
445.
9-1
251.
4-1
862.
8-1
662.
6-9
6.1
-688
.5-1
147.
768
2.5
298.
219
4.5
-611
.420
0.2
C
urre
nt tr
ansf
ers,
net
744.
381
7.9
670.
068
0.8
861.
395
6.1
1496
.916
84.5
2038
.673
.7-1
48.0
10.9
180.
494
.854
0.9
187.
635
4.1
cre
dit
904.
199
7.4
845.
812
54.6
1614
.915
62.7
2047
.522
37.9
2703
.893
.4-1
51.6
408.
836
0.2
-52.
248
4.8
190.
346
5.9
G
ener
al g
over
nmen
t 85
.289
.713
9.0
254.
253
6.5
614.
212
15.4
1365
.717
91.8
4.5
49.3
115.
328
2.3
77.7
601.
215
0.2
426.
1
Oth
er s
ecto
rs
818.
990
7.7
706.
810
00.4
1078
.394
8.5
832.
187
2.2
912.
088
.8-2
00.9
293.
578
.0-1
29.9
-116
.440
.139
.8
deb
it-1
59.8
-179
.5-1
75.8
-573
.8-7
53.6
-606
.6-5
50.6
-553
.3-6
65.2
-19.
73.
7-3
98.0
-179
.814
7.0
56.0
-2.8
-111
.8
Gen
eral
gov
ernm
ent
-26.
4-3
0.2
-19.
5-3
52.2
-450
.0-4
46.6
-474
.5-4
89.1
-547
.5-3
.810
.7-3
32.7
-97.
83.
3-2
7.9
-14.
6-5
8.4
O
ther
sec
tors
-1
33.4
-149
.3-1
56.3
-221
.6-3
03.6
-159
.9-7
6.0
-64.
2-1
17.7
-15.
9-7
.0-6
5.3
-82.
014
3.7
83.9
11.8
-53.
5
Cap
ital a
nd fi
nanc
ial a
ccou
nt 1
,510
43.7
3644
.354
79.0
9925
.411
066.
622
90.3
1.7
-630
.060
7.1
2600
.618
34.7
4446
.411
41.2
-877
6.3
-228
8.7
-631
.712
37.1
Cap
ital a
ccou
nt 1
,5,6
163.
523
5.5
180.
0-5
87.3
277.
447
7.1
290.
949
6.8
536.
872
.0-5
5.5
-767
.386
4.8
199.
7-1
86.2
205.
940
.0
C
apita
l tra
nsfe
rs, n
et16
3.5
235.
518
0.0
-587
.327
7.4
478.
725
6.3
464.
451
4.0
72.0
-55.
5-7
67.3
864.
820
1.3
-222
.420
8.0
49.6
cre
dit
163.
523
8.7
180.
036
3.6
277.
447
8.9
406.
246
5.7
640.
675
.1-5
8.7
183.
6-8
6.1
201.
5-7
2.7
59.5
174.
8
Gen
eral
gov
ernm
ent
143.
517
8.4
174.
935
6.1
276.
847
5.4
396.
345
7.4
630.
634
.9-3
.518
1.2
-79.
319
8.5
-79.
161
.117
3.2
O
ther
sec
tors
20
.060
.25.
17.
50.
63.
69.
98.
49.
940
.2-5
5.2
2.4
-6.8
3.0
6.3
-1.5
1.6
deb
it-0
.1-3
.20.
0-9
50.9
0.0
-0.2
-149
.9-1
.4-1
26.5
-3.1
3.1
-950
.995
0.9
-0.2
-149
.714
8.5
-125
.2
Gen
eral
gov
ernm
ent
0.0
0.0
0.0
-950
.90.
00.
0-1
49.3
0.0
-112
.50.
00.
0-9
50.9
950.
90.
0-1
49.3
149.
3-1
12.5
O
ther
sec
tors
-0
.1-3
.20.
0-0
.10.
0-0
.2-0
.6-1
.4-1
4.0
-3.1
3.1
0.0
0.0
-0.2
-0.4
-0.8
-12.
7
Fin
anci
al a
ccou
nt 1
,588
0.2
3408
.852
99.0
1051
2.7
1078
9.2
1813
.2-2
89.2
-112
6.8
70.4
2528
.618
90.2
5213
.727
6.4
-897
6.0
-210
2.4
-837
.611
97.2
D
irect
inve
stm
ent,
net
2252
.132
26.5
6080
.788
38.2
6205
.725
05.3
977.
311
98.7
1301
.697
4.4
2854
.227
57.5
-263
2.5
-370
0.5
-152
8.0
221.
410
2.9
Abr
oad
165.
6-2
49.1
-140
.9-2
06.2
-522
.168
.3-1
73.9
-115
.9-1
76.7
-414
.710
8.2
-65.
3-3
15.9
590.
5-2
42.3
58.0
-60.
8
Equ
ity
-26.
5-5
2.8
-76.
0-2
02.5
-552
.810
8.7
-116
.2-1
49.8
-134
.5-2
6.2
-23.
2-1
26.5
-350
.366
1.4
-224
.9-3
3.6
15.3
O
ther
cap
ital
191.
3-1
91.0
-57.
5-1
1.3
44.3
-49.
9-6
5.9
-4.0
-24.
9-3
82.4
133.
546
.155
.7-9
4.3
-16.
061
.9-2
0.9
R
einv
este
d ea
rnin
gs0.
8-5
.3-7
.47.
6-1
3.7
9.6
8.2
38.0
-17.
3-6
.1-2
.115
.0-2
1.3
23.3
-1.4
29.7
-55.
2
In r
epor
ting
coun
try 7
2735
.931
52.1
6221
.690
51.8
6727
.824
36.9
1151
.213
14.6
1478
.341
6.2
3069
.528
30.2
-232
3.9
-429
0.9
-128
5.7
163.
416
3.7
E
quity
18
31.9
1789
.332
34.1
4765
.241
09.8
1884
.016
04.7
1103
.610
51.0
-42.
614
44.8
1531
.1-6
55.3
-222
5.9
-279
.2-5
01.1
-52.
6
O
ther
cap
ital 8
462.
795
4.1
2030
.027
39.5
2801
.582
2.0
-7.8
384.
735
0.7
491.
410
76.0
709.
462
.0-1
979.
5-8
29.8
392.
5-3
4.0
R
einv
este
d ea
rnin
gs44
1.4
408.
795
7.5
1547
.2-1
83.5
-269
.0-4
45.7
-173
.776
.6-3
2.6
548.
758
9.7
-173
0.7
-85.
5-1
76.6
272.
025
0.3
Mer
gers
and
acq
uisi
tions
, net
9-6
49.5
323.
50.
0-7
.40.
00.
00.
00.
00.
097
3.0
-323
.5-7
.47.
40.
00.
00.
00.
0
2007
2008
2004
2005
2006
2009
2011
2010
Cha
nge
20

BA
LAN
CE
OF
PAYM
ENTS
OF
BU
LGA
RIA
STA
ND
AR
D P
RES
ENTA
TIO
N*
(Ann
ual d
ata)
ST
AN
DA
RD
PR
ES
EN
TA
TIO
N *
(mln
EU
R)
2012
2005
/200
420
06/2
005
2007
/200
620
08/2
007
2009
/200
820
10/2
009
2011
/201
020
12/2
011
2007
2008
2004
2005
2006
2009
2011
2010
Cha
nge
P
ortfo
lio in
vest
men
t, ne
t-4
17.4
-103
6.9
292.
2-5
18.4
-730
.9-6
19.1
-635
.4-3
57.4
-930
.6-6
19.5
1329
.1-8
10.6
-212
.611
1.9
-16.
327
8.0
-573
.2
A
sset
s 10
18.2
17.8
-289
.4-1
29.3
-252
.9-6
23.5
-547
.9-4
7.6
-149
3.7
-0.4
-307
.216
0.2
-123
.7-3
70.5
75.6
500.
3-1
446.
2
E
quity
sec
uriti
es-5
.8-4
.8-1
00.0
-144
.3-1
2.6
-158
.9-1
59.6
86.8
-39.
31.
0-9
5.2
-44.
413
1.7
-146
.3-0
.724
6.4
-126
.0
D
ebt s
ecur
ities
24.0
22.6
-189
.415
.1-2
40.3
-464
.5-3
88.3
-134
.3-1
454.
5-1
.4-2
12.0
204.
5-2
55.4
-224
.276
.325
4.0
-132
0.1
L
iabi
litie
s-4
35.6
-105
4.6
581.
6-3
89.1
-478
.04.
4-8
7.5
-309
.956
3.1
-619
.016
36.3
-970
.8-8
8.9
482.
4-9
1.9
-222
.487
3.0
Equ
ity s
ecur
ities
17.4
350.
412
0.5
79.8
-72.
83.
87.
8-3
1.2
3.5
333.
0-2
29.9
-40.
8-1
52.6
76.7
4.0
-39.
034
.7
D
ebt s
ecur
ities
-453
.0-1
405.
146
1.1
-468
.9-4
05.1
0.6
-95.
4-2
78.7
559.
6-9
52.0
1866
.2-9
30.0
63.7
405.
7-9
5.9
-183
.483
8.3
F
inan
cial
der
ivat
ives
,net
-70.
1-9
0.2
-112
.7-6
1.2
-43.
5-1
8.3
-24.
7-6
5.3
-33.
3-2
0.1
-22.
451
.517
.725
.2-6
.3-4
0.6
32.0
O
ther
inve
stm
ent
609.
116
33.7
544.
651
62.4
6032
.0-7
04.5
-990
.3-1
744.
118
93.6
1024
.6-1
089.
246
17.9
869.
6-6
736.
5-2
85.8
-753
.836
37.8
Ass
ets
-136
6.7
-30.
7-2
348.
855
2.2
104.
9-6
32.3
-26.
2-7
12.8
1092
.813
36.0
-231
8.2
2901
.0-4
47.3
-737
.260
6.1
-686
.618
05.5
Tra
de c
redi
ts 1
1-1
49.1
-29.
0-1
26.6
-134
.8-1
55.1
-121
.1-8
6.2
-98.
6-1
74.9
120.
2-9
7.6
-8.2
-20.
234
.034
.9-1
2.3
-76.
3
Lo
ans
-46.
3-6
1.9
-131
.6-1
53.1
-265
.8-1
.9-1
10.5
-72.
0-2
13.4
-15.
6-6
9.7
-21.
5-1
12.8
263.
9-1
08.6
38.6
-141
.5
Cur
renc
y an
d de
posi
ts 1
2-6
10.0
-459
.7-2
097.
5-0
.832
2.0
-504
.114
7.9
-484
.815
62.5
150.
2-1
637.
820
96.7
322.
8-8
26.1
652.
0-6
32.7
2047
.3
O
ther
ass
ets
-561
.352
0.0
6.9
840.
920
3.8
-5.2
22.6
-57.
5-8
1.4
1081
.3-5
13.1
834.
0-6
37.1
-209
.027
.9-8
0.1
-24.
0
Lia
bilit
ies
1975
.816
64.4
2893
.446
10.2
5927
.1-7
2.2
-964
.1-1
031.
380
0.9
-311
.412
29.0
1716
.913
16.9
-599
9.3
-892
.0-6
7.2
1832
.2
Tra
de c
redi
ts 1
387
.622
5.2
322.
825
8.3
172.
323
.2-3
2.4
56.1
-14.
313
7.6
97.6
-64.
5-8
6.1
-149
.1-5
5.6
88.5
-70.
3
Lo
ans
1394
.310
27.4
2033
.223
06.4
3714
.852
5.1
-386
.5-1
6.3
781.
7-3
67.0
1005
.927
3.1
1408
.4-3
189.
7-9
11.6
370.
279
8.0
Cur
renc
y an
d de
posi
ts51
4.0
384.
851
4.1
2028
.520
47.4
-590
.6-6
42.0
-111
7.9
-2.8
-129
.212
9.3
1514
.518
.9-2
638.
0-5
1.4
-475
.911
15.1
Oth
er li
abili
ties
-20.
227
.023
.317
.0-7
.4-2
9.9
96.7
46.8
36.2
47.2
-3.8
-6.3
-24.
4-2
2.6
126.
7-4
9.9
-10.
5
B
NB
Res
erve
ass
ets
(incr
ease
: -) 1
4-1
493.
4-3
24.3
-150
5.8
-290
8.4
-674
.264
9.8
383.
9-1
58.7
-216
1.0
1169
.1-1
181.
6-1
402.
522
34.2
1324
.0-2
65.9
-542
.6-2
002.
3
Mon
etar
y go
ld0.
00.
00.
00.
00.
00.
00.
00.
00.
00.
00.
00.
00.
00.
00.
00.
00.
0
Spe
cial
dra
win
g rig
hts
44.7
9.3
-0.3
-0.2
-3.9
4.1
-0.4
0.0
-0.1
-35.
4-9
.60.
1-3
.88.
0-4
.50.
4-0
.1
Res
erve
pos
ition
in th
e F
und
0.0
0.0
0.0
0.0
0.0
0.0
0.0
0.0
0.0
0.0
0.0
0.0
0.0
0.0
0.0
0.0
0.0
F
orei
gn e
xcha
nge
-153
8.1
-333
.6-1
505.
5-2
908.
2-6
70.2
645.
838
4.3
-158
.6-2
160.
912
04.5
-117
2.0
-140
2.6
2238
.013
16.0
-261
.4-5
43.0
-200
2.2
Net
Err
ors
and
Om
issi
ons
263.
2-9
38.7
-831
.2-2
170.
1-2
884.
182
5.9
531.
459
0.9
-78.
9-1
201.
910
7.4
-133
8.9
-714
.037
10.0
-294
.559
.5-6
69.8
* S
tand
ard
pres
enta
tion
in a
ccor
danc
e w
ith IM
F 5
-th
editi
on o
f the
"B
alan
ce o
f Pay
men
ts M
anua
l".
1 Pre
limin
ary
data
. In
acco
rdan
ce w
ith th
e B
NB
pra
ctic
e an
d w
ith th
e E
CB
dat
a re
visi
on r
equi
rem
ents
(in
clud
ed in
the
EC
B T
imet
able
for
Exc
hang
e of
Bal
ance
of P
aym
ents
, Int
erna
tiona
l In
vest
men
t Pos
ition
and
Res
erve
Ass
ets
Sta
tistic
s w
ithin
the
ES
CB
), th
e da
ta fo
r Ja
nuar
y 20
13 a
re r
evis
ed. W
ith th
e M
arch
201
3 r
epor
t, ba
lanc
e of
pay
men
ts d
ata
for
Feb
ruar
y 20
13 a
re to
be
revi
sed.
2 F
or 2
012
and
2013
pre
limin
ary
NS
I da
ta a
s of
Apr
il 4,
201
3 w
hich
incl
ude
data
from
the
syst
em IN
TR
AS
TA
T f
or th
e E
U m
embe
r st
ates
and
from
cus
tom
s de
clar
atio
ns fo
r no
n-E
U c
ount
ri
The
rec
alcu
latio
n of
impo
rts
at F
OB
pric
es is
bas
ed o
n a
met
hodo
logy
dev
elop
ed b
y th
e B
NB
and
the
NS
I .3 E
stim
ates
follo
win
g a
met
hodo
logy
of t
he B
NB
and
the
NS
I.4 E
stim
ates
follo
win
g a
met
hodo
logy
of t
he B
NB
. Dat
a fo
r 20
07-2
013
are
base
d on
pre
limin
ary
NS
I dat
a on
the
num
ber
of fo
reig
n vi
sito
rs a
nd B
ulga
rians
, who
hav
e tr
avel
led
abro
ad a
nd B
NB
est
imat
es o
f the
exp
endi
ture
s (r
ecei
pts)
by
purp
ose
of th
e tr
avel
.5 E
stim
ates
follo
win
g a
met
hodo
logy
of t
he B
NB
.6 T
he it
em in
clud
es C
apita
l tra
nsfe
rs a
nd A
cqui
sitio
n/D
ispo
sal o
f non
prod
uced
non
finan
cial
ass
ets.
7 P
relim
inar
y da
ta. D
ata
are
prov
ided
by
dire
ct in
vest
men
t com
pani
es r
epor
ting
to B
NB
, Age
ncy
for
Priv
atiz
atio
n, N
SI,
Cen
tral
De
posi
tory
, ban
ks a
nd o
ther
s.
The
201
2 an
d 20
13 d
ata
incl
ude
only
ban
ks’ d
ata
on r
einv
este
d ea
rnin
gs.
8 On
the
basi
s of
the
repo
rts
subm
itted
to th
e B
NB
by
the
ente
rpris
es w
ith fi
nanc
ial c
redi
ts r
ecei
ved
from
non
-res
iden
ts.
D
ue to
qua
rter
ly r
epor
ting
data
are
sub
ject
to r
evis
ions
.9 M
erge
rs a
nd a
cqui
sitio
ns a
re in
clud
ed in
this
item
.10
Ban
ks, o
ther
non
bank
fina
ncia
l ins
titut
ions
, ins
uran
ce c
ompa
nies
and
pen
sion
fund
s' d
ata.
11 D
ata
on n
et c
hang
e of
trad
e cr
edits
-ass
ets
(pai
d ad
vanc
es a
nd r
ecei
vabl
es fr
om s
uppl
iers
), r
epor
ted
to th
e B
NB
are
incl
uded
in th
is it
em.
D
ue to
qua
rter
ly r
epor
ting
data
are
sub
ject
to r
evis
ions
. 12
Ban
k fo
r In
tern
atio
nal S
ettle
men
ts (
BIS
) da
ta. F
or 2
012
and
2013
- d
ata
are
subj
ect t
o re
visi
ons.
13 D
ata
on n
et c
hang
e of
trad
e cr
edits
-liab
ilitie
s (r
ecei
ved
adva
nces
and
pay
able
s to
sup
plie
rs),
rep
orte
d to
the
BN
B a
re in
clud
ed
in th
is it
em.
D
ue to
qua
rter
ly r
epor
ting
data
are
sub
ject
to r
evis
ions
. 14
Exc
ludi
ng v
alua
tion
chan
ges
due
to th
e ex
chan
ge r
ate
or p
rice
chan
ges,
cha
nges
ass
ocia
ted
with
the
crea
tion
of r
eser
ve a
sset
s (m
onet
ariz
atio
n/de
mon
itariz
atio
n of
gol
d an
d th
e al
loca
tion
or
can
cella
tion
of S
DR
s) a
nd r
ecla
ssifi
catio
ns. A
min
us s
ign
(-)
deno
tes
an in
crea
se in
the
rese
rves
, a p
ositi
ve s
ign
(+)
- a
decr
ease
.
21

BA
LAN
CE
OF
PAYM
ENTS
SER
VIC
ES
Cum
ulat
ed fi
gure
s
Feb
ruar
yC
hang
e 20
13/2
012
(mln
EU
R)
Feb
.12
Mar
.12
Apr
.12
May
. 12
Jun.
12
Jul.
12A
ug. 1
2S
ep. 1
2O
ct. 1
2N
ov. 1
2D
ec.1
2Ja
n. 1
3F
eb.1
320
1220
13F
ebJa
n-F
eb
S
ervi
ces,
net
134
.50.
834
.711
4.2
424.
861
4.7
570.
832
1.3
130.
756
.339
.433
.044
.989
.777
.810
.3-1
1.8
Cre
dit
257.
630
1.0
298.
138
6.2
724.
391
5.2
887.
561
8.7
385.
830
2.8
302.
525
5.5
257.
553
7.7
512.
9-0
.2-2
4.7
Tra
nspo
rtat
ion 2
61.8
68.0
68.3
75.2
123.
216
3.6
154.
410
8.3
77.2
72.6
59.3
64.8
61.0
127.
812
5.8
-0.8
-1.9
Tra
vel 3
88.4
98.5
117.
417
7.6
373.
861
1.7
619.
334
9.0
159.
811
0.4
100.
111
3.3
100.
119
9.1
213.
411
.714
.4
Oth
er s
ervi
ces 4
107.
413
4.6
112.
413
3.4
227.
313
9.8
113.
816
1.4
148.
811
9.8
143.
277
.396
.321
0.9
173.
7-1
1.1
-37.
2
Com
mun
icat
ions
ser
vice
s10
.910
.910
.512
.811
.813
.68.
010
.29.
56.
87.
34.
78.
022
.312
.7-2
.9-9
.6
Con
stru
ctio
n se
rvic
es2.
93.
51.
64.
911
5.7
4.3
9.5
10.8
7.3
6.1
3.1
3.2
11.0
3.8
14.2
8.1
10.4
In
sura
nce
serv
ices
5.7
17.5
14.9
2.8
1.9
21.3
2.5
1.1
21.1
2.1
1.2
10.1
17.8
9.7
28.0
12.2
18.3
F
inan
cial
ser
vice
s2.
41.
63.
92.
21.
64.
04.
12.
15.
23.
46.
54.
33.
75.
38.
01.
32.
7
Com
pute
r an
d in
form
atio
n se
rvic
es39
.239
.037
.538
.938
.435
.733
.837
.936
.036
.042
.121
.720
.373
.641
.9-1
8.9
-31.
6
Roy
altie
s an
d lic
ense
fees
1.
21.
10.
81.
21.
10.
61.
51.
74.
21.
61.
60.
20.
22.
00.
4-1
.0-1
.6
Oth
er b
usin
ess
serv
ices
43.4
58.1
39.6
66.4
51.7
54.7
49.3
92.6
60.8
61.8
79.1
28.8
33.8
90.4
62.6
-9.5
-27.
8
Per
sona
l, cu
ltura
l and
rec
reat
iona
l ser
vice
s1.
62.
63.
43.
94.
95.
54.
84.
94.
42.
01.
53.
71.
42.
85.
1-0
.22.
3
Gov
ernm
ent s
ervi
ces,
n.i.
e.0.
20.
30.
30.
20.
20.
30.
20.
10.
30.
10.
80.
70.
01.
10.
7-0
.2-0
.3
Deb
it-2
23.1
-300
.3-2
63.4
-272
.0-2
99.5
-300
.4-3
16.7
-297
.5-2
55.1
-246
.5-2
63.2
-222
.5-2
12.6
-448
.0-4
35.1
10.5
12.9
Tra
nspo
rtat
ion 2
-64.
9-7
1.4
-71.
5-8
1.2
-75.
5-7
8.7
-84.
2-7
6.1
-69.
3-6
5.8
-62.
6-7
0.8
-74.
2-1
28.1
-144
.9-9
.3-1
6.9
Tra
vel 3
-58.
2-7
7.3
-85.
7-8
3.9
-93.
3-9
8.6
-125
.4-1
07.0
-80.
1-7
9.3
-64.
0-6
6.6
-65.
6-1
21.1
-132
.2-7
.4-1
1.1
Oth
er s
ervi
ces 4
-100
.1-1
51.6
-106
.1-1
07.0
-130
.7-1
23.1
-107
.1-1
14.3
-105
.6-1
01.3
-136
.6-8
5.1
-72.
9-1
98.8
-158
.027
.240
.8
Com
mun
icat
ions
ser
vice
s-1
0.4
-9.1
-7.0
-10.
1-8
.9-8
.6-7
.2-9
.5-8
.0-8
.7-8
.4-1
3.6
-11.
8-1
8.1
-25.
5-1
.4-7
.4
Con
stru
ctio
n se
rvic
es-7
.8-4
2.3
-14.
8-9
.4-1
1.9
-4.5
-2.5
-15.
3-2
.2-3
.4-3
.2-4
.5-4
.2-2
0.9
-8.6
3.6
12.2
In
sura
nce
serv
ices
-6.6
-5.6
-8.2
-9.2
-5.7
-7.2
-6.2
-6.5
-9.1
-5.8
-4.1
-8.0
-7.7
-14.
7-1
5.7
-1.1
-1.1
F
inan
cial
ser
vice
s-2
.8-3
.7-2
.3-1
.7-7
.2-7
.5-2
.6-4
.0-2
.3-3
.6-8
.2-4
.4-6
.6-6
.0-1
0.9
-3.7
-4.9
C
ompu
ter
and
info
rmat
ion
serv
ices
-10.
1-9
.6-1
3.2
-7.0
-10.
6-1
1.2
-10.
6-8
.5-1
2.6
-15.
3-1
6.8
-5.0
-1.7
-20.
4-6
.78.
513
.7
Roy
altie
s an
d lic
ense
fees
-9
.5-7
.1-5
.4-1
2.0
-13.
5-1
5.1
-7.3
-9.1
-11.
0-8
.9-1
9.0
-9.9
-3.6
-18.
8-1
3.5
5.9
5.3
O
ther
bus
ines
s se
rvic
es-4
8.5
-70.
1-5
1.9
-53.
5-6
9.1
-66.
0-6
8.5
-59.
6-5
4.6
-52.
0-7
3.4
-38.
9-3
6.0
-92.
2-7
4.9
12.5
17.3
P
erso
nal,
cultu
ral a
nd r
ecre
atio
nal s
ervi
ces
-4.2
-4.0
-3.4
-4.1
-3.8
-2.9
-2.3
-1.9
-5.7
-3.6
-3.3
-0.6
-1.3
-7.8
-1.9
2.9
5.9
G
over
nmen
t ser
vice
s, n
.i.e.
0.0
0.0
0.0
0.0
0.0
0.0
0.0
0.0
-0.1
0.0
-0.1
-0.1
0.0
0.0
-0.2
0.0
-0.1
1 Pre
limin
ary
data
. In
acco
rdan
ce w
ith th
e B
NB
pra
ctic
e an
d w
ith th
e E
CB
dat
a re
visi
on r
equi
rem
ents
(in
clud
ed in
the
EC
B T
imet
able
for
Exc
hang
e of
Bal
ance
of P
aym
ents
, Int
erna
tiona
l In
vest
men
t Pos
ition
and
Res
erve
Ass
ets
Sta
tistic
s w
ithin
the
ES
CB
), th
e da
ta fo
r Ja
nuar
y 20
13 a
re r
evis
ed. W
ith th
e M
arch
201
3 r
epor
t, ba
lanc
e of
pay
men
ts d
ata
for
Feb
ruar
y 20
13 a
re to
be
revi
sed.
2 Est
imat
es fo
r th
e fr
eigh
t tra
nspo
rtat
ion
follo
w a
met
hodo
logy
of t
he B
NB
and
the
NS
I.3 E
stim
ates
follo
win
g a
met
hodo
logy
of t
he B
NB
. Dat
a fo
r 20
07-2
013
are
base
d on
pre
limin
ary
NS
I dat
a on
the
num
ber
of fo
reig
n vi
sito
rs a
nd B
ulga
rians
, who
hav
e tr
avel
led
abro
ad a
nd B
NB
est
imat
es o
f the
exp
endi
ture
s (r
ecei
pts)
by
purp
ose
of th
e tr
avel
.4 D
ata
rece
ived
from
the
bank
s an
d co
mpa
nies
' rep
orts
on
acco
unts
abr
oad.
22

BA
LAN
CE
OF
PAYM
ENTS
INC
OM
E
Cum
ulat
ed fi
gure
s
F
ebru
ary
Cha
nge
2013
/201
2
(mln
EU
R)
Feb
.12
Mar
.12
Apr
.12
May
. 12
Jun.
12
Jul.
12A
ug. 1
2S
ep. 1
2O
ct. 1
2N
ov. 1
2D
ec.1
2Ja
n. 1
3F
eb.1
320
1220
13*
Feb
Jan-
Feb
Inco
me,
net
-1
28.4
-92.
9-4
3.6
-80.
8-1
38.4
-192
.4-1
84.0
-48.
7-1
6.0
-40.
8-2
85.1
-58.
2-2
3.3
-219
.3-8
1.5
105.
113
7.8
C
redi
t 50
.859
.557
.168
.359
.968
.065
.273
.669
.756
.656
.154
.346
.896
.610
1.1
-4.0
4.6
Com
pens
atio
n of
em
ploy
ees
118
.122
.930
.331
.731
.730
.430
.538
.035
.526
.517
.915
.819
.332
.535
.11.
32.
7
In
vest
men
t inc
ome
32.7
36.7
26.8
36.7
28.2
37.6
34.7
35.6
34.2
30.1
38.2
38.5
27.5
64.1
66.0
-5.2
1.9
Dire
ct in
vest
men
t 25.
06.
1-0
.95.
0-0
.65.
56.
26.
21.
40.
62.
31.
80.
810
.02.
6-4
.2-7
.4
Div
iden
ds a
nd d
istr
ibut
ed b
ranc
h pr
ofits
0.3
0.7
1.6
7.4
0.7
0.5
1.1
0.4
0.9
0.3
0.8
1.4
0.8
0.5
2.2
0.5
1.7
R
einv
este
d ea
rnin
gs a
nd u
ndis
trib
uted
bra
nch
prof
its4.
44.
4-3
.2-3
.2-3
.24.
64.
64.
60.
00.
00.
00.
00.
08.
70.
0-4
.4-8
.7
On
debt
(in
tere
st)
0.4
1.1
0.8
0.8
2.0
0.4
0.4
1.2
0.4
0.4
1.5
0.4
0.0
0.8
0.4
-0.3
-0.3
Por
tfolio
inve
stm
ent 3
21.0
21.8
20.5
25.7
22.3
26.3
23.9
22.9
26.0
24.4
24.4
29.9
19.4
43.7
49.3
-1.5
5.6
O
n eq
uity
(di
vide
nds)
0.1
0.2
0.0
0.2
0.3
0.2
0.1
0.1
0.0
0.1
0.2
0.0
0.0
0.2
0.0
-0.1
-0.1
O
n de
bt (
inte
rest
) 20
.921
.620
.425
.522
.126
.123
.822
.826
.024
.424
.229
.919
.443
.649
.3-1
.55.
7
Oth
er in
vest
men
t 46.
78.
77.
26.
06.
55.
84.
76.
56.
85.
111
.56.
87.
310
.414
.10.
53.
7
Loa
ns3.
04.
43.
34.
44.
84.
53.
63.
95.
34.
49.
85.
86.
65.
212
.33.
57.
1
Dep
osits
and
mis
calle
nous
acc
ount
s3.
74.
43.
91.
61.
71.
31.
12.
71.
50.
71.
61.
10.
75.
21.
8-3
.0-3
.4
D
ebit
-179
.2-1
52.5
-100
.6-1
49.2
-198
.3-2
60.4
-249
.3-1
22.3
-85.
7-9
7.4
-341
.2-1
12.5
-70.
1-3
15.9
-182
.610
9.1
133.
3
C
ompe
nsat
ion
of e
mpl
oyee
s-0
.8-2
.4-1
.1-0
.7-2
.3-1
.3-0
.7-2
.1-0
.6-0
.8-2
.3-1
.1-1
.9-1
.7-3
.0-1
.1-1
.3
In
vest
men
t inc
ome
-178
.4-1
50.0
-99.
5-1
48.5
-196
.0-2
59.1
-248
.6-1
20.2
-85.
1-9
6.6
-338
.8-1
11.4
-68.
1-3
14.2
-179
.611
0.3
134.
6
Dire
ct in
vest
men
t 2-1
40.6
-99.
7-6
7.0
-109
.9-1
37.0
-214
.3-2
07.9
-82.
7-6
0.7
-61.
4-2
73.2
-60.
4-5
5.8
-199
.8-1
16.2
84.8
83.5
D
ivid
ends
and
dis
trib
uted
bra
nch
prof
its-9
.5-2
7.0
-19.
9-4
2.0
-68.
1-1
55.7
-50.
0-1
3.2
-21.
3-1
4.3
-201
.9-3
4.7
-22.
2-1
4.6
-56.
9-1
2.6
-42.
3
R
einv
este
d ea
rnin
gs a
nd u
ndis
trib
uted
bra
nch
prof
its 5
-8.5
-8.5
-8.7
-8.7
-8.7
-7.4
-7.4
-7.4
-0.9
-0.9
-0.9
-6.4
-6.4
-16.
9-1
2.8
2.1
4.2
O
n de
bt (
inte
rest
)-1
22.6
-64.
3-3
8.3
-59.
1-6
0.2
-51.
2-1
50.5
-62.
0-3
8.4
-46.
2-7
0.4
-19.
3-2
7.3
-168
.2-4
6.6
95.3
121.
6
Por
tfolio
inve
stm
ent 3
-0.1
-0.1
-0.1
-0.1
-0.1
-19.
8-0
.1-0
.1-0
.1-0
.1-0
.1-4
1.5
-0.1
-41.
1-4
1.6
0.0
-0.5
O
n eq
uity
(di
vide
nds)
0.0
0.0
0.0
0.0
0.0
0.0
0.0
0.0
0.0
0.0
0.0
0.0
0.0
0.0
0.0
0.0
0.0
O
n de
bt (
inte
rest
) -0
.1-0
.1-0
.1-0
.1-0
.1-1
9.8
-0.1
-0.1
-0.1
-0.1
-0.1
-41.
5-0
.1-4
1.1
-41.
60.
0-0
.5
Oth
er in
vest
men
t 4-3
7.7
-50.
2-3
2.4
-38.
5-5
8.9
-24.
9-4
0.6
-37.
5-2
4.3
-35.
1-6
5.5
-9.5
-12.
2-7
3.3
-21.
725
.551
.6
Loa
ns-3
5.4
-50.
2-3
2.4
-38.
5-5
8.9
-24.
8-4
0.6
-37.
5-2
4.3
-31.
1-6
5.5
-9.4
-12.
2-7
0.8
-21.
623
.249
.2
Dep
osits
and
mis
calle
nous
acc
ount
s-2
.40.
00.
00.
00.
0-0
.10.
00.
00.
0-4
.00.
0-0
.10.
0-2
.5-0
.12.
32.
4
* P
relim
inar
y da
ta. I
n ac
cord
ance
with
the
BN
B p
ract
ice
and
with
the
EC
B d
ata
revi
sion
req
uire
men
ts (
incl
uded
in th
e E
CB
Tim
eta
ble
for
Exc
hang
e of
Bal
ance
of P
aym
ents
, Int
erna
tiona
l In
vest
men
t Pos
ition
and
Res
erve
Ass
ets
Sta
tistic
s w
ithin
the
ES
CB
), th
e da
ta fo
r Ja
nuar
y 20
13 a
re r
evis
ed. W
ith th
e M
arch
201
3 r
epor
t, ba
lanc
e of
pay
men
ts d
ata
for
Feb
ruar
y 20
13 a
re to
be
revi
sed.
1 Est
imat
es fo
llow
ing
a m
etho
dolo
gy o
f the
BN
B.
2 Dat
a ar
e pr
ovid
ed b
y co
mpa
nies
rep
ortin
g to
BN
B, A
genc
y fo
r P
rivat
izat
ion,
NS
I, C
entr
al D
epos
itory
, ban
ks a
nd th
e B
NB
. 3 D
ata
are
prov
ided
by
the
bank
s, n
on-b
ank
finan
cial
inst
itutio
ns, p
ensi
on fu
nds
and
insu
ranc
e co
mpa
nies
, Cen
tal D
epos
itary
, Min
istr
y of
Fin
ance
, the
BN
B.
4 Dat
a fr
om th
e fir
ms'
qua
rter
ly r
epor
ts, b
anks
' mon
thly
rep
orts
and
the
BN
B.
D
ue to
qua
rter
ly r
epor
ting
data
are
sub
ject
to r
evis
ions
.5 T
he 2
012
and
2013
dat
a in
clud
e on
ly b
anks
’ dat
a on
rei
nves
ted
earn
ings
.
23

BA
LAN
CE
OF
PAYM
ENTS
CU
RR
ENT
AN
D C
API
TAL
TRA
NSF
ERS
Cum
ulat
ed fi
gure
s
F
ebru
ary
Cha
nge
2013
/201
2
(mln
EU
R)
Feb
.12
Mar
.12
Apr
.12
May
. 12
Jun.
12
Jul.
12A
ug. 1
2S
ep. 1
2O
ct. 1
2N
ov. 1
2D
ec.1
2Ja
n. 1
3F
eb.1
320
1220
13*
Feb
Jan-
Feb
Cur
rent
and
Cap
ital t
rans
fers
, net
52.6
503.
117
4.1
263.
219
1.0
240.
612
0.0
172.
8-1
3.0
335.
145
0.8
47.3
-57.
111
4.9
-9.8
-109
.6-1
24.7
Cur
rent
tran
sfer
s, n
et44
.649
6.6
174.
122
9.7
182.
912
1.8
123.
813
9.7
68.6
171.
422
4.9
51.1
-57.
010
5.1
-5.9
-101
.6-1
11.0
C
redi
t16
4.0
541.
921
8.5
275.
022
5.6
149.
916
5.9
187.
714
7.6
206.
230
2.7
129.
010
7.6
282.
823
6.6
-56.
3-4
6.2
Gen
eral
gov
ernm
ent
89.2
460.
314
0.9
182.
614
6.2
65.7
93.9
111.
275
.014
1.3
231.
454
.224
.114
3.1
78.3
-65.
1-6
4.8
in
cl. E
U tr
ansf
ers 1
23.2
413.
556
.911
5.9
60.2
15.0
36.1
34.1
3.9
60.5
162.
33.
723
.524
.927
.20.
32.
2
Oth
er (
priv
ate)
274
.881
.677
.592
.379
.484
.272
.076
.572
.664
.971
.374
.883
.513
9.7
158.
38.
718
.6
Wor
ker's
rem
ittan
ces
63.9
73.7
70.4
80.0
70.6
70.9
60.2
68.3
64.6
56.6
61.8
59.0
63.9
122.
912
2.9
0.0
-0.1
O
ther
priv
ate
tran
sfer
s10
.97.
97.
112
.38.
813
.311
.88.
28.
08.
39.
515
.819
.716
.835
.58.
718
.7
D
ebit
-119
.4-4
5.3
-44.
3-4
5.3
-42.
7-2
8.1
-42.
1-4
8.0
-79.
0-3
4.8
-77.
8-7
7.8
-164
.7-1
77.6
-242
.5-4
5.3
-64.
8
G
ener
al g
over
nmen
t-1
06.7
-39.
8-3
7.9
-37.
9-3
5.0
-24.
0-3
5.4
-42.
8-6
8.4
-27.
1-4
9.1
-70.
2-9
1.8
-150
.0-1
62.1
14.8
-12.
0
in
cl. E
U tr
ansf
ers 1
-93.
2-3
4.4
-33.
6-3
5.5
-18.
9-1
9.7
-30.
8-3
4.3
-65.
0-2
2.9
-44.
9-4
9.1
-86.
6-1
33.0
-135
.76.
6-2
.7
Oth
er (
priv
ate)
2-1
2.7
-5.5
-6.4
-7.4
-7.7
-4.2
-6.7
-5.2
-10.
7-7
.7-2
8.7
-7.6
-72.
8-2
7.6
-80.
4-6
0.1
-52.
8
Wor
ker's
rem
ittan
ces
-0.5
-0.3
-0.3
-0.4
-0.3
-0.5
-0.5
-0.4
-0.5
-0.5
-0.6
-0.9
-1.2
-0.9
-2.1
-0.7
-1.2
O
ther
priv
ate
tran
sfer
s-1
2.2
-5.2
-6.1
-7.0
-7.4
-3.7
-6.2
-4.8
-10.
1-7
.2-2
8.1
-6.7
-71.
6-2
6.8
-78.
3-5
9.4
-51.
6
Cap
ital t
rans
fers
, net
8.0
6.5
0.0
33.5
8.1
118.
8-3
.833
.1-8
1.5
163.
722
5.9
-3.8
-0.1
9.8
-3.9
-8.0
-13.
7
C
redi
t8.
06.
70.
333
.57.
911
8.8
9.4
33.1
31.0
163.
722
6.4
-3.7
-0.1
9.8
-3.7
-8.1
-13.
6
G
ener
al g
over
nmen
t7.
46.
70.
233
.57.
511
8.4
9.4
33.1
30.4
163.
722
0.3
-3.7
-0.1
7.4
-3.7
-7.4
-11.
1
in
cl. E
U tr
ansf
ers 1
7.4
6.7
0.2
33.5
7.5
118.
49.
433
.130
.416
3.7
220.
3-3
.7-0
.17.
4-3
.7-7
.4-1
1.1
Oth
er s
ecto
rs0.
60.
00.
10.
00.
30.
40.
00.
00.
50.
06.
10.
00.
02.
40.
0-0
.6-2
.4
D
ebit
0.0
-0.2
-0.3
0.0
0.2
0.0
-13.
20.
0-1
12.5
0.0
-0.5
-0.1
0.0
0.0
-0.1
0.0
-0.1
Gen
eral
gov
ernm
ent
0.0
0.0
0.0
0.0
0.0
0.0
0.0
0.0
-112
.50.
00.
00.
00.
00.
00.
00.
00.
0
incl
. EU
tran
sfer
s 0.
00.
00.
00.
00.
00.
00.
00.
0-1
12.5
0.0
0.0
0.0
0.0
0.0
0.0
0.0
0.0
Oth
er s
ecto
rs0.
0-0
.2-0
.30.
00.
20.
0-1
3.2
0.0
0.0
0.0
-0.5
-0.1
0.0
0.0
-0.1
0.0
-0.1
* P
relim
inar
y da
ta. I
n ac
cord
ance
with
the
BN
B p
ract
ice
and
with
the
EC
B d
ata
revi
sion
req
uire
men
ts (
incl
uded
in th
e E
CB
Tim
etab
le fo
r E
xcha
nge
of B
alan
ce o
f Pay
men
ts, I
nter
natio
nal
Inve
stm
ent P
ositi
on a
nd R
eser
ve A
sset
s S
tatis
tics
with
in th
e E
SC
B),
the
data
for
Janu
ary
2013
are
rev
ised
. With
the
Mar
ch 2
013
rep
ort,
bala
nce
of p
aym
ents
dat
a fo
r F
ebru
ary
2013
are
to b
e re
vise
d.1 D
ata
prov
ided
by
the
Min
istr
y of
Fin
ance
and
the
BN
B. T
he p
rogr
amm
es P
HA
RE
, IS
PA
and
SA
PA
RD
are
incl
uded
.2 D
ata
prov
ided
by
the
bank
s an
d th
e B
RC
, AF
A, M
inis
try
of D
efen
se.
24

BA
LAN
CE
OF
PAYM
ENTS
FOR
EIG
N D
IREC
T IN
VEST
MEN
T
Cum
ulat
ed fi
gure
s
F
ebru
ary
Cha
nge
2013
/201
2
(mln
EU
R)
Feb
.12
Mar
.12
Apr
.12
May
. 12
Jun.
12
Jul.
12A
ug. 1
2S
ep. 1
2O
ct. 1
2N
ov. 1
2D
ec.1
2Ja
n. 1
3F
eb.1
320
1220
13*
Feb
Jan-
Feb
Dire
ct in
vest
men
t18
7.1
140.
138
7.5
-165
.718
8.6
64.1
367.
548
.418
6.1
-165
.0-2
50.4
28.7
4.8
500.
533
.5-1
82.3
-467
.0
Abr
oad
-10.
7-8
.4-8
.8-2
9.9
-12.
6-1
2.9
-6.4
-2.5
-19.
7-4
2.6
-9.1
-0.7
-6.1
-23.
8-6
.84.
517
.0
Equ
ity c
apita
l 1-9
.6-4
.7-9
.3-2
6.9
-12.
1-5
.1-3
.54.
1-1
5.7
-36.
2-5
.3-1
.9-6
.0-1
9.9
-7.9
3.6
12.0
Ban
ks0.
00.
00.
00.
00.
00.
00.
00.
00.
00.
00.
00.
00.
00.
00.
00.
00.
0
O
ther
sec
tors
-9.6
-4.7
-9.3
-26.
9-1
2.1
-5.1
-3.5
4.1
-15.
7-3
6.2
-5.3
-1.9
-6.0
-19.
9-7
.93.
612
.0
Rei
nves
ted
earn
ings
-4.4
-4.4
3.2
3.2
3.2
-4.6
-4.6
-4.6
0.0
0.0
0.0
0.0
0.0
-8.7
0.0
4.4
8.7
Ban
ks0.
00.
00.
00.
00.
0-0
.1-0
.1-0
.10.
00.
00.
00.
00.
0-0
.10.
00.
00.
1
O
ther
sec
tors
-4.3
-4.3
3.2
3.2
3.2
-4.5
-4.5
-4.5
0.0
0.0
0.0
0.0
0.0
-8.7
0.0
4.3
8.7
O
ther
cap
ital 2
3.3
0.7
-2.8
-6.2
-3.7
-3.2
1.6
-2.0
-4.1
-6.4
-3.8
1.3
-0.1
4.9
1.1
-3.4
-3.8
Ban
ks0.
00.
00.
00.
00.
00.
00.
00.
00.
00.
00.
00.
00.
00.
00.
00.
00.
0
O
ther
sec
tors
3.3
0.7
-2.8
-6.2
-3.7
-3.2
1.6
-2.0
-4.1
-6.4
-3.8
1.3
-0.1
4.9
1.1
-3.4
-3.8
In
the
repo
rtin
g ec
onom
y19
7.8
148.
539
6.2
-135
.820
1.1
77.0
374.
050
.920
5.8
-122
.4-2
41.4
29.4
10.9
524.
340
.3-1
86.8
-483
.9
Equ
ity c
apita
l 344
.786
.268
.895
.848
.985
.256
.710
8.0
169.
176
.612
8.6
23.6
26.5
127.
150
.1-1
8.2
-77.
0
B
anks
9.7
9.4
-4.5
-5.0
-5.0
5.9
26.0
3.0
10.7
12.5
10.7
0.0
3.6
17.4
3.6
-6.1
-13.
8
O
ther
sec
tors
35.0
76.8
73.3
100.
953
.979
.330
.710
4.9
158.
464
.111
7.9
23.6
22.9
109.
746
.5-1
2.1
-63.
2
incl
. Rea
l est
ate
17.3
11.1
24.5
29.1
25.9
19.9
20.0
19.7
16.1
15.2
16.1
6.3
8.4
33.5
14.7
-8.9
-18.
7
R
einv
este
d ea
rnin
gs 4
8.5
8.5
8.7
8.7
8.7
7.4
7.4
7.4
0.9
0.9
0.9
6.4
6.4
16.9
12.8
-2.1
-4.2
Ban
ks8.
58.
58.
78.
78.
77.
47.
47.
40.
90.
90.
96.
46.
416
.912
.8-2
.1-4
.2
O
ther
sec
tors
0.0
0.0
0.0
0.0
0.0
0.0
0.0
0.0
0.0
0.0
0.0
0.0
0.0
0.0
0.0
0.0
0.0
O
ther
cap
ital 2
144.
653
.931
8.7
-240
.314
3.5
-15.
630
9.9
-64.
535
.8-1
99.9
-370
.9-0
.6-2
1.9
380.
2-2
2.5
-166
.5-4
02.8
Ban
ks1.
3-0
.40.
71.
5-1
.7-3
.11.
30.
69.
3-7
.6-2
01.2
0.0
0.7
-1.2
0.7
-0.6
2.0
Oth
er s
ecto
rs14
3.3
54.2
318.
1-2
41.9
145.
2-1
2.6
308.
5-6
5.1
26.5
-192
.2-1
69.7
-0.6
-22.
738
1.5
-23.
3-1
65.9
-404
.7
M
erge
rs a
nd a
cqui
sitio
ns, n
et 5
0.0
0.0
0.0
0.0
0.0
0.0
0.0
0.0
0.0
0.0
0.0
0.0
0.0
0.0
0.0
0.0
0.0
* P
relim
inar
y da
ta. I
n ac
cord
ance
with
the
BN
B p
ract
ice
and
with
the
EC
B d
ata
revi
sion
req
uire
men
ts (
incl
uded
in th
e E
CB
Tim
eta
ble
for
Exc
hang
e of
Bal
ance
of P
aym
ents
, Int
erna
tiona
l In
vest
men
t Pos
ition
and
Res
erve
Ass
ets
Sta
tistic
s w
ithin
the
ES
CB
), th
e da
ta fo
r Ja
nuar
y 20
13 a
re r
evis
ed. W
ith th
e M
arch
201
3 r
epor
t, ba
lanc
e of
pay
men
ts d
ata
for
Feb
ruar
y 20
13 a
re to
be
revi
sed.
1 On
the
basi
s of
ban
ks' r
epor
ts a
nd th
e qu
arte
rly r
epor
ts o
f the
firm
s w
ith d
irect
inve
stm
ents
abr
oad.
2 On
the
basi
s of
the
repo
rts
subm
itted
to th
e B
NB
by
the
ente
rpris
es w
ith fi
nanc
ial a
nd tr
ade
cred
its b
etw
een
rela
ted
part
ies.
D
ue to
qua
rter
ly r
epor
ting
data
are
sub
ject
to r
evis
ions
.3 D
ata
are
prov
ided
by
dire
ct in
vest
men
t com
pani
es r
epor
ting
to B
NB
, Age
ncy
for
Priv
atiz
atio
n, N
SI,
Cen
tral
Dep
osito
ry, b
anks
an
d th
e B
NB
. 4 T
he 2
012
and
2013
dat
a in
clud
e on
ly b
anks
’ dat
a on
rei
nves
ted
earn
ings
.5 M
erge
rs a
nd a
cqui
sitio
ns a
re in
clud
ed in
this
item
.
25

BA
LAN
CE
OF
PAYM
ENTS
POR
TFO
LIO
INVE
STM
ENT
Cum
ulat
ed fi
gure
s
F
ebru
ary
Cha
nge
2013
/201
2
(mln
EU
R)
Feb
.12
Mar
.12
Apr
.12
May
. 12
Jun.
12
Jul.
12A
ug. 1
2S
ep. 1
2O
ct. 1
2N
ov. 1
2D
ec.1
2Ja
n. 1
3F
eb.1
320
1220
13*
Feb
Jan-
Feb
Port
folio
inve
stm
ent
-31.
2-3
68.8
189.
5-2
7.3
-219
.210
09.2
-207
.3-6
5.8
-60.
4-1
107.
6-7
1.1
-337
.4-2
71.9
-1.6
-609
.3-2
40.7
-607
.6
Ass
ets 1
,2-6
0.5
-342
.123
0.7
-12.
8-2
29.4
314.
3-1
74.7
-62.
6-5
1.1
-111
0.0
-96.
7-3
6.8
-179
.040
.7-2
15.8
-118
.6-2
56.6
E
quiti
es s
ecur
ities
7.6
1.8
6.9
12.1
-22.
415
.97.
6-3
3.3
-2.0
-28.
3-1
4.6
-9.5
2.8
17.1
-6.7
-4.9
-23.
8
Deb
t sec
uriti
es-6
8.1
-343
.822
3.8
-24.
8-2
07.0
298.
4-1
82.3
-29.
4-4
9.1
-108
1.7
-82.
2-2
7.3
-181
.823
.7-2
09.2
-113
.7-2
32.8
Bon
ds a
nd n
otes
-97.
6-4
2.1
54.7
1.4
-262
.225
1.7
-241
.3-3
4.3
-66.
3-1
009.
1-6
2.9
-72.
8-8
6.2
-61.
9-1
59.0
11.4
-97.
1
M
FIs
-22.
613
.010
.144
.3-8
3.3
81.0
-1.4
6.1
-61.
3-9
48.2
10.4
-57.
1-4
7.4
-27.
7-1
04.5
-24.
8-7
6.7
Oth
er s
ecto
rs-7
5.0
-55.
244
.7-4
2.9
-179
.017
0.7
-239
.9-4
0.4
-5.0
-60.
9-7
3.3
-15.
7-3
8.8
-34.
2-5
4.5
36.1
-20.
3
M
oney
mar
ket i
nstr
umen
ts29
.5-3
01.7
169.
0-2
6.2
55.3
46.7
58.9
4.9
17.3
-72.
6-1
9.3
45.5
-95.
685
.6-5
0.2
-125
.1-1
35.7
MF
Is20
.3-2
28.3
11.2
-29.
672
.144
.29.
33.
719
.3-7
7.0
-28.
036
.7-9
5.6
25.6
-58.
9-1
15.9
-84.
5
O
ther
sec
tors
9.2
-73.
415
7.9
3.4
-16.
82.
549
.71.
3-2
.04.
48.
78.
80.
060
.08.
8-9
.2-5
1.2
Lia
bilit
ies 1
29.3
-26.
8-4
1.2
-14.
510
.169
4.9
-32.
6-3
.2-9
.32.
425
.7-3
00.6
-92.
8-4
2.4
-393
.4-1
22.1
-351
.1
Equ
ities
sec
uriti
es4.
3-2
.5-1
3.6
-2.4
-1.6
-6.3
-3.7
10.8
19.6
1.3
-2.4
0.0
0.0
4.3
0.0
-4.3
-4.3
MF
Is 3
-0.1
-0.3
0.2
0.0
-0.2
-5.5
0.0
-0.1
1.0
-1.3
-0.8
-0.5
0.0
-2.5
-0.5
0.1
2.0
Oth
er s
ecto
rs 3
4.4
-2.2
-13.
8-2
.4-1
.4-0
.9-3
.610
.918
.62.
5-1
.60.
50.
06.
80.
5-4
.4-6
.3
Deb
t sec
uriti
es25
.0-2
4.3
-27.
6-1
2.1
11.8
701.
2-2
8.9
-14.
0-2
8.9
1.1
28.1
-300
.6-9
2.8
-46.
7-3
93.4
-117
.8-3
46.7
Bon
ds a
nd n
otes
25.0
-24.
3-2
7.6
-12.
111
.870
1.2
-28.
9-1
4.0
-28.
91.
128
.1-3
00.6
-92.
8-4
6.7
-393
.4-1
17.8
-346
.7
Gen
eral
gov
ernm
ent 4
,519
.1-1
9.6
-27.
8-1
2.7
-5.1
699.
6-2
8.8
-13.
2-1
9.2
-20.
131
.5-3
01.4
-92.
8-5
2.9
-394
.2-1
11.9
-341
.3
MF
Is 3
0.0
-0.1
0.0
0.0
20.0
0.0
0.0
0.0
-8.8
20.0
-4.2
0.0
0.0
0.0
0.0
0.0
0.0
Oth
er s
ecto
rs 3
5.9
-4.6
0.2
0.6
-3.1
1.6
-0.1
-0.8
-1.0
1.2
0.8
0.8
0.0
6.2
0.8
-5.9
-5.4
Mon
ey m
arke
t ins
trum
ents
0.0
0.0
0.0
0.0
0.0
0.0
0.0
0.0
0.0
0.0
0.0
0.0
0.0
0.0
0.0
0.0
0.0
Mon
etar
y au
thor
ities
0.0
0.0
0.0
0.0
0.0
0.0
0.0
0.0
0.0
0.0
0.0
0.0
0.0
0.0
0.0
0.0
0.0
Gen
eral
gov
ernm
ent 4
,50.
00.
00.
00.
00.
00.
00.
00.
00.
00.
00.
00.
00.
00.
00.
00.
00.
0
MF
Is 3
0.0
0.0
0.0
0.0
0.0
0.0
0.0
0.0
0.0
0.0
0.0
0.0
0.0
0.0
0.0
0.0
0.0
Oth
er s
ecto
rs 3
0.0
0.0
0.0
0.0
0.0
0.0
0.0
0.0
0.0
0.0
0.0
0.0
0.0
0.0
0.0
0.0
0.0
Fina
ncia
l der
ivat
ives
, net
-0.3
-5.2
-1.9
-3.1
-0.6
-3.7
-1.7
-1.7
-7.9
-1.6
-5.0
-0.2
-2.3
-0.8
-2.5
-2.0
-1.7
Ass
ets
-0.4
-4.2
-2.1
-3.1
-0.5
-1.6
-1.5
-0.3
-8.0
-1.6
-5.1
-0.1
-2.3
-1.5
-2.4
-1.9
-0.9
Lia
bilit
ies
0.1
-1.0
0.2
0.0
-0.1
-2.0
-0.2
-1.4
0.0
0.0
0.2
-0.1
0.0
0.7
-0.1
-0.1
-0.8
* P
relim
inar
y da
ta. I
n ac
cord
ance
with
the
BN
B p
ract
ice
and
with
the
EC
B d
ata
revi
sion
req
uire
men
ts (
incl
uded
in th
e E
CB
Tim
eta
ble
for
Exc
hang
e of
Bal
ance
of P
aym
ents
, Int
erna
tiona
l In
vest
men
t Pos
ition
and
Res
erve
Ass
ets
Sta
tistic
s w
ithin
the
ES
CB
), th
e da
ta fo
r Ja
nuar
y 20
13 a
re r
evis
ed. W
ith th
e M
arch
201
3 r
epor
t, ba
lanc
e of
pay
men
ts d
ata
for
Feb
ruar
y 20
13 a
re to
be
revi
sed.
1 A m
inus
sig
n de
note
s a
capi
tal o
utflo
w (
incr
ease
in a
sset
s or
dec
reas
e in
liab
ilitie
s).
2 On
the
basi
s of
mon
thly
ban
ks',
insu
ranc
e co
mpa
nies
and
pen
sion
fund
s an
d ot
her
non-
bank
fina
ncia
l ins
titut
ions
rep
orts
and
the
quar
terly
rep
orts
of o
ther
inve
stm
ent i
nter
med
iarie
s.
Due
to th
e qu
arte
rly r
epor
ting
of th
e no
n-ba
nk in
vest
men
t int
erm
edia
ries
the
data
are
sub
ject
to r
evis
ions
.
3 D
ata
from
the
mon
thly
rep
orts
of t
he C
entr
al D
epos
itary
.
4 T
he d
ata
on g
over
nmen
t deb
t sec
uriti
es, i
ssue
d on
the
inte
rnal
mar
ket,
are
base
d on
qua
rter
ly r
epor
ts o
f the
prim
ary
deal
ers.
D
ue to
qua
rter
ly r
epor
ts o
f the
prim
ary
deal
ers
of g
over
nmen
t deb
t sec
uriti
es, d
ata
are
subj
ect t
o re
visi
ons.
5 F
or is
sues
of g
over
nmen
t deb
t sec
uriti
es o
n ex
tern
al m
arke
ts th
e da
ta a
re fr
om th
e m
onth
ly b
anks
' rep
orts
and
the
Min
istr
y of
Fin
ance
.
26

BA
LAN
CE
OF
PAYM
ENTS
O
THER
INVE
STM
ENT
(STA
ND
AR
D P
RES
ENTA
TIO
N)
Cum
ulat
ed fi
gure
s
F
ebru
ary
Cha
nge
2013
/201
2
(mln
EU
R)
Feb
.12
Mar
.12
Apr
.12
May
. 12
Jun.
12
Jul.
12A
ug. 1
2S
ep. 1
2O
ct. 1
2N
ov. 1
2D
ec.1
2Ja
n. 1
3F
eb.1
320
1220
13*
Feb
Jan-
Feb
Oth
er in
vest
men
t, ne
t-1
57.0
494.
7-1
88.7
375.
572
2.0
-525
.2-7
4.9
195.
9-8
5.4
1087
.162
2.6
-855
.5-1
7.7
-729
.9-8
73.3
139.
2-1
43.3
Ass
ets
-39.
519
5.2
-64.
347
6.9
337.
9-2
29.9
53.7
133.
385
.015
2.2
503.
9-7
83.7
5.6
-551
.1-7
78.0
45.1
-227
.0
Tra
de c
redi
ts 1
-58.
3-5
8.3
0.0
0.0
0.0
0.0
0.0
0.0
0.0
0.0
0.0
0.0
0.0
-116
.50.
058
.311
6.5
L
oans
-31.
0-3
4.7
11.3
6.3
3.5
-25.
05.
2-2
2.8
-36.
84.
4-9
9.9
-91.
41.
6-2
5.0
-89.
832
.6-6
4.8
Ban
ks 2
-32.
9-2
3.6
12.9
8.7
-11.
9-0
.6-1
2.2
5.3
-8.6
10.7
-67.
4-8
6.8
9.7
-26.
7-7
7.0
42.6
-50.
3
L
ong-
term
-14.
1-1
5.7
3.3
5.7
-4.8
-4.0
-7.3
3.0
-3.4
5.6
-69.
0-3
1.8
13.7
-12.
4-1
8.0
27.8
-5.7
Sho
rt-t
erm
-18.
8-7
.99.
63.
0-7
.13.
4-4
.92.
3-5
.15.
01.
5-5
5.0
-4.0
-14.
4-5
9.0
14.8
-44.
6
Oth
er s
ecto
rs 3
1.9
-11.
1-1
.6-2
.315
.4-2
4.4
17.4
-28.
1-2
8.3
-6.2
-32.
5-4
.7-8
.11.
7-1
2.8
-10.
0-1
4.5
Lon
g-te
rm1.
5-1
0.3
-1.7
-0.5
-6.4
-7.3
13.3
-11.
1-7
.8-5
.0-3
6.3
-3.8
6.3
0.6
2.5
4.7
1.9
Sho
rt-t
erm
0.4
-0.8
0.1
-1.9
21.8
-17.
14.
1-1
7.1
-20.
4-1
.33.
8-0
.9-1
4.4
1.1
-15.
3-1
4.8
-16.
4
Cur
renc
y an
d de
posi
ts36
.630
0.5
-71.
946
3.3
374.
0-2
00.0
35.0
170.
211
9.7
173.
560
9.3
-708
.312
.6-4
11.0
-695
.7-2
4.0
-284
.6
Ban
ks 4
-18.
224
5.7
-186
.773
.325
9.2
-195
.639
.417
4.6
116.
317
0.1
605.
9-7
08.3
12.6
-520
.6-6
95.7
30.8
-175
.1
Oth
er s
ecto
rs 5
44.8
44.8
112.
338
7.5
112.
3-3
.2-3
.2-3
.20.
00.
00.
00.
00.
089
.50.
0-4
4.8
-89.
5
Oth
er a
sset
s13
.2-1
2.3
-3.7
7.2
-39.
6-4
.913
.4-1
4.1
2.2
-25.
7-5
.516
.0-8
.61.
57.
5-2
1.8
6.0
Lia
bilit
ies
-117
.529
9.5
-124
.4-1
01.4
384.
2-2
95.3
-128
.662
.6-1
70.4
934.
911
8.8
-71.
9-2
3.4
-178
.9-9
5.2
94.1
83.6
T
rade
cre
dits
6-4
.6-4
.70.
00.
00.
00.
00.
00.
00.
00.
00.
00.
00.
0-9
.60.
04.
69.
6
Loa
ns-6
8.1
250.
5-2
0.5
-79.
217
5.3
13.7
-136
.463
.2-3
77.1
916.
254
.335
.623
2.2
-78.
326
7.7
300.
334
6.0
Mon
etar
y au
thor
ities
70.
00.
00.
00.
00.
00.
00.
00.
00.
00.
00.
00.
00.
00.
00.
00.
00.
0
U
se o
f fun
d cr
edits
and
loan
s0.
00.
00.
00.
00.
00.
00.
00.
00.
00.
00.
00.
00.
00.
00.
00.
00.
0
Gen
eral
gov
ernm
ent 7
0.6
33.5
16.3
3.3
-25.
11.
548
.316
.9-6
.1-1
2.0
-26.
611
.3-2
.49.
38.
9-3
.1-0
.4
L
ong-
term
0.6
33.5
16.3
3.3
-25.
11.
548
.316
.9-6
.1-1
2.0
-26.
611
.3-2
.49.
38.
9-3
.1-0
.4
Ban
ks 2
15.4
203.
2-4
.77.
195
.6-5
4.3
-123
.816
.3-1
56.0
876.
3-5
7.2
-20.
022
6.1
15.1
206.
121
0.6
191.
0
L
ong-
term
5.5
16.2
68.4
11.1
87.1
20.1
-119
.917
.538
.3-3
2.4
-41.
5-5
.42.
0-8
.1-3
.3-3
.44.
8
S
hort
-ter
m9.
918
7.0
-73.
1-4
.08.
5-7
4.4
-3.9
-1.2
-194
.390
8.7
-15.
7-1
4.6
224.
023
.220
9.4
214.
118
6.2
Oth
er s
ecto
rs 3
-84.
113
.8-3
2.2
-89.
610
4.7
66.6
-60.
930
.1-2
15.0
51.8
138.
144
.38.
5-1
02.7
52.8
92.7
155.
4
L
ong-
term
15.2
59.2
-23.
9-9
0.4
144.
9-8
.1-5
1.0
-4.3
-36.
414
4.8
147.
035
.521
.8-1
0.1
57.3
6.6
67.4
Sho
rt-t
erm
-99.
3-4
5.4
-8.3
0.8
-40.
274
.7-9
.934
.3-1
78.6
-92.
9-9
.08.
8-1
3.2
-92.
5-4
.586
.188
.1
C
urre
ncy
and
depo
sits
8-6
3.4
72.7
-122
.7-6
0.5
254.
0-2
96.3
-0.9
-13.
021
3.9
48.5
19.8
-109
.2-2
50.4
-118
.3-3
59.6
-187
.0-2
41.3
Ban
ks-6
3.4
72.7
-122
.7-6
0.5
254.
0-2
96.3
-0.9
-13.
021
3.9
48.5
19.8
-109
.2-2
50.4
-118
.3-3
59.6
-187
.0-2
41.3
O
ther
liab
ilitie
s18
.6-1
9.0
18.8
38.3
-45.
1-1
2.7
8.6
12.3
-7.2
-29.
844
.71.
8-5
.127
.3-3
.3-2
3.8
-30.
7
* P
relim
inar
y da
ta. I
n ac
cord
ance
with
the
BN
B p
ract
ice
and
with
the
EC
B d
ata
revi
sion
req
uire
men
ts (
incl
uded
in th
e E
CB
Tim
eta
ble
for
Exc
hang
e of
Bal
ance
of P
aym
ents
, Int
erna
tiona
l In
vest
men
t Pos
ition
and
Res
erve
Ass
ets
Sta
tistic
s w
ithin
the
ES
CB
), th
e da
ta fo
r Ja
nuar
y 20
13 a
re r
evis
ed. W
ith th
e M
arch
201
3 r
epor
t, ba
lanc
e of
pay
men
ts d
ata
for
Feb
ruar
y 20
13 a
re to
be
revi
sed.
1 Dat
a on
net
cha
nge
of tr
ade
cred
its-a
sset
s pa
id a
dvan
ces
and
rece
ivab
les
from
sup
plie
rs),
rep
orte
d to
the
BN
B a
re in
clud
ed in
thi
s ite
m.
Due
to q
uart
erly
rep
ortin
g da
ta a
re s
ubje
ct to
rev
isio
ns.
2 Dat
a fr
om th
e m
onth
ly b
anks
' rep
orts
.3 D
ata
from
the
quar
terly
rep
orts
of t
he fi
rms.
Due
to th
e qu
arte
rly r
epor
ting
the
data
are
sub
ject
to r
evis
ions
.4,
8 Sou
rce:
BN
B.
5 Ban
k fo
r In
tern
atio
nal S
ettle
men
ts (
BIS
) da
ta. F
or 2
012
and
2013
- d
ata
are
subj
ect t
o re
visi
ons.
6 Dat
a on
net
cha
nge
of tr
ade
cred
its-li
abili
ties
(rec
eive
d ad
vanc
es a
nd p
ayab
les
to s
uppl
iers
), r
epor
ted
to th
e B
NB
are
incl
ude
d in
this
item
.
Due
to q
uart
erly
rep
ortin
g da
ta a
re s
ubje
ct to
rev
isio
ns.
7 Sou
rce:
Min
istr
y of
Fin
ance
and
the
BN
B.
27

BA
LAN
CE
OF
PAYM
ENTS
GEO
GR
APH
ICA
L B
REA
KD
OW
N
ST
AN
DA
RD
PR
ES
EN
TA
TIO
N *
Janu
ary
- D
ecem
ber
2011
Janu
ary
- D
ecem
ber
2012
Janu
ary
- F
ebru
ary
2012
Janu
ary
- F
ebru
ary
2013
Cha
nge
2013
/201
2(m
ln E
UR
)R
est o
f the
Wor
ldIn
tra
EU
Ext
ra E
UR
est o
f the
Wor
ldIn
tra
EU
Ext
ra E
UR
est o
f the
Wor
ldIn
tra
EU
Ext
ra E
UR
est o
f the
Wor
ldIn
tra
EU
Ext
ra E
UR
est o
f the
Wor
ldIn
tra
EU
Ext
ra E
U
Cur
rent
acc
ount
139
.269
.2-3
0.1
-528
.2-8
22.0
293.
8-6
06.5
-495
.8-1
10.7
-376
.8-2
46.7
-130
.122
9.8
249.
2-1
9.4
Goo
ds, s
ervi
ces
and
inco
me,
net
-164
5.4
-759
.1-8
86.3
-256
6.8
-185
4.6
-712
.2-7
11.7
-475
.4-2
36.2
-370
.9-1
80.1
-190
.834
0.8
295.
445
.4
Goo
ds a
nd s
ervi
ces,
net
167.
191
3.1
-745
.9-1
224.
8-6
47.0
-577
.8-4
92.4
-307
.2-1
85.1
-289
.5-1
33.3
-156
.120
2.9
173.
929
.0
Tra
de B
alan
ce 2
-215
6.1
-748
.8-1
407.
3-3
622.
1-2
199.
1-1
423.
0-5
82.1
-362
.3-2
19.8
-367
.3-1
94.2
-173
.121
4.8
168.
146
.6
Goo
ds, c
redi
t20
264.
312
604.
576
59.9
2079
3.1
1215
3.0
8640
.029
00.1
1725
.111
74.9
3434
.420
21.9
1412
.553
4.3
296.
823
7.5
G
oods
, deb
it-2
2420
.4-1
3353
.3-9
067.
2-2
4415
.2-1
4352
.1-1
0063
.1-3
482.
1-2
087.
4-1
394.
7-3
801.
7-2
216.
1-1
585.
6-3
19.6
-128
.7-1
90.9
0.0
0.0
0.0
Ser
vice
s, n
et23
23.3
1661
.966
1.4
2397
.315
52.1
845.
289
.755
.034
.677
.860
.817
.0-1
1.8
5.8
-17.
6
Ser
vice
s, c
redi
t53
53.9
3567
.217
86.8
5659
.936
67.1
1992
.853
7.7
337.
919
9.8
512.
931
8.7
194.
3-2
4.7
-19.
3-5
.5
Tra
nspo
rtat
ion
311
12.2
727.
838
4.4
1097
.966
3.3
434.
612
7.8
81.8
45.9
125.
877
.148
.7-1
.9-4
.72.
8
Tra
vel 4
2852
.418
41.8
1010
.629
16.6
1782
.111
34.5
199.
111
0.4
88.7
213.
411
1.2
102.
214
.40.
813
.5
O
ther
ser
vice
s13
89.3
997.
639
1.7
1645
.412
21.7
423.
621
0.9
145.
765
.217
3.7
130.
343
.4-3
7.2
-15.
4-2
1.8
Ser
vice
s no
t allo
cate
d0.
00.
00.
0
Ser
vice
s, d
ebit
-303
0.7
-190
5.3
-112
5.4
-326
2.5
-211
5.0
-114
7.5
-448
.0-2
82.9
-165
.1-4
35.1
-257
.8-1
77.3
12.9
25.0
-12.
1
Tra
nspo
rtat
ion
3-8
29.5
-423
.9-4
05.6
-864
.5-4
21.4
-443
.1-1
28.1
-59.
6-6
8.5
-144
.9-6
4.8
-80.
2-1
6.9
-5.2
-11.
7
Tra
vel 4
-958
.7-5
63.4
-395
.4-1
015.
7-6
12.0
-403
.8-1
21.1
-71.
4-4
9.7
-132
.2-7
5.3
-56.
9-1
1.1
-3.8
-7.2
Oth
er s
ervi
ces
-124
2.5
-918
.0-3
24.4
-138
2.2
-108
1.6
-300
.6-1
98.8
-151
.8-4
7.0
-158
.0-1
17.8
-40.
240
.834
.16.
8
S
ervi
ces
not a
lloca
ted
Inc
ome,
net
-181
2.5
-167
2.1
-140
.4-1
342.
0-1
207.
6-1
34.4
-219
.3-1
68.2
-51.
1-8
1.5
-46.
8-3
4.7
137.
812
1.5
16.4
In
com
e, c
redi
t61
4.0
530.
483
.673
0.6
605.
212
5.5
96.6
81.1
15.5
101.
182
.219
.04.
61.
13.
5
Com
pens
atio
n of
em
ploy
ees 5
291.
824
4.8
47.0
327.
727
3.9
53.8
32.5
27.4
5.1
35.1
28.4
6.7
2.7
1.0
1.6
Inve
stm
ent i
ncom
e32
2.1
285.
636
.640
2.9
331.
271
.764
.153
.710
.466
.053
.712
.31.
90.
01.
9
Inco
me,
deb
it-2
426.
5-2
202.
5-2
24.0
-207
2.6
-181
2.8
-259
.9-3
15.9
-249
.3-6
6.5
-182
.6-1
28.9
-53.
713
3.3
120.
412
.9
C
ompe
nsat
ion
of e
mpl
oyee
s-1
2.4
-10.
1-2
.3-1
6.1
-14.
1-2
.0-1
.7-1
.6-0
.1-3
.0-1
.3-1
.7-1
.30.
2-1
.6
In
vest
men
t inc
ome
-241
4.1
-219
2.3
-221
.7-2
056.
6-1
798.
7-2
57.9
-314
.2-2
47.8
-66.
4-1
79.6
-127
.6-5
2.0
134.
612
0.2
14.4
Cur
rent
tran
sfer
s, n
et16
84.5
828.
385
6.2
2038
.610
32.5
1006
.110
5.1
-20.
412
5.5
-5.9
-66.
660
.7-1
11.0
-46.
2-6
4.8
C
urre
nt tr
ansf
ers,
cre
dit
2237
.913
22.4
915.
527
03.8
1641
.810
61.9
282.
814
7.2
135.
623
6.6
113.
812
2.8
-46.
2-3
3.5
-12.
7
Cur
rent
tran
sfer
s, d
ebit
-553
.3-4
94.1
-59.
2-6
65.2
-609
.3-5
5.9
-177
.6-1
67.6
-10.
0-2
42.5
-180
.3-6
2.1
-64.
8-1
2.7
-52.
1
Cap
ital a
ccou
nt1,
6,7
496.
849
3.9
2.9
536.
853
6.7
0.1
8.4
8.2
0.2
4.1
4.3
-0.1
-4.3
-3.9
-0.4
Cap
ital t
rans
fers
, net
464.
445
9.6
4.8
514.
051
4.3
-0.3
9.8
9.6
0.2
-3.9
-3.7
-0.1
-13.
7-1
3.3
-0.4
C
apita
l tra
nsfe
rs, c
redi
t46
5.7
460.
25.
564
0.6
639.
51.
09.
89.
60.
2-3
.7-3
.7-1
3.6
-13.
3-0
.2
Cap
ital t
rans
fers
, deb
it-1
.4-0
.6-0
.8-1
26.5
-125
.2-1
.30.
00.
0-0
.1-0
.1-0
.10.
0-0
.1
Fina
ncia
l acc
ount
1,6
-112
6.8
-179
3.7
666.
970
.498
9.4
-919
.145
3.5
-258
.671
2.0
118.
8-9
64.5
1083
.3-3
34.7
-705
.937
1.2
Dire
ct in
vest
men
t11
98.7
599.
059
9.7
1301
.675
1.5
550.
150
0.5
410.
989
.633
.521
.711
.8-4
67.0
-389
.2-7
7.8
A
broa
d-1
15.9
-78.
2-3
7.7
-176
.7-8
1.9
-94.
8-2
3.8
-14.
7-9
.1-6
.8-5
.2-1
.617
.09.
47.
6
E
quity
cap
ital
-149
.8-9
5.2
-54.
6-1
34.5
-81.
3-5
3.2
-19.
9-1
2.5
-7.4
-7.9
-4.9
-3.0
12.0
7.6
4.4
Rei
nves
ted
earn
ings
38.0
11.7
26.2
-17.
3-4
.8-1
2.5
-8.7
-4.7
-4.0
8.7
4.7
4.0
Oth
er c
apita
l-4
.05.
3-9
.4-2
4.9
4.1
-29.
04.
92.
62.
31.
1-0
.31.
4-3
.8-3
.0-0
.8
In
the
repo
rtin
g ec
onom
y 813
14.6
677.
163
7.5
1478
.383
3.4
644.
952
4.3
425.
598
.740
.326
.913
.4-4
83.9
-398
.6-8
5.3
Equ
ity c
apita
l11
03.6
626.
347
7.3
1051
.072
6.9
324.
112
7.1
86.5
40.6
50.1
36.3
13.8
-77.
0-5
0.2
-26.
8
R
einv
este
d ea
rnin
gs-1
73.7
-108
.9-6
4.8
76.6
79.0
-2.4
16.9
16.7
0.3
12.8
13.2
-0.4
-4.2
-3.5
-0.7
Oth
er c
apita
l 938
4.7
159.
822
4.9
350.
727
.532
3.2
380.
232
2.4
57.8
-22.
5-2
2.5
0.0
-402
.8-3
44.9
-57.
9
M
erge
rs a
nd a
cqui
sitio
ns, n
et 1
00.
00.
00.
0
Por
tfolio
inve
stm
ent
-357
.4-1
56.4
-201
.1-9
30.6
-122
4.1
293.
5-1
.634
.9-3
6.5
-609
.3-1
83.9
-425
.3-6
07.6
-218
.8-3
88.8
A
sset
s 11
-47.
6-1
60.7
113.
2-1
493.
7-1
299.
3-1
94.5
40.7
27.6
13.1
-215
.8-1
85.3
-30.
5-2
56.6
-212
.9-4
3.7
Equ
ities
sec
uriti
es86
.866
.819
.9-3
9.3
-30.
2-9
.117
.116
.70.
4-6
.7-1
3.4
6.7
-23.
8-3
0.1
6.4
Deb
t sec
uriti
es-1
34.3
-227
.693
.3-1
454.
5-1
269.
1-1
85.4
23.7
10.9
12.8
-209
.2-1
71.9
-37.
3-2
32.8
-182
.8-5
0.0
L
iabi
litie
s-3
09.9
4.4
-314
.356
3.1
75.1
488.
0-4
2.4
7.3
-49.
7-3
93.4
1.4
-394
.8-3
51.1
-5.9
-345
.1
E
quiti
es s
ecur
ities
-31.
2-8
.2-2
3.0
3.5
31.9
-28.
44.
36.
7-2
.40.
00.
4-0
.4-4
.3-6
.21.
9
D
ebt s
ecur
ities
-278
.712
.6-2
91.3
559.
643
.251
6.4
-46.
70.
6-4
7.3
-393
.40.
9-3
94.3
-346
.70.
3-3
47.1
Fin
anci
al d
eriv
ativ
es,n
et-6
5.3
-35.
4-2
9.9
-33.
3-2
0.5
-12.
8-0
.80.
0-0
.8-2
.5-0
.9-1
.6-1
.7-0
.9-0
.8
28

BA
LAN
CE
OF
PAYM
ENTS
GEO
GR
APH
ICA
L B
REA
KD
OW
N
ST
AN
DA
RD
PR
ES
EN
TA
TIO
N *
Janu
ary
- D
ecem
ber
2011
Janu
ary
- D
ecem
ber
2012
Janu
ary
- F
ebru
ary
2012
Janu
ary
- F
ebru
ary
2013
Cha
nge
2013
/201
2(m
ln E
UR
)R
est o
f the
Wor
ldIn
tra
EU
Ext
ra E
UR
est o
f the
Wor
ldIn
tra
EU
Ext
ra E
UR
est o
f the
Wor
ldIn
tra
EU
Ext
ra E
UR
est o
f the
Wor
ldIn
tra
EU
Ext
ra E
UR
est o
f the
Wor
ldIn
tra
EU
Ext
ra E
U O
ther
inve
stm
ent
-174
4.1
-220
0.9
456.
818
93.6
1482
.641
1.1
-729
.9-7
04.4
-25.
6-8
73.3
-801
.4-7
1.9
-143
.3-9
7.0
-46.
3
Ass
ets
-712
.8-8
09.3
96.5
1092
.859
4.5
498.
3-5
51.1
-570
.419
.4-7
78.0
-678
.4-9
9.7
-227
.0-1
07.9
-119
.0
Tra
de c
redi
ts 1
2-9
8.6
-123
.324
.7-1
74.9
-107
.7-6
7.2
-116
.5-7
1.7
-44.
811
6.5
71.7
44.8
Loan
s-7
2.0
23.4
-95.
4-2
13.4
-41.
1-1
72.3
-25.
0-2
9.8
4.8
-89.
8-4
1.4
-48.
5-6
4.8
-11.
6-5
3.3
Cur
renc
y an
d de
posi
ts 1
3-4
84.8
-662
.817
8.0
1562
.585
0.7
711.
8-4
11.0
-464
.353
.3-6
95.7
-642
.4-5
3.2
-284
.6-1
78.1
-106
.6
O
ther
ass
ets
-57.
5-4
6.6
-10.
9-8
1.4
-107
.426
.01.
5-4
.66.
17.
55.
42.
06.
010
.0-4
.0 L
iabi
litie
s-1
031.
3-1
391.
736
0.3
800.
988
8.1
-87.
2-1
78.9
-133
.9-4
4.9
-95.
2-1
23.0
27.8
83.6
10.9
72.7
Tra
de c
redi
ts 1
456
.116
.839
.3-1
4.3
36.8
-51.
1-9
.624
.5-3
4.1
0.0
0.0
9.6
-24.
534
.1
Lo
ans
-16.
3-2
52.3
236.
078
1.7
898.
6-1
16.9
-78.
3-8
6.0
7.8
267.
724
0.0
27.7
346.
032
6.1
19.9
Cur
renc
y an
d de
posi
ts-1
117.
9-1
204.
886
.9-2
.8-5
9.2
56.5
-118
.3-9
9.9
-18.
5-3
59.6
-371
.311
.7-2
41.3
-271
.430
.1
O
ther
liab
ilitie
s46
.848
.7-1
.936
.211
.924
.427
.327
.4-0
.1-3
.38.
2-1
1.6
-30.
7-1
9.2
-11.
5
B
NB
Res
erve
ass
ets
(incr
ease
: -) 1
5-1
58.7
-158
.7-2
161.
0-2
161.
068
5.4
1570
.388
4.9
Net
Err
ors
and
Om
issi
ons
590.
912
30.6
-639
.7-7
8.9
-704
.062
5.1
144.
625
3.8
109.
2
* S
tand
ard
pres
enta
tion
in a
ccor
danc
e w
ith IM
F 5
-th
editi
on o
f the
"B
alan
ce o
f Pay
men
ts M
anua
l".
1 P
relim
inar
y da
ta. I
n ac
cord
ance
with
the
BN
B p
ract
ice
and
with
the
EC
B d
ata
revi
sion
req
uire
men
ts (
incl
uded
in th
e E
CB
Tim
etab
le fo
r E
xcha
nge
of B
alan
ce o
f Pay
men
ts, I
nter
natio
nal
Inve
stm
ent P
ositi
on a
nd R
eser
ve A
sset
s S
tatis
tics
with
in th
e E
SC
B),
the
data
for
Janu
ary
2013
are
rev
ised
. With
the
Mar
ch 2
013
rep
ort,
bala
nce
of p
aym
ents
dat
a fo
r F
ebru
ary
2013
are
to b
e re
vise
d.2 F
or 2
012
and
2013
pre
limin
ary
NS
I da
ta a
s of
Apr
il 4,
201
3 w
hich
incl
ude
data
from
the
syst
em IN
TR
AS
TA
T f
or th
e E
U m
embe
r st
ates
and
from
cus
tom
s de
clar
atio
ns fo
r no
n-E
U c
ount
ries.
T
he r
ecal
cula
tion
of im
port
s at
FO
B p
rices
is b
ased
on
a m
etho
dolo
gy d
evel
oped
by
the
BN
B a
nd th
e N
SI .
3 E
stim
ates
follo
win
g a
met
hodo
logy
of t
he B
NB
and
the
NS
I.4 E
stim
ates
follo
win
g a
met
hodo
logy
of t
he B
NB
. Dat
a fo
r 20
07-2
013
are
base
d on
pre
limin
ary
NS
I dat
a on
the
num
ber
of fo
reig
n vi
sito
rs
and
Bul
garia
ns, w
ho h
ave
trav
elle
d ab
road
and
BN
B e
stim
ates
of t
he e
xpen
ditu
res
(rec
eipt
s) b
y pu
rpos
e of
the
trav
el.
5 E
stim
ates
follo
win
g a
met
hodo
logy
of t
he B
NB
.6 A
min
us s
ign
deno
tes
a ca
pita
l out
flow
(in
crea
se in
ass
ets
or d
ecre
ase
in li
abili
ties)
. 7 T
he it
em in
clud
es C
apita
l tra
nsfe
rs a
nd A
cqui
sitio
n/D
ispo
sal o
f non
prod
uced
non
finan
cial
ass
ets.
8 P
relim
inar
y da
ta. D
ata
are
prov
ided
by
dire
ct in
vest
men
t com
pani
es r
epor
ting
to B
NB
, Age
ncy
for
Priv
atiz
atio
n, N
SI,
Cen
tral
De
posi
tory
, ban
ks a
nd o
ther
s.
The
201
2 an
d 20
13 d
ata
incl
ude
only
ban
ks’ d
ata
on r
einv
este
d ea
rnin
gs.
9 O
n th
e ba
sis
of th
e re
port
s su
bmitt
ed to
the
BN
B b
y th
e en
terp
rises
with
fina
ncia
l cre
dits
rec
eive
d fr
om n
on-r
esid
ents
.
D
ue to
qua
rter
ly r
epor
ting
data
are
sub
ject
to r
evis
ions
.10
Mer
gers
and
acq
uisi
tions
are
incl
uded
in th
is it
em.
11 B
anks
, oth
er n
onba
nk fi
nanc
ial i
nstit
utio
ns, i
nsur
ance
com
pani
es a
nd p
ensi
on fu
nds'
dat
a.12
Dat
a on
net
cha
nge
of tr
ade
cred
its-a
sset
s (p
aid
adva
nces
and
rec
eiva
bles
from
sup
plie
rs),
rep
orte
d to
the
BN
B a
re in
clud
ed in
this
item
.
D
ue to
qua
rter
ly r
epor
ting
data
are
sub
ject
to r
evis
ions
. 13
Ban
k fo
r In
tern
atio
nal S
ettle
men
ts (
BIS
) da
ta. F
or 2
012
and
2013
- d
ata
are
subj
ect t
o re
visi
ons.
14 D
ata
on n
et c
hang
e of
trad
e cr
edits
-liab
ilitie
s (r
ecei
ved
adva
nces
and
pay
able
s to
sup
plie
rs),
rep
orte
d to
the
BN
B a
re in
clud
ed
in th
is it
em.
D
ue to
qua
rter
ly r
epor
ting
data
are
sub
ject
to r
evis
ions
. 15
Exc
ludi
ng v
alua
tion
chan
ges
due
to th
e ex
chan
ge r
ate
or p
rice
chan
ges,
cha
nges
ass
ocia
ted
with
the
crea
tion
of r
eser
ve a
sset
s (m
onet
ariz
atio
n/de
mon
itariz
atio
n of
gol
d an
d th
e al
loca
tion
or
can
cella
tion
of S
DR
s) a
nd r
ecla
ssifi
catio
ns. A
min
us s
ign
(-)
deno
tes
an in
crea
se in
the
rese
rves
, a p
ositi
ve s
ign
(+)
- a
decr
ease
.
29
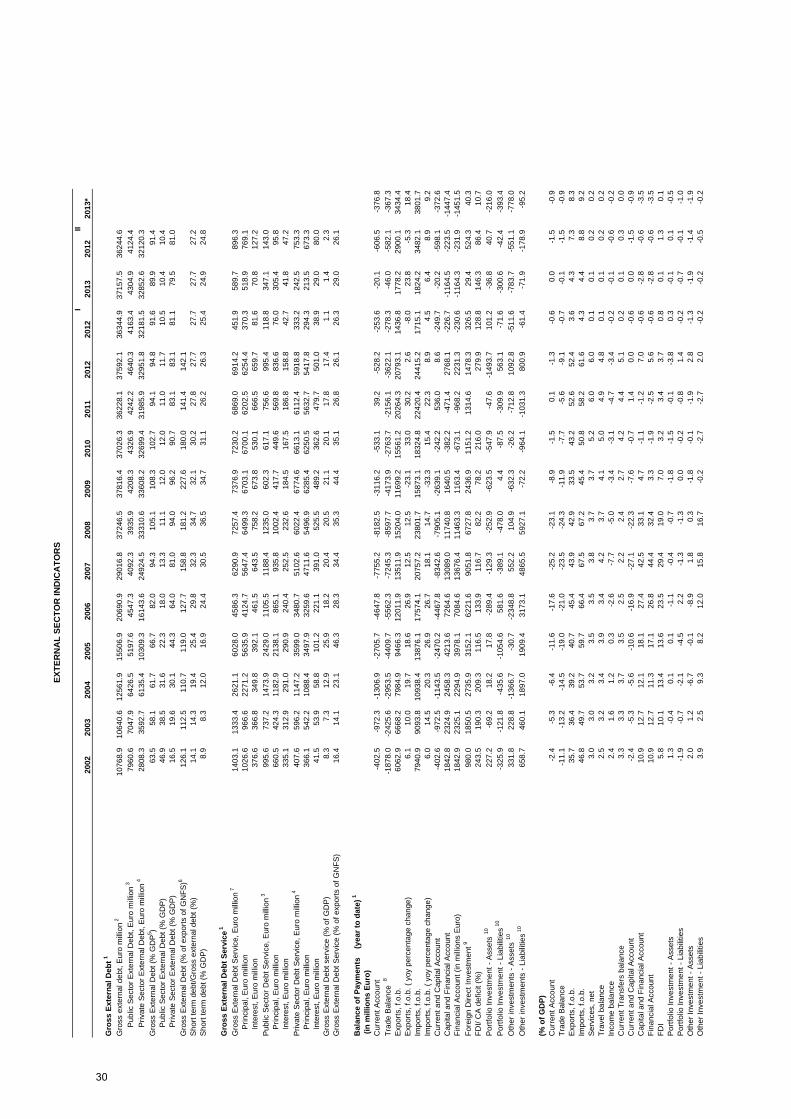
EXTE
RN
AL
SEC
TOR
IND
ICA
TOR
S
III
2002
2003
2004
2005
2006
2007
2008
2009
2010
2011
2012
2012
2013
2012
2013
*
Gro
ss E
xter
nal D
ebt 1
Gro
ss e
xter
nal d
ebt,
Eur
o m
illio
n 2
1076
8.9
1064
0.6
1256
1.9
1550
6.9
2069
0.9
2901
6.8
3724
6.5
3781
6.4
3702
6.3
3622
8.1
3759
2.1
3634
4.9
3715
7.5
3624
4.6
P
ublic
Sec
tor
Ext
erna
l Deb
t, E
uro
mill
ion
379
60.6
7047
.964
26.5
5197
.645
47.3
4092
.339
35.9
4208
.343
26.9
4242
.246
40.3
4163
.443
04.9
4124
.4
P
rivat
e S
ecto
r E
xter
nal D
ebt,
Eur
o m
illio
n 4
2808
.335
92.7
6135
.410
309.
316
143.
624
924.
533
310.
633
608.
232
699.
431
985.
932
951.
832
181.
532
852.
632
120.
3
Gro
ss E
xter
nal D
ebt (
% G
DP
5 )63
.558
.161
.766
.782
.094
.310
5.1
108.
310
2.7
94.1
94.8
91.6
89.9
91.4
P
ublic
Sec
tor
Ext
erna
l Deb
t (%
GD
P)
46.9
38.5
31.6
22.3
18.0
13.3
11.1
12.0
12.0
11.0
11.7
10.5
10.4
10.4
P
rivat
e S
ecto
r E
xter
nal D
ebt (
% G
DP
)16
.519
.630
.144
.364
.081
.094
.096
.290
.783
.183
.181
.179
.581
.0
Gro
ss E
xter
nal D
ebt (
% o
f exp
orts
of G
NF
S)6
126.
111
2.5
110.
711
9.0
127.
715
8.8
181.
222
7.6
180.
014
1.4
142.
1S
hort
term
deb
t/Gro
ss e
xter
nal d
ebt (
%)
14.1
14.3
19.4
25.4
29.8
32.3
34.7
32.1
30.2
27.8
27.7
27.7
27.7
27.2
Sho
rt te
rm d
ebt (
% G
DP
)8.
98.
312
.016
.924
.430
.536
.534
.731
.126
.226
.325
.424
.924
.8
Gro
ss E
xter
nal D
ebt S
ervi
ce1
Gro
ss E
xter
nal D
ebt S
ervi
ce, E
uro
mill
ion
714
03.1
1333
.426
21.1
6028
.045
86.3
6290
.972
57.4
7376
.972
30.2
6869
.069
14.2
451.
958
9.7
896.
3
Prin
cipa
l, E
uro
mill
ion
1026
.696
6.6
2271
.256
35.9
4124
.756
47.4
6499
.367
03.1
6700
.162
02.5
6254
.437
0.3
518.
976
9.1
In
tere
st, E
uro
mill
ion
376.
636
6.8
349.
839
2.1
461.
564
3.5
758.
267
3.8
530.
166
6.5
659.
781
.670
.812
7.2
Pub
lic S
ecto
r D
ebt S
ervi
ce, E
uro
mill
ion
399
5.6
737.
214
73.9
2429
.011
05.5
1188
.412
35.0
602.
361
7.1
756.
699
5.4
118.
834
7.1
143.
0
Prin
cipa
l, E
uro
mill
ion
660.
542
4.3
1182
.921
38.1
865.
193
5.8
1002
.441
7.7
449.
656
9.8
836.
676
.030
5.4
95.8
In
tere
st, E
uro
mill
ion
335.
131
2.9
291.
029
0.9
240.
425
2.5
232.
618
4.5
167.
518
6.8
158.
842
.741
.847
.2
Priv
ate
Sec
tor
Deb
t Ser
vice
, Eur
o m
illio
n 4
407.
659
6.2
1147
.235
99.0
3480
.751
02.6
6022
.467
74.6
6613
.161
12.4
5918
.833
3.2
242.
575
3.3
P
rinci
pal,
Eur
o m
illio
n36
6.1
542.
210
88.4
3497
.932
59.6
4711
.654
96.9
6285
.462
50.5
5632
.754
17.8
294.
321
3.5
673.
3
Inte
rest
, Eur
o m
illio
n41
.553
.958
.810
1.2
221.
139
1.0
525.
548
9.2
362.
647
9.7
501.
038
.929
.080
.0G
ross
Ext
erna
l Deb
t ser
vice
(%
of G
DP
)8.
37.
312
.925
.918
.220
.420
.521
.120
.117
.817
.41.
11.
42.
3G
ross
Ext
erna
l Deb
t Ser
vice
(%
of e
xpor
ts o
f GN
FS
)16
.414
.123
.146
.328
.334
.435
.344
.435
.126
.826
.126
.329
.026
.1
Bal
ance
of P
aym
ents
(y
ear t
o da
te) 1
(in
mill
ions
Eur
o)C
urre
nt A
ccou
nt-4
02.5
-972
.3-1
306.
9-2
705.
7-4
647.
8-7
755.
2-8
182.
5-3
116.
2-5
33.1
39.2
-528
.2-2
53.6
-20.
1-6
06.5
-376
.8
Tra
de B
alan
ce 8
-187
8.0
-242
5.6
-295
3.5
-440
9.7
-556
2.3
-724
5.3
-859
7.7
-417
3.9
-276
3.7
-215
6.1
-362
2.1
-278
.3-4
6.0
-582
.1-3
67.3
Exp
orts
, f.o
.b.
6062
.966
68.2
7984
.994
66.3
1201
1.9
1351
1.9
1520
4.0
1169
9.2
1556
1.2
2026
4.3
2079
3.1
1436
.817
78.2
2900
.134
34.4
Exp
orts
, f.o
.b. (
yoy
per
cent
age
chan
ge)
6.1
10.0
19.7
18.6
26.9
12.5
12.5
-23.
133
.030
.22.
6-8
.023
.8-5
.318
.4Im
port
s, f.
o.b.
79
40.9
9093
.810
938.
413
876.
117
574.
120
757.
223
801.
715
873.
118
324.
822
420.
424
415.
217
15.1
1824
.234
82.1
3801
.7Im
port
s, f.
o.b.
( y
oy p
erce
ntag
e ch
ange
)6.
014
.520
.326
.926
.718
.114
.7-3
3.3
15.4
22.3
8.9
4.5
6.4
8.9
9.2
Cur
rent
and
Cap
ital A
ccou
nt
-402
.6-9
72.5
-114
3.5
-247
0.2
-446
7.8
-834
2.6
-790
5.1
-263
9.1
-242
.253
6.0
8.6
-249
.7-2
0.2
-598
.1-3
72.6
Cap
ital a
nd F
inan
cial
Acc
ount
18
42.8
2324
.924
58.3
4213
.672
64.6
1308
9.0
1174
0.8
1640
.5-3
82.2
-471
.427
68.1
-226
.7-1
164.
5-2
23.5
-144
7.4
Fin
anci
al A
ccou
nt (
in m
illio
ns E
uro)
1842
.923
25.1
2294
.939
78.1
7084
.613
676.
411
463.
311
63.4
-673
.1-9
68.2
2231
.3-2
30.6
-116
4.3
-231
.9-1
451.
5
For
eign
Dire
ct In
vest
men
t 998
0.0
1850
.527
35.9
3152
.162
21.6
9051
.867
27.8
2436
.911
51.2
1314
.614
78.3
326.
529
.452
4.3
40.3
FD
I/ C
A d
efic
it (%
)24
3.5
190.
320
9.3
116.
513
3.9
116.
782
.278
.221
6.0
279.
912
8.8
146.
386
.410
.7
Por
tfolio
Inve
stm
ent -
Ass
ets
1022
7.2
-69.
218
.217
.8-2
89.4
-129
.3-2
52.9
-623
.5-5
47.9
-47.
6-1
493.
710
1.2
-36.
840
.7-2
16.0
Por
tfolio
Inve
stm
ent -
Lia
bilit
ies
10-3
25.9
-121
.8-4
35.6
-105
4.6
581.
6-3
89.1
-478
.04.
4-8
7.5
-309
.956
3.1
-71.
6-3
00.6
-42.
4-3
93.4
Oth
er in
vest
men
ts -
Ass
ets
1033
1.8
228.
8-1
366.
7-3
0.7
-234
8.8
552.
210
4.9
-632
.3-2
6.2
-712
.810
92.8
-511
.6-7
83.7
-551
.1-7
78.0
Oth
er in
vest
men
ts -
Lia
bilit
ies
1065
8.7
460.
118
97.0
1909
.431
73.1
4865
.559
27.1
-72.
2-9
64.1
-103
1.3
800.
9-6
1.4
-71.
9-1
78.9
-95.
2
(% o
f GD
P)C
urre
nt A
ccou
nt
-2.4
-5.3
-6.4
-11.
6-1
7.6
-25.
2-2
3.1
-8.9
-1.5
0.1
-1.3
-0.6
0.0
-1.5
-0.9
Tra
de B
alan
ce
-11.
1-1
3.2
-14.
5-1
9.0
-21.
0-2
3.5
-24.
3-1
1.9
-7.7
-5.6
-9.1
-0.7
-0.1
-1.5
-0.9
Exp
orts
, f.o
.b.
35.7
36.4
39.2
40.7
45.4
43.9
42.9
33.5
43.2
52.6
52.4
3.6
4.3
7.3
8.3
Impo
rts,
f.o.
b.
46.8
49.7
53.7
59.7
66.4
67.5
67.2
45.4
50.8
58.2
61.6
4.3
4.4
8.8
9.2
Ser
vice
s, n
et
3.0
3.0
3.2
3.5
3.5
3.8
3.7
3.7
5.2
6.0
6.0
0.1
0.1
0.2
0.2
Tra
vel b
alan
ce
2.5
3.2
3.4
3.9
3.4
4.2
3.7
4.1
5.0
4.9
4.8
0.1
0.1
0.2
0.2
Inco
me
bala
nce
2.4
1.6
1.2
0.3
-2.6
-7.7
-5.0
-3.4
-3.1
-4.7
-3.4
-0.2
-0.1
-0.6
-0.2
Cur
rent
Tra
nsfe
rs b
alan
ce
3.3
3.3
3.7
3.5
2.5
2.2
2.4
2.7
4.2
4.4
5.1
0.2
0.1
0.3
0.0
Cur
rent
and
Cap
ital A
ccou
nt
-2.4
-5.3
-5.6
-10.
6-1
6.9
-27.
1-2
2.3
-7.6
-0.7
1.4
0.0
-0.6
0.0
-1.5
-0.9
Cap
ital a
nd F
inan
cial
Acc
ount
10
.912
.712
.118
.127
.442
.533
.14.
7-1
.1-1
.27.
0-0
.6-2
.8-0
.6-3
.5F
inan
cial
Acc
ount
10
.912
.711
.317
.126
.844
.432
.43.
3-1
.9-2
.55.
6-0
.6-2
.8-0
.6-3
.5F
DI
5.8
10.1
13.4
13.6
23.5
29.4
19.0
7.0
3.2
3.4
3.7
0.8
0.1
1.3
0.1
Por
tfolio
Inve
stm
ent -
Ass
ets
1.3
-0.4
0.1
0.1
-1.1
-0.4
-0.7
-1.8
-1.5
-0.1
-3.8
0.3
-0.1
0.1
-0.5
Por
tfolio
Inve
stm
ent -
Lia
bilit
ies
-1.9
-0.7
-2.1
-4.5
2.2
-1.3
-1.3
0.0
-0.2
-0.8
1.4
-0.2
-0.7
-0.1
-1.0
Oth
er In
vest
men
t - A
sset
s 2.
01.
2-6
.7-0
.1-8
.91.
80.
3-1
.8-0
.1-1
.92.
8-1
.3-1
.9-1
.4-1
.9O
ther
Inve
stm
ent -
Lia
bilit
ies
3.9
2.5
9.3
8.2
12.0
15.8
16.7
-0.2
-2.7
-2.7
2.0
-0.2
-0.2
-0.5
-0.2
30

EXTE
RN
AL
SEC
TOR
IND
ICA
TOR
S
III
2002
2003
2004
2005
2006
2007
2008
2009
2010
2011
2012
2012
2013
2012
2013
*
Oth
er in
dica
tors
11
Gro
ss E
xter
nal A
sset
s (in
mill
ion
Eur
o) 12
6896
.172
03.3
9482
.310
689.
414
146.
717
026.
217
620.
918
312.
218
883.
819
601.
921
857.
219
726.
421
197.
619
570.
421
098.
1
BN
B r
eser
ve a
sset
s(in
mill
ion
Eur
o) 13
4574
.853
08.6
6770
.473
70.3
8926
.411
936.
612
713.
112
918.
912
976.
713
348.
715
552.
512
981.
514
189.
912
789.
313
914.
9C
B fo
reig
n as
sets
(in
mill
ion
Eur
o)
1944
.515
35.2
2288
.427
73.2
4227
.140
26.3
3909
.040
97.5
4075
.846
17.0
5128
.351
08.8
5831
.351
45.0
6006
.8
Non
finan
cial
sec
tor
depo
sits
abr
oad
(in m
illio
n E
uro)
1437
6.8
359.
542
3.6
545.
999
3.2
1063
.299
8.7
1295
.918
31.3
1636
.111
76.3
1636
.111
76.3
1636
.111
76.3
Net
Ext
erna
l Deb
t (in
mill
ion
Eur
o) 15
3872
.834
37.3
3079
.648
17.5
6544
.211
990.
719
625.
619
504.
218
142.
516
626.
215
734.
916
618.
415
960.
016
674.
2N
et E
xter
nal D
ebt (
% G
DP
)22
.818
.815
.120
.724
.739
.055
.455
.850
.343
.239
.741
.938
.642
.0
Inte
rnat
iona
l Inv
estm
ent P
ositi
on, N
et (
in m
illio
n E
uro)
16-4
297.
3-4
816.
6-5
476.
0-1
0257
.8-1
5349
.7-2
4965
.5-3
4879
.9-3
5568
.2-3
4384
.5-3
3021
.0-3
2044
.2In
tern
atio
nal I
nves
tmen
t Pos
ition
, Net
(%
of G
DP
)-2
5.3
-26.
3-2
6.9
-44.
1-5
8.0
-81.
1-9
8.4
-101
.8-9
5.4
-85.
8-8
0.8
BN
B r
eser
ve a
sset
s in
mon
hts
of G
NF
S im
port
s 17
5.6
5.7
6.0
5.3
5.1
5.9
5.5
8.0
7.3
6.3
6.7
6.1
6.1
6.0
6.0
BN
B r
eser
ve a
sset
s/ S
hort
term
deb
t30
1.9
348.
127
7.3
187.
414
5.0
127.
298
.410
6.5
115.
913
4.4
149.
112
9.0
137.
712
9.8
BN
B r
eser
ve a
sset
s (%
)/ F
X d
epos
its o
f pop
ulat
ion
1819
6.8
213.
625
7.9
221.
320
6.9
202.
117
9.0
158.
715
4.9
152.
217
8.5
148.
816
2.8
147.
915
9.1
Nom
inal
effe
ctiv
e ex
chan
ge r
ate
(inde
x Ju
ne 1
997=
100)
1912
1.6
126.
812
7.9
124.
112
6.4
127.
513
1.2
134.
013
0.5
132.
113
1.0
131.
213
1.5
131.
113
1.8
Rea
l effe
ctiv
e ex
chan
ge r
ate
(inde
x Ju
ne 1
997=
100)
, e.o
.p. 20
131.
414
0.0
141.
714
1.5
149.
016
2.0
173.
917
4.3
172.
017
2.9
174.
617
3.0
176.
917
3.7
177.
0
* T
he in
dica
tors
, for
the
cacu
latio
n of
whi
ch e
xter
nal d
ebt d
ata
are
used
, are
pub
lishe
d w
ith th
e ex
tern
al d
ebt d
ata
for
the
repo
rtin
g pe
riod.
1/ D
ata
for
2012
and
201
3 ar
e pr
elim
inar
y. I
n ac
cord
ance
with
the
BN
B p
ract
ice
and
with
the
EC
B d
ata
revi
sion
req
uire
men
ts (
incl
uded
in th
e E
CB
Tim
etab
le fo
r E
xcha
nge
of B
alan
ce o
f Pay
men
ts, I
nter
natio
nal
Inve
stm
ent P
ositi
on a
nd R
eser
ve A
sset
s S
tatis
tics
with
in th
e E
SC
B),
the
data
for
Janu
ary
2013
are
rev
ised
.
Flo
w d
ata
incl
ude
the
perio
d fr
om th
e be
ginn
ing
of th
e ye
ar to
the
repo
rtin
g m
onth
, sto
ck d
ata
are
as o
f the
end
of t
he r
epor
ting
mon
th.
2/ T
he E
uro
equi
vale
nt is
cal
cula
ted
usin
g th
e e.
o.p.
exc
hang
e ra
tes
of th
e re
spec
tive
fore
ign
curr
enci
es.
D
ata
on e
xter
nal l
iabi
litie
s on
trad
e cr
edits
are
incl
uded
in th
e de
bt s
tock
.
3 Incl
udes
Gen
eral
Gov
ernm
ent's
ext
erna
l deb
t, th
e ex
tern
al d
ebt o
f ban
ks fr
om th
e pu
blic
sec
tor
and
of n
on-f
inan
cial
ent
erpr
ise
s fr
om th
e pu
blic
sec
tor,
as
wel
l as
the
publ
icly
gua
rant
eed
exte
rnal
deb
t of t
he p
rivat
e se
ctor
(in
acc
orda
nce
w
ith p
ara
5.5–
5.6
of E
xter
nal D
ebt S
tatis
tics:
Gui
de fo
r C
ompi
lers
and
Use
rs, 2
003)
. Sou
rces
: Min
istr
y of
Fin
ance
, Bul
garia
n N
atio
nal B
ank,
ban
ks, l
ocal
com
pani
es.
4/ S
ourc
es: b
anks
, loc
al c
ompa
nies
.
5/ In
the
calc
ulat
ion
of th
e in
dica
tors
in w
hich
gro
ss d
omes
tic p
rodu
ct (
GD
P)
is in
clud
ed th
e fo
llow
ing
data
are
use
d:
G
DP
for
2013
at E
uro
41 3
19 m
illio
n (B
NB
est
imat
e) a
nd G
DP
for
2012
– E
UR
39
667.
1 (N
SI d
ata
as o
f 06.
03.2
013)
. 6
/ Goo
ds a
nd n
on-f
acto
r se
rvic
es. T
he in
dica
tor
is c
alcu
late
d on
an
annu
al b
asis
. 7
/ Act
ual p
aym
ents
. T
he E
uro
equi
vale
nt is
cal
cula
ted
usin
g th
e m
onth
ly a
vera
ge e
xcha
nge
rate
s of
the
resp
ectiv
e fo
reig
n cu
rren
cies
. Pay
men
ts o
n re
volv
ing
cred
its a
re n
ot in
clud
ed.
8/ F
or 2
013
- pr
elim
inar
y N
SI d
ata
as o
f Apr
il 4,
201
3, w
hich
incl
ude
data
from
the
syst
em IN
TR
AS
TA
T
for
the
EU
mem
ber
stat
es a
nd fr
om c
usto
ms
decl
arat
ions
for
non-
EU
cou
ntrie
s. 9
/ Dat
a ar
e pr
ovid
ed b
y di
rect
inve
stm
ent c
ompa
nies
rep
ortin
g to
the
BN
B, b
y th
e A
genc
y fo
r P
rivat
izat
ion,
the
NS
I, th
e C
entr
al D
epos
itory
and
the
bank
s. 1
0/ A
neg
ativ
e si
gn (
-) d
enot
es a
n in
crea
se in
ass
ets
and
a de
crea
se in
liab
ilitie
s an
d a
posi
tive
sign
(+
) de
note
s a
decr
ease
in a
sset
s an
d an
incr
ease
in li
abili
ties.
Incl
udin
g F
inan
cial
Der
ivat
ives
. 1
1/ D
ata
sour
ce fo
r th
e m
onet
ary
aggr
egat
es, b
anks
' ass
ets
abro
ad a
nd th
e fo
rex
depo
sits
: Mon
etar
y S
urve
y F
ebru
ary
2013
).
12/ In
clud
ing
BN
B r
eser
ve a
sset
s, b
anks
ass
ets
abro
ad a
nd n
onfin
anci
al s
ecto
r de
posi
ts a
broa
d. 1
3/ In
clud
ing
mon
etar
y an
d no
n-m
onet
ary
gold
. Sou
rce:
Issu
e D
epar
tmen
t, B
NB
.
1
4/ S
ourc
e: B
IS In
tern
atio
nal B
anki
ng S
tatis
tics.
For
Q4
2012
and
201
3 th
e da
ta a
s of
Sep
tem
ber
2012
are
use
d. 1
5/ D
iffer
ence
bet
wee
n th
e am
ount
of t
he G
ross
ext
erna
l deb
t and
the
amou
nt o
f the
Gro
ss e
xter
nal a
sset
s. 1
5/ T
he In
tern
atio
nal I
nves
tmen
t Pos
ition
dat
a ar
e pu
blis
hed
quar
terly
with
in 3
mon
ths
afte
r th
e cl
ose
of th
e re
port
ing
perio
d. 1
7/ T
he p
ropo
rtio
n (in
mon
ths)
of B
NB
Res
erve
Ass
ets
as o
f end
of r
epor
ting
mon
th to
ave
rage
Impo
rts
of G
oods
and
Non
-Fac
tor
Ser
vice
s fo
r th
e la
st 1
2 m
onth
s.
18/ F
orex
dep
osits
of p
opul
atio
n an
d no
n-fin
anci
al s
ecto
r.
19/ T
he in
dex
is fo
r th
e re
port
ing
mon
th.
20/ C
PI b
ased
inde
x ca
lcul
ated
for
the
repo
rtin
g m
onth
.
31

External Sector Indicators
Current Account
-30
-25
-20
-15
-10
-5
0
5
2006 2007 2008 2009 2010 2011 2012 I.-II.2012
I.-II.2013
(% of GDP)
Source: BNB.
Trade Balance
-30
-25
-20
-15
-10
-5
0
2006 2007 2008 2009 2010 2011 2012 I.-II.2012
I.-II.2013
(% of GDP)
Source: BNB and NSI.
Current and Capital Account
-12000
-10000
-8000
-6000
-4000
-2000
0
2000
4000
6000
2006 2007 2008 2009 2010 2011 2012 I.-II. 2012 I.-II. 2013
Trade Balance Services, net Income, netCurrent Transfers, net Capital Account Current and Capital Account
EUR million
32

Exports, Imports (change over previous period)
-40
-30
-20
-10
0
10
20
30
40
2006 2007 2008 2009 2010 2011 2012 I.-II.2012
I.-II.2013
Imports
Source: BNB and NSI.
(%)
Travel, Net
0
1
2
3
4
5
6
2006 2007 2008 2009 2010 2011 2012 I.-II.2012
I.-II.2013
(% of GDP)
Source: BNB and MoE.
Capital and Financial Account
-10
0
10
20
30
40
50
2006 2007 2008 2009 2010 2011 2012 I.-II.2012
I.-II.2013
(% of GDP)
Source: BNB.
Income, Net
-10
-8
-6
-4
-2
0
2
4
2006 2007 2008 2009 2010 2011 2012 I.-II.2012
I.-II.2013
(% of GDP)
Source: BNB.
Current Transfers, Net
0
1
2
3
4
5
6
2006 2007 2008 2009 2010 2011 2012 I.-II.2012
I.-II.2013
(% of GDP)
Source: banks and MoF.
Services, Net
-1
0
1
2
3
4
5
6
7
2006 2007 2008 2009 2010 2011 2012 I.-II.2012
I.-II.2013
(% of GDP)
Source: BNB and MoE.
33

Direct Investment in Bulgaria
0
5
10
15
20
25
30
35
2006 2007 2008 2009 2010 2011 2012 I.-II.2012
I.-II.2013
(% of GDP)
Source: BNB.
Portfolio Investment - Assets
-4
-3
-2
-1
0
1
2006 2007 2008 2009 2010 2011 2012 I.-II.2012
I.-II.2013
(% of GDP)
Source: BNB.
Direct Investment in Bulgaria / Current Account Deficit
0
50
100
150
200
250
300
350
2006 2007 2008 2009 2010 2011 2012 I.-II.2012
I.-II.2013
Source: BNB.
(%)
Portfolio Investment - Liabilities
-2
-1
0
1
2
3
2006 2007 2008 2009 2010 2011 2012 I.-II.2012
I.-II.2013
(% of GDP)
Source: BNB.
Other Investment - Assets
-11-9-8-6-5-3-20235
2006 2007 2008 2009 2010 2011 2012 I.-II.2012
I.-II.2013
(% of GDP)
Source: BNB.
Other Investment - Liabilities
-6
-3
0
3
6
9
12
15
18
2006 2007 2008 2009 2010 2011 2012 I.-II.2012
I.-II.2013
(% of GDP)
Source: BNB.
34

BNB Reserve Assets/GNFS Imports
0.0
1.0
2.0
3.0
4.0
5.0
6.0
7.0
8.0
9.0
2006 2007 2008 2009 2010 2011 II.2012
II.2013
(months)
Source: BNB.
BNB Reserve Assets / FX Deposits of Population and Non-Financial Sector
0
50
100
150
200
250
300
350
2006 2007 2008 2009 2010 2011 II.2012
II.2013
Source: BNB.
(%)
Nominal Effective Exchange Rate
100
110
120
130
140
2006 2007 2008 2009 2010 2011 II. 2013
Ind
ex,
Ju
ne
19
97
=1
00
Source: BNB.
BNB Reserve Assets
3000
6000
9000
12000
15000
18000
2006 2007 2008 2009 2010 2011 II. 2013
(EUR million)
Source: BNB.
Gross External Assets
4000
8000
12000
16000
20000
24000
2006 2007 2008 2009 2010 2011 II. 2013
(EUR million)
Source: BNB.
Real Effective Exchange Rate
100
120
140
160
180
2006 2007 2008 2009 2010 2011 II. 2013
Ind
ex,
Ju
ne
19
97
=1
00
Source: BNB.
35

36

EXTERNAL TRADE
37

38

EXTERNAL TRADE OF BULGARIA1
January 2013
Exports
In January 2013 the exports (FOB) amounted to EUR 1,778.2 million compared to EUR
1,436.8 million for the same period of 2012, which is an increase of EUR 341.4 million (23.8%).
End Use
The main contribution to the exports increase in January 2013 yoy was due to the
groups Petroleum Products (an increase of EUR 157.7 million, 124.3%), Non-Ferrous Metals
(by EUR 35 million, 18.7%), and Spare parts and equipment (by EUR 21.6 million, 38.1%).
Exports of groups Raw materials for the food industry decreased yoy by EUR 16.8 million
(12.7%), and of Iron and steel – by EUR 10.5 million (16.8%).
Main Trade Partners and Regions
European Union
Exports to the European Union increased yoy by EUR 148.2 million (16.8%), and
their share in the total exports decreased from 61.4% in January 2012 to 57.9% for the same
period of 2013.
The relative share of exports to the EU-152 member countries amounted to 46.7% in
January 2013 compared to 48.4% for the same period of 2012.
The highest increase of exports yoy was that to Germany – an increase of EUR 60.8
million (32.4%), to Greece – an increase of EUR 50.5 million (58%), and to Italy – by EUR 24.3
million (16.4%). Exports to Belgium decreased yoy by EUR 23.5 million (42.3%), and to
Romania – by EUR 13.4 million (12.6%).
Non-European Union Countries
Exports to non-EU countries increased yoy by EUR 193.2 million (34.8%), and their
share in the total exports increased from 38.6% in January 2012 to 42.1% for the same period
of 2013.
The main contribution to the exports increase was due to exports to Gibraltar (an
increase of EUR 54.2 million, 144.2%), to Turkey (by EUR 48.9 million, 40.8%), to Lebanon (by
EUR 26.5 million, over 40 times), and to Ukraine (by EUR 25.2 million, over 2 times). Exports to
United Arab Emirates decreased yoy by EUR 21.4 million (45.6%).
1 The part External Trade of Bulgaria of the issue Balance of Payments of Bulgaria covers a reporting period shorter by one
month than that of the balance of payments. According to Regulation (EC) No 638/2004 of the European Parliament and the Council NSI provides the EUROSTAT with detailed data on dispatches and arrivals of goods within the EU (INTRASTAT) within 70 days after the close of the reporting month (see methodological notes).
39

Countries with Highest Shares in Total Exports
The highest share in total exports was held by the exports to Germany (14% of total
exports, EUR 248.6 million), to Italy (9.7%, EUR 172.6 million), to Turkey (9.5%, EUR 168.9
million), and to Greece (7.7%, EUR 137.5 million).
Impact of Physical Volumes and Prices on Exports and Imports of Selected Groups of Goods1
(EUR million)
Change against January 2012
due to the factor:
Total
quantity price Exports Petroleum Products 157.7 158.1 -0.4 Non-Ferrous metals 35.0 51.8 -16.8
Imports Cruide Oil and Natural gas 97.8 112.3 -14.5 Non-Ferrous Ores -48.8 -38.3 -10.5
1 By End-Use. A minus sign denotes a decrease in exports receipts/imports payments.
Imports (CIF)
The imports (CIF) in January 2013 amounted to EUR 1,906.8 million compared to EUR
1,789.1 million for the same period of 2012, which is an increase of EUR 117.7 million (6.6%).
End Use
The main contribution to the imports (CIF) increase in the period January 2013 yoy was
due to the groups Crude Oil and Natural Gas (an increase of EUR 97.8 million, 35.5%),
Machines and equipment (by EUR 33.9 million, 34.9%), Oils (by EUR 21 million, 25.9%),
Medicines and cosmetics (by EUR 19.9 million, 28.9%), and Food, drinks and tobacco (by EUR
19.8 million, 20.9%). Imports of Spare parts and equipment decreased by EUR 84.8 million
(53.8%), and of Ores – by EUR 49.3 million (29.1%).
2 Includes the EU member countries prior to December 1, 2004.
40

Main Trade Partners and Regions3
European Union
The imports from the EU increased yoy by EUR 96.1 million (12.4%), and their
share in total imports increased from 43.4% in January 2012 to 45.8% for the same period of
2013.
The share of imports from the EU–154 increased from 31.4% in January 2012 to
33% for the same period of 2013.
The highest imports increase yoy was that from Italy (an increase of EUR 38.2
million, 40.7%), from Poland (by EUR 24.3 million, 73.6%), and from Germany (by EUR 16.4
million, 10.2%). Imports from Romania decreased yoy by EUR 5 million (5.3%).
Non-European Union Countries
Imports from the non-EU countries increased yoy by EUR 21.5 million (2.1%), and
their share in total imports decreased from 56.6% in January 2012 to 54.2% for the same period
of 2013.
The main contribution to the imports increase was due to imports from Russia (an
increase of EUR 113.7 million, 41.3%), and from Peru – by EUR 31.6 million (over 9 times).
Imports from China decreased by EUR 31.9 million (19.6%), and from Ukraine – by EUR 28.3
million (47.7%).
Countries with Highest Shares in Total Imports (CIF)
The highest share in total imports (CIF) was that of the imports from Russia (20.4%
of total imports, EUR 388.8 million), from Germany (9.3%, EUR 177.5 million), from Italy (6.9%,
EUR 132.1 million), and from China (6.9%, EUR 131.4 million).
3 By country of origin. 4 Includes the EU member countries prior to December 1, 2004.
41

Contribution to the Change of Total Exports and Total Imports (By End Use)
Contribution to the Change of Total Exports (compared to the corresponding period of the previous year) (p.p.)
January
Exports (by End Use)
Share ( % ) 2012
2012 2013
Consumer Goods 24.3 0.9 3.5
Raw Materials 47.7 -3.0 5.3
Investment Goods 16.2 -1.3 3.9
Mineral fuels, oils and electricity 11.8 -4.6 11.0
TOTAL EXPORTS, FOB 100.0 -8.0 23.8 Source: BNB, NSI.
Exports By End Use
January 2012 – January 2013
2012
Investment Goods16.2%
Mineral Fuels, Oils, Electricity
11.8%
Consumer Goods 24.3%
Raw Materials
47.7%
2013
Investment Goods
16.2%
Consum er Goods
22.5%
Mineral Fuels, Oils,
Electricity
18.4%
R aw
Materials 42.9 %
Source: BNB, NSI.
Contribution to the Change of Total Imports1 (compared to the corresponding period of the previous year) (p.p.)
January
Imports (by End Use)
Share ( % ) 2012
2012 2013
Consumer Goods 16.2 -1.0 3.1
Raw Materials 38.9 1.1 -1.5
Investment Goods 22.9 6.1 -1.4
Mineral fuels, oils and electricity 21.8 -1.8 6.2
TOTAL IMPORTS, CIF 100.0 4.4 6.6 1 The differences between the item Total and the listed sub-items are due to the non-classified (by the Customs Agency)
imports by goods type. Source: BNB, NSI.
Imports By End Use
January 2012 – January 2013
2012Raw M ateria ls
38.9%
Inv estment
Goods
22.9%
Mineral Fuels, Oi ls, Electricity
21.8%
Consumer
Goods
16.2%
2013
Consumer
Goods 18.1%
Raw
Materials 35.1%
Investment Goods
20.2%
Mineral
Fuels, OilsElectricity
26.3%
42

Contribution to the Change of Total Exports (By Regions)
Contribution to the Change of Total Exports
(compared to the corresponding period of the previous year) (p.p.)
January
Exports (by Regions)
Share ( % ) 2012
2012 2013 European Union (27) 61.4 -2.1 10.3 European Union (15) 48.4 -1.5 9.4 Italy 10.3 -0.2 1.7 Greece 6.1 -1.8 3.5 Germany 13.1 1.1 4.2 EU – New Member States 13.0 -0.6 0.9 Romania 7.4 -0.5 -0.9 Poland 1.6 -0.1 0.3 Hungary 1.3 -0.2 0.2 Europe 6.7 -1.8 6.6 Russia 2.0 -0.5 0.6 Balkan Countries 13.3 -4.9 3.4 Turkey 8.3 -3.5 3.4 Serbia 2.1 -0.6 0.2 America 2.2 0.4 1.0 USA 1.1 -0.2 1.2 Asia 12.1 2.1 1.9 Others 4.4 -1.7 0.7 TOTAL EXPORTS, FOB 100.0 -8.0 23.8
Source: BNB, NSI.
Exports Geographical Breakdown
January 2012 – January 2013
2012
Balkan Countries
13.3%
Europe6.7%
European Union (27)
61.4%
America2.2%
Asia12.1%
Others4.4%
2013
Balkan Countries
13.5%
Others4.1%
Europe10.7%
European Union (27)
57.9%
Asia11.2%
America2.5%
Source: BNB, NSI.
43

Contribution to the Change of Total Imports (By Regions)
Contribution to the Change of Total Imports
(compared to the corresponding period of the previous year) (p.p.)
January
Imports (by Regions)
Share ( % ) 2012
2012 2013 European Union (27) 43.4 -0.6 5.4 European Union (15) 31.4 0.1 3.8 Germany 9.0 1.0 0.9 Italy 5.2 -0.3 2.1 Greece 4.4 -0.7 0.5 EU – New Member States 12.1 -0.7 1.6 Romania 5.3 -0.5 -0.3 Czech Republic 1.6 0.1 0.2 Poland 1.8 0.0 1.4 Hungary 1.6 -0.4 0.5 Europe 21.3 -3.5 3.8 Russia 15.4 -4.5 6.4 Ukraine 3.3 -0.2 -1.6 Balkan Countries 6.5 0.6 1.1 Turkey 4.3 0.6 0.5 Serbia 1.0 0.0 0.1 Macedonia 0.9 -0.1 0.5 America 10.3 1.9 -5.5 USA 1.6 0.4 0.3 Asia 17.4 5.7 -0.6 China 9.1 3.5 -1.8 Others 1.1 0.2 2.3 TOTAL IMPORTS, CIF 100.0 4.4 6.6
Source: BNB, NSI.
Imports Geographical Breakdown
January 2012 – January 2013
2012
Europe21.3%
Balkan Countries
6.5%
Asia17.4%
Others1.1%
America10.3%
European Union (27)
43.4%
2013
Others3.2%
Balkan Countries
7.2%
Europe23.5%
America4.6%
Asia15.8%
European Union (27)
45.8%
Source: BNB, NSI.
44

TABLES
45

46

EX
PO
RT
SE
nd
-Use
2012
- 2
013
Tab
.1
mil
l. E
UR
Cha
nge
2012
2013
Cha
nge
2011
2012
mil
l. E
UR
%m
ill.
EU
Rsh
are
mil
l. E
UR
shar
em
ill.
EU
R%
Con
sum
er g
oods
45
05.9
4817
.431
1.5
6.9%
348.
824
.3%
399.
622
.5%
50.9
14.6
%F
ood
902.
798
5.3
82.5
9.1%
66.3
4.6%
76.1
4.3%
9.8
14.8
%T
obac
co15
3.2
216.
162
.941
.1%
14.5
1.0%
18.2
1.0%
3.7
25.7
%B
ever
ages
89.9
100.
410
.511
.6%
6.1
0.4%
7.0
0.4%
1.0
16.0
%C
loth
ing
and
foot
wea
r15
25.4
1456
.2-6
9.2
-4.5
%12
8.0
8.9%
132.
57.
5%4.
53.
5%M
edic
ines
and
cos
met
ics
635.
670
0.3
64.7
10.2
%39
.82.
8%57
.03.
2%17
.243
.3%
Fur
nitu
re a
nd h
ouse
hold
app
lian
ces
655.
074
8.1
93.1
14.2
%48
.73.
4%55
.23.
1%6.
513
.3%
Oth
ers
544.
161
1.0
67.0
12.3
%45
.43.
2%53
.63.
0%8.
218
.1%
Raw
mat
eria
ls
9403
.189
62.5
-440
.6-4
.7%
685.
847
.7%
762.
142
.9%
76.3
11.1
%Ir
on a
nd s
teel
900.
371
8.8
-181
.5-2
0.2%
62.4
4.3%
51.9
2.9%
-10.
5-1
6.8%
Non
-fer
rous
met
als
2485
.622
89.1
-196
.5-7
.9%
187.
213
.0%
222.
112
.5%
35.0
18.7
%C
hem
ical
s 32
5.4
345.
420
.16.
2%25
.71.
8%23
.91.
3%-1
.8-7
.0%
Pla
stic
s an
d ru
bber
505.
455
0.9
45.5
9.0%
40.5
2.8%
49.5
2.8%
9.0
22.2
%F
erti
lize
rs20
0.1
202.
82.
71.
4%15
.91.
1%24
.61.
4%8.
855
.1%
Tex
tile
s39
7.0
371.
9-2
5.0
-6.3
%26
.51.
8%31
.21.
8%4.
717
.7%
Raw
mat
eria
ls f
or th
e fo
od in
dust
ry18
35.3
1732
.2-1
03.0
-5.6
%13
2.5
9.2%
115.
76.
5%-1
6.8
-12.
7%W
ood
prod
ucts
, pap
er a
nd p
aper
boar
d38
7.2
403.
115
.84.
1%21
.11.
5%32
.41.
8%11
.353
.7%
Cem
ent
13.6
27.7
14.0
103.
0%0.
30.
0%0.
90.
0%0.
623
1.5%
Raw
toba
cco
164.
713
2.2
-32.
5-1
9.7%
8.5
0.6%
25.7
1.4%
17.2
201.
3%O
ther
s21
88.6
2188
.3-0
.30.
0%16
5.3
11.5
%18
4.0
10.4
%18
.811
.4%
Inve
stm
ent g
oods
3532
.535
23.5
-9.0
-0.3
%23
2.5
16.2
%28
8.4
16.2
%55
.924
.0%
Mac
hine
s an
d eq
uipm
ent
951.
910
03.6
51.7
5.4%
66.1
4.6%
74.4
4.2%
8.2
12.5
%E
lect
rica
l mac
hine
s55
1.3
453.
5-9
7.8
-17.
7%32
.62.
3%45
.42.
6%12
.839
.1%
Veh
icle
s39
1.3
400.
79.
42.
4%18
.91.
3%26
.61.
5%7.
740
.7%
Spa
re p
arts
and
equ
ipm
ent
765.
585
9.6
94.1
12.3
%56
.73.
9%78
.24.
4%21
.638
.1%
Oth
ers
872.
480
6.1
-66.
3-7
.6%
58.2
4.0%
63.7
3.6%
5.6
9.6%
Tot
al n
on e
ner
gy c
omm
odit
ies
1744
1.5
1730
3.4
-138
.2-0
.8%
1267
.188
.2%
1450
.181
.5%
183.
014
.4%
Min
eral
fu
els,
oil
s an
d e
lect
rici
ty28
14.9
3481
.466
6.4
23.7
%16
9.1
11.8
%32
7.0
18.4
%15
7.9
93.4
%P
etro
leum
pro
duct
s22
25.6
2922
.369
6.7
31.3
%12
6.9
8.8%
284.
616
.0%
157.
712
4.3%
Oth
ers
589.
355
9.0
-30.
3-5
.1%
42.2
2.9%
42.4
2.4%
0.2
0.5%
inc
l. E
lect
rici
ty44
5.7
390.
1-5
5.7
-12.
5%29
.12.
0%35
.02.
0%6.
020
.6%
Oth
er E
xpor
ts 1/
7.9
8.3
0.5
0.0%
0.6
0.0%
1.1
0.1%
0.5
0.0%
TO
TA
L E
XP
OR
TS
/FO
B/
2026
4.3
2079
3.1
528.
72.
6%14
36.8
100.
0%17
78.2
100.
0%34
1.4
23.8
%
1/ I
nclu
des
info
rmat
ion
on e
xpor
ts o
f go
ods
not e
lsew
here
cla
ssif
ied.
Sou
rces
: F
or 2
012
prel
imin
ary
data
, pro
vide
d by
the
NS
I, in
clud
ing
Inrt
asta
t sys
tem
dat
a an
d cu
stom
s de
clar
atio
ns d
ata
as o
f 27
-Feb
ruar
y-13
. F
or 2
013
prel
imin
ary
data
, pro
vide
d by
the
NS
I, in
clud
ing
Inrt
asta
t sys
tem
dat
a as
of
01-A
pril
-13
and
cust
oms
decl
arat
ions
dat
a as
of
01-M
arch
-13.
Janu
ary
Com
mod
ity
grou
psJa
nuar
y -
Dec
embe
r
47

EX
PO
RT
S20
12 -
201
3T
ab.2
mil
l. E
UR
Cha
nge
2012
2013
Cha
nge
2011
2012
mil
l. E
UR
%m
ill.
EU
Rsh
are
mil
l. E
UR
shar
em
ill.
EU
R%
Min
eral
pro
duct
s and
fuel
s, in
clud
ing:
3088
.741
34.7
1046
.033
.9%
199.
713
.9%
388.
721
.9%
189.
094
.7%
Div
isio
n 27
. Min
eral
Fue
ls, o
ils
& p
rodu
cts
of th
eir
dist
illa
tion
; etc
.27
10.8
3364
.165
3.4
24.1
%15
7.4
11.0
%32
1.5
18.1
%16
4.1
104.
3%D
ivis
ion
26. O
res,
Sla
g an
d as
h20
6.7
575.
436
8.7
178.
4%26
.91.
9%57
.23.
2%30
.311
2.4%
Bas
e m
etal
s and
thei
r pro
duct
s, in
clud
ing:
4222
.938
34.4
-388
.5-9
.2%
307.
721
.4%
342.
419
.3%
34.7
11.3
%D
ivis
ion
74. C
oppe
r an
d ar
ticl
es th
ereo
f 23
06.6
2170
.6-1
36.0
-5.9
%17
8.3
12.4
%20
4.1
11.5
%25
.814
.4%
Div
isio
n 72
. Iro
n an
d st
eel
900.
371
8.8
-181
.5-2
0.2%
62.4
4.3%
51.9
2.9%
-10.
5-1
6.8%
Div
isio
n 73
. Art
icle
s of
iron
and
ste
el38
0.8
353.
9-2
6.8
-7.0
%23
.61.
6%28
.81.
6%5.
322
.3%
Div
isio
n 76
. Alu
min
ium
and
art
icle
s th
ereo
f 26
0.3
246.
0-1
4.2
-5.5
%18
.41.
3%22
.61.
3%4.
122
.4%
Div
isio
n 78
. Lea
d an
d ar
ticl
es th
ereo
f 12
7.8
108.
6-1
9.2
-15.
0%9.
20.
6%18
.11.
0%9.
098
.0%
Mac
hine
s, tr
ansp
ort f
acili
ties,
appl
ianc
es a
nd to
ols,
incl
udin
g:39
04.5
3891
.8-1
2.6
-0.3
%26
0.7
18.1
%31
3.2
17.6
%52
.520
.1%
Div
isio
n 85
. Ele
ctri
cal m
achi
nes,
equ
ipm
ent p
arts
ther
eof;
sou
nd r
ecor
ders
etc
.15
05.5
1442
.4-6
3.1
-4.2
%10
1.9
7.1%
132.
47.
4%30
.530
.0%
Div
isio
n 84
. Nuc
lear
rea
ctor
s, b
oile
rs, m
achi
nery
& m
echa
nica
l app
lian
ce ,p
arts
1368
.214
39.6
71.4
5.2%
96.5
6.7%
108.
26.
1%11
.712
.1%
Div
isio
n 87
. Veh
icle
s ot
her
than
rai
lway
tram
way
rol
ling
-sto
ck, p
arts
& a
cces
sori
es45
0.7
434.
3-1
6.4
-3.6
%26
.71.
9%40
.02.
2%13
.349
.7%
Ani
mal
and
veg
etab
le p
rodu
cts,
food
, dri
nks a
nd to
bacc
o pr
oduc
ts, i
nclu
ding
:33
04.9
3307
.22.
30.
1%23
6.8
16.5
%25
8.2
14.5
%21
.49.
0%D
ivis
ion
10. C
erea
ls
698.
282
6.5
128.
218
.4%
39.7
2.8%
49.7
2.8%
10.0
25.2
%
Div
isio
n 12
. Oil
see
d ol
eagi
nous
fru
its;
mis
cell
aneo
us g
rain
, see
d, f
ruit
etc
.76
8.8
567.
1-2
01.8
-26.
2%63
.24.
4%44
.42.
5%-1
8.8
-29.
7%
Div
isio
n 24
. Tob
acco
and
man
ufac
ture
d to
bacc
o su
bsti
tute
s31
8.0
348.
430
.49.
6%23
.01.
6%43
.92.
5%20
.990
.8%
Text
ile a
nd le
athe
r mat
eria
ls, c
loth
ing,
foot
wea
r and
oth
er c
onsu
mer
goo
ds, i
nclu
ding
:29
13.2
2622
.1-2
91.1
-10.
0%23
2.1
16.2
%22
8.5
12.8
%-3
.6-1
.5%
Div
isio
n 62
. Art
icle
s of
app
arel
& c
loth
ing
acce
ssor
ies
not k
nitt
ed/c
roch
eted
778.
573
9.4
-39.
0-5
.0%
67.6
4.7%
69.5
3.9%
2.0
2.9%
Div
isio
n 61
. Art
icle
s of
app
arel
& c
loth
ing
acce
ssor
ies,
kni
tted
or
croc
hete
d56
8.4
554.
4-1
4.0
-2.5
%46
.03.
2%49
.92.
8%3.
98.
4%D
ivis
ion
94. F
urni
ture
; bed
ding
, m
atte
rs, m
attr
es s
uppo
rt, c
ushi
on e
tc.
285.
936
5.0
79.0
27.6
%24
.41.
7%31
.51.
8%7.
129
.3%
Che
mic
al p
rodu
cts,
plas
tics a
nd ru
bber
, inc
ludi
ng:
1942
.620
50.0
107.
45.
5%14
1.2
9.8%
175.
59.
9%34
.324
.3%
Div
isio
n 30
. Pha
rmac
euti
cal p
rodu
cts
535.
757
9.1
43.4
8.1%
32.4
2.3%
49.0
2.8%
16.7
51.6
%D
ivis
ion
39. P
last
ics
and
arti
cles
ther
eof
416.
546
7.1
50.7
12.2
%34
.02.
4%43
.02.
4%9.
026
.4%
Div
isio
n 31
. Fer
tili
zers
200.
120
2.8
2.7
1.4%
15.9
1.1%
24.6
1.4%
8.8
55.1
%
Woo
d, p
aper
, ear
then
war
e an
d gl
ass p
rodu
cts,
incl
udin
g88
7.6
952.
865
.37.
4%58
.74.
1%71
.84.
0%13
.122
.3%
Div
isio
n 44
. Woo
d an
d ar
ticl
es o
f w
ood;
woo
d ch
arco
al25
1.7
274.
823
.19.
2%15
.71.
1%20
.61.
2%4.
830
.8%
Div
isio
n 70
. Gla
ss a
nd g
lass
war
e 24
9.6
255.
86.
22.
5%19
.21.
3%19
.91.
1%0.
73.
5%
TO
TA
L E
XP
OR
TS
/FO
B/
2026
4.3
2079
3.1
528.
72.
6%14
36.8
100.
0%17
78.2
100.
0%34
1.4
23.8
%
* C
omm
odit
y gr
oups
incl
udes
div
isio
ns o
f th
e H
arm
oniz
ed S
yste
m o
f C
omm
odit
y D
escr
ipti
on a
nd C
odin
g an
d de
tail
ed d
ata
for
all d
ivis
ions
cou
ld b
e fo
und
thro
ugh
the
NS
I w
eb-s
ite.
Sou
rces
: F
or 2
012
prel
imin
ary
data
, pro
vide
d by
the
NS
I, in
clud
ing
Inrt
asta
t sys
tem
dat
a an
d cu
stom
s de
clar
atio
ns d
ata
as o
f 27
-Feb
ruar
y-13
. F
or 2
013
prel
imin
ary
data
, pro
vide
d by
the
NS
I, in
clud
ing
Inrt
asta
t sys
tem
dat
a as
of
01-A
pril
-13
and
cust
oms
decl
arat
ions
dat
a as
of
01-M
arch
-13.
CO
MM
OD
ITY
GR
OU
PS
*Ja
nuar
y -
Dec
embe
rJa
nuar
y
48

EX
PO
RT
SM
ain
tra
de
par
tner
s an
d r
egio
ns
2012
- 2
013
Tab
.3
mil
l. E
UR
Cha
nge
2012
2013
Cha
nge
2011
2012
mil
l. E
UR
%m
ill.
EU
Rsh
are
mil
l. E
UR
shar
em
ill.
EU
R%
EU
cou
ntri
es -
27 i
ncl.
:12
570.
112
153.
0-4
17.1
-3.3
%88
1.8
61.4
%10
30.0
57.9
%14
8.2
16.8
%E
U c
ount
ries
- 1
5 in
cl. :
1/94
49.1
9143
.0-3
06.2
-3.2
%69
5.0
48.4
%82
9.6
46.7
%13
4.6
19.4
%G
erm
any
2355
.221
26.6
-228
.5-9
.7%
187.
813
.1%
248.
614
.0%
60.8
32.4
%It
aly
1760
.817
63.8
3.0
0.2%
148.
310
.3%
172.
69.
7%24
.316
.4%
Gre
ece
1423
.614
93.9
70.3
4.9%
87.0
6.1%
137.
57.
7%50
.558
.0%
Fra
nce
855.
282
5.0
-30.
3-3
.5%
68.9
4.8%
77.7
4.4%
8.8
12.8
%N
ethe
rlan
ds35
9.7
379.
119
.45.
4%30
.72.
1%43
.12.
4%12
.440
.4%
G. B
rita
in37
0.4
398.
027
.67.
5%30
.22.
1%35
.62.
0%5.
418
.0%
Bel
gium
999.
376
5.1
-234
.2-2
3.4%
55.5
3.9%
32.0
1.8%
-23.
5-4
2.3%
Aus
tria
38
8.2
380.
2-8
.0-2
.1%
28.0
1.9%
28.8
1.6%
0.9
3.2%
Spa
in54
3.6
540.
2-3
.4-0
.6%
28.6
2.0%
20.2
1.1%
-8.4
-29.
5%
EU
- n
ew m
embe
r st
ates
incl
. : 2/
3121
.030
10.1
-110
.9-3
.6%
186.
813
.0%
200.
311
.3%
13.6
7.3%
Rom
ania
1933
.316
70.8
-262
.4-1
3.6%
106.
07.
4%92
.65.
2%-1
3.4
-12.
6%P
olan
d36
0.3
363.
22.
90.
8%23
.71.
6%27
.41.
5%3.
715
.7%
Cze
ch R
epub
lic
217.
725
4.2
36.5
16.7
%15
.51.
1%24
.61.
4%9.
158
.5%
Hun
gary
255.
324
0.0
-15.
3-6
.0%
18.4
1.3%
21.0
1.2%
2.6
14.1
%
Non
EU
cou
ntri
es :
7694
.286
40.0
945.
812
.3%
555.
038
.6%
748.
242
.1%
193.
234
.8%
Eur
ope
incl
. : 3/
1702
.618
28.9
126.
37.
4%95
.66.
7%18
9.9
10.7
%94
.398
.7%
Gib
ralt
ar62
4.7
732.
210
7.5
17.2
%37
.62.
6%91
.85.
2%54
.214
4.2%
Rus
sia
542.
156
2.2
20.1
3.7%
29.0
2.0%
37.4
2.1%
8.4
28.8
%U
krai
ne28
8.9
245.
6-4
3.3
-15.
0%11
.30.
8%36
.52.
1%25
.222
4.1%
Bal
kan
coun
trie
s inc
l.: 4/
2909
.330
07.6
98.3
3.4%
191.
013
.3%
239.
313
.5%
48.3
25.3
%T
urke
y17
33.1
1955
.522
2.4
12.8
%11
9.9
8.3%
168.
99.
5%48
.940
.8%
Ser
bia
526.
048
1.3
-44.
8-8
.5%
30.8
2.1%
33.0
1.9%
2.2
7.1%
Mac
edon
ia
461.
339
2.7
-68.
6-1
4.9%
30.4
2.1%
27.6
1.6%
-2.8
-9.1
%
Am
eric
as i
ncl.
:46
9.7
578.
810
9.1
23.2
%31
.22.
2%45
.22.
5%14
.044
.7%
US
A26
5.0
371.
310
6.3
40.1
%15
.41.
1%32
.01.
8%16
.610
7.8%
Asi
a in
cl. :
1556
.421
40.6
584.
337
.5%
173.
312
.1%
200.
011
.2%
26.7
15.4
%C
hina
293.
759
5.0
301.
310
2.6%
40.6
2.8%
51.8
2.9%
11.2
27.5
%L
eban
on32
.770
.237
.411
4.3%
0.7
0.0%
27.1
1.5%
26.5
4006
.4%
Uni
ted
Ara
b E
mir
ates
57.0
157.
210
0.2
175.
7%47
.03.
3%25
.61.
4%-2
1.4
-45.
6%
Oth
er c
ount
ries
1056
.210
84.1
27.9
2.6%
63.9
4.4%
73.8
4.1%
9.9
15.5
%
TO
TA
L E
XP
OR
TS
/FO
B/
2026
4.3
2079
3.1
528.
72.
6%14
36.8
100.
0%17
78.2
100.
0%34
1.4
23.8
%
1/ I
nclu
des
the
EU
mem
ber
coun
trie
s pr
ior
to M
ay 1
, 200
4.2/
Fol
low
ing
Eur
osta
t cla
ssif
icat
ion.
Inc
lude
s th
e ne
w E
U m
embe
r co
untr
ies
acce
pted
aft
er M
ay 1
, 200
4 an
d Ja
nuar
y 1,
200
7.3/
Inc
lude
s R
ussi
a, U
krai
ne, S
wit
zerl
and,
Gib
ralt
ar (
GB
), M
oldo
va, B
elar
us, N
orw
ay, L
icht
enst
ein,
San
Mar
ino,
Ice
land
and
Mon
aco.
4/ I
nclu
des
Tur
key,
Ser
bia,
Mon
tene
gro,
Mac
edon
ia, A
lban
ia, C
roat
ia a
nd B
osni
a an
d H
erze
govi
na.
Sou
rces
: F
or 2
012
prel
imin
ary
data
, pro
vide
d by
the
NS
I, in
clud
ing
Inrt
asta
t sys
tem
dat
a an
d cu
stom
s de
clar
atio
ns d
ata
as o
f 27
-Feb
ruar
y-13
. F
or 2
013
prel
imin
ary
data
, pro
vide
d by
the
NS
I, in
clud
ing
Inrt
asta
t sys
tem
dat
a as
of
01-A
pril
-13
and
cust
oms
decl
arat
ions
dat
a as
of
01-M
arch
-13.
Janu
ary
CO
UN
TR
IES
Janu
ary
- D
ecem
ber
49

IMP
OR
TS
En
d-U
se20
12 -
201
3
Tab
.4
mil
l. E
UR
Cha
nge
2012
2013
Cha
nge
2011
2012
mil
l. E
UR
%m
ill.
EU
Rsh
are
mil
l. E
UR
shar
em
ill.
EU
R%
Con
sum
er g
oods
42
29.6
4400
.217
0.6
4.0%
290.
216
.2%
345.
618
.1%
55.4
19.1
%F
ood,
dri
nks
and
toba
cco
1381
.715
04.0
122.
38.
9%95
.05.
3%11
4.9
6.0%
19.8
20.9
%F
urni
ture
and
hou
seho
ld a
ppli
ance
s64
0.2
640.
40.
30.
0%36
.02.
0%42
.02.
2%6.
016
.7%
Med
icin
es a
nd c
osm
etic
s91
1.9
939.
727
.83.
0%68
.73.
8%88
.54.
6%19
.928
.9%
Clo
thin
g an
d fo
otw
ear
464.
748
0.6
15.8
3.4%
33.7
1.9%
34.9
1.8%
1.2
3.6%
Aut
omob
iles
237.
323
5.2
-2.1
-0.9
%15
.30.
9%19
.61.
0%4.
428
.6%
Oth
ers
593.
860
0.2
6.4
1.1%
41.6
2.3%
45.7
2.4%
4.1
9.8%
Raw
mat
eria
ls
8774
.487
75.8
1.3
0.0%
695.
338
.9%
669.
235
.1%
-26.
2-3
.8%
Ore
s14
89.1
1390
.0-9
9.1
-6.7
%16
9.3
9.5%
120.
06.
3%-4
9.3
-29.
1%Ir
on a
nd s
teel
960.
782
2.9
-137
.8-1
4.3%
69.4
3.9%
53.3
2.8%
-16.
1-2
3.2%
Non
-fer
rous
met
als
688.
671
7.9
29.3
4.3%
48.5
2.7%
52.0
2.7%
3.6
7.4%
Tex
tile
s10
90.1
1061
.7-2
8.4
-2.6
%73
.84.
1%81
.94.
3%8.
110
.9%
Woo
d pr
oduc
ts, p
aper
and
pap
erbo
ard
422.
644
7.1
24.5
5.8%
30.3
1.7%
31.0
1.6%
0.7
2.4%
Che
mic
als
463.
151
9.4
56.2
12.1
%39
.42.
2%46
.72.
4%7.
318
.6%
Pla
stic
s an
d ru
bber
1120
.112
02.4
82.3
7.4%
79.7
4.5%
94.6
5.0%
14.9
18.7
%R
aw m
ater
ials
for
the
food
indu
stry
573.
156
2.7
-10.
4-1
.8%
46.8
2.6%
49.3
2.6%
2.5
5.3%
Raw
ski
ns96
.510
5.4
8.9
9.2%
5.5
0.3%
5.6
0.3%
0.1
1.3%
Raw
toba
cco
102.
511
8.0
15.5
15.1
%7.
10.
4%6.
30.
3%-0
.8-1
1.6%
Oth
ers
1767
.918
28.3
60.4
3.4%
125.
57.
0%12
8.4
6.7%
2.9
2.3%
Inve
stm
ent g
oods
4980
.058
34.9
854.
917
.2%
409.
822
.9%
384.
820
.2%
-25.
1-6
.1%
Mac
hine
s an
d eq
uipm
ent
1569
.717
08.1
138.
48.
8%97
.15.
4%13
1.0
6.9%
33.9
34.9
%E
lect
rica
l mac
hine
s77
8.6
822.
744
.05.
7%60
.23.
4%66
.73.
5%6.
510
.8%
Veh
icle
s86
1.1
1037
.117
6.0
20.4
%48
.22.
7%56
.53.
0%8.
317
.2%
Spa
re p
arts
and
equ
ipm
ent
1075
.114
03.9
328.
830
.6%
157.
48.
8%72
.63.
8%-8
4.8
-53.
8%O
ther
s69
5.6
863.
216
7.6
24.1
%46
.92.
6%57
.93.
0%11
.023
.4%
Tot
al n
on e
ner
gy c
omm
odit
ies
1798
4.0
1901
0.8
1026
.85.
7%13
95.3
78.0
%13
99.5
73.4
%4.
20.
3%
Min
eral
fu
els,
oil
s an
d e
lect
rici
ty53
65.9
6420
.910
54.9
19.7
%39
0.1
21.8
%50
1.6
26.3
%11
1.5
28.6
%F
uels
4179
.051
80.2
1001
.224
.0%
308.
817
.3%
399.
320
.9%
90.5
29.3
% C
rude
oil
and
Nat
ural
gas
3830
.647
91.4
960.
725
.1%
275.
515
.4%
373.
319
.6%
97.8
35.5
% C
oal
304.
122
5.4
-78.
8-2
5.9%
26.3
1.5%
16.5
0.9%
-9.8
-37.
3% O
ther
s44
.216
3.5
119.
326
9.7%
7.0
0.4%
9.5
0.5%
2.5
35.8
%O
ther
s11
87.0
1240
.653
.74.
5%81
.34.
5%10
2.3
5.4%
21.0
25.9
% O
ils
1187
.012
40.6
53.7
4.5%
81.3
4.5%
102.
35.
4%21
.025
.9%
Oth
er I
mpo
rts
1/56
.252
.3-3
.9-6
.9%
3.7
0.2%
5.7
0.3%
1.9
52%
TO
TA
L I
MP
OR
TS
/CIF
/23
406.
225
484.
020
77.8
8.9%
1789
.110
0.0%
1906
.810
0.0%
117.
76.
6%
1/ I
nclu
des
info
rmat
ion
on im
port
s of
goo
ds in
Cha
pter
99
"Cus
tom
s al
levi
atio
ns"
of th
e C
usto
ms
Tar
iff
and
impo
rts
of g
oods
not
els
ewhe
re c
lass
ifie
d.S
ourc
es:
For
201
2 pr
elim
inar
y da
ta, p
rovi
ded
by th
e N
SI,
incl
udin
g In
rtas
tat s
yste
m d
ata
and
cust
oms
decl
arat
ions
dat
a as
of
27-F
ebru
ary-
13.
For
201
3 pr
elim
inar
y da
ta, p
rovi
ded
by th
e N
SI,
incl
udin
g In
rtas
tat s
yste
m d
ata
as o
f 01
-Apr
il-1
3 an
d cu
stom
s de
clar
atio
ns d
ata
as o
f 01
-Mar
ch-1
3.
Janu
ary
Com
mod
ity
grou
psJa
nuar
y -
Dec
embe
r
50

IMP
OR
TS
2012
- 2
013
Tab
.5
mil
l. E
UR
Cha
nge
2012
2013
Cha
nge
2011
2012
mil
l. E
UR
%m
ill.
EU
Rsh
are
mil
l. E
UR
shar
em
ill.
EU
R%
Min
eral
pro
duct
s and
fuel
s, in
clud
ing:
7010
.078
94.3
884.
312
.6%
571.
031
.9%
620.
832
.6%
49.9
8.7%
Div
isio
n 27
. Min
eral
Fue
ls, o
ils
& p
rodu
cts
of th
eir
dist
illa
tion
; etc
.53
79.4
6341
.196
1.8
17.9
%38
8.2
21.7
%49
5.2
26.0
%10
7.0
27.6
%D
ivis
ion
26. O
res,
Sla
g an
d as
h14
89.1
1390
.0-9
9.1
-6.7
%16
9.3
9.5%
120.
06.
3%-4
9.3
-29.
1%
Mac
hine
s, tr
ansp
ort f
acili
ties,
appl
ianc
es a
nd to
ols,
incl
udin
g:57
70.4
6563
.979
3.5
13.8
%46
2.1
25.8
%43
8.3
23.0
%-2
3.9
-5.2
%D
ivis
ion
85. E
lect
rica
l mac
hine
s, e
quip
men
t par
ts th
ereo
f; s
ound
rec
orde
rs e
tc.
2129
.624
71.1
341.
516
.0%
236.
413
.2%
155.
98.
2%-8
0.6
-34.
1%D
ivis
ion
84. N
ucle
ar r
eact
ors,
boi
lers
, mac
hine
ry &
mec
hani
cal a
ppli
ance
,par
ts18
79.4
2030
.615
1.2
8.0%
115.
36.
4%15
0.8
7.9%
35.5
30.8
%D
ivis
ion
87. V
ehic
les
othe
r th
an r
ailw
ay tr
amw
ay r
olli
ng-s
tock
, par
ts &
acc
esso
ries
1136
.312
06.1
69.8
6.1%
80.4
4.5%
93.0
4.9%
12.5
15.6
%D
ivis
ion
90. O
ptic
al, p
hoto
grap
hic,
cin
emat
ogra
phic
, mea
suri
ng c
heck
ing,
pre
cisi
on, a
ppar
atus
etc
.25
7.9
303.
745
.817
.8%
19.5
1.1%
23.2
1.2%
3.7
19.1
%
Che
mic
al p
rodu
cts,
plas
tics a
nd ru
bber
, inc
ludi
ng:
3101
.534
13.4
311.
910
.1%
235.
313
.1%
287.
715
.1%
52.4
22.3
%D
ivis
ion
39. P
last
ics
and
arti
cles
ther
eof
914.
396
9.4
55.2
6.0%
63.5
3.6%
75.6
4.0%
12.1
19.0
%D
ivis
ion
30. P
harm
aceu
tica
l pro
duct
s80
0.6
823.
923
.32.
9%61
.53.
4%73
.83.
9%12
.420
.1%
Div
isio
n 38
. Mis
cell
aneo
us c
hem
ical
pro
duct
s 22
5.4
342.
711
7.3
52.1
%23
.51.
3%32
.71.
7%9.
239
.4%
Div
isio
n 31
. Fer
tili
zers
187.
823
9.2
51.4
27.4
%14
.60.
8%21
.81.
1%7.
249
.7%
Div
isio
n 40
. Rub
ber
and
arti
cles
ther
eof
243.
826
6.0
22.2
9.1%
18.4
1.0%
21.4
1.1%
2.9
15.9
%D
ivis
ion
29. O
rgan
ic c
hem
ical
s16
9.9
206.
336
.321
.4%
14.9
0.8%
17.8
0.9%
2.9
19.5
%D
ivis
ion
33. E
ssen
tial
oil
s17
7.6
178.
20.
60.
3%13
.10.
7%14
.80.
8%1.
612
.5%
Ani
mal
and
veg
etab
le p
rodu
cts,
food
, dri
nks a
nd to
bacc
o pr
oduc
ts, i
nclu
ding
:22
61.9
2352
.490
.64.
0%15
9.6
8.9%
182.
69.
6%23
.114
.4%
Div
isio
n 02
. Mea
t and
edi
ble
mea
t off
al39
0.5
404.
414
.03.
6%28
.31.
6%24
.81.
3%-3
.5-1
2.4%
Div
isio
n 04
. Dai
ry p
rodu
cts;
bir
ds' e
ggs;
edi
ble
prod
ucts
15
6.0
171.
315
.39.
8%12
.70.
7%16
.60.
9%3.
930
.6%
Bas
e m
etal
s and
thei
r pro
duct
s, in
clud
ing:
2394
.723
50.2
-44.
5-1
.9%
167.
39.
4%16
5.7
8.7%
-1.6
-0.9
%D
ivis
ion
72. I
ron
and
stee
l96
0.7
822.
9-1
37.8
-14.
3%69
.43.
9%53
.32.
8%-1
6.1
-23.
2%D
ivis
ion
73. A
rtic
les
of ir
on a
nd s
teel
374.
845
0.3
75.5
20.1
%24
.81.
4%37
.22.
0%12
.450
.2%
Div
isio
n 74
. Cop
per
and
arti
cles
ther
eof
487.
051
8.6
31.6
6.5%
34.4
1.9%
35.6
1.9%
1.2
3.6%
Div
isio
n 76
. Alu
min
ium
and
art
icle
s th
ereo
f 33
1.8
323.
3-8
.6-2
.6%
22.7
1.3%
22.1
1.2%
-0.6
-2.8
%
Tex
tile
and
leat
her
mat
eria
ls, c
loth
ing,
foo
twea
r an
d ot
her
cons
umer
goo
ds, i
nclu
ding
:20
63.7
2095
.531
.81.
5%14
0.4
7.8%
154.
48.
1%14
.010
.0%
Div
isio
n 61
. Art
icle
s of
app
arel
& c
loth
ing
acce
ssor
ies,
kni
tted
or
croc
hete
d18
9.0
202.
313
.37.
0%13
.30.
7%14
.90.
8%1.
612
.0%
Woo
d, p
aper
, ear
then
war
e an
d gl
ass p
rodu
cts,
incl
udin
g80
4.1
814.
310
.21.
3%53
.53.
0%57
.33.
0%3.
77.
0%D
ivis
ion
48. P
aper
& p
aper
boar
d; a
rtic
les
of p
aper
pul
p, p
aper
/pap
erbo
ard
370.
636
0.1
-10.
4-2
.8%
25.9
1.5%
25.4
1.3%
-0.6
-2.2
%
Oth
er Im
port
s 1/
0.0
0.0
0.0
0.0%
0.0
0.0%
0.0
0.0%
0.0
0.0%
TO
TA
L I
MP
OR
TS
/CIF
/23
406.
225
484.
020
77.8
8.9%
1789
.110
0.0%
1906
.810
0.0%
117.
76.
6%(
- )F
reig
ht98
5.7
1068
.874
.082
.6T
OT
AL
IM
PO
RT
S /F
OB
/22
420.
424
415.
219
94.7
8.9%
1715
.118
24.2
109.
16.
4%
* C
omm
odit
y gr
oups
incl
udes
div
isio
ns o
f th
e H
arm
oniz
ed S
yste
m o
f C
omm
odit
y D
escr
ipti
on a
nd C
odin
g an
d de
tail
ed d
ata
for
all d
ivis
ions
cou
ld b
e fo
und
thro
ugh
the
NS
I w
eb-s
ite.
1/ I
nclu
des
info
rmat
ion
on im
port
s of
goo
ds in
Cha
pter
99
"Cus
tom
s al
levi
atio
ns"
of th
e C
usto
ms
Tar
iff.
Sou
rces
: F
or 2
012
prel
imin
ary
data
, pro
vide
d by
the
NS
I, in
clud
ing
Inrt
asta
t sys
tem
dat
a an
d cu
stom
s de
clar
atio
ns d
ata
as o
f 27
-Feb
ruar
y-13
. F
or 2
013
prel
imin
ary
data
, pro
vide
d by
the
NS
I, in
clud
ing
Inrt
asta
t sys
tem
dat
a as
of
01-A
pril
-13
and
cust
oms
decl
arat
ions
dat
a as
of
01-M
arch
-13.
Janu
ary
CO
MM
OD
ITY
GR
OU
PS
*Ja
nuar
y -
Dec
embe
r
51

IMP
OR
TS
Mai
n t
rad
e p
artn
ers
and
reg
ion
s20
12 -
201
3
Tab
.6
mil
l. E
UR
Cha
nge
2012
2013
Cha
nge
2011
2012
mil
l. E
UR
%m
ill.
EU
Rsh
are
mil
l. E
UR
shar
em
ill.
EU
R%
EU
cou
ntri
es -
27 i
ncl.
:11
338.
812
115.
777
6.9
6.9%
777.
043
.4%
873.
145
.8%
96.1
12.4
%E
U c
ount
ries
- 1
5 in
cl. :
1/82
87.5
8812
.152
4.6
6.3%
561.
031
.4%
628.
633
.0%
67.6
12.1
%G
erm
any
2275
.824
75.4
199.
68.
8%16
1.1
9.0%
177.
59.
3%16
.410
.2%
Ital
y16
95.9
1673
.2-2
2.7
-1.3
%93
.95.
2%13
2.1
6.9%
38.2
40.7
%G
reec
e11
70.8
1354
.418
3.6
15.7
%79
.14.
4%88
.34.
6%9.
111
.5%
Fra
nce
783.
676
2.2
-21.
5-2
.7%
53.1
3.0%
54.7
2.9%
1.7
3.1%
Aus
tria
46
1.6
490.
829
.26.
3%35
.12.
0%37
.72.
0%2.
67.
3%S
pain
359.
438
4.1
24.6
6.9%
22.0
1.2%
28.6
1.5%
6.7
30.3
%N
ethe
rlan
ds36
7.5
441.
173
.720
.0%
25.2
1.4%
27.8
1.5%
2.7
10.5
%G
. Bri
tain
373.
439
5.4
22.0
5.9%
28.7
1.6%
27.0
1.4%
-1.7
-6.0
%B
elgi
um32
0.3
319.
5-0
.8-0
.3%
20.7
1.2%
22.7
1.2%
1.9
9.4%
EU
- n
ew m
embe
r st
ates
incl
. : 2/
3051
.333
03.5
252.
38.
3%21
6.0
12.1
%24
4.5
12.8
%28
.513
.2%
Rom
ania
1361
.614
01.1
39.5
2.9%
95.1
5.3%
90.0
4.7%
-5.0
-5.3
%P
olan
d47
6.9
586.
610
9.7
23.0
%33
.01.
8%57
.33.
0%24
.373
.6%
Hun
gary
434.
445
9.6
25.2
5.8%
29.1
1.6%
37.5
2.0%
8.4
28.8
%C
zech
Rep
ubli
c36
6.3
440.
974
.620
.4%
28.4
1.6%
31.3
1.6%
2.9
10.3
%
Non
EU
cou
ntri
es :
1206
7.4
1336
8.4
1301
.010
.8%
1012
.156
.6%
1033
.754
.2%
21.5
2.1%
Eur
ope
incl
. : 3/
4881
.861
26.9
1245
.125
.5%
380.
521
.3%
448.
223
.5%
67.7
17.8
%R
ussi
a 38
75.1
5158
.212
83.1
33.1
%27
5.1
15.4
%38
8.8
20.4
%11
3.7
41.3
%U
krai
ne
699.
057
2.1
-126
.9-1
8.2%
59.4
3.3%
31.0
1.6%
-28.
3-4
7.7%
Bal
kan
coun
trie
s inc
l.: 4/
1647
.217
85.3
138.
18.
4%11
6.5
6.5%
136.
67.
2%20
.017
.2%
Tur
key
1076
.111
94.1
118.
011
.0%
77.1
4.3%
85.8
4.5%
8.6
11.2
%M
aced
onia
24
9.3
255.
25.
92.
3%16
.30.
9%25
.01.
3%8.
652
.9%
Ser
bia
262.
125
8.2
-3.9
-1.5
%17
.01.
0%19
.21.
0%2.
212
.8%
Am
eric
as i
ncl.
:16
84.3
1678
.0-6
.3-0
.4%
184.
710
.3%
86.9
4.6%
-97.
8-5
2.9%
Per
u47
8.3
262.
5-2
15.8
-45.
1%3.
50.
2%35
.11.
8%31
.690
7.9%
US
A37
1.2
411.
240
.010
.8%
28.4
1.6%
33.0
1.7%
4.6
16.2
%
Asi
a in
cl. :
3621
.235
29.9
-91.
3-2
.5%
311.
417
.4%
301.
115
.8%
-10.
3-3
.3%
Chi
na13
97.2
1656
.825
9.6
18.6
%16
3.3
9.1%
131.
46.
9%-3
1.9
-19.
6%K
azak
hsta
n68
9.8
388.
0-3
01.8
-43.
7%50
.02.
8%56
.63.
0%6.
513
.0%
Oth
er c
ount
ries
232.
924
8.3
15.4
6.6%
18.9
1.1%
60.8
3.2%
41.9
221.
8%
TO
TA
L I
MP
OR
TS
/CIF
/23
406.
225
484.
020
77.8
8.9%
1789
.110
0.0%
1906
.810
0.0%
117.
76.
6%*
By
coun
try
of o
rigi
n.1/
Inc
lude
s th
e E
U m
embe
r co
untr
ies
prio
r to
May
1, 2
004.
2/ F
ollo
win
g E
uros
tat c
lass
ific
atio
n. I
nclu
des
the
new
EU
mem
ber
coun
trie
s ac
cept
ed a
fter
May
1, 2
004
and
Janu
ary
1, 2
007.
3/ I
nclu
des
Rus
sia,
Ukr
aine
, Sw
itze
rlan
d, G
ibra
ltar
(G
B),
Mol
dova
, Bel
arus
, Nor
way
, Lic
hten
stei
n, S
an M
arin
o, I
cela
nd a
nd M
onac
o.4/
Inc
lude
s T
urke
y, S
erbi
a, M
onte
negr
o, M
aced
onia
, Alb
ania
, Cro
atia
and
Bos
nia
and
Her
zego
vina
. S
ourc
es:
For
201
2 pr
elim
inar
y da
ta, p
rovi
ded
by th
e N
SI,
incl
udin
g In
rtas
tat s
yste
m d
ata
and
cust
oms
decl
arat
ions
dat
a as
of
27-F
ebru
ary-
13.
For
201
3 pr
elim
inar
y da
ta, p
rovi
ded
by th
e N
SI,
incl
udin
g In
rtas
tat s
yste
m d
ata
as o
f 01
-Apr
il-1
3 an
d cu
stom
s de
clar
atio
ns d
ata
as o
f 01
-Mar
ch-1
3.
Janu
ary
CO
UN
TR
IES
*Ja
nuar
y -
Dec
embe
r
52

METHODOLOGICAL NOTES ON THE COMPILATION OF THE BALANCE OF PAYMENTS OF
BULGARIA
The Bulgarian National Bank is in charge of the compilation of the balance of payments of the
country. The legal basis for the balance of payments compilation in Bulgaria is provided for in Article
42 of the Law on the Bulgarian National Bank. Data for the purposes of the BOP compilation are
collected on the basis of Article 42 of the Law on the Bulgarian National Bank as well as on the basis
of the Foreign Exchange Law. These data are processed by the “Balance of Payments and External
Debt” Division within the Statistics Directorate of the BNB. At present, the Bulgarian National Bank
compiles and publishes analytic presentation as well as standard presentation of the balance of
payments in accordance with the Fifth Edition of the “Balance of Payments Manual” (IMF, 1993),
the “Balance of Payments Textbook” (IMF, 1996), and the “Guideline of The European Central Bank”
(ECB/2004/15) 1.
The balance of payments’ methodology is conceptually related to that of the System of
National Accounts (SNA). The items of the balance of payments correspond closely to the relevant
categories of the rest of the world account in the SNA.
There is a close relationship between the International Investment Position and the balance of
payments as well. The BOP financial account measures an economy's transactions in external
financial assets and liabilities, which affect the stock of external financial assets and liabilities
measured in the international investment position.
I. ACCOUNTING PRINCIPLES AND CONVENTIONS The basic convention applied in the construction of Bulgaria's balance of payments is the
implementation of the double entry system. Under credit, with a positive sign, are recorded: exports of
goods and services, income receivable, offsets to non-refundable real and financial resources
received (transfers), increases in financial liabilities, decreases in financial assets. Under debit, with a
negative sign, are recorded: imports of goods and services, income payable, offsets to non-refundable
real and financial resources provided, increases in financial assets, decreases in financial liabilities.
The time of recording of the balance of payments transactions is the time of change of
ownership.
Transaction valuations are based on market prices. If the actual market prices are not
available, the average market prices are used as approximation.
Valuation changes of the country’s external assets and liabilities are not included in the
balance of payments.
The units of account for the balance of payments of Bulgaria are the EUR and the BG lev. The
conversion into the unit of account is made using the exchange rate at the time of transaction. If not
available, or inapplicable for other practical reasons, the average exchange rate for the reporting
period is used.
1 Guideline of The European Central Bank on the Statistical Reporting Requirements of The European Central
Bank in the Field of Balance of Payments Statistics, The International Reserves Template and International Investment Position Statistics (ECB/2004/15)
53

II. BALANCE OF PAYMENTS COMPONENTS
The balance of payments components are compiled using the International Transactions
Reporting System (ITRS), which includes (i) banks’ reports, and (ii) reports by enterprises which have
bank accounts abroad, pertaining to the residents’ international transactions. These reports cover all
components of the balance of payments table. As of January 1, 2010 the threshold under which
transactions, reported by payment service providers are exempted from balance of payments
reporting has risen from 25 000 BGN to 100 000 BGN. In addition, the data on certain BOP
components collected by the ITRS is substituted for data from other sources: (i) monthly exports and
imports of goods, provided by the NSI (ii) BNB estimations for the items Travel, Transportation,
Compensation of employees, credit and Workers remittances, credit (iii) direct investment enterprise
survey and quarterly reports of Bulgarian FDI abroad (iv) monthly reports by banks, other non-bank
financial institutions, insurance companies and pension funds on their Portfolio investments, assets (v)
data from the Central Depository on the Portfolio investments, liabilities (vi) administrative records,
(vii) reports by enterprises having financial loans borrowed from and lent to non-residents and (viii)
enterprise reports regarding their assets and liabilities (different from financial loans) with non-
residents.
In the analytic presentation the balance of payments components are classified in the
following main categories:
A. Current Account The Current Account comprises the acquisition and provision of goods and services,
income, and current transfers between the country and the rest of the world. The flows recorded on
the credit side represent that part of the gross domestic product, which is provided to the rest of the
world (exports of goods and services), as well as the provision of factors of production expressed by
income receivable – compensation of employees and investment income (interest, dividends, etc.).
Recorded are also offsets for non-refundable real and financial resources received (transfers).
The flows on the debit side represent the gross product created in the rest of the world and
acquired by the domestic economy (imports of goods and services), as well as the acquisition of
factors of production expressed by income payable. Recorded are also offsets to non-refundable real
and financial resources provided.
The Goods component of the BOP Current Account covers movable goods for which
changes of ownership between residents and non-residents occur. The data on imports and exports
FOB (Free on board) is based on customs declarations, as the codes used in them are after the
Harmonised System for Description and Coding of Commodities of the World Customs Organisation,
introduced in 1988 and supplemented in 1992. With the January 2006 data the Bulgarian National
Bank and the National Statistics Institute jointly apply developed by them methodology for compilation
of imports at FOB prices and receipts and payments regarding the freight transportation.2 The
methodology is based on the analysis of the CIF-FOB correlations for the imports of goods depending
2The 2002 – 2005 data are based on this methodology for compilation of imports at FOB prices and receipts and payments
regarding the freight transportation.
54

on the different imports delivery categories, as well as on the different mode of transportation and
nationality of the carrier.
The geographical breakdown of the Goods item of the BOP is based on the following principles:
For the intra EU trade in goods:
- In case of exports (or dispatches) is the country (or Member State) of final destination of the goods
- In case of imports (or arrivals) is the country (or Member State) of consignment of the goods.
For the trade with third countries (outside EU)
- In case of exports – partner country is the country of final destination of the goods
- In case of imports - partner country is the country of origin of the goods.
Sources: The source of data as from the beginning of 2003 until the end of 2006 was the
Customs Agency and for preceding years - the Information services (at the Informational Computing
Center Directorate). The Bulgarian National Bank and the National Statistical Institute received the
exports and imports data, supplemented it with other information and processed it further. With the
introduction of the system INTRASTAT (introduced with the Law on Statistics of Intercommunity
Merchandise Trade, GG. N51 of 2006) with the January 2007 data changes in the way of reporting of
the external trade of Bulgaria with the rest of the EU member states took place.
The introduction of the system INTRASTAT led to changes in the deadlines for receiving and
processing of the data. The information on exports (dispatches) and imports (arrivals) of goods are
reported by the INTRASTAT operators (the firms obliged to report) to the National Revenue Agency
within 10 days after the close of the reporting month. These data are sent to the National Statistical
Institute for further processing. The NSI reports to EUROSTAT aggregated monthly data (without
breakdowns by trade partners and by type of goods) within 42 days after the close of the reporting
month. The detailed intra trade data on dispatches and arrivals of goods are reported to EUROSTAT
within 70 days after the close of the reporting month.
The BNB receives aggregated data from the NSI (without breakdowns by trade partners and by
type of goods) on the country trade with the other EU member states within 35 days after the close of
the reporting month, and these data are supplemented by the data of the Customs Agency on trade
with third countries. Before that with the publication of the report on the balance of payments for the
reporting month only aggregated data on exports and imports are published. The BNB receives from
the NSI within 60 days after the close of the reporting month detailed data on dispatches and arrivals
of goods.
As a result of these changes the schedule for external trade data reporting by the BNB is the
following:
Preliminary aggregated data (without breakdowns by trade partners and by type of goods) for
the reporting month are published within 42 days after the close of the reporting month in the balance
of payments table.
Preliminary detailed data (with breakdowns by trade partners and by type of goods) for the
reporting month are distributed to users not earlier than 73 days after the close of the reporting month.
55

The published series of data on exports and imports of the country on the web site of the BNB
are updated not earlier than 73 days after the close of the reporting month.
In accordance with the common methodology, before publishing the data, the BNB and the
NSI have to agree upon the data.
The Services component comprises transportation, travel, and other services.
The Bulgarian National Bank derives the data on freight transportation from foreign trade data
and the data on passenger transportation from travel data on the basis of estimates.
With the January 2006 data the BNB introduced a new methodology for compilation of
receipts and payments regarding the freight transportation. The freight transportation receipts are set
up on the basis of estimated receipts of resident carriers related to the country exports of goods. The
payments are calculated as an estimation of the payments made by residents on behalf of non-
resident carriers related to the country imports of goods. The receipts and payments are estimated
according to mode of transportation and nationality of the carrier. With the introduction of the system
INTRASTAT with the January 2007 data changes in the way of compilation of receipts and payments
regarding the freight transportation of Bulgaria with the rest of the EU member states took place. Due
to the delay in receiving the detailed data on trade of Bulgaria with the rest of the EU member states
from the NSI, as of the date of publication of the preliminary balance of payments report for the
corresponding month (42 days after the close of the reporting period) the preliminary compilation of
receipts and payments of freight transportation is based on data for preceding years. These estimates
are subject to revisions after receiving the preliminary detailed data (with breakdown by trade partners
and by type of goods) on trade with the rest of the EU member states for the reporting month.
Travel covers goods and services, including those related to health and education, acquired
by travellers for business and personal purposes. By the end of 2006 the data on travel is based on
data from the Ministry of Internal Affairs on the number of travellers crossing the borders and on
estimates of per capita expenditures, the latter based on the methodology for estimation of the
receipts and expenditures from travel services – “Methodology For Estimation of the Receipts and
Expenditures from Travel in the Bulgarian Balance of Payments” (Bulgarian National Bank, Ministry of
Trade and Tourism, 18 November 1999).
As of the beginning of 2007 data for the number and the structure of foreigners who visited
the country are based on information from the border police and NSI estimates.With the January 2010
data the BNB applies new methodology for estimation of the receipts and expenditures for travel and
passenger transportation. The estimation model for the Travel item is based on the product of the
number of travelers and the expenditure respective for a certain type of purpose of the travel (for more
detailed information and questions, related to the methodologies applied, please contact us through the following
e-mail: [email protected]). The estimates of the expenditures (receipts) by purpose of the travel
are based on the data collected during the Border Survey among Traveling Bulgarians and Foreigners
conducted by the BNB during the period July 2007 – August 2008. The new methodology was applied
for the first time with the data for January 2010, with back data revisions for the months of 2007, 2008
and 2009.
56

Other services item covers receipts and payments related to services other than
transportation and travel (communication, construction, financial, leasing, insurance, cultural, sport
and recreational services, etc.).
By end 2009 the main sources of information on this item were the banks' reports and the
reports of enterprises having accounts abroad, as well as BNB estimates for the transactions below
the threshold of 100 000 BGN. In accordance with Regulation (EC) No 924/2009 of the European
Parliament and of the Council of 16 September 2009 on cross-border payments in the Community and
repealing Regulation (EC) No 2560/2001 with effect from January 2010, the settlement-based national
reporting obligations on payment service providers for balance of payments statistics related to
payment transactions of their customers up to EUR 50 000 were removed. The quality and the scope
of the data collected by the banks depend to a great extent on the threshold above which they report
the transactions between residents and non-residents to the BNB. Raising the threshold without
alternative source for these data would have considerably deteriorated the quality of the balance of
payments data and particularly of the current account. The analysis showed that the loss of
information for some services items could reach up to 90%. For that reason the BNB has changed the
methodology for collection and compilation of data on other services and other items in the current
account that still relied on the settlement data. As of the beginning of 2010 the BNB started conducting
regular quarterly survey among enterprises trading internationally in services. Based on the results of
the survey, with the publication of January 2011 balance of payments figures, data on other services
for 2010 are revised. For the purpose of the monthly publications data on other services item is based
on the settlement data from banks for the transactions above the threshold of BGN 100 000 and BNB
estimations for transactions below the threshold. After the quarterly reports by enterprises are
processed data is to be revised.
.
Income consists of two categories: (i) compensation of employees, and (ii) investment
income. Compensation of employees covers wages, salaries and other benefits paid to non-resident
workers in the country or received by resident workers abroad. The compensation of employees
comprises also income due to illegal employment. By the end of 2006 the BNB estimates this flow in
accordance with the Methodology for Estimation of Flows due to Illegal Employment (14 March
2006).3 With the January 2010 data the BNB applies new methodology for estimation of the
Compensation of employees, credit. The new methodology was applied for the first time with the data
for January 2010, with back data revisions for the months of 2007, 2008 and 2009.
Investment income covers receipts and payments of income associated with external financial
assets and liabilities. Included are receipts and payments on direct investment, portfolio investment,
other investment, and receipts on reserve assets.
The main sources of information on the Income component are the banks' reports and the
reports of non-bank financial institutions, insurance companies, pension funds, enterprises, the
Ministry of Finance, and the Bulgarian National Bank.
3 The data as from April 2001 are based on this methodology.
57

Transfers are all real resources and financial items provided without a quid-pro-quo from one
economy to another. Current transfers directly affect the level of disposable income of the economy,
and the consumption of goods and services. That is, current transfers reduce the income and
consumption potential of the donor and increase the income and consumption potential of the
recipient. Included in the Current transfers are the EU pre-acquisition grants, other grants, gifts,
inheritances, prizes won from lotteries, pensions, current taxes, social security contributions, etc.
Sources: The Bulgarian National Bank receives information on current transfers from the Ministry of
Finance, the Bulgarian Red Cross, the Agency for Foreign Aid, and from the reporting system of
banks on transactions between residents and non-residents .
The item Workers remittances, credit is a sub-item of the Current transfers, credit in the Current
account of the balance of payments and is a balancing item for transfers without a quid-pro-quo in
cash or in kind.
Applying of a new methodology for estimation of these flows became necessary not only
because the above described circumstances demanded it but because of the necessity to capture
inflows transferred through both official and unofficial channels.
The estimates of the workers’ remittances are based on the product of the number of Bulgarian
emigrants, transferring money to their relatives and the amount of the average transfer4. Such
calculations are made separately for the official and the unofficial transfer channels. The sum of the
money transferred via those two channels is recorded as the amount of Workers’ remittances to
Bulgaria.
The data on the number of the Bulgarian emigrants are based on information from the State
Agency for Bulgarians abroad, from the Bulgarian embassies and from Eurostat. The data on the
percentage of the Bulgarian emigrants, transferring money; the shares of the official and unofficial
channels and the average transfer for each of the channels used are based on the data collected via
the Border survey.
The new methodology was applied for the first time with the data for January 2010, with
backdata revisions for the months of 2007, 2008 and 2009.
B. Capital Account The Capital Account consists of two categories: (i) capital transfers and (ii) acquisition or
disposal of non-produced, non-financial assets. If in kind, a capital transfer consists of (i) a transfer of
ownership of fixed assets, or (ii) forgiveness of a liability by a creditor when no counterpart is received
in return. If in cash, a transfer is a capital transfer when it is linked to, or conditional on, the acquisition
or disposal of fixed assets (for example, an investment grant).
Sources: The Bulgarian National Bank receives information on the capital account from the
Ministry of Finance (for capital transfers from the EU funds), from the quarterly reports of the
enterprises in the non-financial sector, the monthly reports of the notaries and others.
4 For more detailed information, please see “Methodology for estimation of the item Workers’ Remittances (Bulgarian National Bank, March 2010). In case of further questions, related to the methodologies applied, please contact us through the following e-mail [email protected]
58

C. Financial Account The Financial Account comprises all transactions (actual and imputed) in the external financial
assets and liabilities of an economy. The external assets and liabilities are primarily classified
according to type of investment. Included in Financial Account are (i) direct investment, (ii) portfolio
investment and (iii) other investment.
Direct investment covers direct investment abroad, direct investment in reporting economy
and mergers and aqcuisitions. Direct investment is a category of international investment in which a
resident of one economy – a direct investor – acquires a lasting interest (at least 10% of the ordinary
shares or the voting power) in an enterprise resident in another economy – a direct investment
enterprise. The direct investment includes both the initial transaction, through which the relationship
between the direct investor and the direct investment enterprise is established, and all subsequent
transactions between them. The direct investment covers transactions relating to changes in the direct
investor’s share in the equity capital of the direct investment enterprise, inter-company debt
transactions as well as the share of the direct investor in the undistributed earnings/loss of the direct
investment enterprise. Direct investment is reported on a directional basis: direct investment abroad –
as an asset, and direct investment in the reporting country – as a liability.
The subitem Mergers and Aqcuisitions shows the transactions related to mergers and
acquisitions. The purpose of its inclusion was to eliminate the influence of such deals over the
reported foreign direct investment data. The international practice shows that these transactions have
hardly any real impact on the production capacities and employment and the conclusions drawn from
the interpretation of foreign direct investment data in which data on mergers and acquisitions are
included might be misleading about investment flows, developments, branch and geographical
structure. (“European Central Bank, Eurostat, Foreign Direct Investment Task Force Report”, March
2004, para.332)
Sources: The Bulgarian National Bank receives monthly data on direct investments in the
country from the Privatisation Agency, from the Central Depository, from the reporting system of
banks on transactions between residents and non-residents , from notaries and registry offices;
quarterly data from the Financial Supervision Commission , from the direct investment enterprises,
from the National Statistical Institute, from the Banking Supervision Department of the BNB, from the
insurance companies and pension insurance companies; annual data from the NSI on foreign direct
investment stock in enterprises from the non-financial sector..
For data on direct investments abroad the Bulgarian National Bank uses the information from
FDI declaration forms, from quarterly reports of non-financial sector enterprises and from the reporting
system of banks on transactions between residents and non-residents ..
Portfolio investment includes portfolio investment, assets and portfolio investment,
liabilities.
Portfolio investment covers transactions in shares and equity if the investor’s share in the
capital is less than 10%, transactions in bonds, notes, money market and other tradable securities.
59

The main source of information on the liabilities side of the Portfolio investment is the data
provided by the Ministry of Finance, the Bulgarian National Bank, banks, enterprises holding bank
accounts abroad, and the Central Depository. Data on the assets side of the Portfolio investment is
provided by banks (which give information about their and their clients’ portfolio investments), non-
bank financial institutions, insurance companies and pension funds, the Bulgarian National Bank and
the Ministry of Finance.
Other investment covers trade credits, loans, currency deposits, and other assets and
liabilities.
According to the balance of payments conventions trade credit arise from the direct extension
of credit from a supplier to a buyer, i.e this is a credit extended by a trade partner without issue of a
tradable security.
The main source of information on trade credits-assets and liabilities are the quarterly reports
of enterprises on their assets/liabilities to non-residents.
Loans item includes received and paid principals on short- and long-term loans between
residents and non-residents if no issue of a tradable security is involved with these loans.
Transactions concerning disbursements and repayments of principals on IMF loans and
disbursements on loans on BOP support are not included in the item Loans. They are recorded in
the relative items of group E. Reserves and Related Items.
Data on the item Loans is received by the Ministry of Finance, the Bulgarian National Bank,
the banks and directly by the enterprises that have lent to or borrowed from abroad. The latter report
quarterly data to the BNB because of which the monthly data on Loans, Other sectors (assets and
liabilities) is revised each quarter.
The Currency and Deposits component presents on the assets side the changes in the
residents’ currency deposits held abroad, and on the liabilities side – the changes in the liabilities of
the resident banks to non-residents in domestic and foreign currency. Following the basic accounting
principle and conventions set in the “Balance of Payments Manual” (IMF, 1993), when compiling that
item the Bulgarian National Bank excludes any changes therein due to exchange rate changes.
Items Other assets and Other liabilities includes all transactions on miscallenous accounts
receivable and payable not included elsewhere and transactions in arrears.
D. Net errors and omissions The Net errors and omissions component is an offsetting item. This component exists in the
BOP presentation because the compilation system used by the Bulgarian National Bank is not a
closed one but is a combination of different sources of information. Unlike other statistical reports,
such as for example the monetary statistics, the collecting of the data necessary for the balance of
payments compilation could not be restricted to the accounting records of the banks as the only
source of information,
The fluctuations in the Net errors and omissions, both in sign and in size, are mainly due to: (i)
revisions of export and import data, (ii) the development of the methodology for compilation of certain
60

balance of payments’ components and (iii) the existence of objective obstacles to the collection of
data on certain balance of payments’ items.
E. Reserves and related items Reserve assets include those external assets that are readily available to and controlled
by the central bank (government) for direct financing of balance of payments imbalances. The reserve
assets comprise monetary gold, SDRs, reserve position in the Fund, foreign exchange assets
(consisting of currency and deposits and securities), and other claims. The entries under this category
pertain to transactions in the BNB's external holdings which are administered by the Issue
Department. The data on reserve assets changes included in the BOP table excludе valuation
changes, due to exchange rate and market price changes.
This group in the analytic presentation of the balance of payments includes also Use of Fund
credit and the item Exceptional Financing. The exceptional financing comprises the BOP support as
well as deferred/rescheduled payments and payments on arrears, resulting from balance of payments
difficulties. In accordance with the methodology for accounting the exceptional financing transactions
("Balance of Payments Manual", Fifth Edition (IMF, 1993), p. 454), the principal repayments on the
BOP support credits are included in the Financial Account – Other investment – Liabilities – Loans –
General Government.
III. PERIODICITY, FREQUENCY AND TIMELINESS OF THE BALANCE OF PAYMENTS
PUBLICATIONS
The Bulgarian National Bank compiles and publishes the balance of payments of the country
on a monthly basis. The schedule of the Bulgarian National Bank is to publish the data within six
weeks (42 calendar days) after the close of the reference period.
IV. DATA REVISION POLICY
Revisions to published BOP estimates are a common feature of many balance of payments
compilation systems. They are in compliance with the ECB Timetable for Exchange of Balance of
Payments, International Investment Position and Reserve Assets Statistics within the ESCB (which
includes a data revision timetable). With the revisions publication, the users are timely acquainted with
the revised data on the corresponding items.5 The policy on revisions pursued by the Bulgarian
National Bank is based on the following principles:
(i) With the report for the first month of the quarter the monthly data for the whole current year
are revised. With the reports for the second and the third month of the quarter, only data for the
previous month are revised.
(ii) When on-going changes are made due to additional information collected, as well as
resulting from elimination of errors, the Bulgarian National Bank timely informs the users through the
monthly press releases as well as through the notes at the end of the balance of payments table.
5 The annual data on foreign direct investment in the country are revised 15 months after the close of the reporting period (after the annual NSI data on the nonfinancial sector are received in the BNB).
61

(iii) When significant revisions are made due to changes in the methodology for reporting of
certain BOP components or other reasons, the Bulgarian National Bank publishes in advance
information on the changes to facilitate the users of the data.
V. DATA DISSEMINATION
The Bulgarian National Bank disseminates the monthly balance of payments data on its web
site – http://www.bnb.bg.
The data is published also in the Bulgarian National Bank Monthly Bulletin.
Data on the balance of payments of the country is included in the semi-annual and in the
annual official reports of the Bulgarian National Bank.
Data are simultaneously released to all interested parties.
VI. CONTACTS
If you have any questions on the methodology applied by the Bulgarian National Bank or on
the balance of payments data published, please do not hesitate to send them to Mr. Emil Dimitrov,
director of the Statistics Directorate, via e-mail at [email protected], and Mrs. Liliana Bancheva,
head of the Balance of Payments and External Debt Division , via e-mail at [email protected],
or by mail to the following address:
Bulgarian National Bank
Balance of Payments and External Debt Division
1 Knyaz Alexander I Square
1000 Sofia
BULGARIA
Last updated on November 16th, 2012
62

Press ReleasesStatistical Press Releases
Balance of PaymentsFebruary 2013Previous Press Releases
Gross External DebtJanuary 2013Previous Press Releases
Research and PublicationsBNB Periodical Publications
Statistical PublicationsBalance of Payments of Bulgaria
January - February 2013Previous Publications
Direct InvestmentsJanuary - February 2013Previous Publications
Gross External Debt of BulgariaJanuary 2013Previous Publications
StatisticsMacroeconomic Indicators
External Sector IndicatorsExternal Sector
Exchange RatesReal Effective Exchange Rates
Balance of PaymentsAnalytical Presentation (monthly data in EUR million)Standard Presentation (monthly data in EUR million)
Foreign TradeExports
End-UseMonthly DataQuarterly DataAnnual Data
Main Trade Partners and Regions (EUR million)Monthly DataQuarterly DataAnnual Data
Main Trade Regions by End-Use (EUR million)Quarterly Data 1995 - 2012
Main Trade Regions by End-Use (EUR million)Annual Data 1995 - 2012
ImportsEnd-Use
Monthly DataQuarterly DataAnnual Data
Main Trade Partners and Regions (EUR million)Monthly DataQuarterly DataAnnual Data
External Sector Statistics, Compiled by Balance of Payments and External Debt Division and Disseminated
through the BNB web-site (http://www.bnb.bg), by Items: *
*As of April 16, 2013.
63

StatisticsExternal Sector
Foreign TradeImports (continued)
Main Trade Regions by End-Use (EUR million)Quarterly Data 1995 - 2012
Main Trade Regions by End-Use (EUR million)Annual Data 1995 - 2012
StatisticsExternal Sector (continued)
International Investment Position (EUR million)Quarterly DataAnnual Data
Direct InvestmentIn Bulgaria
FDI flows by investment type - annual data FDI flows by geographical region - annual data FDI flows by economic activity - annual data
FDI flows by investment type - quarterly data FDI flows by geographical region - quarterly data FDI flows by economic activity - quarterly data
FDI flows by investment type- monthly data
FDI stock by investment type - annual data FDI stock by geographical region - annual data FDI stock by economic activity - annual data
FDI stock by investment type - quarterly data
Abroad
DI flows by investment type - annual data DI flows by geographical region - annual data DI flows by industry - annual data
DI flows by investment type - quarterly data DI flows by geographical region - - quarterly data DI flows by industry - - quarterly data
DI flows by investment type - monthly data
DI stock by investment type - annual data DI stock by geographical region - annual data DI stock by investment type - quarterly data
Gross External DebtGross External Debt Stock by Sectors, 1999 - 2013
(monthly data in EUR million)Gross External Debt Stock by Instuments, 1999 - 2013
(monthly data in EUR million)Gross External Debt Stock by Creditors, 2004 - 2012
(quarterly data in EUR million)Currency Structure of the Gross External DebtGross External Debt Stock of Other Sectors whit Geographical Structure, 2004 - 2012
(quarterly data in EUR million)Gross External Debt Stock of Other Sectors whit Branch Structure, 2004 - 2012
(quarterly data in EUR million)
*As of April 16, 2013.
64

StatisticsExternal Sector
Gross External Debt (continued)
Gross External Debt Service by Sectors, 2013(monthly data in EUR million)
Gross External Debt Service by Sectors, 2010 - 2012(monthly data in EUR million)
Gross External Debt Service by Sectors, 2007 - 2009(monthly data in EUR million)
Gross External Debt Service by Sectors, 2002 - 2006(monthly data in EUR million)
Gross External Debt Service by Sectors, 1999 - 2001(monthly data in EUR million)
Gross External Debt Disbursements by Sectors, 1999 - 2013(monthly, quarterly and annual data in EUR million)
StatisticsExternal Sector (continued)
Template on International ReservesPart I. Official Reserve Assets and Other Foreign Currency Assets
Part II. Predetermined short-term net drains on foreign currency assets (nominal value)
Part III. Contingent short-term net drains on foreign currency assets (nominal value)
Part IV. Memo items
Statistics (continued)Methodological Notes
Balance of PaymentsStandard and Analytic ConceptsMethodological NotesMethodology for estimation of items „Travel”, “Passenger Transportation” and “Compensation of Employees - credit” of the Balance of Payments of BulgariaMethodology for Estimation of Item Workers’ Remittances, CreditMethodology for Compilation of Imports at FOB Prices and Receipts and Payments Regarding the Freight Transportation for the Balance of PaymentsMethodology for Estimation of Flows due to Unofficial Employment
Foreign TradeMethodological NotesMessage about the changes in the reporting of Foreigh Trade (16 January 2007)Announcement about the coverage and quality of the data on imports and exports for the period January - March 2007 (as of 18 May 2007)
Real Effective Exchange RateMethodological Notes
International Investment PositionMethodological Notes
Direct InvestmentsMethodological Notes
Gross External DebtMethodological Notes
Template on International Reserves and Foreign Currency LiquidityMethodological Notes
*As of April 16, 2013.
65

Statistics (continued)Statistical Data Base
Selection of StatisticsBalance of Payments
Selection of:FrequencyData TypeCounterpart DataItemSeries Denominated
StatisticsStatistical Data Base
Selection of Statistics (continued)International Investment Position
Selection of:FrequencyData TypeCounterpart DataItemSeries Denominated
Foreign Direct Investment in BulgariaSelection of:
FrequencyCounterpart DataItemSeries DenominatedData TypeResident Economic Activity
Direct Investment of Bulgaria AbroadSelection of:
FrequencyCounterpart DataItemSeries DenominatedData TypeResident Economic Activity
Template on International Reserves and Foreign Currency LiquiditySelection of:
FrequencyItemSeries DenominatedData Type
Real Effective Exchange RateSelection of:
FrequencyDeflator
*As of April 16, 2013.
66


