27
MARUTI SUZUKI INDIA LTD. Balance Sheets ,Income and Trade Analysis By G. Hareesh B. Sukesh K. Hareesh P.RaviTeja Pra na y Kiran P .Narendra Babu
8/7/2019 Balance Sheets ,Income and Trade Analysis
http://slidepdf.com/reader/full/balance-sheets-income-and-trade-analysis 1/27
MARUTI SUZUKI INDIA LTD.
Balance Sheets ,Income and Trade
Analysis
ByG. Hareesh
B. Sukesh
K. Hareesh
P.RaviTeja
Pranay Kiran
P.Narendra Babu
8/7/2019 Balance Sheets ,Income and Trade Analysis
http://slidepdf.com/reader/full/balance-sheets-income-and-trade-analysis 2/27
HISTORY AND OVERVIEWy Maruti Suzuki India Limited a subsidiary of Suzuki Motor
Corporation of Japan, is India's largest passenger car company,
accounting for over 45% of the domestic car market.
y Until recently, 18.28% of the company was owned by the Indian
Government, and 54.2% by Suzuki of Japan. The BJP-led
government held an initial public offering of 25% of the company
in June 2003. As of 10 May 2007, Govt. of India sold its complete
share to Indian financial institutions.
8/7/2019 Balance Sheets ,Income and Trade Analysis
http://slidepdf.com/reader/full/balance-sheets-income-and-trade-analysis 3/27
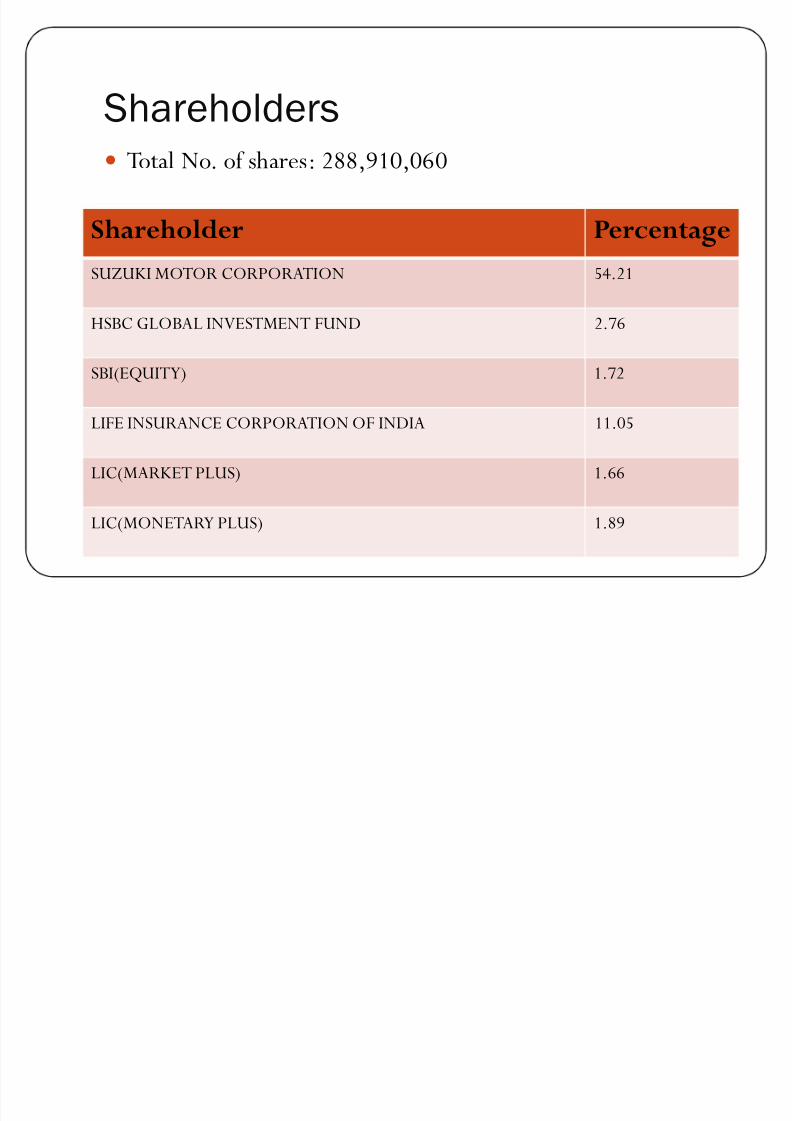
Shareholders
y Total No. of shares: 288,910,060
Shareholder Percentage
SUZUKI MOTOR CORPORATION 54.21
HSBC GLOBAL INVESTMENT FUND 2.76
SBI(EQUITY) 1.72
LIFE INSURANCE CORPORATION OF INDIA 11.05
LIC(MARKET PLUS) 1.66
LIC(MONETARY PLUS) 1.89
8/7/2019 Balance Sheets ,Income and Trade Analysis
http://slidepdf.com/reader/full/balance-sheets-income-and-trade-analysis 4/27
BALANCE SHEETy A statement of a company's assets, liabilities, and stockholder
equity at a given period of time, such as the end of a quarter or year.
y A balance sheet is a record of what a company has and how it has
come to have it.y A balance sheet is divided into two main sections,
1. Assets
2. Liabilities
y
In this, we are going to report under these two headings.1. Sources of funds.
2. Application of funds.
8/7/2019 Balance Sheets ,Income and Trade Analysis
http://slidepdf.com/reader/full/balance-sheets-income-and-trade-analysis 5/27
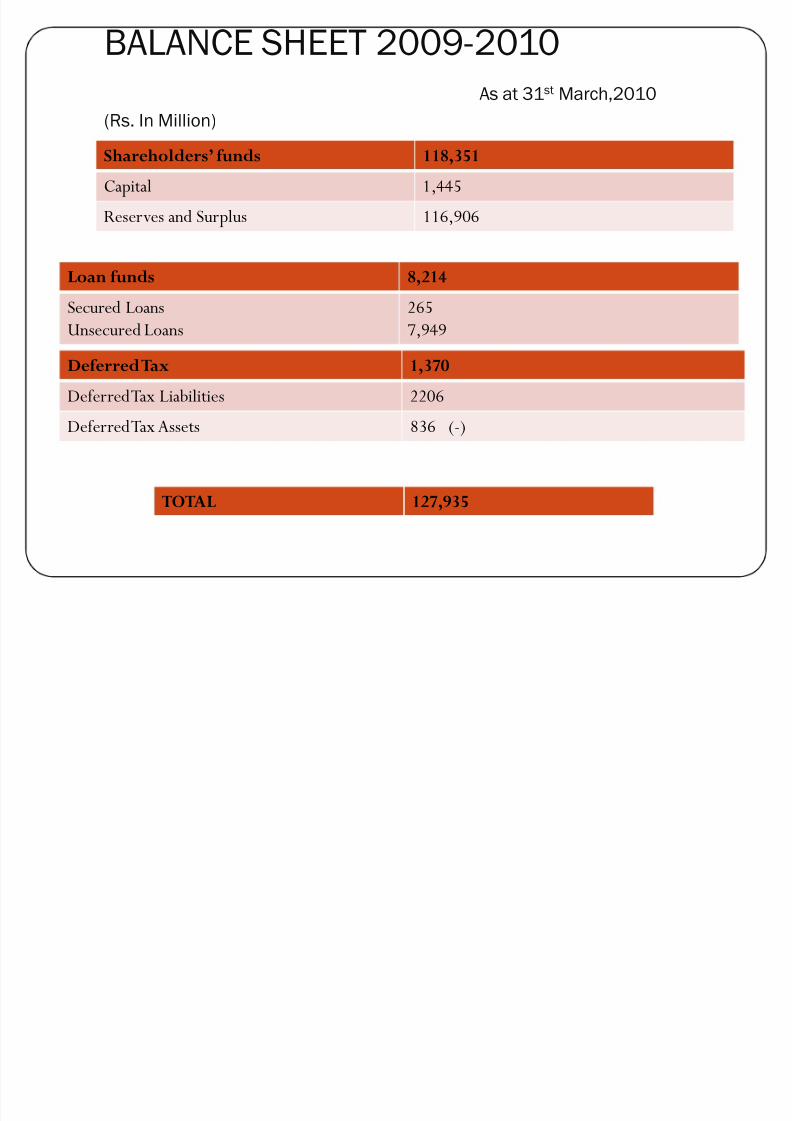
BALANCE SHEET 2009-2010
As at 31st March,2010
(Rs. In Million)
Shareholders· funds 118,351
Capital 1,445
Reserves and Surplus 116,906
Loan funds 8,214
Secured Loans
Unsecured Loans
265
7,949
Deferred Tax 1,370
DeferredTax Liabilities 2206
Deferred Tax Assets 836 (-)
TOTAL 127,935
8/7/2019 Balance Sheets ,Income and Trade Analysis
http://slidepdf.com/reader/full/balance-sheets-income-and-trade-analysis 6/27
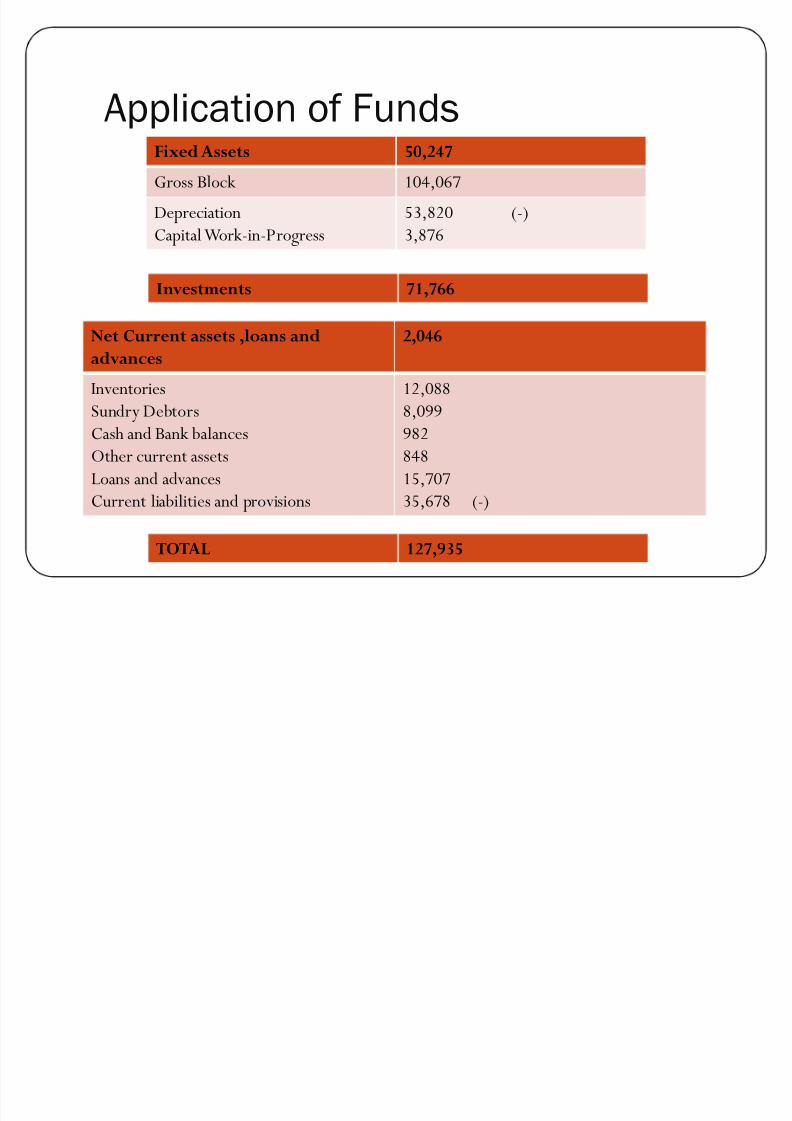
Application of FundsFixed Assets 50,247
Gross Block 104,067
Depreciation
Capital Work-in-Progress
53,820 (-)
3,876
Investments 71,766
Net Current assets ,loans and
advances
2,046
Inventories
Sundry DebtorsCash and Bank balances
Other current assets
Loans and advances
Current liabilities and provisions
12,088
8,099982
848
15,707
35,678 (-)
TOTAL 127,935
8/7/2019 Balance Sheets ,Income and Trade Analysis
http://slidepdf.com/reader/full/balance-sheets-income-and-trade-analysis 7/27
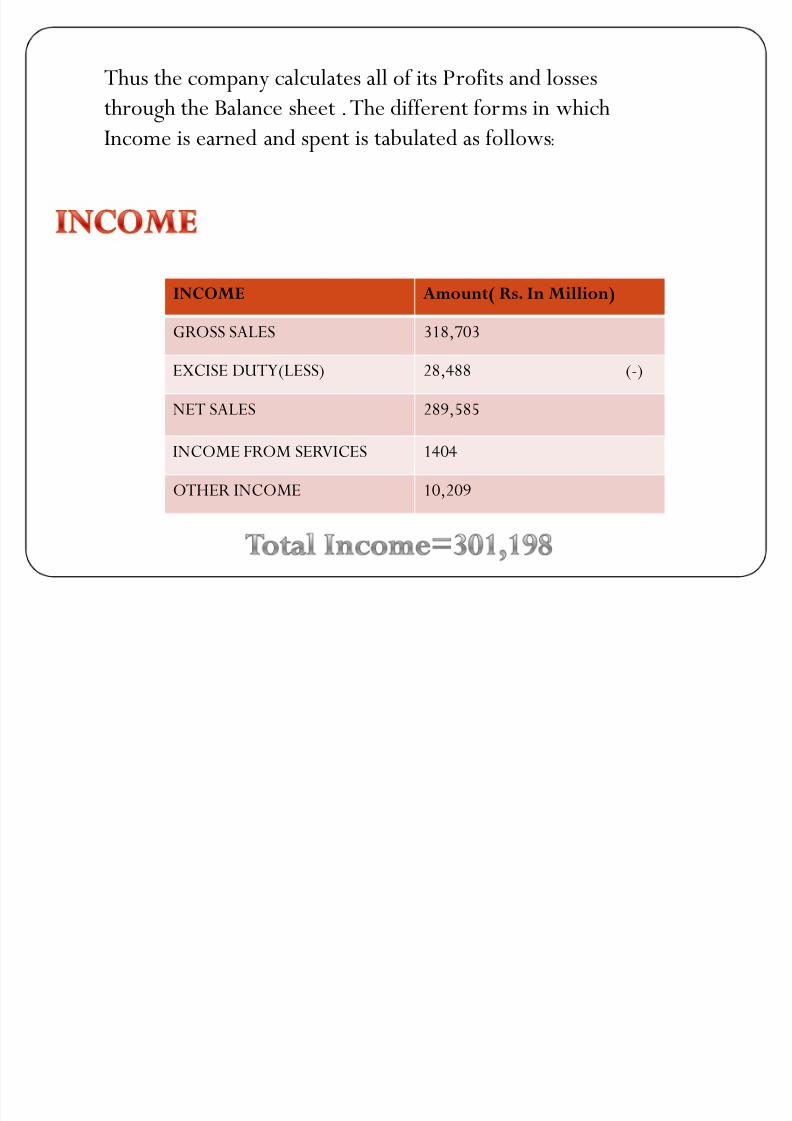
INCOME Amount( Rs. In Million)
GROSS SALES 318,703
EXCISE DUTY(LESS) 28,488 (-)
NET SALES 289,585
INCOME FROM SERVICES 1404
OTHER INCOME 10,209
Thus the company calculates all of its Profits and losses
through the Balance sheet . The different forms in which
Income is earned and spent is tabulated as follows:
8/7/2019 Balance Sheets ,Income and Trade Analysis
http://slidepdf.com/reader/full/balance-sheets-income-and-trade-analysis 8/27
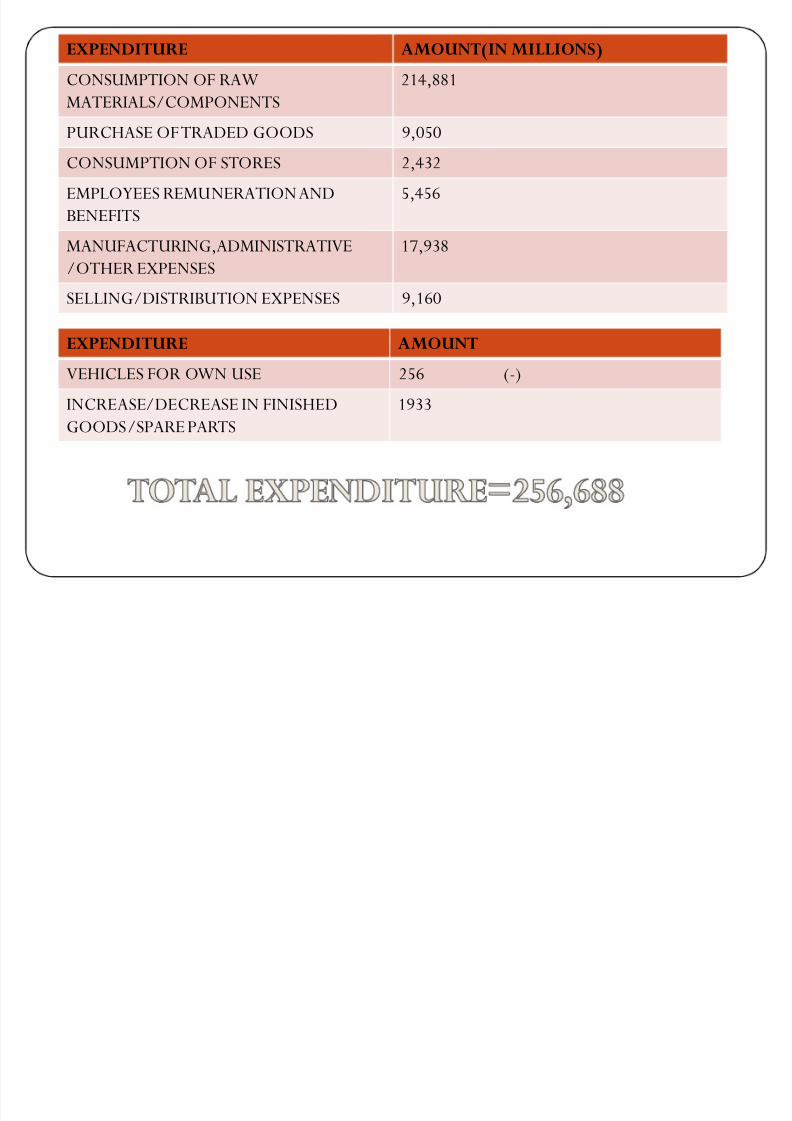
EXPENDITURE AMOUNT(IN MILLIONS)
CONSUMPTION OF RAW
MATERIALS/COMPONENTS
214,881
PURCHASE OFTRADED GOODS 9,050CONSUMPTION OF STORES 2,432
EMPLOYEES REMUNERATION AND
BENEFITS
5,456
MANUFACTURING,ADMINISTRATIVE
/OTHER EXPENSES
17,938
SELLING/DISTRIBUTION EXPENSES 9,160
EXPENDITURE AMOUNT
VEHICLES FOR OWN USE 256 (-)
INCREASE/DECREASE IN FINISHEDGOODS/SPARE PARTS 1933
8/7/2019 Balance Sheets ,Income and Trade Analysis
http://slidepdf.com/reader/full/balance-sheets-income-and-trade-analysis 9/27
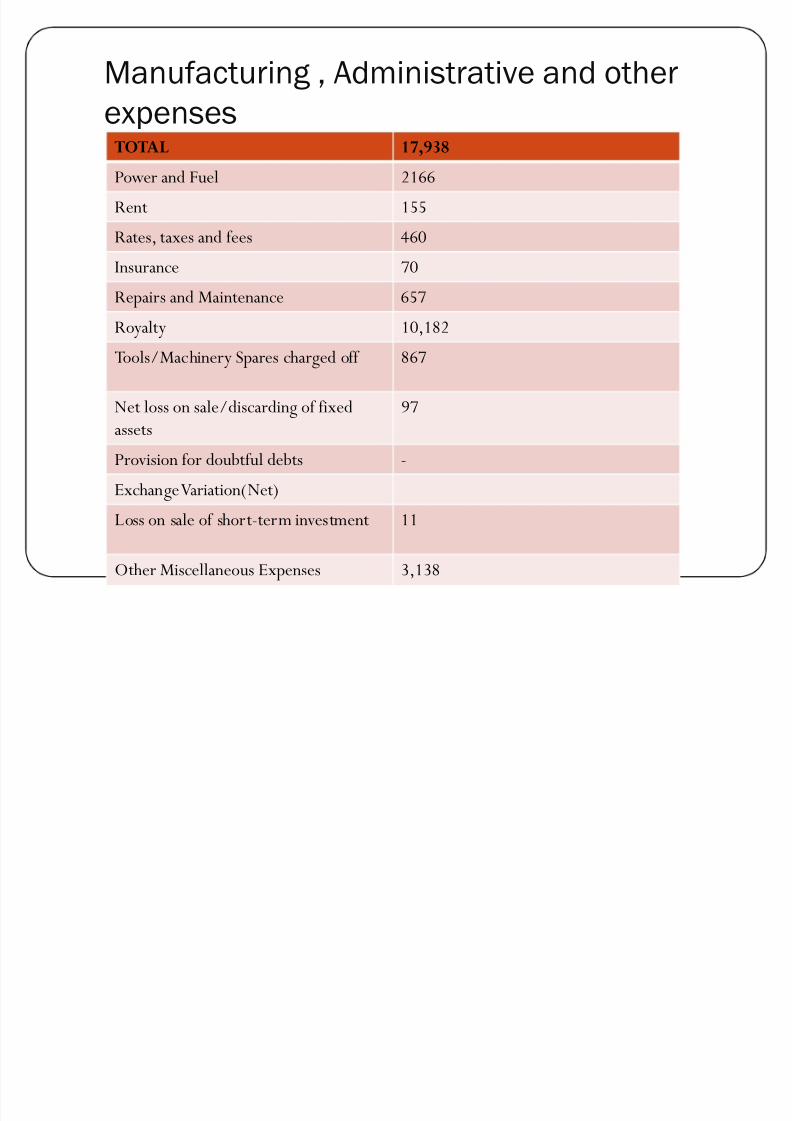
Manufacturing , Administrative and other
expensesTOTAL 17,938
Power and Fuel 2166
Rent 155
Rates, taxes and fees 460
Insurance 70Repairs and Maintenance 657
Royalty 10,182
Tools/Machinery Spares charged off 867
Net loss on sale/discarding of fixedassets 97
Provision for doubtful debts -
Exchange Variation(Net)
Loss on sale of short-term investment 11
Other Miscellaneous Expenses 3,138
8/7/2019 Balance Sheets ,Income and Trade Analysis
http://slidepdf.com/reader/full/balance-sheets-income-and-trade-analysis 10/27
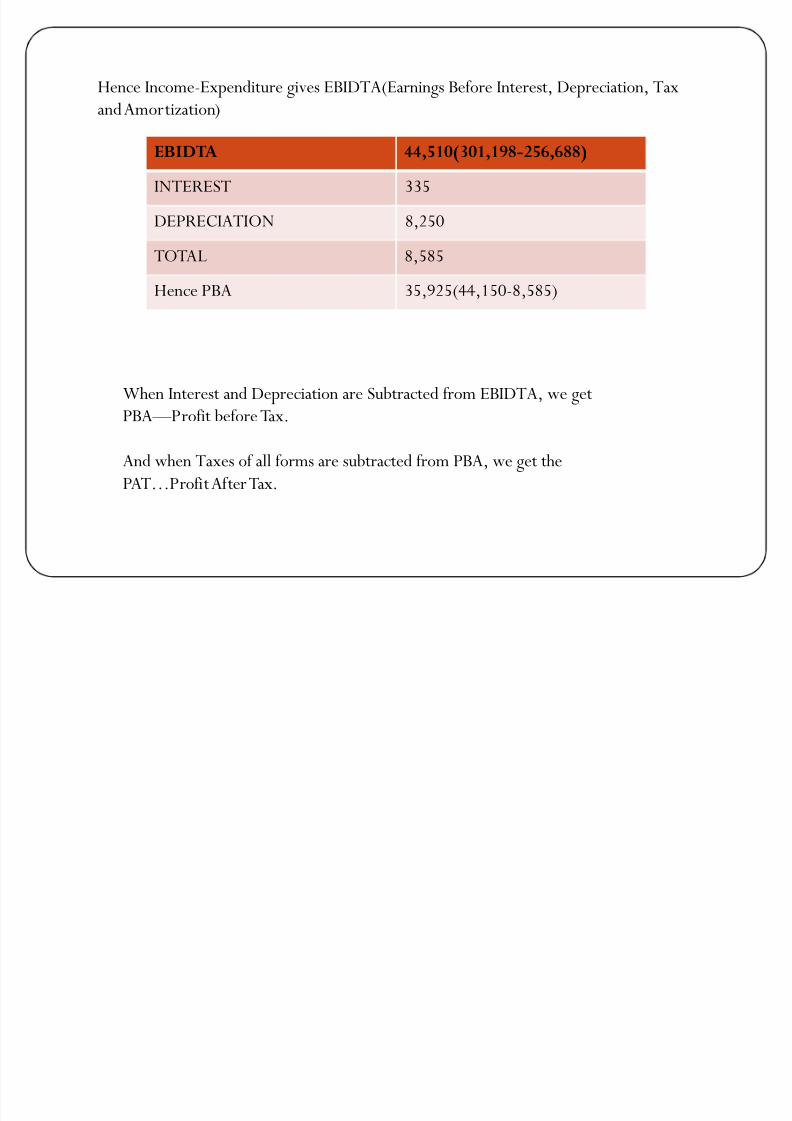
EBIDTA 44,510(301,198-256,688)
INTEREST 335
DEPRECIATION 8,250
TOTAL 8,585
Hence PBA 35,925(44,150-8,585)
Hence Income-Expenditure gives EBIDTA(Earnings Before Interest, Depreciation, Tax
and Amortization)
When Interest and Depreciation are Subtracted from EBIDTA, we get
PBA³Profit before Tax.
And when Taxes of all forms are subtracted from PBA, we get the
PAT«Profit After Tax.
8/7/2019 Balance Sheets ,Income and Trade Analysis
http://slidepdf.com/reader/full/balance-sheets-income-and-trade-analysis 11/27
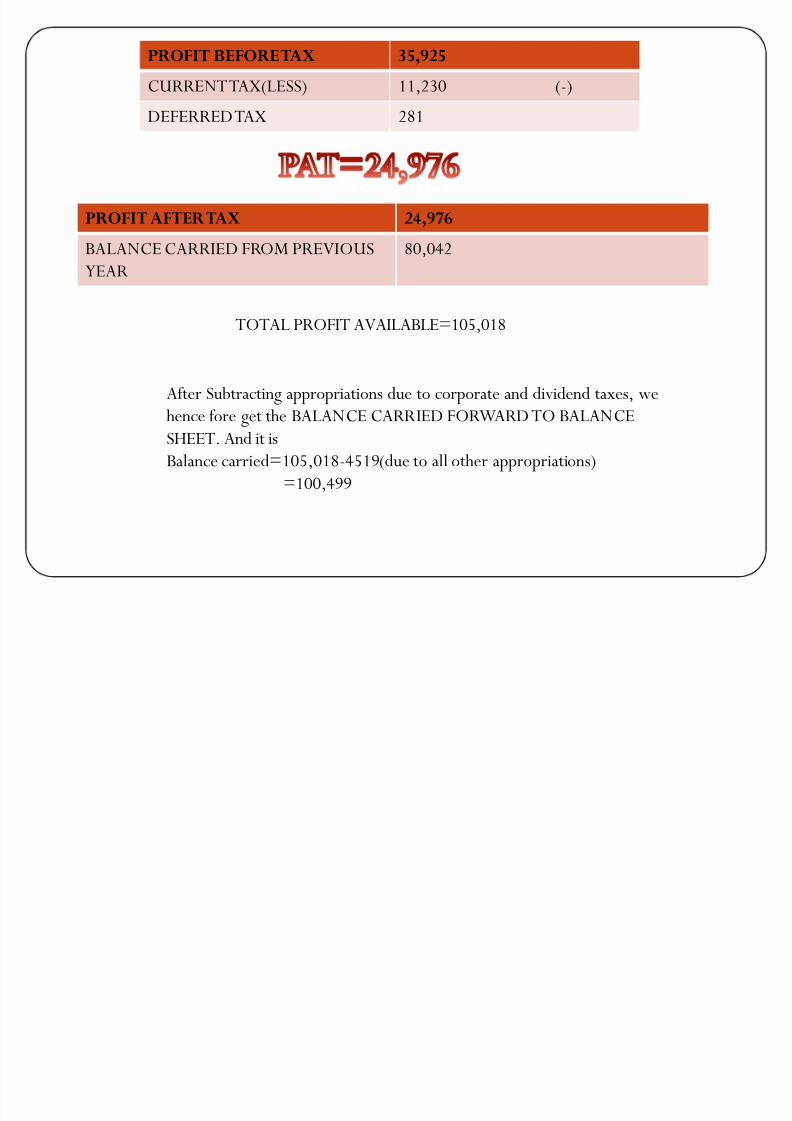
PROFIT BEFORE TAX 35,925
CURRENT TAX(LESS) 11,230 (-)
DEFERRED TAX 281
PROFIT AFTER TAX 24,976
BALANCE CARRIED FROM PREVIOUS
YEAR
80,042
TOTAL PROFIT AVAILABLE=105,018
After Subtracting appropriations due to corporate and dividend taxes, we
hence fore get the BALANCE CARRIED FORWARD TO BALANCESHEET. And it is
Balance carried=105,018-4519(due to all other appropriations)
=100,499
8/7/2019 Balance Sheets ,Income and Trade Analysis
http://slidepdf.com/reader/full/balance-sheets-income-and-trade-analysis 12/27
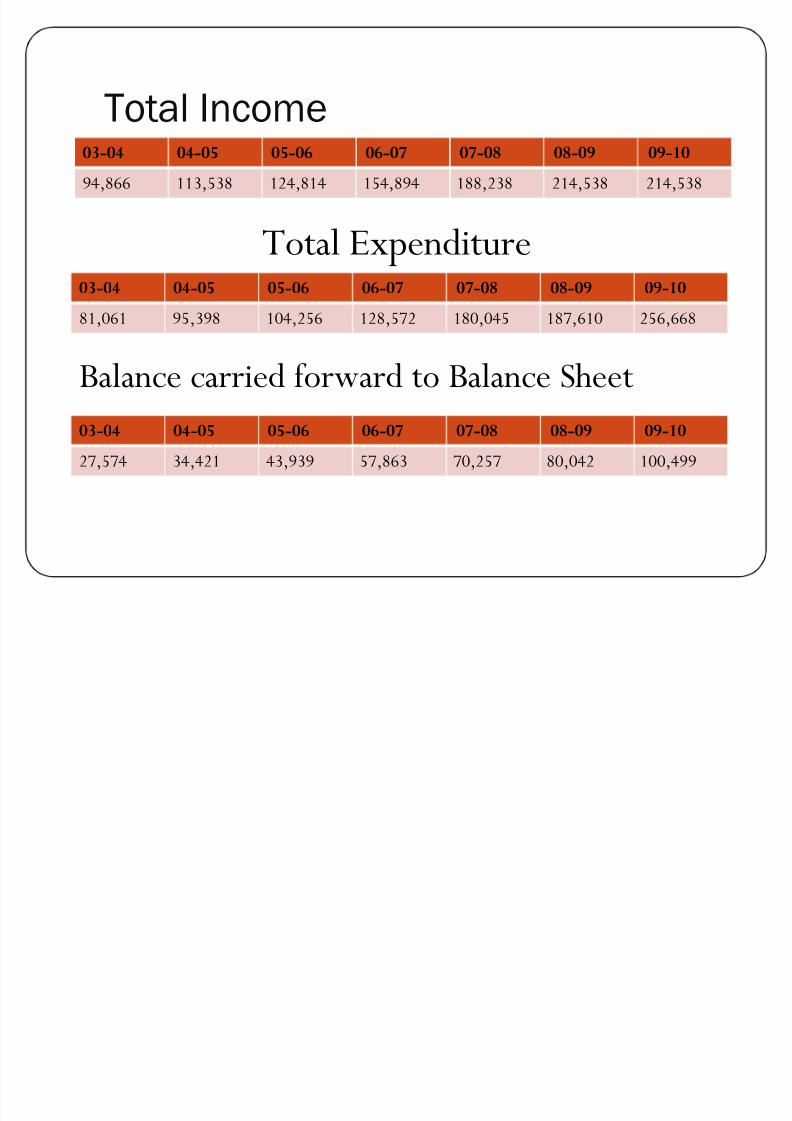
Total Income03-04 04-05 05-06 06-07 07-08 08-09 09-10
94,866 113,538 124,814 154,894 188,238 214,538 214,538
Total Expenditure03-04 04-05 05-06 06-07 07-08 08-09 09-10
81,061 95,398 104,256 128,572 180,045 187,610 256,668
Balance carried forward to Balance Sheet
03-04 04-05 05-06 06-07 07-08 08-09 09-10
27,574 34,421 43,939 57,863 70,257 80,042 100,499
8/7/2019 Balance Sheets ,Income and Trade Analysis
http://slidepdf.com/reader/full/balance-sheets-income-and-trade-analysis 13/27
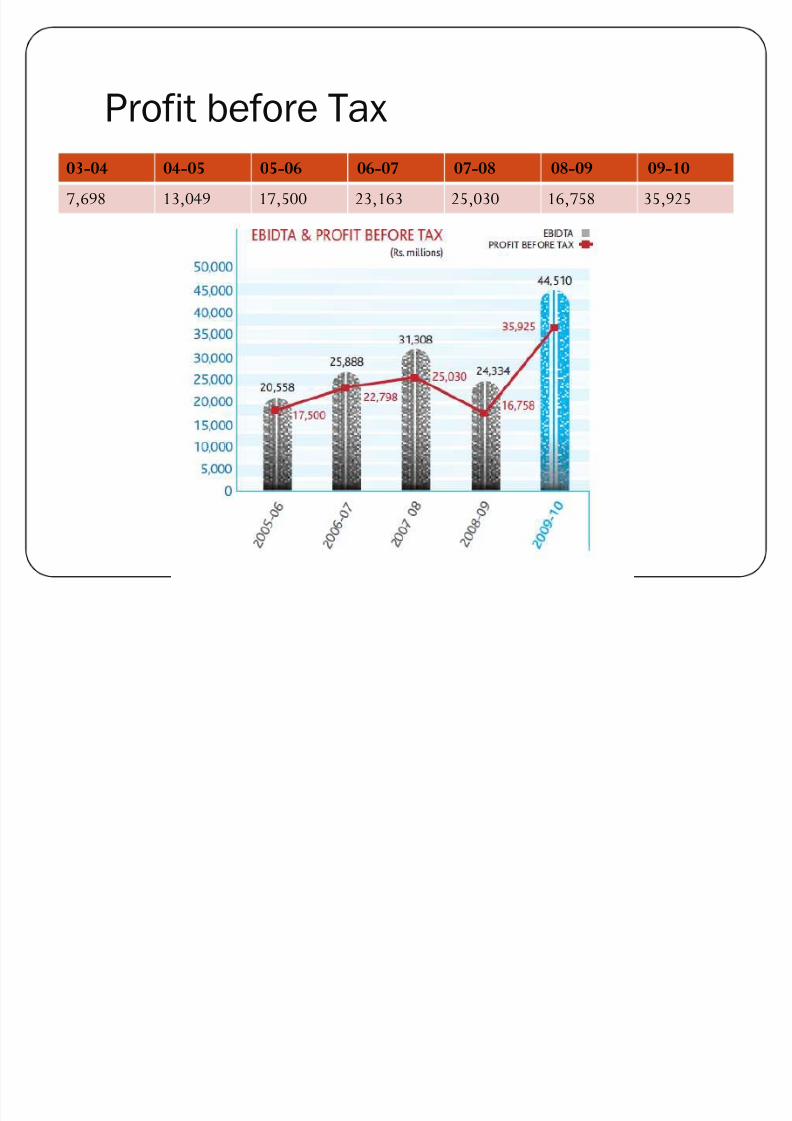
Profit before Tax
03-04 04-05 05-06 06-07 07-08 08-09 09-10
7,698 13,049 17,500 23,163 25,030 16,758 35,925
8/7/2019 Balance Sheets ,Income and Trade Analysis
http://slidepdf.com/reader/full/balance-sheets-income-and-trade-analysis 14/27
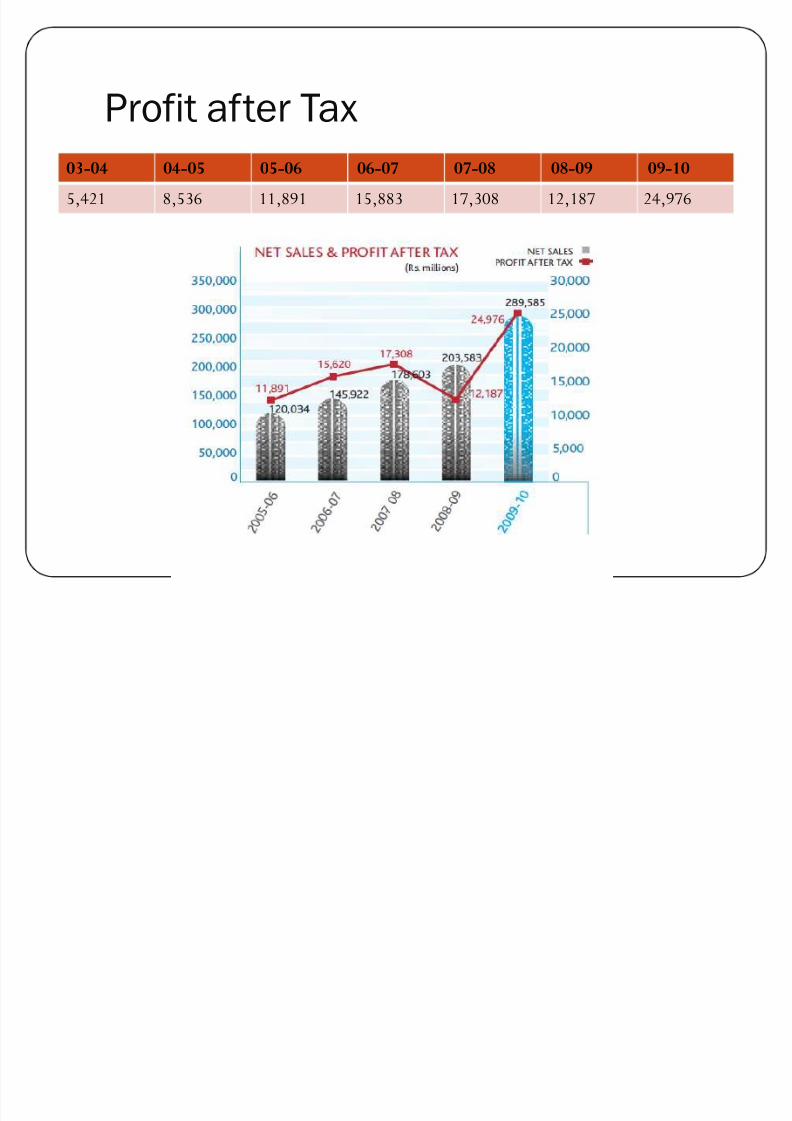
Profit after Tax
03-04 04-05 05-06 06-07 07-08 08-09 09-10
5,421 8,536 11,891 15,883 17,308 12,187 24,976
8/7/2019 Balance Sheets ,Income and Trade Analysis
http://slidepdf.com/reader/full/balance-sheets-income-and-trade-analysis 15/27
DIVIDENDS and BOOK VALUE
y Every company issues dividend upon its profits to its
shareholders.
y In the Profit After Tax, the company reserves a particular
amount to distribute amongst its shareholders.y Balance carried over to next year= PAT-(Proposed
Dividend+Corporate Dividend Tax+Other appropriations)
y This carried balance counts over to the reserves and surplus
and thus adds to the Book Value.
8/7/2019 Balance Sheets ,Income and Trade Analysis
http://slidepdf.com/reader/full/balance-sheets-income-and-trade-analysis 16/27
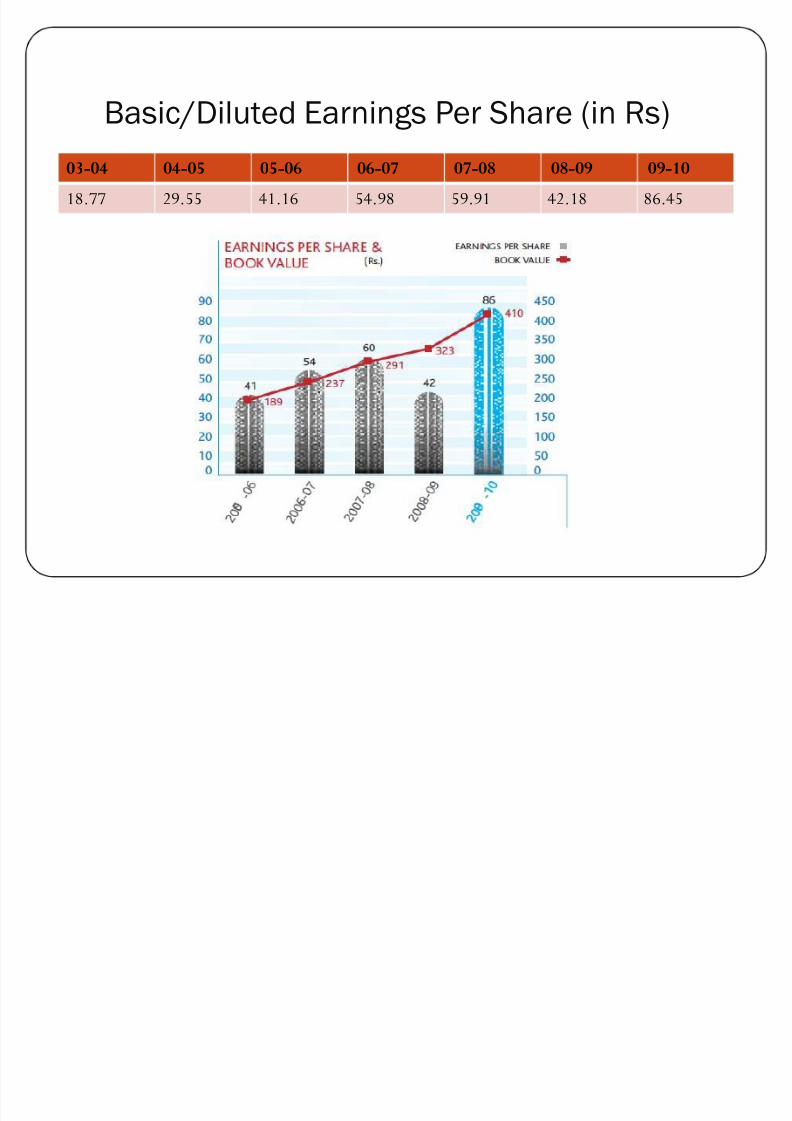
Basic/Diluted Earnings Per Share (in Rs)
03-04 04-05 05-06 06-07 07-08 08-09 09-10
18.77 29.55 41.16 54.98 59.91 42.18 86.45
8/7/2019 Balance Sheets ,Income and Trade Analysis
http://slidepdf.com/reader/full/balance-sheets-income-and-trade-analysis 17/27
SALES AND COMPETITIVENESS
DOMESTIC MARKET
8/7/2019 Balance Sheets ,Income and Trade Analysis
http://slidepdf.com/reader/full/balance-sheets-income-and-trade-analysis 18/27
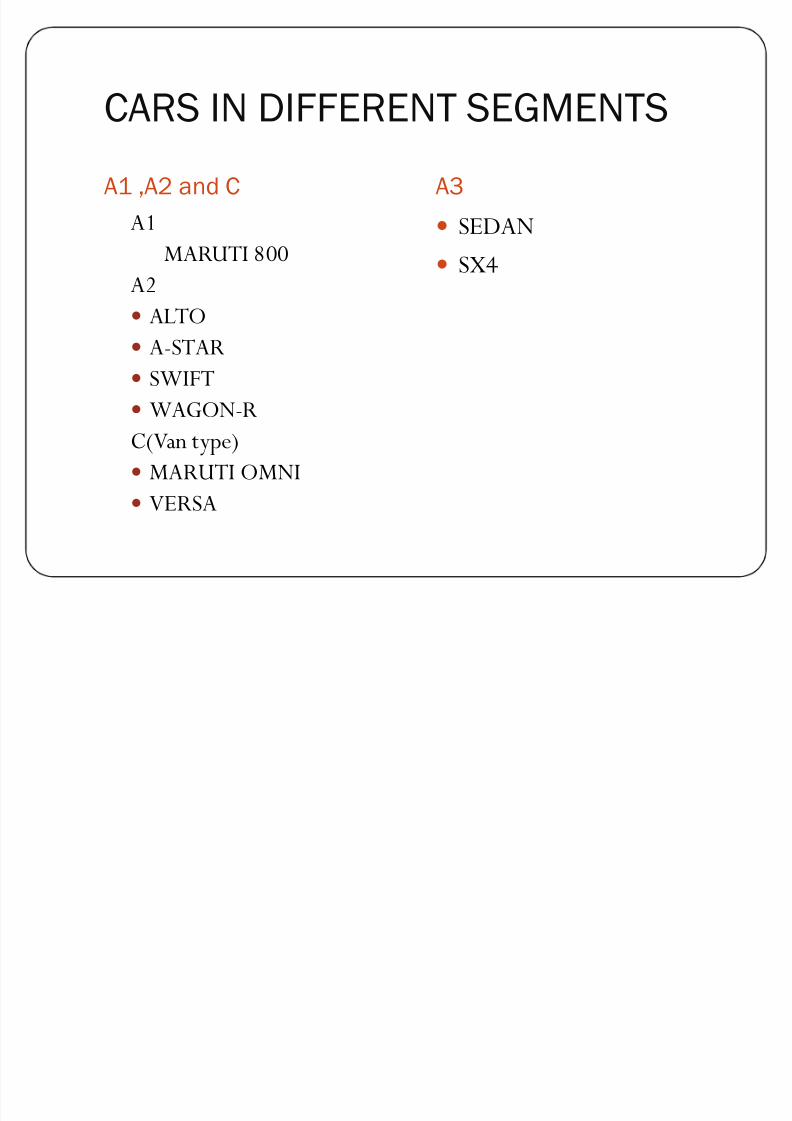
CARS IN DIFFERENT SEGMENTS
A1 ,A2 and C A3
A1
MARUTI 800
A2y ALTO
y A-STAR
y SWIFT
y
WAGON-RC(Van type)
y MARUTI OMNI
y VERSA
y SEDAN
y
SX4
8/7/2019 Balance Sheets ,Income and Trade Analysis
http://slidepdf.com/reader/full/balance-sheets-income-and-trade-analysis 19/27
8/7/2019 Balance Sheets ,Income and Trade Analysis
http://slidepdf.com/reader/full/balance-sheets-income-and-trade-analysis 20/27
8/7/2019 Balance Sheets ,Income and Trade Analysis
http://slidepdf.com/reader/full/balance-sheets-income-and-trade-analysis 21/27
8/7/2019 Balance Sheets ,Income and Trade Analysis
http://slidepdf.com/reader/full/balance-sheets-income-and-trade-analysis 22/27
8/7/2019 Balance Sheets ,Income and Trade Analysis
http://slidepdf.com/reader/full/balance-sheets-income-and-trade-analysis 23/27
EXPORTS AND COMPETITORS
INTERNATIONAL MARKETS
8/7/2019 Balance Sheets ,Income and Trade Analysis
http://slidepdf.com/reader/full/balance-sheets-income-and-trade-analysis 24/27
8/7/2019 Balance Sheets ,Income and Trade Analysis
http://slidepdf.com/reader/full/balance-sheets-income-and-trade-analysis 25/27
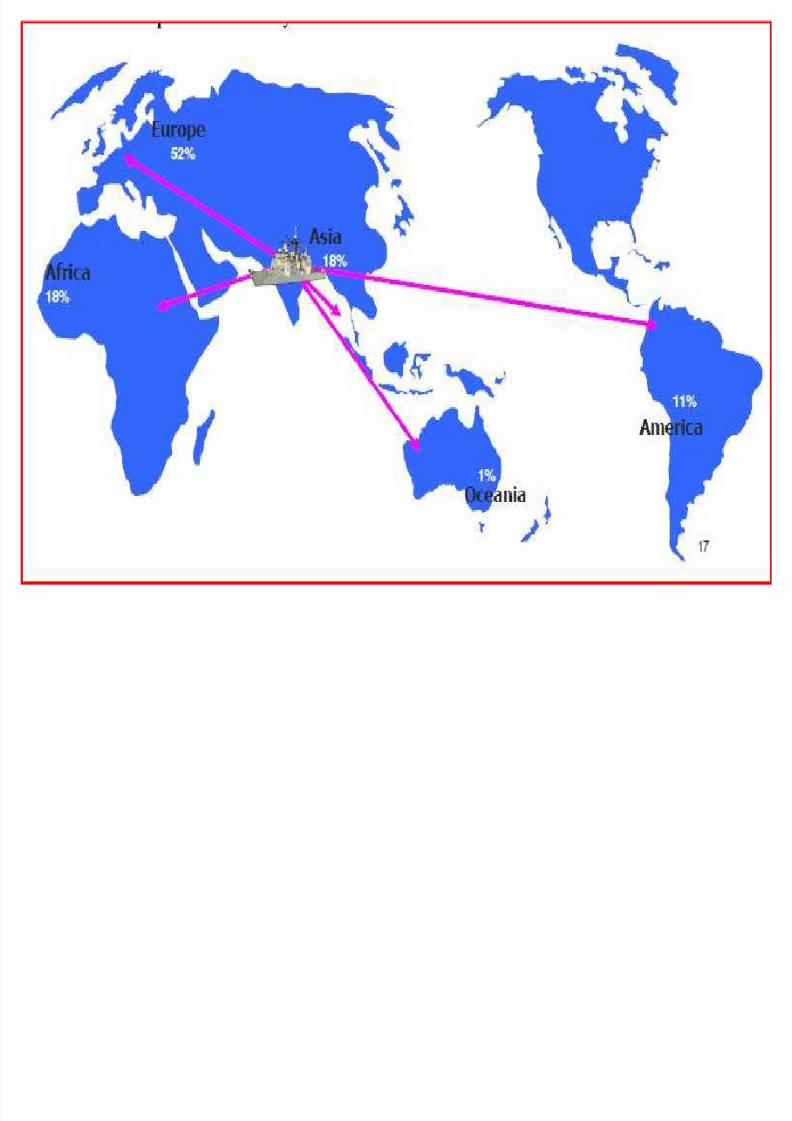
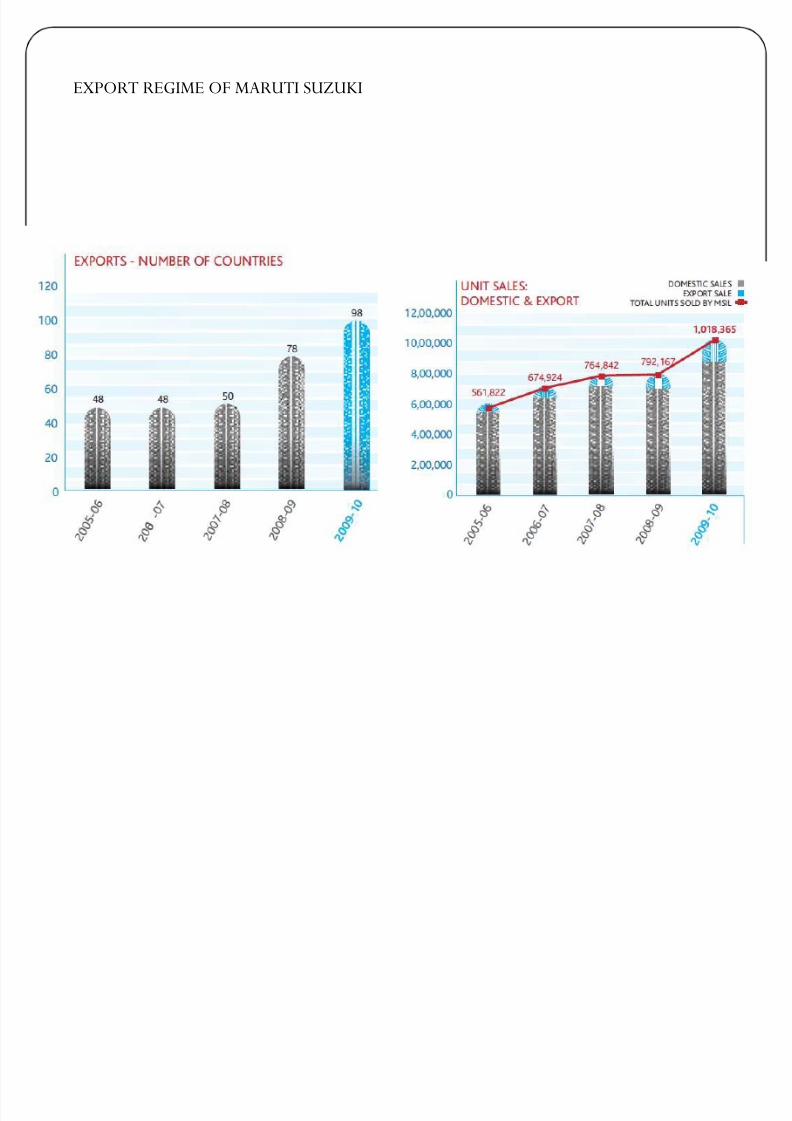
EXPORT REGIME OF MARUTI SUZUKI
8/7/2019 Balance Sheets ,Income and Trade Analysis
http://slidepdf.com/reader/full/balance-sheets-income-and-trade-analysis 26/27
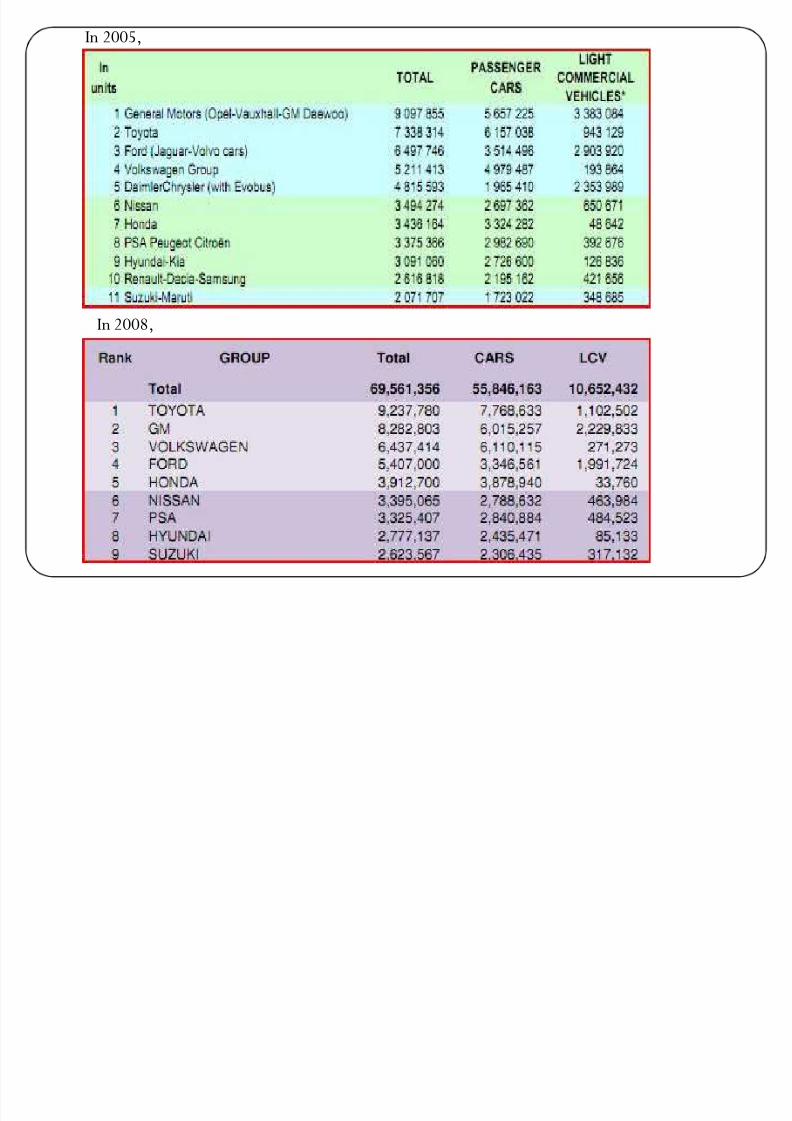
In 2005,
In 2008,
8/7/2019 Balance Sheets ,Income and Trade Analysis
http://slidepdf.com/reader/full/balance-sheets-income-and-trade-analysis 27/27
THANK YOU


