21
Balancing Global Olefins Capacity and Demand Asian Petrochemical Market Conference Shanghai, China 19 th Apr 2017 Rajesh Rawat 1

Balancing Global Olefins Capacity and Demand
Asian Petrochemical Market Conference Shanghai, China
19th Apr 2017
Rajesh Rawat
1

Contents
2
Reliance at a Glance
Olefins – Changing Dynamics
New Capacities and Demand drivers
Regional Olefins Trade

Reliance at a Glance
3
India’s largest private company.
Global player in integrated energy value chain.
Growing presence in retail & digital services.
US$ 44.7 Billion Annual Revenue
US$ 4.2 Billion Net Profit (FY 15-16)
151 Major products & brands
Jio : fastest growing 4G network in India
2nd
Global Rankings
Polyester
PTA
PX
PP
MEG
4th
6th
6th
8th

Major Projects under implementation in Reliance
4
Ethane Feed Flexibility in Crackers
6 Nos VLEC (Very Large Ethane Carriers).
Cryogenic Storage & handling facility in India.
Provide feed security to Crackers with Minor increase in Ethylene capacity.
Cross Country pipeline (480 km) to transport Ethane across Reliance’s sites.
Refinery Offgas Cracker with PE & MEG
1.5 Million MT/yr Cracker using Refinery Offgas as feed integrates Refinery with Petrochemical Complex
Downstream LLDPE, LDPE & MEG Capacities
Coke Gasification in Refinery
Additional 2.2 Million MTA PX capacity

5
Olefins – Changing Dynamics

Raw Material Prices
6
US, post Shale, is now largest producer of oil (>12 mbbl/d) & has kept Nat Gas and Ethane prices low in US.
Fall in Crude prices has direct implication for Petchem Feedstocks
Low price stimulates demand apart from making production competitive.
0
20
40
60
80
100
120
0
200
400
600
800
1000
1200
Jan
-13
Ap
r-1
3
Jul-
13
Oct
-13
Jan
-14
Ap
r-1
4
Jul-
14
Oct
-14
Jan
-15
Ap
r-1
5
Jul-
15
Oct
-15
Jan
-16
Ap
r-1
6
Jul-
16
Oct
-16
Jan
-17
$/bbl$/MT Naphtha SG US Propane Crude Brent
US – Nat Gas ($/mmbtu)
Source: Platts

Changes in US Olefins Business
7
Ethylene Margin in US Crackers is going down
New Ethane Crackers are under Construction
0
500
1000
1500
2000
2500
3000
0
200
400
600
800
1000
1200
Jan
-14
Mar
-14
May
-14
Jul-
14
Sep
-14
No
v-1
4
Jan
-15
Mar
-15
May
-15
Jul-
15
Sep
-15
No
v-1
5
Jan
-16
Mar
-16
May
-16
Jul-
16
Sep
-16
No
v-1
6
Jan
-17
Mar
-17
KT/m$/MTPropane exports from US
US Propane Export Saudi CP US Price
Increasing US Propane Exports
New PDH Capacity starting in US
Source: PlattsSource: RIL Working/IHS
0
200
400
600
800
1000
1200
1400
Jan
-13
Mar
-13
May
-13
Jul-
13
Sep
-13
No
v-1
3
Jan
-14
Mar
-14
May
-14
Jul-
14
Sep
-14
No
v-1
4
Jan
-15
Mar
-15
May
-15
Jul-
15
Sep
-15
No
v-1
5
Jan
-16
Mar
-16
May
-16
Jul-
16
Sep
-16
No
v-1
6
Jan
-17
Mar
-17
$/MTEthylene Cash Cost in US
NA Margin (Wt Avg) Ethane (70%) Propane (15%) Naphtha (5%)
Cracker Feed
8
Source: RIL Working
0
100
200
300
400
500
600
700
800
900
-200
0
200
400
600
800
Jan-0
0
Jan-0
1
Jan-0
2
Jan-0
3
Jan-0
4
Jan-0
5
Jan-0
6
Jan-0
7
Jan-0
8
Jan-0
9
Jan-1
0
Jan-1
1
Jan-1
2
Jan-1
3
Jan-1
4
Jan-1
5
Jan-1
6
Jan-1
7
Jan-1
8
Jan-1
9
Jan-2
0
Jan-2
1
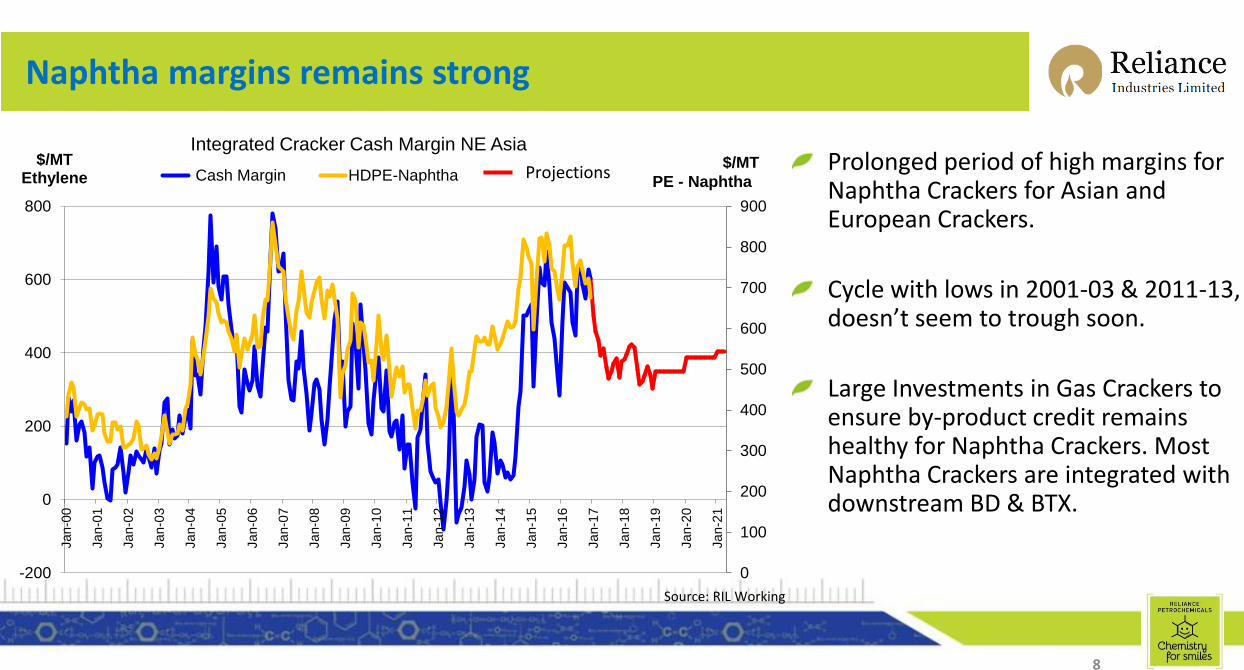
$/MT Ethylene
Integrated Cracker Cash Margin NE Asia
Cash Margin HDPE-Naphtha Projections$/MT
PE - Naphtha
Naphtha margins remains strong
Prolonged period of high margins for Naphtha Crackers for Asian and European Crackers.
Cycle with lows in 2001-03 & 2011-13, doesn’t seem to trough soon.
Large Investments in Gas Crackers to ensure by-product credit remains healthy for Naphtha Crackers. Most Naphtha Crackers are integrated with downstream BD & BTX.

Cracker Feedstock
9
-
5
10
15
20
25
30
35
2011 2016
Mn MT North America
Coal to Olefins Methanol to Propylene
Methanol to Olefins Gas Oil
Naphtha Butane
Propane Ethane
-
5
10
15
20
25
2011 2016
West Europe
-
5
10
15
20
25
30
35
40
45
2011 2016
NE Asia
US Crackers are predominantly Ethane/Propane after plentiful
supply post Shale revolution
Europe, mainly Naphtha, is now importing Ethane from US
NEA relies on Naphtha with some capacity now from MTO/CTO
Ethane40%
Propane9%
Butane5%
Naphtha37%
Gas Oil3%
Methanol to Olefins
2%Methanol
to Propylene
0.06%
Coal to Olefins
3%
Others1%
World: 2021 Ethylene Production by Feedstock
Source: IHS © 2016 IHS
Production = 174.7 Million Metric Tons
36% in
2016
43% in
2016

Cash Cost Curve for Crackers
10
Cost Curve is flattening
0
200
400
600
800
1000
1200
1400
1600
0 20 40 60 80 100 120 140 160
Apr-13 Dec-14 Mar-17JKT & European
Naphtha Crackers
CTO &
MTO
Middle EastGas Crackers
Asian Naphtha Crackers
US Gas Crackers
Cash Cost Curve$/MT
Million MT
1000
500
@ 100 $/bblCrude
@ 50 $/bblCrude

11
New Capacities & Demand Drivers

US Capacity additions
12
6 Million MT of Low Cost (Ethane) capacity in US by 2018
Ethylene Downstream capacity by 2018 is 4.5 Mn MT and
would result in lower Op rate of Crackers in US.
No new Crackers envisaged in Mid East.
Company LocationEthylene
Cap KTA
Start-up
Estimates
Oxy/Mexichem JV Ingleside, TX 550 Started
Dow Freeport, TX 1,500 Q3 2017
Chevron Phillips Cedar Bayou, TX 1,500 Q4 2017
ExxonMobil Baytown, TX 1,500 Q1/Q2 2018
FPC USA Point Comfort, TX 1,150 Q4 2018
Shin Etsu Plaquemine, LA 500 2019
SASOL Lake Charles, LA 1,550 2019
Shell Pennsylvania 1,500 2020
Propylene
750 KTA PDH by Enterprise in Q2 2017 without
downstream Polymers would result in surplus
Propylene in US
On Purpose Propylene Production is around 20%
of overall propylene Globally and is expected to
rise to 25% by 2020
US Production of Butadiene is now lower by 30%
from pre 2014 as feed gets lighter.

India Capacity additions
13
Country is doubling its Ethylene capacity after
completion of these projects.
No major plans in Propylene expansions.
New Capacities are with mix feed
OPaL is dual feed while BRPL has Naphtha feed
GAIL & RIL Crackers are Gas based
India is surplus in Naphtha – New Naphtha
Cracker may be expected beyond 2020
Company LocationEthylene
Cap KTA
Start-up
Estimates
BRPL Assam 220 Started 2016
OPaL Dahej, Gujarat 1,100 Started 2016
GAIL Auraiya, UP 450Started – under
stabilisation
Reliance Jamnagar, Gujarat 1,550 Q2 2017
No major capacity planned in the Mid-East, but Iran may start producing in future with gas availability

China Capacity additions
14
Around 1.9 Mn MT/yr capacity CTO plants are
commissioned, but operating at lower capacity
More than 4 Mn MT/yr of MTO & CTO based
capacity addition planned in China
Some delays expected as economic viability for
these projects is challenged, so are issues with
Environment and Water stress.
China – CTO LocationEthylene
Cap KTA
Start-up
Estimates
Zongtiang Hechuang 2 Erdos 300 2017
SXY CPC Yan'an Yan'an 450 2018
Zhong'an Coal Chem Huainan 300 2019
Quinghai Damie Xining 200 2019
Shanxi Coking Corp Hongtong 300 2020
Yulin Energy & Chem Jingbian 300 2020
Baotou Shenua Baotao 300 2020
CPI / Total JV Erdos 330 2020
Quinghai Mining Haixi 270 2020
Apart from above, CNOOC Shell 1000 KTA & Shenhua 450 KTA Naphtha Crackers will be added in 2017

Demand Drivers - Ethylene
15
Polyethylene dominates the demand for Ethylene and is growing faster (4%) for its use in packaging & non durable applications. LLDPE demand growth leads with nearly 5% growth projections.
MEG too has robust growth (3%) for its use in Polyester fibres, PET, Antifreeze, etc
PVC has high growth (2.5%) in developing countries for its application in pipes, PVC films & Coatings.
Asia with high GDP countries is largest demand center. Overall we need nearly 5.5 – 6 Mn MT/yr of Ethylene for its derivatives.
Crackers to run at high Op Rate in mid term.
50%
60%
70%
80%
90%
100%
0.0
50.0
100.0
150.0
200.0
250.0
11 12 13 14 15 16 17 18 19 20
Alpha Olefins (3.9/4.2) Ethylbenzene (0.4/1.9)
EDC (0.7/2.3) Ethylene Oxide (3.0/3.0)
HDPE (3.4/3.9) LDPE (2.2/2.6)
LLDPE (5.1/4.7) Vinyl Acetate (1.5/2.2)
Other (3.0/2.7) Operating Rate
World: Ethylene Demand
Source: IHS © 2016 IHS(% AAGR = 11-16/16-26)
Forecast
Op
era
tin
gR
ate
Mil
lio
n M
etr
ic T
on
s
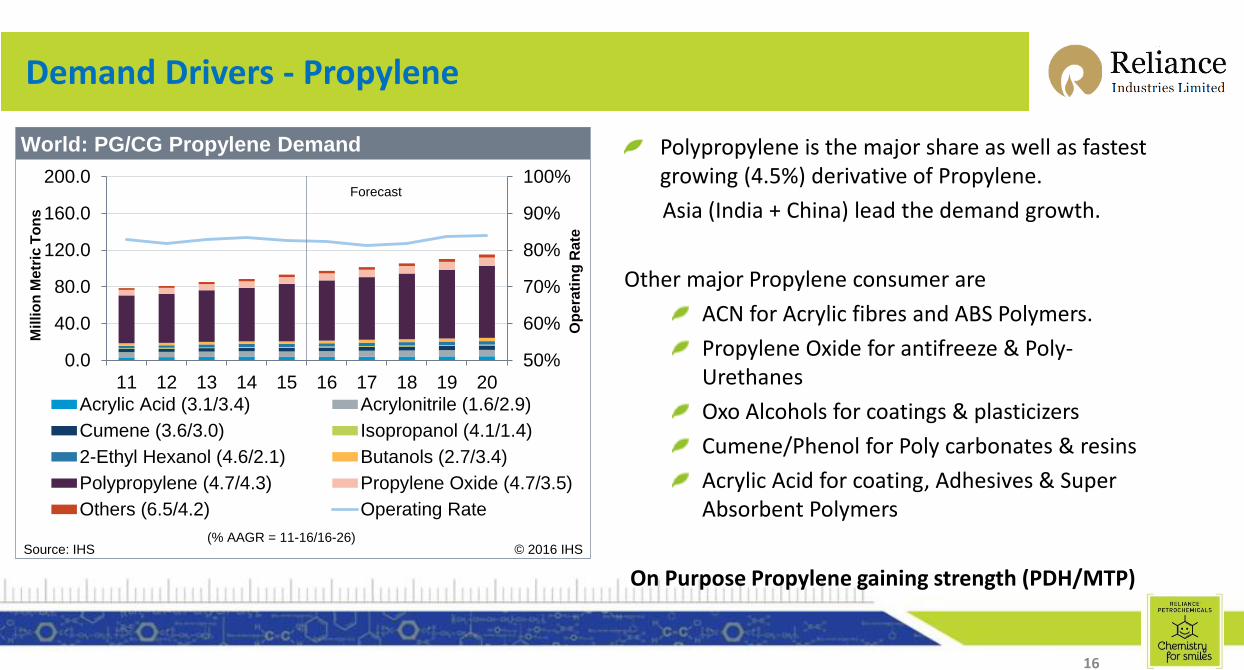
Demand Drivers - Propylene
16
Polypropylene is the major share as well as fastest growing (4.5%) derivative of Propylene.
Asia (India + China) lead the demand growth.
Other major Propylene consumer are
ACN for Acrylic fibres and ABS Polymers.
Propylene Oxide for antifreeze & Poly-Urethanes
Oxo Alcohols for coatings & plasticizers
Cumene/Phenol for Poly carbonates & resins
Acrylic Acid for coating, Adhesives & Super Absorbent Polymers
On Purpose Propylene gaining strength (PDH/MTP)
50%
60%
70%
80%
90%
100%
0.0
40.0
80.0
120.0
160.0
200.0
11 12 13 14 15 16 17 18 19 20
Acrylic Acid (3.1/3.4) Acrylonitrile (1.6/2.9)
Cumene (3.6/3.0) Isopropanol (4.1/1.4)
2-Ethyl Hexanol (4.6/2.1) Butanols (2.7/3.4)
Polypropylene (4.7/4.3) Propylene Oxide (4.7/3.5)
Others (6.5/4.2) Operating Rate
World: PG/CG Propylene Demand
Source: IHS © 2016 IHS(% AAGR = 11-16/16-26)
Forecast
Op
era
tin
gR
ate
Mil
lio
n M
etr
ic T
on
s

17
Regional Olefins Trade
Ethylene Trade
18
-2.0
-1.5
-1.0
-0.5
0.0
0.5
1.0
1.5
2.0
11 12 13 14 15 16 17 18 19 20
N. America S. America W. Europe C. Europe CIS & Baltics
Africa Middle East Indian Subc. NE Asia SE Asia
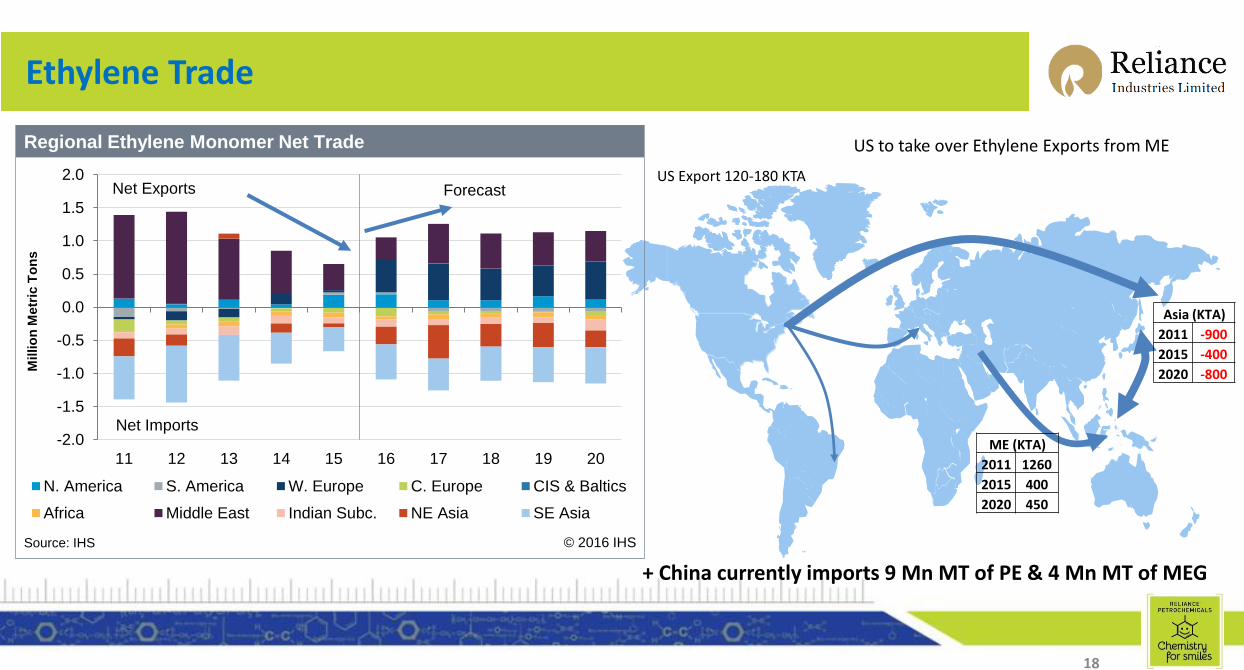
Regional Ethylene Monomer Net Trade
Forecast
Millio
n M
etr
ic T
on
s
Net Imports
Net Exports
Source: IHS © 2016 IHS
+ China currently imports 9 Mn MT of PE & 4 Mn MT of MEG
ME (KTA)
2011 1260
2015 400
2020 450
Asia (KTA)
2011 -900
2015 -400
2020 -800
US Export 120-180 KTA
US to take over Ethylene Exports from ME

Propylene Trade
19
-1.5
-1.0
-0.5
0.0
0.5
1.0
1.5
11 12 13 14 15 16 17 18 19 20
N. America S. America W. Europe C. Europe CIS & Baltics
Africa Middle East Indian Subc. NE Asia SE Asia
Regional PG/CG Propylene Net Trade
Forecast
Millio
n M
etr
ic T
on
s
Net Imports
Net Exports
Source: IHS © 2016 IHS
+ China imports 8 Mn MT of Propylene derivatives (PP)
ME (KTA)
2011 200
2015 350
2020 500
SEA (KTA)
2011 150
2015 -120
2020 100
NEA Short by -250KTADeficit high in 2016-2019
C EU (KTA)
2011 100
2015 100
2020 200

Key Concerns
20
Ethylene
Delay in New Ethylene Capacity addition and also delays in downstream capacities to impact S-D Balances & Trade flow and firms up Cracker Operating rates (87+) in mid-term.
Prolonged delays in CTO & MTO capacity would impact China’s Ethylene & derivatives balances
Lighter feedstock changing downstream Butadiene availability & high price fluctuations
Propylene
On-Purpose PDH in US without downstream capacity (PP or others) to impact Propylene trade flow in the mid-term
Price volatility due to high regional imbalance in the mid-term.
PDH competing with MTP in China – Low Cost Propane v/s higher cost Coal to Methanol or with imported Methanol


