53
Balancing New York State’s 2003- 2004 Budget in an Economically Sensible Manner February 2003 Fiscal Policy Institute www.fiscalpolicy.org

Balancing New York State’s 2003-2004 Budgetin an Economically Sensible Manner
February 2003
Fiscal Policy Institutewww.fiscalpolicy.org

How did we get a $9.3 billion dollar budget gap?
• It is not something that emerged out of the blue in the last few months
• It is not the result of excessive spending

Current services spending relative to the size of the economy has declined substantially since 1990.
6.8%
7.2%
7.6%
8.0%
8.4%
199019911992199319941995199619971998199920002001200220032004State Fiscal Year
Estimated SFY '03
Projected SFY '04
Spending from all state funds for current services, as a percent of personal income

Governor Pataki would have us believe that most of the budget gap is the result of
the attacks on the World Trade Center
YES and NO • YES, the WTC attacks adversely affected our tax
revenues. How much of the budget gap is attributable to to 9/11?
• NO -- not the most important. Impact of 9/11 pales in comparison to the bursting of two bubbles.
• Structural deficit due to overly generous tax cutting program
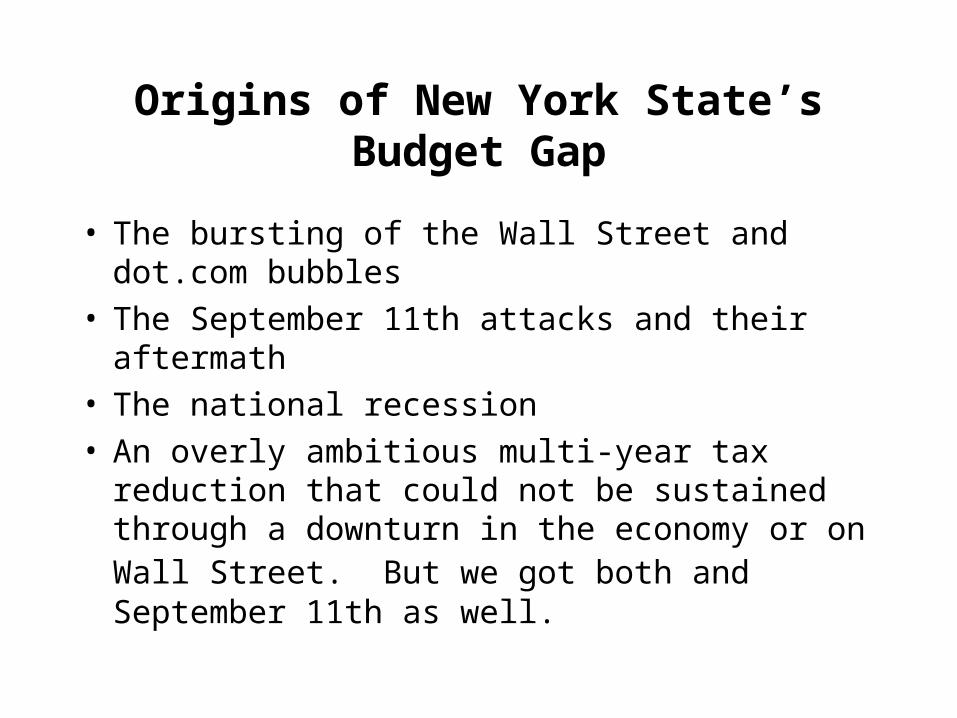
Origins of New York State’s Budget Gap
• The bursting of the Wall Street and dot.com bubbles
• The September 11th attacks and their aftermath• The national recession• An overly ambitious multi-year tax reduction that
could not be sustained through a downturn in the economy or on Wall Street. But we got both and September 11th as well.

AGI Capital Gains Wall Street Wages($ millions) ($ millions) ($ millions) ($ millions) ($ millions) ($ millions)
1991 $276,058 $8,735 $12,321 -7,369 -392 12,321 7.6%1992 $294,861 $9,457 $17,850 18,803 722 5,529 9.3% 33.2%1993 $297,112 $13,365 $18,572 2,251 3,908 722 10.7% 205.7%1994 $301,362 $12,032 $17,274 4,250 -1,333 -1,298 9.7% -61.9%1995 $321,124 $14,086 $20,187 19,762 2,054 2,913 10.7% 25.1%1996 $347,891 $22,441 $24,534 26,767 8,355 4,347 13.5% 47.5%1997 $383,179 $31,563 $28,790 35,288 9,122 4,256 15.8% 37.9%1998 $417,996 $38,929 $33,602 34,817 7,366 4,812 17.4% 35.0%1999 $453,130 $48,330 $35,116 35,134 9,401 1,514 18.4% 31.1%2000 $519,501 $63,302 $47,643 66,371 14,972 12,527 21.4% 41.4%2001 $489,413 $28,449 $48,758 -30,088 -34,853 1,115 15.8% 112.1%2002 $467,784 $17,111 $38,817 -21,629 -11,338 -9,941 12.0% 98.4%2003 $475,182 $14,649 $36,876 7,398 -2,462 -1,941 10.8% -59.5%
change, 1995-2000 $198,377 $49,216 $27,456 38.6%
change, 2000-2002 -$51,717 -$46,191 -$8,826 106.4%
Sources: AGI and Capital Gains from New York State Division of the Budget; 2001-2003 are DoB projections. Wall Street wages from NYS Department of Labor; 2002 and 2003 are projections by FPI.
Change from prior year
Wall Street pay and stock market-related capital gains accounted for nearly two-fifths of the growth in
New York's taxable personal income base, 1995-2000, but declines in 2001 and 2002 caused taxable income to fall.
Capital Gains and Wall Street Wages as
share of AGI
Capital Gains and Wall
Street Wages share of AGI Growth over Prior Year
Adjusted Gross Income (AGI)
Net Capital Gains
Total Wall Street Wages

The growth in the personal income tax base, primarily attributable to capital gains and Wall Street wages, compensated for the deep cuts in
other taxes.
$5
$10
$15
$20
$25
$30
1987 1988 1989 1990 1991 1992 1993 1994 1995 1996 1997 1998 1999 2000 2001 20022003 est2004 pro
State Fiscal Year
8.3%8.3%1.6%
10.5%-5.4%
3.3%7.1%
3.1%1.1%4.9%1.0%
3.1%
12.8%
12.9%
16.2%
-5.1%
-10.4%0.8%
PIT collections in billions, for all funds, before cash management transactions. Percent change from previous year shown on top of each bar.
Source: The information for 1987 through 2002 is from Comptroller's Annual Report to the legislature. The information for 2003 through 2004 areestimates from the Executive Budget.

The tax cuts enacted since 1994 will reduce state revenues
by more than $13.5 billion this year.
$0
$2
$4
$6
$8
$10
$12
$14
$16
1994-951995-961996-971997-981998-991999-002000-012001-022002-032003-042004-05 2005-6
$0.5
$1.4
$4.2
$6.1
$7.3
$9.0
$11.2
$12.1$12.8
$13.5
$14.4$14.7
Revenue impact, in billions of tax cuts enacted in 1994 through 2002.

Closing the 2003-04 Budget Gap: The Governor's Approach
• Multiyear --- sensible, given the magnitudes
• Two kinds of budget balancing actions – Relatively painless measures to reduce the size of
the gap: One-shots, additional federal aid, efficiencies and other actions that do not create an additional drag on the state's economy during the current recession.
– More painful measures: A mix of more painful budget cuts and revenue increases to close the remaining gap.

Executive Budget Proposals to Close the Budget Gap
SFY 2002-03 SFY 2003-04 SFY 2004-05 SFY 2005-06
Projected Base Level Gap $2,200 $9,264 $10,171 $11,080
Tobacco Securitization $1,500 $2,278 $400 $0Spending Restraint/Administrative Savings Actions $700 $5,638 $5,660 $5,696Revenue Increases $0 $1,348 $1,212 $1,148
Remaining Gap $0 $0 $2,899 $4,236
Spending Restraint Proposals
Savings in school aid $1,270Medicaid cost containment $1,020State operations savings $700 $1,000Welfare savings $587
Spending restraint in other local assistance programs $977Debt management actions $516Spending restraint in all other program areas $268
$5,638
($ Millions)
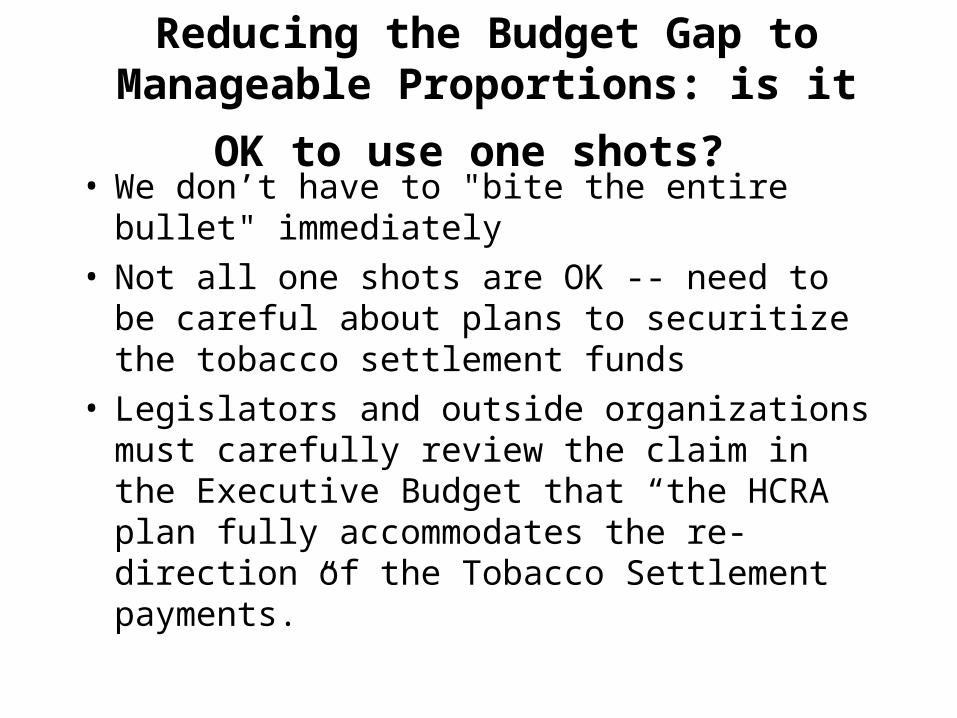
Reducing the Budget Gap to Manageable
Proportions: is it OK to use one shots? • We don’t have to "bite the entire bullet"
immediately • Not all one shots are OK -- need to be careful
about plans to securitize the tobacco settlement funds
• Legislators and outside organizations must carefully review the claim in the Executive Budget that “the HCRA plan fully accommodates the re-direction of the Tobacco Settlement payments.”

Four additional nonrecurring actions that should be considered:
• Official rainy day fund --- $710 million• Refund reserve account --- $500 million• State fiscal relief from the federal government --
$1.1 billion• Amendments to the Stafford Act - $3 billion

Making the Hard Choices
Governor Pataki proposes:
(1) about $4 of service cuts for every $1 of revenue increases
(2) revenue increase that he does propose are overwhelmingly increases in consumption and other regressive taxes and fees.

Economic Assertions and Myth History
The Governor attempts to justify these policy choices by
(1) asserting a relationship among taxes, government spending and the economy that is inconsistent with basic economic principles, and
(2) presenting a mythical and incorrect rendition of New York State’s economic history.

New York like most other states and cities has to balance its budgets during both good times and bad.
But the Governor and the Legislature must chose that mix of revenue increases and service cuts that will have the least negative effect on the economy.

Governor Pataki makes four mistakes. He:
(1) Incorrectly assumes/asserts that tax increases generally have a more negative effect on the economy than service cuts.
(2) Uses an implicit definition of what kinds of taxes are “job-killing” and what kinds are not which is inconsistent with basic economic principles.
(3) Forgets that both tax increases and service cuts can be “job killers.”
(4) Proposes some budget cuts which are really tax increases or tax shifts

Budget Cuts vs. Tax Increases at the State Level: Is One More Counter- Productive
than the Other During a Recession?,
• Joseph Stiglitz, winner of the 2001 Nobel Prize in Economics, and Peter Orszag of the Brookings Institution have explained: cuts in spending in the local economy have a more negative effect during an economic downturn than high end income tax increases.
• Basic Keynesian economics --- the impact of each dollar spent in the economy will be “multiplied” each time it is spent. The government and low-income households will spend 100% of money given it, high income consumers will spend only a portion.

Learning from History, Not Revising It.
The 2003-04 Executive Budget is premised on inaccurate renditions of New York's economic history.

2003 is just not like 1995.
In January of 1995, the national recession had been over for 3 and a half years and the New York State recession had been over for two years and two months. New York had experienced year-to-year job growth in both 1993 and 1994 and this trend continued until 2000.
The situation is vastly different today. We've had two years of serious job losses as a result of the World Trade Center attacks, the recession and the bursting of the stock market and dot-com bubbles. It is not clear if the national recession is over, and it is even more doubtful that the recession here in New York.

5,800
6,050
6,300
6,550
6,800
7,050
7,300
1981 1982 1983 1984 1985 1986 1987 1988 1989 1990 1991 1992 1993 1994 1995 1996 1997 1998 1999 2000 2001 2002
NYS seasonally adjusted private-sector nonagricultural employment, January 1981 to December 2002
In January 1995, New York State was well into a sustained 8-year recovery.
The state is now in a downturn of uncertain length.
January 1995

State fiscal policies did not drive the boom of the late 1990s
Governor Pataki claims that the budgetary policies that he implemented, beginning in 1995, were responsible for the economic boom that followed.
An examination of the nature and the composition of the state's economic and revenue growth during the late 1990s shows that this assertion is incorrect

State fiscal policies did not drive the boom of the late 1990s
• First, every measure of economic growth points to Wall Street as the dominant force in the state's late 1990s expansion.
• Second, the economic expansion of the late 1990s was not unique to NYS. States throughout the country rode this
roller coaster up and are now riding it down. • Third, if Governor Pataki's fiscal policies were the cause
of the state's economic boom, why did the downstate region fare so much better than upstate?

Both income and employment growth in New York State were stronger in the economic expansion of the
1980s than in the expansion of the 1990s.
1.9%
3.9%
1.0%
2.0%
0%
1%
2%
3%
4%
5%
Employment Real Personal Income
1982-1989 1991-2000
Av
era
ge A
nn
ual
Gro
wth
Rate
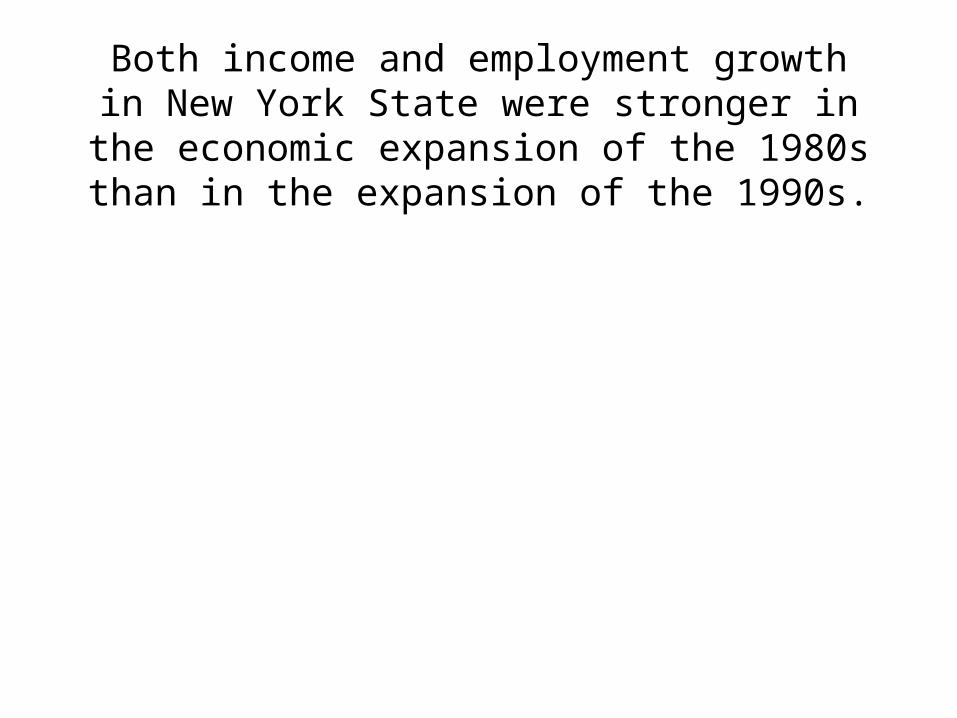
Both income and employment growth in New York State were stronger in the economic expansion of the
1980s than in the expansion of the 1990s.
1.9%
3.9%
1.0%
2.0%
0%
1%
2%
3%
4%
5%
Employment Real Personal Income
1982-1989 1991-2000
Av
era
ge A
nn
ual
Gro
wth
Rate

Figure 11
1982-89 1992-99 1982-89 1992-99 1982-89 1992-99INDUSTRY
Total Gross State Product $126,147 $142,110 100% 100% 3.5% 3.1%
Security Brokers $12,343 $67,581 9.8% 47.6% 13.4% 21.3%All Other Industries $113,804 $74,529 90.2% 52.4% 3.2% 1.8%
Construction $10,644 $1,708 8.4% 1.2% 9.1% 1.3%Manufacturing $11,062 $4,474 8.8% 3.1% 2.2% 0.9%Transportation & utilities $2,661 $9,105 2.1% 6.4% 1.0% 2.7%Wholesale & retial trade $22,603 $27,272 17.9% 19.2% 5.0% 4.6%FIRE (except securities) $20,115 $13,425 15.9% 9.4% 2.3% 1.3%Services $35,815 $17,346 28.4% 12.2% 4.4% 1.7%Government $7,930 $1,381 6.3% 1.0% 1.7% 0.3%Agriculture and mining $781 $674 0.6% 0.5% 3.9% 2.7%
Note: Because not all output is allocated to an industry, major industries will not sum to total.Sources: BEA & FPI linked 1992 and 1996-chained GSP.
Absolute ChangeShare of Total GSP
Change Annual Growth Rate
The Wall Street securities industry accounted for nearly half of the growth in
(Gross State Product, New York, millions, 1996 chained dollars)gross state product during the 1990s expansion.
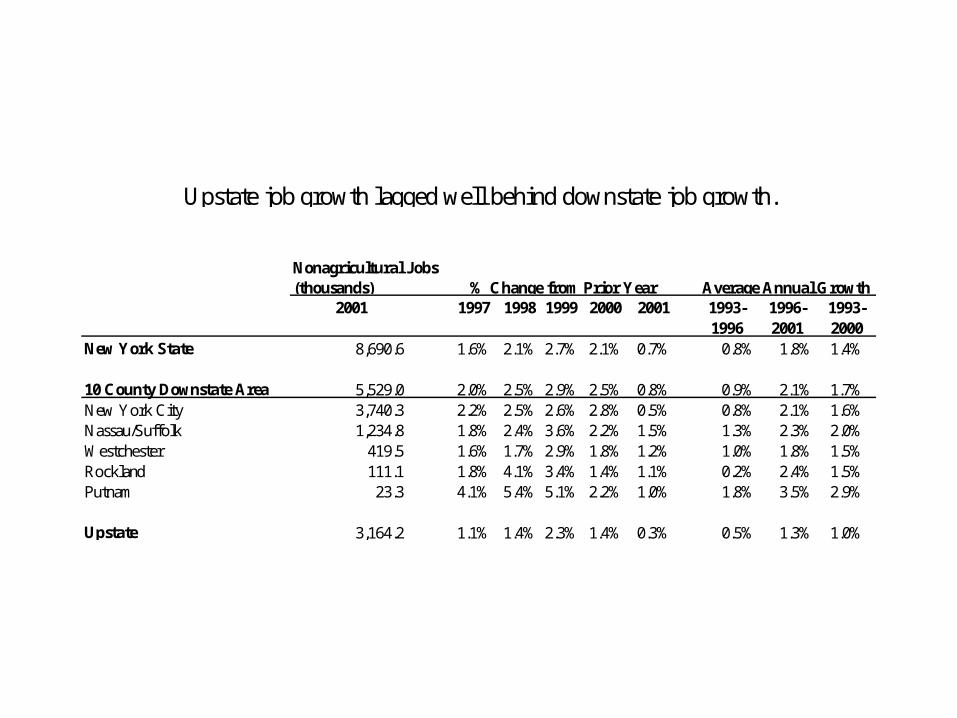
2001 1997 1998 1999 2000 2001 1993- 1996- 1993-1996 2001 2000
New York State 8,690.6 1.6% 2.1% 2.7% 2.1% 0.7% 0.8% 1.8% 1.4%
10 County Downstate Area 5,529.0 2.0% 2.5% 2.9% 2.5% 0.8% 0.9% 2.1% 1.7%New York City 3,740.3 2.2% 2.5% 2.6% 2.8% 0.5% 0.8% 2.1% 1.6%Nassau/Suffolk 1,234.8 1.8% 2.4% 3.6% 2.2% 1.5% 1.3% 2.3% 2.0%Westchester 419.5 1.6% 1.7% 2.9% 1.8% 1.2% 1.0% 1.8% 1.5%Rockland 111.1 1.8% 4.1% 3.4% 1.4% 1.1% 0.2% 2.4% 1.5%Putnam 23.3 4.1% 5.4% 5.1% 2.2% 1.0% 1.8% 3.5% 2.9%
Upstate 3,164.2 1.1% 1.4% 2.3% 1.4% 0.3% 0.5% 1.3% 1.0%
% Change from Prior Year Average Annual GrowthNonagricultural Jobs (thousands)
Upstate job growth lagged well behind downstate job growth.

The strategy that the Governor is proposing for balancing the 2003-04 budget is very similar to ways in which New
York State balanced its budget during the last recession.
• Most of the budget balancing was done through service and program cuts
• The overwhelming majority of tax increases were in fees and regressive consumption and gross receipts taxes.
• Incredible pressure was placed on local property and sales taxes

36%
38%
40%
42%
44%
1991 1992 1993 1994
42.9%
40.4%
39.1%
38.0%
In the early 1990s, state aid as a share of all school expenditures
declined significantly.
Souce: New York State Education Department's Analysis of School Finances in NYS School Districts, Table 1, December 2001
Revenues from state sources as a percent of school district expenditures

$0.0
$1.0
$2.0
$3.0
$4.0
1989 1990 1991 1992 1993 1994 1995 1996 1997 1998 1999 2000 2001State Fiscal Year
Actual paymentsShortfall
Revenue sharing with local governments was cutmore than any other state program.
(Difference between statutory and actual payment)

0%
2%
4%
6%
8%
State Personal Income TaxState's Economic GrowthLocal Real Property Tax
4.09%
5.93%
7.75%
Annual growth rate, 1986-87 to 1992-93.
As a result of the 1987 tax cuts and the subsequent state budget cuts,
personal income tax revenues grew more slowly than the economy, placing
greater pressure on the local real property tax.

County Rate Change Effective Date County Rate Change Effective Date
Albany 3% to 4% September 1, 1992 Otsego 2% to 3% December 1, 1991Broome 3% to 4% March 1, 1994 Putnam 2% to 3% March 1, 1989Cayuga 3% to 4% September 1, 1992 Rensselaer 3% to 4% September 1, 1994Chenango 2% to 3% December 1, 1991 Rockland 2% to 2.5% March 1, 1991Cortland 3% to 4% September 1, 1992 2.5% to 3% September 1, 1991Delaware 0% to 2% September 1, 1990 Schenectady 0% to 0.5% December 1, 1988Dutchess 1% to 3% March 1, 1990 0.5% to 3% March 1, 1989Erie 3% to 4% January 10, 1988 Schoharie 2% to 3% March 1, 1992Genesee 3% to 4% September 1, 1994 Steuben 3% to 4% December 1, 1992Greene 3% to 4% March 1, 1993 Suffolk 3.25% to 3.75% September 1, 1991Herkimer 0% to 3% March 1, 1988 3.75% to 4.25% September 1, 1992
3% to 4% September 1, 1994 Tioga 3% to 3.5% March 1, 1994Monroe 3% to 3.5% September 1, 1992 Tompkins 3% to 4% December 1, 1992
3.5% to 4% March 1, 1993 Ulster 3% to 3.75% December 1, 1993Nassau 3.75% to 4.25% September 1, 1991 Westchester 1.5% to 2.5% October 15, 1991Oneida 3% to 4% September 1, 1992 Wyoming 3% to 4% December 1, 1992Orange 2% to 3% March 1, 1992Orleans 3% to 4% June 1, 1993
County sales tax rate increases between January 10, 1988 and September 1, 1994. Since January 1, 1995, only five counties, Columbia (3/1/95), Oswego (3/1/97), Schenectady (9/1/98), Schuyler (3/1/00) and Suffolk (6/1/01) have increased their sales tax rates.
During the late 1980's and early 1990's, sales tax rates were increased for three-fourths of state residents outside New York City.

Service cuts kill more jobs per dollar than progressive tax increases.
• The Executive Budget proposes a $1 billion dollar cut in state Medicaid spending. According to a January 2003 study by Families USA on the economic impact of Medicaid spending in each of the 50 states, a $1 billion dollar reduction in New York State Medicaid funding would result in a $2 billion decline in business activity; the loss of 17,410 jobs and $720 million in wages and salaries.
• The Executive Budget recommends a $1.2 billion dollar decrease in school aid for the coming fiscal years.
• The Executive Budget estimates savings of $587 million through "use of federal funds and other efforts to support welfare spending." These "savings" come in part from reducing support for local social services districts by $162 million and reducing services and benefits to recipients by another $242 million, including a proposal to not pass through the January 2004 federal cost of living increase for SSI recipients.

12%
14%
16%
18%
20%
198719881989199019911992199319941995199619971998199920002001
New York U.S.
As the Governor proposes cuts in Medicaid and more stringent eligibility guidelines for
Family Health Plus, 2.9 million New Yorkers still lack health insurance.
Nonelderly persons without health insurance, EBRI analysis of CPS Data

Despite its high poverty rates and great wage and income inequality, New York maintains a regressive state-local tax system.
• A progressive tax system is one in which the portion of a household's income that goes to taxes increases as its income increases.
• A regressive tax system is one in which that portion decreases as one's income increases. In other words, a regressive tax system is one in which wealthy households pay a smaller share of their incomes in taxes than do lower income households.
• A proportional tax system is one in which all households, regardless of their income levels, pay about the same portion of their incomes in taxes.
• While it is interesting to note if an individual tax is regressive, proportional, or progressive, the more important question is whether the tax system as a whole is regressive, proportional, or progressive. For most states, the question is whether or not the progressivity of its personal and corporate income taxes and its estate tax balance out
the regressivity of its consumption, excise and property taxes.

7%
9%
11%
13%
Lowest 20%Second 20%Middle 20%Fourth 20%Top 20%
10.0%10.5%
11.0%11.5%
12.0%
7%
9%
11%
13%
Lowest 20%Second 20%Middle 20%Fourth 20%Top 20%
11.0% 11.0% 11.0% 11.0% 11.0%
7%
9%
11%
13%
Lowest 20%Second 20%Middle 20%Fourth 20%Top 20%
12.0%11.5%
11.0%10.5%
10.0%
7%
9%
11%
13%
Lowest 20%Second 20%Middle 20%Fourth 20%Top 20%
12.6%
11.3% 11.6%11.1%
8.3%
Proportional
Regressive
Progressive
New York
Progressive, Proportional and Regressive Tax SystemsTaxes as a percent of income, by income quintiles
New York figures are from the Institute for Taxation and Economic Policy for 2002 tax law at 2000 income levels for nonelderly taxpayers, after federal offset.

0%
2%
4%
6%
8%
10%
Less than $15,000 $15,000-$27,000 $17,000-$44,000 $44,000-$74,000$74,000-$160,000$160,000-$634,000 Over $634,000
9.5%
7.5%
5.7%
4.5%
3.4%
2.2%
1.2%
New York's sales and excise taxes are
inversely related to income.
Bottom
Quintile
2nd
Quintile
Middle
Quintile
4th
Quintile
Next
15%Next
4%
Top 1%
State and local sales and excise taxes as a percent of family income
Source: Institute for Taxation & Economic Policy, 2003. Table shows 2002 tax law at 200 income levels for nonelderly taxpayers .

0%
2%
4%
Less than $15,000 $15,000-$27,000 $17,000-$44,000 $44,000-$74,000 $74,000-$160,000$160,000-$634,000 Over $634,000
3.9%
2.7%
3.1% 3.2%3.5%
2.7%
0.7%
New Yorker's residential property tax burdens
are not systematically related to income.
Bottom
Quintile
2nd
Quintile
Middle
Quintile
4th
Quintile
Next
15%
Next
4%
Top 1%
Taxes as a percent of family income
Source: Institute for Taxation & Economic Policy, 2003. Note: Table shows 2002 tax law at 2000 income levels
for nonelderly taxpayers, before federal offset.

-3%
0%
3%
6%
9%
12%
15%
Less than $15,000$15,000-$27,000 $17,000-$44,000 $44,000-$74,000$74,000-$160,000$160,000-$634,000 Over $634,000
13.9%
10.6%
9.3%8.3%
7.5%
5.5%
3.1%
-1.3%
0.8%
2.6%3.7%
4.5%5.1%
6.0%
All other taxesIncome Taxes
New York State's personal income tax helps to balance the
regressivity of the rest of the tax system.
Source: Institute for Taxation & Economic Policy, 2003. Table shows 2002 tax law at 2000 income levels for nonelderly taxpayers,. before federal offset.
Bottom
Quintile
2nd
Quintile
Middle
Quintile
4th
Quintile
Next
15%
Next
4%
Top 1%
Taxes as a percent of family income

6%
9%
12%
15%
Less than $15,000$15,000-$27,000$17,000-$44,000$44,000-$74,000$74,000-$160,000$160,000-$634,000Over $634,000
12.7%
11.4%11.9% 11.9% 12.0%
10.6%
9.1%
Overall, the wealthiest 5% of households pay a much smaller share of their
income in state and local taxes than do all other New Yorkers.
Source: Institute for Taxation & Economic Policy, 2003. Table shows 2002 tax law at 2000 income levels for nonelderly taxpayers, before federal
offset.
Bottom
Quintile
2nd
Quintile
Middle
Quintile
4th
Quintile
Next
15%
Next
4%
Top 1%
Taxes as a percent of family income

6%
9%
12%
15%
Less than $15,000 $15,000-$27,000 $17,000-$44,000 $44,000-$74,000 $74,000-$160,000$160,000-$634,000 Over $634,000
12.7%
11.4%11.9% 11.9% 12.0%
10.6%
9.1%
12.6%
11.3%11.6%
11.1%
10.2%
8.4%
6.5%
Before Federal OffsetAfter Federal Offset
When federal deductibility is taken into consideration, the differences
are even greater.
Source: Institute for Taxation & Economic Policy, 2003. Table shows 2002 tax law at 2000 income levels for nonelderly taxpayers, before federal offset.
Bottom
Quintile
2nd
Quintile
Middle
Quintile4th
Quintile
Next
15%
Next
4%Top 1%
Taxes as a percent of family income

0%
5%
10%
15%
20%
25%
30%
Less than $15,000 $15,000-$27,000 $17,000-$44,000 $44,000-$74,000 $74,000-$160,000$160,000-$634,000 Over $634,000
2.6%
6.3%
10.6%
17.2%
23.1%
15.1%
25.2%
3.5%
7.5%
13.0%
20.2%
25.0%
13.4%
17.3%
Share of Income Share of Total Taxes After Offset
Taking federal deductibility into consideration, the wealthiest 5% of New York's familieshave over 40% of the income but carry less than 31% of the state-local tax burden.
BottomQuintile
2ndQuintile
MiddleQuintile
4thQuintile
Next15%
Next4%
Top 1%
Source: Institute for Taxation & Economic Policy, 2003. Table shows 2002 tax law at 2000 income levels for nonelderly taxpayers, after federal offset.The percentages for the seven income groups add to 100%.
Wealthiest 5%

New York State has reduced the progressivity of its personal income tax while the states with which it
competes have moved in the opposite direction.
• New York used to have 3rd highest top income tax rate of all the states with income taxes. It is now 19th out of 42, with a top rate of 6.85%.
• In September 2001, North Carolina adopted a temporary (3-year) additional tax bracket of 8.25% (over and above its regular top rate of 7.75%) on the portions of taxable income above $100,000 for single individuals and $200,000 for married couples.
• In 2002, Massachusetts raised $1 billion per year by postponing scheduled income tax cuts and temporarily raising its tax on income from capital gains.
• Connecticut Governor John Rowland recently proposed an additional 1% tax on the portion of incomes over $1 million, even though he vetoed a similar proposal last summer.

6%
8%
10%
12%
14%
16%
1976 1980 1985 1990 1994 1998 2001
Top rate on investment income
Top rate on earned income
Top marginal tax rate
1987 PIT cuts
1995 PIT cuts
New York State has cut its top personal income tax rate by morethan 50% over the last 25 years.

Income Tax Policy Options
• A modest, temporary surcharge on seven-tenths of one percent (.007) the portions of a taxpayer's New York Adjusted Gross Income above $100,000 and another seven tenths of one percent (.007) on the portions of income above $200,000 would raise between $2.7 to $3.0 billion annually. This would still leave affected taxpayers with a much lower personal income tax bill than in 2001 because of the Bush tax cuts and federal deductibility of state and local income taxes. If you earn $300,000 a year, you'll be getting about a $5,000 tax break from the federal government.
• Adding a temporary additional tax bracket of 7.85% (one percent above the current top rate of 6.85% that kicks in at taxable income levels of $20,000 for single individuals and $40, 000 for married couples) on the portion of taxable income over $100,000 for individuals, over $200,000 for married couples, and over $150,000 for heads of households would increase revenues by approximately $1.4 to $1.6 billion per year.
• Adding a one percent surcharge on the portions of Adjusted Gross Income above $150,000 would raise about $2 billion per year.

All of these proposals would have a less negative effect on the New York economy than cuts in state and local services produced or provided locally or increases in fees or regressive taxes. These proposals all have several other advantages in common:
• First they would only increase the effective tax rate for those taxpayers who are currently paying less of their income in state and local taxes than the other 90% to 95% of New York taxpayers.
• Second, over 15% of these tax increases would be paid by residents of other states and other countries.
• Third, because of federal deductibility of state and local income taxes, the federal government would be paying for about a third of the bill.

New York’s corporate income tax is
riddled with loopholes and inequities.
• Many large multi-state and multi-national corporations that profit from New York markets (and others that rely heavily on New York services) pay little or nothing in New York State taxes by using accounting tricks currently allowed under law.
• Toy R’ Us, for example, avoids taxation in New York by shifting income, in the name of royalty payments, to a subsidiary that owns its trademark Geoffrey the Giraffe. That subsidiary just happens to be located in a state that does not tax income from so-called “intangibles.”
• Last summer, New Jersey enacted legislation that raised $1 billion by closing this and other corporate loopholes.
• New York, meanwhile, has made its corporate income tax into a form of legal Swiss cheese - going so far as to add loopholes to the corporate Alternate Minimum Tax (AMT) which was established to ensure that profitable corporations made at least some contribution to the cost of government services.

0.6%
0.8%
1.0%
1.2%
1.4%
1977 1979 1981 1983 1985 1987 1989 1991 1993 1995 1997 1999 2001State Fiscal Year
Actual with SurchargeWithout surcharge
Business and corporate taxes as a percent of personal income.
Total corporate and business taxes were much smaller in 2001relative to the size of the economy than they were in 1977.

$0.02
$0.03
$0.04
$0.05
$0.06
$0.07
$0.08
1977 1980 1983 1986 1989 1992 1995 1998 2001 2004State Fiscal Year
Actual Estimated/Projected Without Surcharge
Corporate franchise tax revenue per $100 of personal income
For example, corporate income tax revenues per $100 of New YorkState personal income have fallen by over 50%.
Note: The increase in corporate tax revenues from SFY 1999-00 to SFY 2000-01 is due primarily to the impact of legislation which movedenergy companies to the corporate franchise tax.

New York State should reform its corporate tax system.
• New York could join California, Colorado, Illinois, New Hampshire and the 12 other states that use a reform called “combined reporting” to prevent profitable multi-state and multi-national corporations from avoiding state corporate income taxes through something called “transfer pricing.”
• This accounting trick enables such corporations to shift income and expenses among their numerous subsidiary corporations in order to reduce their overall tax liability by having inordinately large portions of their income show up in subsidiaries that are only taxable in so-called offshore tax havens where tax rates are inordinately low, or in states that do not have corporate income taxes, or in states (like Delaware) that have corporate income taxes but which do not tax the income from trademarks and other intangibles.
• The adoption of combined reporting in NY would raise between $340 and $392 million annually.

New York State should ensure that all businesses that profit from New York’s services and markets
contribute to the cost of state and local government. • New York could adopt a new state Corporate Alternative Minimum Tax (AMT)
similar to the Alternate Minimum Assessment (AMA) enacted last year by New Jersey.
• The New Jersey AMA applies only to businesses with gross profits of $1 million or more, with those businesses subject to a new low rate assessment on either the portion of their gross profits over $1 million or the portion of their gross receipts over $2 million; whichever is less. This new assessment is estimated to raise between $202 and $234 million per year in New Jersey.
• In New York, a similar assessment would probably raise at least between $400 and $460 million per year.

New York State should eliminate or reform its litany of wasteful corporate subsidies
• The exclusion of subsidiary income from corporate taxation should be eliminated . (This step would not be necessary if NYS adopted combined reporting.
• New York’s method of taxing corporation’s investment income should be reformed.
• Public borrowing for development boondoggles should be ended.
• New York should consider adopting a “throwback rule.”
• The ability of Industrial Development Agencies to abate State taxes should be eliminated or limited.
• State and local revenues and expenditures should not be used to subsidize misplaced development.
• The abuse of point-of-sale sales tax exemptions should be curbed.
• New York should recover subsidies from firms that do not live up to the conditions on which those subsidies were based.
• The Investment Tax Credit should be reformed and the amount of credit earned should be based on the actual number of jobs created and retained.
• Loopholes in the Empire Zone program should be closed.

New York State should decouple from federal
government’s bonus depreciation tax cut.
• From the late 1980s until 2001, nearly all states used the federal definition of taxable business income — including the federal allowance for depreciation — as the basis for their own tax calculations. A federal tax law enacted in March 2002, however, created a new "bonus depreciation” deduction. This gives corporations a reduction in their federal and NY State corporate franchise tax for investing in new equipment no matter where those investments are made (including foreign investments). The revenue loss to New York State from this tax cut will be between $270 and $545 million in SFY2003-04.
• Thirty states plus the District of Columbia that previously followed federal depreciation rules are now decoupled from federal tax law — in effect, disallowing the new bonus depreciation provision in their states.

What lessons if any can we learn from the way in which New York State dealt with past budget gaps.
• New York State’s current situation is not comparable to the budget gap that the state faced during Governor Pataki's first year in office. At that time, 1995, New York State was two years into a very strong economic recovery which was going to continue and even accelerate for a least five more years.
• We are now in a recession and the actions that were taken during the boom of the late 1990s are very inappropriate to a downturn such as the one we are now experiencing.
• New York State's current fiscal situation is much more like the budget situation that it faced in the early 1990s and state policymakers need to avoid the mistakes of that period. In the early 1990s the budget was balanced primarily by cutting spending, and the tax increases that were enacted were primarily increases in consumption taxes rather than income tax increases. For example, in a December 1990 special session, the legislature closed a $1 billion budget gap - entirely on the expenditure side of the budget.


