36
Bynno Enterprise Business Plan Yeltsin Santana Orlando Rivera Narek Grigoryan Becky Sagaas Nicholas Wright
| Date post: | 15-Apr-2017 |
| Category: |
Documents |
| Upload: | yeltsin-santana |
| View: | 122 times |
| Download: | 0 times |

Bynno Enterprise
Business Plan
Yeltsin Santana
Orlando Rivera
Narek Grigoryan
Becky Sagaas
Nicholas Wright

1
Business Plan Overview…3
Executive Summary…4
Vision Statement
Mission Statement
Our Strategy
Industry Overview…5
Five Forces Theory
SCP Model
Bynno’s Functions…6
Research and Development
Marketing
Production
Finance
Human Resource
Entering the Market…..7-
Practice Round 1 – 2014
Problems and solutions from previous rounds
Practice Round 2 – 2015
Problems and solutions from previous rounds
Practice Round 3 – 2016
Problems and solutions from previous rounds
Practice Round 4 – 2017
Problems and solutions from previous rounds
Practice Round 5 – 2018
Problems and solutions from previous rounds
Practice Round 6 – 2019
Problems and solutions from previous rounds…
Practice Round 7 – 2020
Problems and solutions from previous rounds…
Practice Round 8 – 2021
Problems and solutions from previous rounds…
Table of contents

2
Entry Mode…..
Competition Round 1 – 2014
Problems and solutions from previous rounds
Competition Round 2 – 2015
Problems and solutions from previous rounds
Competition Round 3 – 2016
Problems and solutions from previous rounds
Competition Round 4 – 2017
Problems and solutions from previous rounds
Competition Round 5 – 2018
Problems and solutions from previous rounds
Competition Round 6 – 2019
Problems and solutions from previous rounds
Competition Round 7 – 2020
Problems and solutions from previous rounds
Competition Round 8 – 2021
Problems and solutions from previous rounds
SWOT Analysis & Conclusion

3
5
Business Plan Overview
Bynno Enterprise experienced different strategies in the search for the perfect
competitive advantage that will give our company success. Early in our beginning
years, we concentrated on being cost leaders, lowering our cost of operations to
have higher return in our profits. As our market developed, it was beneficial to the
company to shift from cost leaders to cost leader with product lifecycle focus.
By concentrating in this strategy, Bynno Enterprise will gain a clear competitive
advantage by distinguishing our products with an excellent design, at low cost
with easy accessibility. By using our knowledge in Research & Development, we
are able to develop top shelf products. As we generate demand for our products,
we will expand capability, while allowing our products distinguish themselves
from our competitors.

4
Executive Summary
Vision Statement
Bynno Enterprise is determined to be the superior cost leader in its industry. We will
not rest until we reach our ultimate goal. The future looks bright for Bynno
Enterprise as we look to capture our three most concentrated segments in the next
eight years, Traditional, Low End and High End. They will give us our greatest return.
Mission Statement
Through reliable products, for mainstream customers, we will offer high quality
products at an affordable price. We will provide excellent customer service, be
environmental conscious, and help our communities. Our primary stakeholders are
bondholders, stockholders, customers and management.
Our Strategy
Bynno Enterprises, having started from the ground up, has without a doubt been
faced with many obstacles. In order to overcome a vast set of hurdles, Bynno has
mastered the art of strategy and structure. Throughout our first eight years, we
choose to use the strategy of Cost Leader. This strategy no longer served us because
of a business decision. We were not capturing the market; so we changed to Cost
Leader with Product Lifecycle Focus. We were able to distinguish our target market
of the High End, Traditional, and Low End markets. Although we were having some
trouble in the first few years, struggling with competition, we learned from our
mistakes, which gave us experiences to continue to move forward. Taking our
mistakes and adjusting them, allowed us to become more successful as the years
went on.

5
Industry Overview
Five Forces Theory
The Five Forces Framework is described as a framework for industry
analysis and business strategy development. It comes from the idea of
Porter’s five forces that determine the competitive attractiveness or profit.
An "unattractive" industry is considered to be one in which the combination
of these five forces drives down overall profitability. In order for our
company to become “attractive,” we will continue to use the Five Forces
Theory to construct competitive advantage.
SCP Model
Structure‐Conduct‐Performance (S‐C‐P) Model is one of the most important
models for accessing markets. The first feature of the SCP model is the
structure of the industry, which includes a synopsis of our competitors,
diversity of products, and the cost of entry and exit. We use the S‐C‐P model
to analyze where firms could gain competitive advantage. Firm conduct
would be an analysis of our firm internally. Then our performance within the
industry would be analyzed as well. Changes should be made, if necessary.

6
The Function of Our Firm
Research and Development
Research and Development is one of the means by which businesses can
experience future growth, by developing new products or services, in order to
improve and expand. Our company highly depends on R&D for expansion of our
product line and market share. It develops the innovations needed to keep the
company ahead of the competition.
Marketing
The Marketing Department enables our customers to know who we are and what
we offer, by allocating the promo budget for customer awareness. They are also in
charge of many other functions, including setting prices, forecasting sales, and
allocating the sales budget for customer accessibility.
Production
The Production Department is responsible for organizing the production of
products including making schedules, maintaining labor hours, and ensuring that
all products are made and sent out to our customers on time.
Finance
The Finance Department is in charge of many functions, including bookkeeping of all profits and numbers to making strategic decisions. As a watchdog over the company expenditures, finance is in charge of reviewing all decisions. By doing so we can determined if we need to increase our capital, in order to increase our cash.
Human Resource
The Human Resource Department is in charge of recruiting and training of all
employees. Bynno’s HR is known for recruiting talented and culturally-diverse
people, who can bring their fresh ideas to foster a friendly, welcoming
environment filled with growth and prosperity.

7
The first round of the competition was the
most challenging for Bynno. Round One was very inactive for Bynno Enterprises, seeing that we
were still only getting to know ourselves and the system. We did not have a clear idea on what
routes to take. Everything was still very new to us.
The team decided to explore the new boundaries ahead. R&D focused only on one product,
Baker. The Marketing Department used the benchmark forecasting. The Finance Department
took out long term debt to boost our capital. Initially we performed poorly in other areas, i.e.
our customer awareness was very low.
Our company manage to capture 15.7% of the Market Share, we fail to capitalized even more,
because of lack of forecast and underproduction, we stocked out earlier than expected. A lesson learn
for the upcoming years.
The results of the First round
illustrate how the company
made a profit of $5,480,000.
This was great news for us, but
the only problem was our team
didn’t know how we got those
results. Our contribution
margins were not over 30%. We
are hoping to correct these
problems in the future. The
Capstone Courier suggests that
a contribution Margin over 30%
illustrates a healthy company.
Although our team earned 4 out
of 5 stars for overall company performance, the concept of the game was still hard to
comprehend for us. The first round results opened our eyes; and illustrated that we were very
“Green” and but needed to focus on making quality improvements. Because not knowing
what’s going on, will come back to hurt us in the future.
In year two, the team was still trying to figure
things out. To better understand the market,
Bynno’s R&D Dept. introduced a new product
Beer in the Size segment. We figured the product will be launched by the third year. As cost
leaders, we believed that the only way to keep profits up was to keep costs down. As a result of
that concept, we lost a great amount of capital totaling $1,684,834. The total market share for
Year 2014 –Round One Highlights
Year 2015 –Round 2 Highlights
14.9
15.7
15.8
13
20.5
20
Market Share
Andrews Baldwin Chester Digby Erie Ferris
8
the company decreased to 15%; compared to the 15.7% that we captured in Round 1. The
contribution margin was also atrocious, 22.9%. This is something we will fix in the future
rounds. From what our team understood, a contribution margin below 30% will give us
immediate loss in profit. This is why we have this great concern to understand how to correct
this problem.
Marketing - As a cost leader our focus was to keep sales high and marketing low, we
understood this as the best way to make a money. As the years progressed, if this strategy does
not benefit us, we will find other strategies to implement. Our forecast for this round was
horrible. The team was not certain on how to effectively forecast. Having a low promotion
budget led to no customer awareness, which made us have a bad profit.
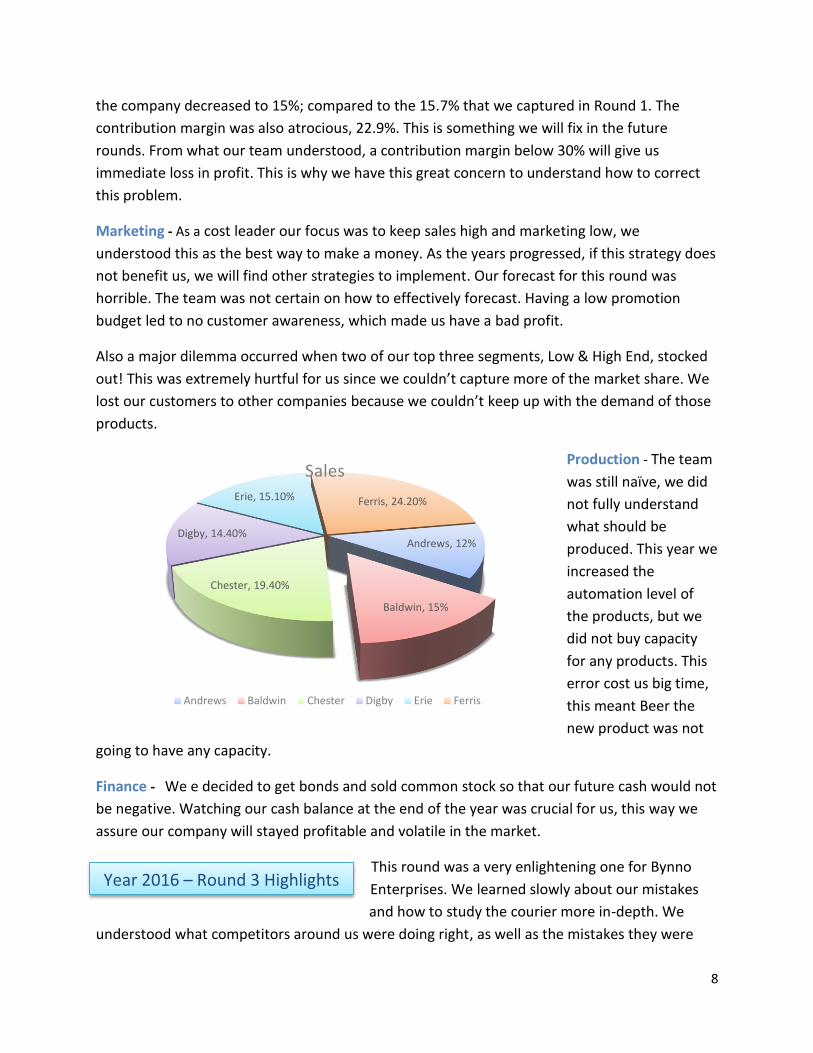
Also a major dilemma occurred when two of our top three segments, Low & High End, stocked
out! This was extremely hurtful for us since we couldn’t capture more of the market share. We
lost our customers to other companies because we couldn’t keep up with the demand of those
products.
Production - The team
was still naïve, we did
not fully understand
what should be
produced. This year we
increased the
automation level of
the products, but we
did not buy capacity
for any products. This
error cost us big time,
this meant Beer the
new product was not
going to have any capacity.
Finance - We e decided to get bonds and sold common stock so that our future cash would not
be negative. Watching our cash balance at the end of the year was crucial for us, this way we
assure our company will stayed profitable and volatile in the market.
This round was a very enlightening one for Bynno
Enterprises. We learned slowly about our mistakes
and how to study the courier more in-depth. We
understood what competitors around us were doing right, as well as the mistakes they were
Year 2016 – Round 3 Highlights
Andrews, 12%
Baldwin, 15%
Chester, 19.40%
Digby, 14.40%
Erie, 15.10% Ferris, 24.20%
Sales
Andrews Baldwin Chester Digby Erie Ferris

9
making. The contribution margin of the company made some progress, as it increased to 25.7%.
Our profits were almost positive, but we still failed with a negative profit of $912,085. The total
market share for the company continue to fall, now it was 13.5%. It seems like every year that
pass, we were falling into an abyss.
Researched & Development - A problem for Bynno Enterprises was the prediction in the fields
of customer requirements as well as demand for products. We are slowly getting better at
forecasting as the years go on. We tried to invest higher in order to try and meet the
requirements of our customers. For some reason we can’t figure out why our new product
Beer doesn’t lunch we have everything ready in the R&D department, but there’s still
something missing, hopefully later on
we will figured it out .No new
products were launched this year. We
decided to terminate the product
Buddy because it was under
producing by selling all the capacity
on it , as a result of the sale the
company took a hit in the market.
Marketing - As previously stated,
Bynno Enterprise began to forecast
better, as well as understand the
courier. By understanding and
deciphering the courier, we were able
to know what our sales needed to be. One mistake was keeping our promotional budget down,
which decreased customer awareness and hurt the business in virtually key areas.
Production - In order for our Beer product to launch we needed to add production capacity. We
forecasted the same as we did in Round Two, and increased automation.
Finance - In this round, we borrowed, as well as sold stock, in order to keep cash positive. We
had to be careful as the total liabilities increased to $66,106 million. We would like to avoid this
for future purposes.
0%
10%
20%
30%
40%
50%
Baker Bead Bid Bold Buddy Beer
Customer
Csutomer Awareness Customer Acessability
Customer Survey

10
In this year, Bynno had developed a new management structure with one CEO, a CFO and four directors: Marketing Director, Direct of Research & Development, HR Director, and Director of Production. Each director would find the solutions to their own department, ending with the final decisions made by the CEO. Our CEO educated our directors on the company’s strategy and what is expected for the directors to oblige to the goals of the firm. With the new CEO’s authoritative decisions our sales will increase, which gave light and hope to our company.
Sales are increasing but we have not yet made a profit
S
Sales were on the rise for each of our products, however since the 1st year of the practice competition we still hadn’t made a profit. The contribution margin came around this time with 32.1% but that wasn’t good enough we still took a loss of (-$1,017,493) The Team was doubting if the new CEO had it in him to take us to where we needed to go.
Finance- We continue to borrow and sell stock in order to keep our cash flow. In the positive side at the end of the year. Having a good cash position at the end of the year proves to be vital for the upcoming years.
Production During this period of production we increased capacity and order automation. We also sold all capacity of product “Buddy.” This is gave us a big lost in that segment but our company managed to survive.
Research & Development
In this round Bynno was still behind in the customer requirements area so we invested heavily on product specifications. Since the company made mistake early in the game it was still hard to make up.
Marketing
In this round our products were place at low price believing that it would drive sales and profits up. Later we would realize this was wrong. Because our competitors had even lower prices than we did. For some reason everyone wanted that low cost strategy.
TQM
We introduce Total quality management to our company and we did not receive the result we wanted in this round it actually cost more having TQM. For the nest round will allocate TQM where is needed the most.
$0$10,000
$20,000$30,000
$40,000$50,000
Baker
Bead
Bid
Bold
Buddy
Market Sales Last 3 years
YEAR 2 YEAR3 YEAR 4
Year 2017 – Round Four New Management
11
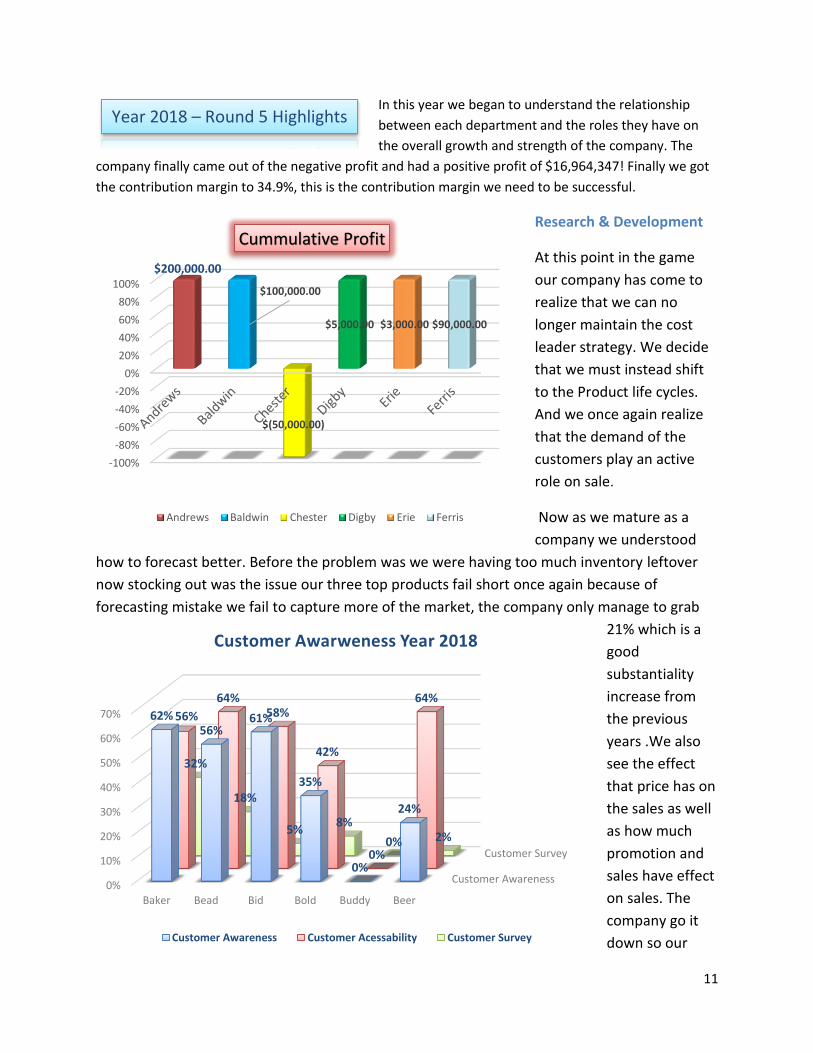
In this year we began to understand the relationship
between each department and the roles they have on
the overall growth and strength of the company. The
company finally came out of the negative profit and had a positive profit of $16,964,347! Finally we got
the contribution margin to 34.9%, this is the contribution margin we need to be successful.
Research & Development
At this point in the game
our company has come to
realize that we can no
longer maintain the cost
leader strategy. We decide
that we must instead shift
to the Product life cycles.
And we once again realize
that the demand of the
customers play an active
role on sale.
Now as we mature as a
company we understood
how to forecast better. Before the problem was we were having too much inventory leftover
now stocking out was the issue our three top products fail short once again because of
forecasting mistake we fail to capture more of the market, the company only manage to grab
21% which is a
good
substantiality
increase from
the previous
years .We also
see the effect
that price has on
the sales as well
as how much
promotion and
sales have effect
on sales. The
company go it
down so our
-100%
-80%
-60%
-40%
-20%
0%
20%
40%
60%
80%
100%$200,000.00
$100,000.00
$(50,000.00)
$5,000.00 $3,000.00 $90,000.00
Cummulative Profit
Andrews Baldwin Chester Digby Erie Ferris
Customer Awareness
Customer Survey
0%
10%
20%
30%
40%
50%
60%
70%
Baker Bead Bid Bold Buddy Beer
62%56%
61%
35%
0%
24%
56%
64%58%
42%
0%
64%
32%
18%
5%8%
0% 2%
Customer Awarweness Year 2018
Customer Awareness Customer Acessability Customer Survey
Year 2018 – Round 5 Highlights

12
new product Beer will launch, under the promotion part of marketing Beer was needed to be
categorize as a size segment product in order to sale in the market and it finally lunch. The
customer awareness increased as well this help boost our sales. This time we invested in
Promotion budget which increase our overall customer awareness and accessibility.
Production - We now understand that we need to maintain an overall profit margin of 30% in
order to make a profit. The contribution margin is an essential part of a company to remain
profitable. Automation has a lot to do with our strategy the more automation we buy the less
cost on producing the item. This will maintain our strategy of low cost and low prices.
We went to the courier and found the correct way of forecasting using the formula given to us,
if we had sales of
1,100,000 we will
multiply the
amount by the next
growth segment
growth rate of 9.2
given us the almost
the precise
forecast.
1,100,000*0.092=101,200 the amount resulted from the calculation was added back to
1,100,000+101,200 = 1,201,200. Another key element we discover as well was that the
company needed to carry a least 1-3 months of extra inventory depended on which product it
was, if the business did not carry extra inventory we will stock out early and lose potential sales
and market share as well.
Finance - This year we continue to borrow and sell stock, we understood that we always
wanted to have cash at the end of the year, enough cash that our inventory will be covered just
in case something would go wrong with our predicted sales for the particular round. Each year
from this point on we understood we wanted to maintain our sales high and our variable cost
down in order to keep, the contribution margin in a locked down over the 30% threshold.
0
50,000
100,000
150,000
200,000
250,000
Balwind
Sales Variable Costs Contribution
SALES
Contribution Margin
Variale Cost

13
The Company’s stock also went up from the previous four years, this show great leadership and
versatility from our CEO to keep his word of returning us to top shape in order for us to be able
compete in this competitive industry. Bynno Enterprise stock also grew to 48.83 the highest it
had ever being since we started the competition. This look very promising for the company as
we in this year growth and every area that we previously were failing.
TQM - This time around we did not just add TQM
to any area of the company, the CEO carefully
reviewed the area’s most in need of total quality
management and allocated to each category
according to its need; this definitely gave us a boost
in key areas of the company this is why we did so
well in this round. The CEO and head of finance will
continue to use TQM for the following years to get
the best company performance.
CPI Systems $1500 Vendor/JIT $1500
Quality Initiative Training $1500
UNEP Green Programs $1,000
Quality Function Deployment Effort
$1,000
CCE/6 Sigma Training $1,500
Andrews, $38.50 Baldwin, $41.12 Chester, $40.12
Digby, $13.16 Erie, $16.58 Ferris, $25.36
Andrews, $31.15 Baldwin, $31.08
Chester, 61.38
Digby, $12.75 Erie, $1 Ferris, $11.84
Andrews, $34.32 Baldwin, $25.18
Chester, $54.81
Digby, $36.70 Erie, $18.01 Ferris, $13.55
Andrews, $58.41
Baldwin, $25.24
Chester, $35.09
Digby, $40.12
Erie, $34.56
Ferris, $14.21
Andrews, $97.13
Baldwin, $48.83
Chester, $19.40
Digby, $27.79 Erie, $54.98
Ferris, $40.71
$0.00
$50.00
$100.00
$150.00
$200.00
$250.00
$300.00
Andrews Baldwin Chester Digby Erie Ferris
Stock Price Years 1 - 5
Year 1 Year 2 Year 3 Year 4 Year 5
Total TQM Expenditures

14
As we try to analyze our industry and customers we
realize that inventory cost can greatly affect us. As our overall company performance increases
dramatically we were not having issues, with the contribution margin. Round 6 is where the
company really started to come around we had a good understanding of each aspect of our
company and
how this practice
round were
supposed to
correctly be
competed, from
this round on
until the end 0f
the Round 8 our
company will
show the
highlights that
almost won the
practice round
for Bynno
Enterprise.
Round 6 show a
prominent round for us as our profit soar to an all-time high $22,911,857. The contribution
margin increase to 36.8%!
Researched and Development - We continue to keep up with the customer demands and
notice that there are fine lines we used to show where our product had a better chance of
surviving. From Round 6-8 we realized we were not to going to be able meet the ideal the
customer demanded, but what we did offer was great quality products, that were closed
enough to the ideal product that need to be at, after all we wanted to still keep out our strategy
of keeping production to a low cost.
Round 7 proved to be vital to us demonstrating that
we knew what we were doing with the company. The
company maintain its soldiery with healthy profits of
$21,964,926. The stock grew from $72.50 to $81.64. The contribution margin was 34.3% which
gave us great return on our sales we spent a lot of money in marketing to keep our products’
-100%
-80%
-60%
-40%
-20%
0%
20%
40%
60%
80%
100%
Andrews Balwin Chester Digby Erie Ferris
Column2
Column1
Profit 22,911,8 22,332,8 -3,519,8 -3,146,0 7,550,50 $25,142,
22,911,85722,332,865
-3,519,821 -3,146,019
7,550,508
$25,142,498
Profits Year 2021
Year 2020- Round 7 Highlights
Year 2019 - 2021 -Highlight

15
awareness and accessibility up. We maintain our strategy and expenditures from the previous
round to this year as well that’s why kept doing so well.
Marketing - We came to the realization in this round that $1,500 was the most effective budget
for sales and promotion, anything more than this value amount will only hurt our sales budget.
This also helped to keep our presence in the market relative. Marketing and forecasting goes
hand to hand if we do not get our customer awareness and accessibility over 50% we will not
sale our expected forecast. Marketing is the way to push a product to the market and
consequently profit will be the result.
Production - Forecasting has greatly improved in these rounds and has been more effective
than previous rounds. However forecasting was still hurting us having too much inventory
leftover can be costly. We believe it had something to do with product quality since with did
not manufacture the ideal product we were not selling the expected forecast. In the beginning
the problem was we were under producing now the problem was we were over producing.
Having too much inventory over was hurting us again of all the part we must enter decision
forecasting has proving to be the hardest.
Finance - We start to understand our roles in finance. The effect of borrowing and controlling
the expense gave us of view of how we can performed at the end of the year, that we still have
money left over for the following year
The final year gave us the final
statistics of how the company ended
up. We almost won the practice
years we came in second place
behind team Andrews, if we had read
the instruction from the beginning of
the game we would had done much
better even though we did not make
first place our company made a great
recovery and it show at the end.
Total sales rack up to $337,528,215 giving us the second place at the end of the competition.
The stock ended up at $106.88 we could had done much better but we will pick up in the
Competition to have a higher stock. The contribution margin ended up at 35.3%. For this round
we keep doing the same strategy from round 5 keeping our cost low and prices low to get the
customer attentions, expending 8,000 on TQM to help reduce cost and improve management
$535,705,830
$337,528,215
$117,377,123
$44,943,915
$232,790,274
$223,403,757
Sales by Team Rounds 8
Andrews Baldwin Chester
Digby Erie Ferris
Round 8 The Final Practice Year 2023

16
quality. The practice round taught our team how this game should be conducted and we will
implemented what we will learn in the competition rounds.
Finally the Competition round had begun we were
excited to prove how much we had learned in the
practice round and put it to work in the competition
rounds.
Researched & Development - This time we came with the idea that we were not going to make
the same mistakes as the practice round concerning R&D for each of our of product we went
with what the courier wanted for the ideal spot, but we also added the drift so our product will
end up at the perfect position at the end of year of revision costing us less the following year.
This year we went aggressive and lunch a new product called Bcardi in the High End segment
for the next year. The purposed we are doing the drift this year is because every year customers
demand increases, in performance and size.
Segment Pfmn Size
Traditional +0.7 -0.7
Low End +0.5 -0.5
High End +0.9 -0.9
Performance +1.0 -0.7
Size +0.7 -1.0
Marketing - Playing aggressive in marketing got us hurt in the first round, we thought that
having the product in the ideal spot we could go aggressive in forecasting in the first year we
calculated 125% on forecasting, because we were going to take over the market, big mistake
we made.
Production - Inventory left over killed us in all area even our contribution margin was low at
28.1%. We were shocked at what happen to us, but we realized in the first we can’t go so
aggressive.
Finance - Oh no! Emergency loan of $14,896,170 since the inventory destroyed our cash the
company went into an emergency loan which never happen to us before it happen where it
hurts the most. The Stock didn’t even come to life with a negative ($10.46). Profit loss of
$1,124,860.
We did horrible in the first live round we went in to aggressive wanting to get everything in the
market forgetting playing conservative in the first round is crucial. This cost us a lot we will look
into this problems we had, for next round we will fix this is issues.
Competition Round 1 - Year 2016
17
After recapping from our first year mistakes the
CEO took it personal and decided to put a stop
to this problem in this year 2017. The first year
Bynno Enterprise went into the market aggressively and our change of strategy will be to go
conservative for this current year as we don’t want to make the same errors again.
Researched & Development - For this current the CEO and the team of Directors did have to
R&D the product too much the total expenses were low at a $2,146 cost. The problem of the
first year was not R&D. We acknowledge customer were looking for our products they all ended
on the inside of their designated circles. The three segment Traditional, High and Low end
segment products of our strategy came in the top three in their segment against our
competitors. Following the drift has proven again vital strategy for our company.
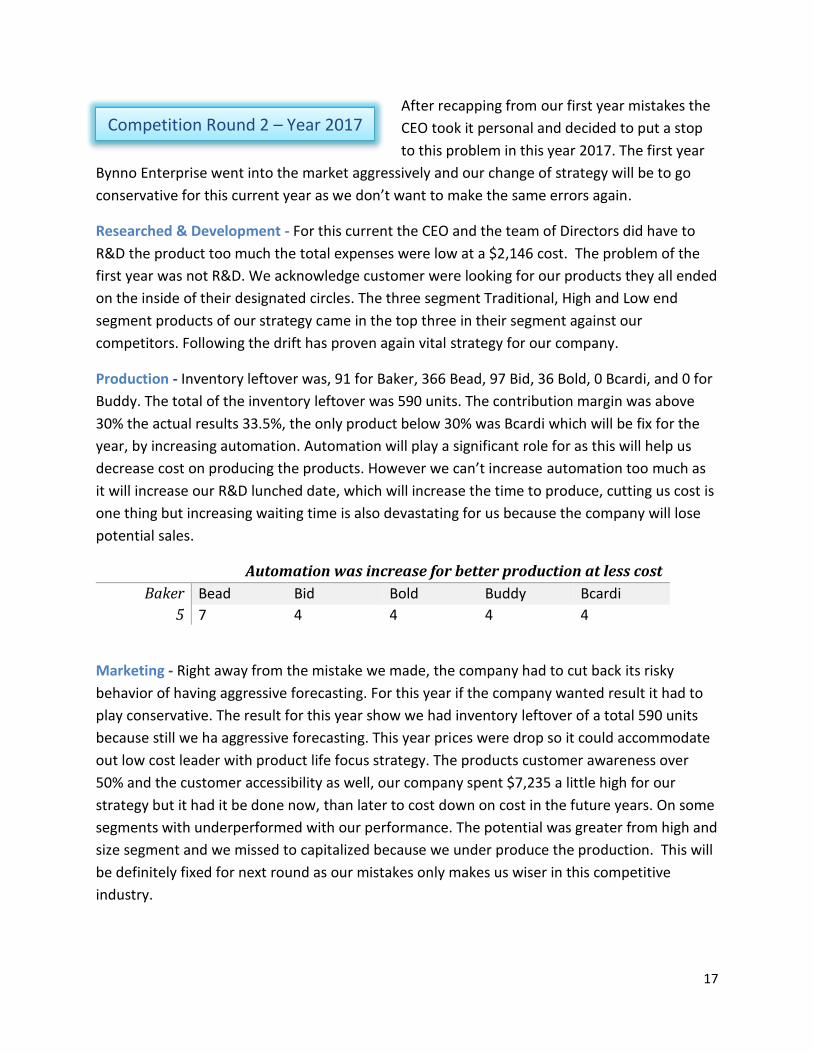
Production - Inventory leftover was, 91 for Baker, 366 Bead, 97 Bid, 36 Bold, 0 Bcardi, and 0 for
Buddy. The total of the inventory leftover was 590 units. The contribution margin was above
30% the actual results 33.5%, the only product below 30% was Bcardi which will be fix for the
year, by increasing automation. Automation will play a significant role for as this will help us
decrease cost on producing the products. However we can’t increase automation too much as
it will increase our R&D lunched date, which will increase the time to produce, cutting us cost is
one thing but increasing waiting time is also devastating for us because the company will lose
potential sales.
Automation was increase for better production at less cost
Baker Bead Bid Bold Buddy Bcardi
5 7 4 4 4 4
Marketing - Right away from the mistake we made, the company had to cut back its risky
behavior of having aggressive forecasting. For this year if the company wanted result it had to
play conservative. The result for this year show we had inventory leftover of a total 590 units
because still we ha aggressive forecasting. This year prices were drop so it could accommodate
out low cost leader with product life focus strategy. The products customer awareness over
50% and the customer accessibility as well, our company spent $7,235 a little high for our
strategy but it had it be done now, than later to cost down on cost in the future years. On some
segments with underperformed with our performance. The potential was greater from high and
size segment and we missed to capitalized because we under produce the production. This will
be definitely fixed for next round as our mistakes only makes us wiser in this competitive
industry.
Competition Round 2 – Year 2017

18
The actual market share in
units Bynno Enterprise
capture was 19% to that of
18.4% we were supposed to
capture, the company
performed better than
expected and that’s satisfies
for now, even though we
could had done more
damage in the market we will
take the 0.6% increase.
The following year 2017 we will
increase this part of our company
even more. Having low customer
accessibility gives us poor results
in the sale. After all this is crucial,
when the customer knows your
product exist and is accessible.
The higher the accessibility the
higher sales is the perfect
correlation , but also our R&D
must be met, to have profitable
results , a low cost strategy we want to keep the cost down, but the CEO realize is impossible to
do so and make money we have to take risky investment to have results.
Finance
This time around for this year, the CEO
made sure we had cash leftover to
take care of the inventory to cover, in
case something went wrong , so this
time we didn’t have to take the
emergency loan like the first year.
Balance sheet show we had cash of
$24,072 leftover and the inventory was
$9,846. The long term debt was at
$73,744 44% in our liabilities and owners’ equity. We understood that having cash even
through it was borrow money the company increase our odds of making the year solidify for
0%
10%
20%
30%Acual Vs Potential
Actual Pontential
0% 10% 20% 30% 40% 50% 60% 70%
Baker
Bead
Bid
Bold
Buddy
Bcardy
Accessebility
Accessebility
2016, ($1,124,860)
2017, $9,413,483
2018, $14,073,750
($5,000,000)
$0
$5,000,000
$10,000,000
$15,000,000
2016 2017 2018
Profit Histoy
Profit Histoy
19
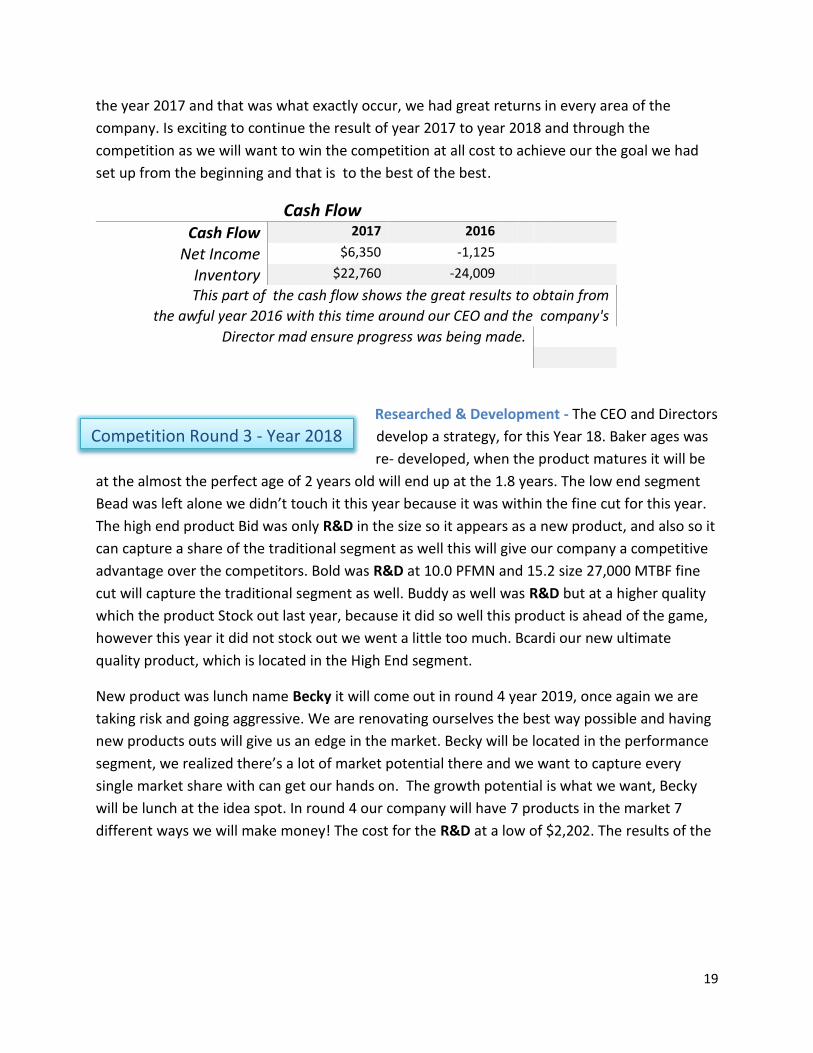
the year 2017 and that was what exactly occur, we had great returns in every area of the
company. Is exciting to continue the result of year 2017 to year 2018 and through the
competition as we will want to win the competition at all cost to achieve our the goal we had
set up from the beginning and that is to the best of the best.
Cash Flow
Cash Flow 2017 2016
Net Income $6,350 -1,125
Inventory $22,760 -24,009
This part of the cash flow shows the great results to obtain from
the awful year 2016 with this time around our CEO and the company's
Director mad ensure progress was being made.
Researched & Development - The CEO and Directors
develop a strategy, for this Year 18. Baker ages was
re- developed, when the product matures it will be
at the almost the perfect age of 2 years old will end up at the 1.8 years. The low end segment
Bead was left alone we didn’t touch it this year because it was within the fine cut for this year.
The high end product Bid was only R&D in the size so it appears as a new product, and also so it
can capture a share of the traditional segment as well this will give our company a competitive
advantage over the competitors. Bold was R&D at 10.0 PFMN and 15.2 size 27,000 MTBF fine
cut will capture the traditional segment as well. Buddy as well was R&D but at a higher quality
which the product Stock out last year, because it did so well this product is ahead of the game,
however this year it did not stock out we went a little too much. Bcardi our new ultimate
quality product, which is located in the High End segment.
New product was lunch name Becky it will come out in round 4 year 2019, once again we are
taking risk and going aggressive. We are renovating ourselves the best way possible and having
new products outs will give us an edge in the market. Becky will be located in the performance
segment, we realized there’s a lot of market potential there and we want to capture every
single market share with can get our hands on. The growth potential is what we want, Becky
will be lunch at the idea spot. In round 4 our company will have 7 products in the market 7
different ways we will make money! The cost for the R&D at a low of $2,202. The results of the
Competition Round 3 - Year 2018

20
great R&D came back positive our
three main product Barker, Bead, and
Bid performed with excellence. Baker
was number one in its segment with
23% of the market. Bead was in
second place with 22% in its market.
Bid was also in 2nd place. Bold our
performance segment came in at 1st
place capture 19%. Buddy 2n place.
Bcardi our new product obtain 7% of
the High End Segment and increase of
3% from 4% it had last time. In the
graph on the left illustrated the progress we are making in earning more of the market share,
with could had earned more in Buddy but we missed some calculations there , eventually the
leaders of the company will get the results they are looking for in each segment. Overall the
company is progressing nicely.
Marketing
Since last time we went a little too
aggressive for forecast in Round 2 we
decide to drop from 125% to 105% on
the expected sales. Also the CEO
decided the “is better to be sure than
sorry” 105% forecast just 5% more
than the next year industry grow rate
of 9.2%. For Buddy we went in to
aggressive we were expecting to get
more sales but we only got 18% and had extra inventory on him which hurts us.
Prices were drop, this action gave us advantage.
The customer was expecting a price drop 0.50
cents, the company gave it to them and even more
of what they expecting. The CEO drop the price
depending of the level of importance it had on the
customer criteria, for example if it was only 9% of
importance only drop the 0.50 cents. The price
drop was able to be done with the help of increase automation we invested the year before this
Price Change
2017 2016 Difference
Baker $27.40 $27.90 ($0.50)
Bead $18.50 $20.50 ($2.00) Bid $38.00 $39.00 ($1.00) Bold $33.90 $35.00 ($1.10) Buddy $33.50 $34.00 ($0.50) Bcardi $38.50 $39.50 ($1.00)
Forecast
Industry Growth
Increase
Baker 9.20% 105%
Bead 11.70% 105%
Bid 16.20% 125%
Bcardi 16.20% 150%
Bold 19.80% 105%
Buddy 18.30% 125%
0%
5%
10%
15%
20%
25%
Baker Bead Bid Bcardi Bold Buddy
Baker, 20%Bead, 22%
Bid, 17%
Bcardi , 7%
Bold, 19%
Buddy, 18%Baker, 19%
Bead, 18% Bid, 17%
Bcardi , 4%
Bold, 17%
Buddy, 22%
2018 vs 2017 Market Share
2018 2017

21
was key to make this prices decrease. The lower price the more of the market will be able to
capture and of coursed our R&D was on point.
Promotion and sales
Bcardi we wanted to increase awareness and customer accessibility, we increase its budget
from $750 to $1190, spending a little more was for the product to get over the 50% awareness
will generated more revenue for us. In the sales budget performance was lower than the rest of
the group, from 41.7% we invested to money so it could be at 50% the recommended target.
The result weren’t gratifying as we though we only capture 17% of the market.
Finance
“Always get the cash pay later” our CEO motto. So he order one of the director of the finance
department to issue long term debt $10,000 and issue stock of $11,000 to increase our cash.
The same strategy from Round 2 we implemented it this year as well.
The long term debt has increase to 44%
because of all the loans we are taking to
cover our inventory in case we had fail.
Cash Flow Statement
Years 2017 2016
Net Income 14,078 $6,350
The Balance sheet show result of
$29,659 in cash at the end of the year,
which means we increased from last
years $24,072. The total sales for the company this year was $189,937,008 the highest of all the
company competitors. The profits of $14,073,750 indicates how well the company is
performing. The contribution margin is also solid at 34.6%.
Stock and Bonds
This year the companies CEO
decides to begin inputting entries
for prices and forecasting. The CEO
explain the reason of this change of
strategy will us more versatility in
the other areas of in such as
Research & Development. Base on
23%
28%5%
44%
0%
Liabilities & Owner's Equity
Retained Earnigd Common Stock Accounts Payable
Long Term Debt Curent Debt
Baldwin, $41.12
Baldwin, $32.92
Baldwin, $49.97
$0.00 $10.00 $20.00 $30.00 $40.00 $50.00 $60.00
Baldwin
Chart Title
Year 2018 Year 2017 Year 2016

22
how the market was changing our strategy to broad differentiator something very drastic in
deed to do.
This year the companies CEO decides to begin
inputting entries for prices and forecasting. The
CEO explain the reason of this change of strategy will us more versatility in the other areas of in
such as Research & Development. Base on how the market was changing our strategy to broad
differentiator something very drastic in deed to do.
Researched & Development – The product as the previous round 3 were place where will be
place everything we had seven products. Were on R&D to better and the best. Blazed our new
product was lunch we are going crazy with launching new product’s aggressive and risk taking is
our strategy to success.
Having the products at the Size & Performance gave
the company profits and market share the company
took over the market. Blowing the competition away
capturing 25.63% of the total market segments. Doing
the correct R&D proves crucial when it comes to
compete in these tuff industry.
Marketing - The Company’s directors and CEO did such a great job in R&D, Bynno was in a
magnificent location on the customer criteria it gave us sale of $ 239,971,519. The others
competitors did not even approach our companies’ formability. At this point we have gained
great confidence and feel superior to our competitors.
The advantage of 7 products illustrates
how continuous innovation has kept
Baldwin highly accomplished through
leadership and CEO responsibility, which
made us to be the clear leader in its
current industry. Baker went into the low
end market and did damage there. In high
end Bid took 10% and Bcardi our ultimate
High end took 16% giving us a total of 26%
market share between the two products.
Competition Year 2019 - Round 4
Segment Pfmn Size Baker 6.2 13.8 Bead 3.0 17
Bid 9.8 10.4 Bold 11.0 14.5
Buddy 5.3 8.5 Bcardi 11.7 8.3 Becky 12.4 13.9
Blazed 0 0
16.3
25.63Baldwin
13.26
12.57
13.52
18.72
Market Share
Andrews Baldwin Chester Digby Erie Ferris

23
In the performance segment Bold obtained 16% market share and Becky took 9% giving us a
total of 25% market share, and helped gain an advantage on our competitors. When Bynno’s
new product launches in 2021, we expect the same results.
.
Production - The Bynno team put forth its best efforts in regards to production; however we
still ended up with excess product. In some cases we under produced on forecasts, however in
other aspects we over produced and were left with way too much on inventory on hand.
1229 units were leftover; which caused a
substantial hit. We are looking for the best
possible method to implement on this
devastating issued at hand. We are over
forecasting on some products and on others we
are just over producing the following year the
CEO and its director are addressing the problem
and the possible solution. Customer
accessibility and awareness were above 60%
for the three most main products, this helped
increase sales.
Finance Department - Stock and bond Baldwin’s stock price continues to have expediential
growth reaching $59.56. The balance sheet illustrates that we had enough cash of $64,391,000
to see inventory of 24,171.00 in case something would go wrong the company handle it. The
BakerBead
BidBold
BuddyBcardi
BeckyBlazed
0%
5%
10%
15%
20%
25%
30% 25%
1%
25%
0
10%
16%
26%
16%10%
0
Market Share Obtain By Products
Baker Bead Bid Bold Buddy Bcardi Becky Blazed
Segment Units Sold
Inventory Leftover
Baker 2681 409 Bead 3528 0
Bid 455 514 Bold 620 255
Buddy 1003 44 Bcardi 735 0 Becky 339 7
Blazed 0 0
24
long term debt of the company opts high at $101,844,000 36.8% of the liabilities and owners’
equity something we want to get liquidate in the following years. The cash flow statement
show how cash position. Increase from $29,659,000 in 2018 to $64,391,000 in 2019. The
annual report showed profit of $14,800,000. On Becky and Blazed we had losses since the
products are new and just getting out there, being new to the market.
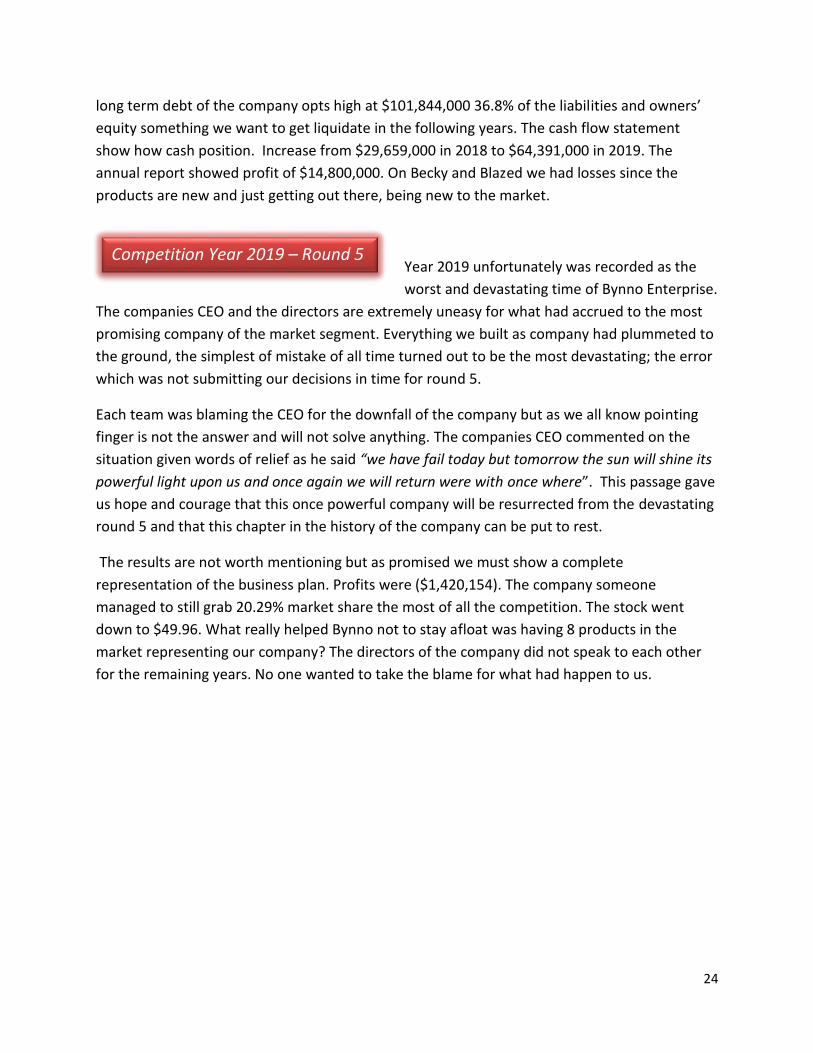
Year 2019 unfortunately was recorded as the
worst and devastating time of Bynno Enterprise.
The companies CEO and the directors are extremely uneasy for what had accrued to the most
promising company of the market segment. Everything we built as company had plummeted to
the ground, the simplest of mistake of all time turned out to be the most devastating; the error
which was not submitting our decisions in time for round 5.
Each team was blaming the CEO for the downfall of the company but as we all know pointing
finger is not the answer and will not solve anything. The companies CEO commented on the
situation given words of relief as he said “we have fail today but tomorrow the sun will shine its
powerful light upon us and once again we will return were with once where”. This passage gave
us hope and courage that this once powerful company will be resurrected from the devastating
round 5 and that this chapter in the history of the company can be put to rest.
The results are not worth mentioning but as promised we must show a complete
representation of the business plan. Profits were ($1,420,154). The company someone
managed to still grab 20.29% market share the most of all the competition. The stock went
down to $49.96. What really helped Bynno not to stay afloat was having 8 products in the
market representing our company? The directors of the company did not speak to each other
for the remaining years. No one wanted to take the blame for what had happen to us.
Competition Year 2019 – Round 5

25
`
R&D
Orlando Rivera
Nicholas
Wright
Narek
Grigoryan
Becky
Sagaas
R&D
Orlando Rivera
Yeltsin Santana
Orlando Rivera
BYNNO Enterprise
Production
Marketing
CEO
Yeltsin Santana
Finance
OHHHHH NOOO
WHATTT HAPPENNN??
“I am not
Superman I
can’t do it all”
Hey It’s the
CEO fault his
to crazy
Don’t look
at me I did
what you
told me to
do
Don’t look
at us
Each team
member was
blaming the CEO

26
The CEO Orlando Rivera was able to reposition
Bynno Enterprise and improve our standing this
year by correcting our previous error of not
summiting our decisions. During this round Bynno was back on track and functioning as it was;
through innovation, dedication, and strategy.
Research & Development – Was very different for us this year we did something very drastic
and extremely risky. But as the saying goes “No risk No
reward” we had to take our chances. Since our new high
end product Bcardi was performing greater than Bid our
first high end product and as the market segment was
changing every yea, the CEO implemented a switch were
Bid was now in Traditional segment with 10.4 Pfmn and
sized of 9.7 and Baker was in Low End now. However in the
results of the round Baker did not make the complete
transition to low end it was still present in the Traditional
segment. Bid stock out with 1050 units and also was
present in High end capturing 4% of that market. As the
game progresses, so will the transition of Bid into traditional thus becoming a complete new
renovate ideal spot product. This radical change gave the business only a 16% contribution
margin for the product Baker. The rest of the other products were over 30% contribution
margin. The company has to improve R&D because there are only two remaining rounds.
0
0.5
1
1.5
2
2.5
3
3.5
4
4.5
0 0.5 1 1.5 2 2.5 3 3.5 4 4.5
Performance
Bid
BoldBlazed
BuddyBecky Bcardi
Bead
Baker
Competition Year 2020 -Round 6
Segment Primary Segment
Baker Traditional Bead Low End
Bid Traditional Bold Performance
Buddy Size Bcardi High End Becky Performance
Blazed Size

27
Marketing
Since moving Bid and Baker to different segment has proven a challenge in R&D and as well as
Marketing. The price for baker
obviously took a substantial
hit, having drastic changes in
prices caused many difficulties
to our strategy to keep prices
at a low cost. As The table on
the right illustrates, when Bead
was sold at $2.50 less than the
expected amount of $0.50 cent
than the customer
expectancies gave and
advantage in sales capturing
25% of the Low End market
segment, no one can compete
with us in price when it came to this product doing automation early in the rounds has giving us
this advantage of dropping the price even more this particular product. Also having Baker as
our old traditional product gave us an extra 3% for a total of 28% market share. However
abandoning the traditional market really hurt us substantially as a whole.
This radical move may prevail in some cases but as this situations is moving along it will prove
to be difficult to return to top prosperous shape with had before. The Forecast and Production
keep devastating us for this round as well having carrying three months of extra inventory is not
wise the director had told the CEO constantly to do not over forecast is better to stock and
make money than just loses money because of inventory carry over. There was a total of 1951
units on hand, this inventory is obliterating our company in every aspect
The production has constantly been a dilemma for Baker and Bid, even more so when a product
is relocated to a new segment. When relocated to a new segment the product is like a new
product, and it will take time to developed in the area so that’s why the inventory leftover was
majority from Baker 995 and Bid 272 units that were not sold. What the CEO was supposed to
do was wait until Bid had completed the transition to Traditional before going to Low End.
Segment’s Price changes
Year 2021
Year 2020
Difference
Baker $20.00 $25.50 $5.50
Bead $13.00 $15.50 $2.50
Bid $27.50 $36.50 $9.00
Bold $29.50 $32.50 $3.00
Buddy $32.00 $32.50 $0.50
Bcardi $37.00 $37.50 $0.50
Becky $32.40 $32.90 $0.50
Blazed $32.50 $33.90 $0.50

28
One positive note from this round was returning to capture the marker share at 21.64% once
again being present in all the segment and
the companies eight products has proven
to be a force to reckon with. Customer
Awareness for Baker and Bid receive a
serious hit falling under the 50% customer
criteria was one of the main reason they
did not sell.
Finance - From the awful round 5 from
those mistake with made, the company
was able to recover in this round Net Income/profit was $2,188,000. Cash position was
$30,644,000. The long term debt of the company was increasing too much at $113,194,000. For
the next year the business is implementing to reduce the debt or reduce it to under 20% from
the following years. Right the long term is 35.7% is not that high and is possible to do so.
TQM – The CEO increase our total management quality. This would increase the company’s
performance. The CEO communicate thought the
director
and company that Total Quality Management
will be remain the same in the upcoming
years.
Researched & Development - The products this
year were place at the conveniently so that they would be able to sell at what the company
wanted. Baker came in and show as a low End product now we officially are having 2 products
in low End. The CEO has started to wonder why we are not performing as expected. While
having product placement in the ideal location Baker and Bid should had sold more.
CPI Systems $2,000 Vendor/JIT $2,000
Quality Initiative Training $2,000
UNEP Green Programs $2,000
Quality Function Deployment Effort
$1,500
CCE/6 Sigma Training $1,500
Total TQM Expenditures
Competition Round 7 - Year 2022
15.79
21.64Baldwin
13.1219.32
15.34
14.9
Market Share
Andrews Baldwin Chester Digby Erie Ferris

29
Name Pfmn Size MTBF Revision Date
Age at Revision
R&D Cost
Baker 6.0 13.7 17500 01-Jul-22 1.6 $505
Bead 4.3 15.3 14500 29-Jul-22 1.9 $581
Bid 10.5 9.8 23000 13-Mar-22 1.0 $198
Bold 13.0 13.2 27000 24-Jul-22 1.1 $567
Buddy 7.5 6.5 19000 24-Jul-22 1.1 $567
Bcardi 14.3 5.7 23000 06-Jul-22 0.9 $518
Becky 15.6 11.8 2700 25-Jul-22 0.9 $571
Blazed 8.2 4.6 19000 05-Jun-22 0.8 $433
Total $3940
The figure above demostrates the
ilsutration of the what occurred during
Researched and Develpoment for this round
the total cost for R&D was $3940 , the fact
we have 8 products makes the R&D cost go
up. The perceptual on the right shows how
thethe company R&D the product move
along to the right of the circles in order to
follow the drift the industry is taken this
what will give the company advanatagae in
the market always looking for the fince cut
or the customer ideal spot. Correct R&D made us comeback in the area of sales , customer
were looking for our pruducts because we place them right.
Marketing
This year for marketing we decided to make the following entries illustraed in the figured
below. Baker’s price was able to reduce because of proper automation. Bead was automate
effeciently thorugh previous round implementation is showing how importing automation is
for price redctuion specially in this Low End Segment , because this what the customer is
looking for.

30
Developing the price for Bead
that low gave us the advantage
against the competitiors . for
the other products we can’t take
the price reduction that much
we will only hurts ourselves.
Since the other markerts don’t
have price as their top
importance and customer
criteria, the company will not
give in price drops. What the
business want is to make a
profit if the customer wants
quality they will have to paid for
it.
Name Baker Bead Bid Bold Buddy Bcardi Becky Blazed
Automation Rating
7.0 8.2 6.0 5.5 5.5 4.5 4.5 4.5
New Automation
7.5 8.2 6.0 5.5 5.5 4.5 4.5 4.5
As the Capstone game insight describes “The automation rating of the production line this year. Automation is on a scale of 1.0 to 10.0. At 1.0, you rely heavily on skilled workers to build your product. At 10.0, robots do most of the production. For example, at an automation level of only 1.0, a typical labor cost per unit would be $12.00. (The actual cost depends upon the current labor contract, which in turn depends upon the year in the simulation, but $12.00 is typical.) As automation increases, this would fall by about $1.20 per point until at an automation of 10.0,
labor cost per unit would be about $1.20.” This is why are investing heavily on Automation for the top three products but we also have to be careful to much automation will mean more time will it take the product to made, which will reduces ours sales big time because having less time in the year to sales will only results in losses for the company and we must allocate automation increase carefully were the most benefits will result from.
NAME PRICE PROMO BUDGET
SALES BUDGET
YOUR FORECAST
BAKER $19.50 $1,500 $1,110 1900
BEAD $12.50 $1,500 $1,110 6000
BID $26.50 $1,500 $1,110 1374
BOLD $29.00 $1,500 $1,110 800
BUDDY $31.50 $1,500 $1,110 1029
BCARDI $36.50 $1,500 $1,203 1168
BECKY $31.90 $1,500 $1,203 900
BLAZED $32.00 $1,500 $1,295 1500
TOTAL $12,000 $9,251 14,761
31
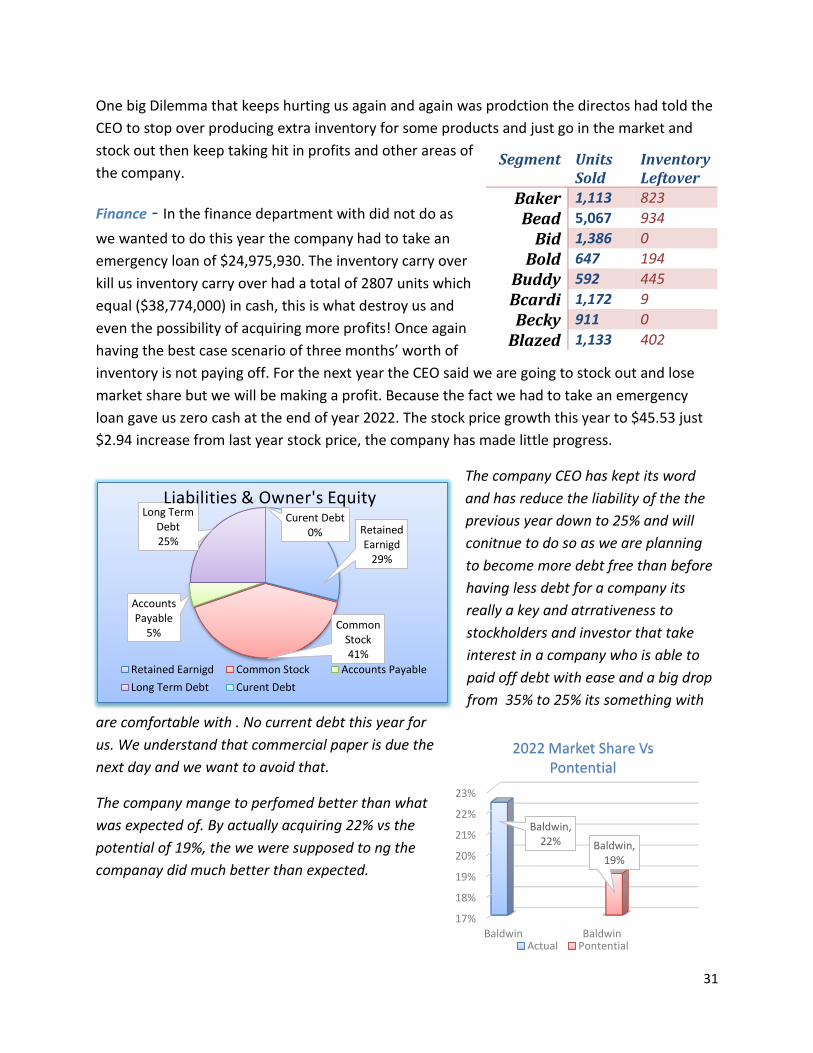
One big Dilemma that keeps hurting us again and again was prodction the directos had told the
CEO to stop over producing extra inventory for some products and just go in the market and
stock out then keep taking hit in profits and other areas of
the company.
Finance - In the finance department with did not do as
we wanted to do this year the company had to take an
emergency loan of $24,975,930. The inventory carry over
kill us inventory carry over had a total of 2807 units which
equal ($38,774,000) in cash, this is what destroy us and
even the possibility of acquiring more profits! Once again
having the best case scenario of three months’ worth of
inventory is not paying off. For the next year the CEO said we are going to stock out and lose
market share but we will be making a profit. Because the fact we had to take an emergency
loan gave us zero cash at the end of year 2022. The stock price growth this year to $45.53 just
$2.94 increase from last year stock price, the company has made little progress.
The company CEO has kept its word
and has reduce the liability of the the
previous year down to 25% and will
conitnue to do so as we are planning
to become more debt free than before
having less debt for a company its
really a key and atrrativeness to
stockholders and investor that take
interest in a company who is able to
paid off debt with ease and a big drop
from 35% to 25% its something with
are comfortable with . No current debt this year for
us. We understand that commercial paper is due the
next day and we want to avoid that.
The company mange to perfomed better than what
was expected of. By actually acquiring 22% vs the
potential of 19%, the we were supposed to ng the
companay did much better than expected.
Segment Units Sold
Inventory Leftover
Baker 1,113 823
Bead 5,067 934
Bid 1,386 0
Bold 647 194
Buddy 592 445
Bcardi 1,172 9
Becky 911 0
Blazed 1,133 402
Retained Earnigd
29%
Common Stock41%
Accounts Payable
5%
Long Term Debt25%
Curent Debt0%
Liabilities & Owner's Equity
Retained Earnigd Common Stock Accounts Payable
Long Term Debt Curent Debt
17%
18%
19%
20%
21%
22%
23%
Baldwin Baldwin
Baldwin, 22% Baldwin,
19%
2022 Market Share Vs Pontential
Actual Pontential
32
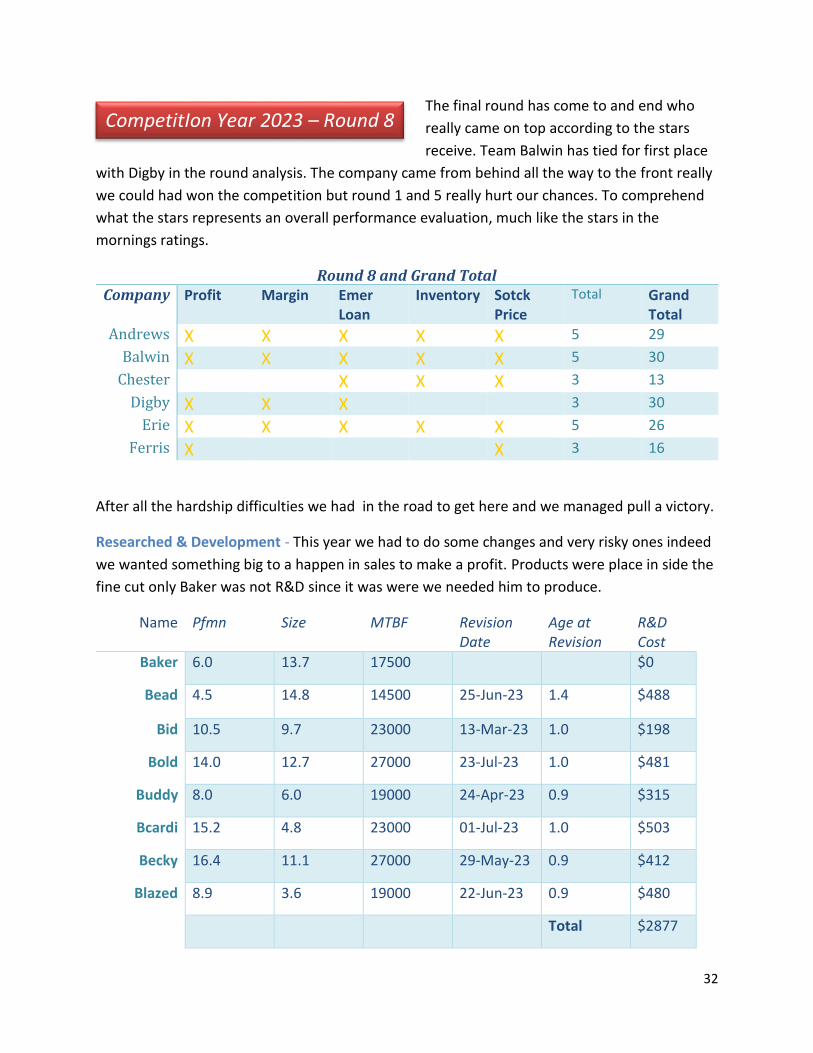
The final round has come to and end who
really came on top according to the stars
receive. Team Balwin has tied for first place
with Digby in the round analysis. The company came from behind all the way to the front really
we could had won the competition but round 1 and 5 really hurt our chances. To comprehend
what the stars represents an overall performance evaluation, much like the stars in the
mornings ratings.
Round 8 and Grand Total Company Profit Margin Emer
Loan Inventory Sotck
Price
Total Grand Total
Andrews X X X X X 5 29
Balwin X X X X X 5 30
Chester X X X 3 13
Digby X X X 3 30
Erie X X X X X 5 26
Ferris X X 3 16
After all the hardship difficulties we had in the road to get here and we managed pull a victory.
Researched & Development - This year we had to do some changes and very risky ones indeed
we wanted something big to a happen in sales to make a profit. Products were place in side the
fine cut only Baker was not R&D since it was were we needed him to produce.
Name Pfmn Size MTBF Revision Date
Age at Revision
R&D Cost
Baker 6.0 13.7 17500 $0
Bead 4.5 14.8 14500 25-Jun-23 1.4 $488
Bid 10.5 9.7 23000 13-Mar-23 1.0 $198
Bold 14.0 12.7 27000 23-Jul-23 1.0 $481
Buddy 8.0 6.0 19000 24-Apr-23 0.9 $315
Bcardi 15.2 4.8 23000 01-Jul-23 1.0 $503
Becky 16.4 11.1 27000 29-May-23 0.9 $412
Blazed 8.9 3.6 19000 22-Jun-23 0.9 $480
Total $2877
CompetitIon Year 2023 – Round 8

33
Marketing - This year the directors sat down with the CEO and suggested to him to stop over
forecasting that they had enough of not doing better because he was being to argressive and it
was hurting the company performance.
The prices drop were just as
the customer wanted. The
promo budget and sales
budget remained almost the
same for the exception of
Baker who promo budget was
reduced by $200,000.
Production - The area where the company was being hurt the most in the competition rounds
saw a lot of changes for this final round. For this round since we were playing it safe in
forecasting we decide to sell the capacity we were not going too used. This will give us a great
return in profit from investments we receive a total $73,970. Selling capacity we don’t need
beside the game was over. This year we also did everything so we can stock out of inventory
NAME PRICE PROMO BUDGET
SALES BUDGET
YOUR FORECAST
BAKER $19.00 $1,300 $1,110 1500
BEAD $12.30 $1,500 $1,110 5294
BID $26.0 $1,500 $1,110 1500
BOLD $28.50 $1,500 $1,110 676
BUDDY $31.00 $1,500 $1,110 620
BCARDI $36.00 $1,500 $1,203 1239
BECKY $31.40 $1,500 $1,203 1000
BLAZED $31.50 $1,500 $1,295 1183
TOTAL $12,000 $9,251 13,012

34
and not have anything left over. And we did for Buddy inventory leftover was only 52 and for
Blazed was 121 units leftover. The rest of the products stock out in their segment.
Finance – This final year in finance we decided to bring down the long term debt by retiring
long term of $40,000 and buying back $9000 worth of stock. The stock of the company growth
to $81.00 a @35.47 increase from last
year. The company’s profit for this
round $31,731,378 the amount we
should had being getting from round
6 but we were over producing and
taking serious hit detreating our profit
margin. The CEO made the long term
debt decrease as hi stated a few years
back. In Human Resource the
company spent from the first year to
the eight year the following numbers.
The company’s overall cumulative
profit was $78,722,836, falling
short of first place in profit against
team Andrews. After all the
missteps with had we did not
performed that bad in profits.
The sale of capacity in this round gave the
company more cash at the end of year 2023.
Selling unneeded capacity of the company was
very wise from the CEO, this got rid of extra
luggage that is not supposed to be carry
towards the end of the competition round. This
also gave the company money to pay of long
term debt.
Recruiting Spend $500
Training Hours 50 Productivity
Index 111.20%
Retained Earnigd
40%
Common Stock42%
Accounts Payable
5%
Long Term Debt13%
Curent Debt0%
Liabilities & Owner's Equity
Retained Earnigd Common Stock Accounts Payable
Long Term Debt Curent Debt
($5,000,000)
$0
$5,000,000
$10,000,000
$15,000,000
$20,000,000
$25,000,000
$30,000,000
$35,000,000
2016 2017 2018 2019 2020 2021 2022 20232016,
($1,124,860)
2017, $9,413,483
2018, $14,073,750
2019, $14,800,000
2020, ($1,420,154)
2021, $2,188,000
2022, $8,773,738
2023, $31,731,378
Profit Histoy
$0
$10,000
$20,000
$30,000
$40,000
$50,000
$60,000
$70,000
2023 2022
2023, $67,105 2022,
$27,590
Net Cash From Operations
2023 2022
35
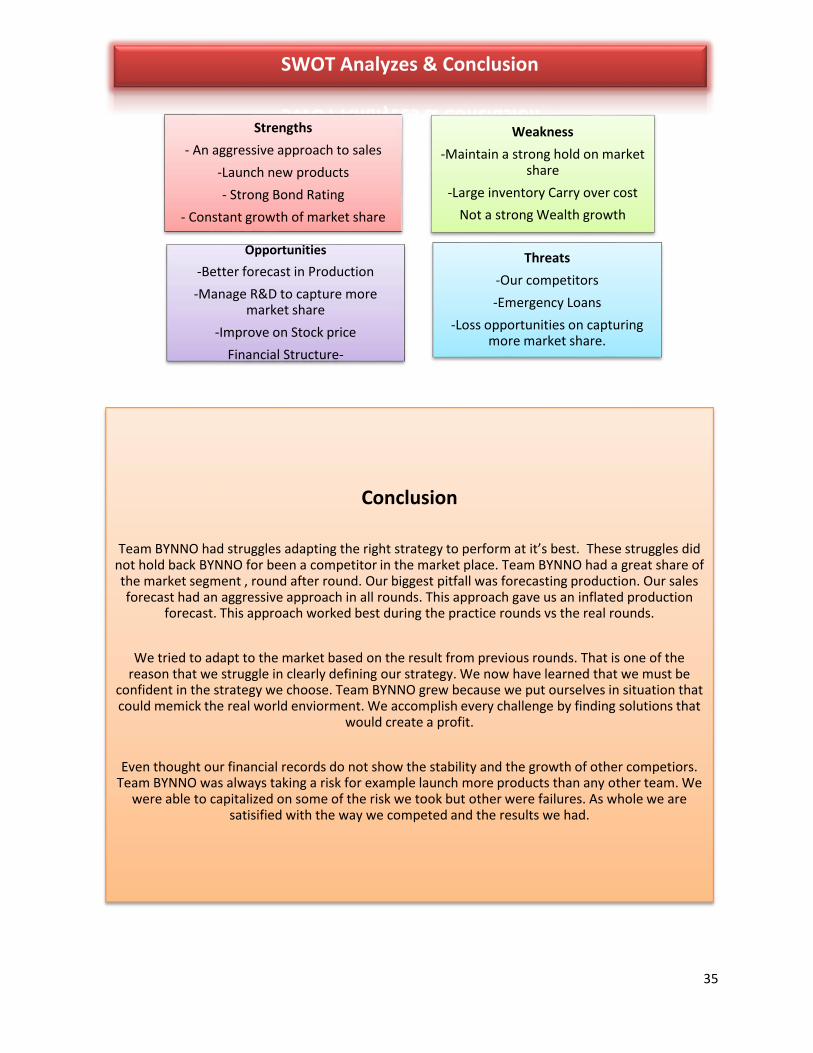
Strengths
- An aggressive approach to sales
-Launch new products
- Strong Bond Rating
- Constant growth of market share
Weakness
-Maintain a strong hold on market share
-Large inventory Carry over cost
Not a strong Wealth growth
Opportunities
-Better forecast in Production
-Manage R&D to capture more market share
-Improve on Stock price
Financial Structure-
Threats
-Our competitors
-Emergency Loans
-Loss opportunities on capturing more market share.
Conclusion
Team BYNNO had struggles adapting the right strategy to perform at it’s best. These struggles did not hold back BYNNO for been a competitor in the market place. Team BYNNO had a great share of the market segment , round after round. Our biggest pitfall was forecasting production. Our sales forecast had an aggressive approach in all rounds. This approach gave us an inflated production
forecast. This approach worked best during the practice rounds vs the real rounds.
We tried to adapt to the market based on the result from previous rounds. That is one of the reason that we struggle in clearly defining our strategy. We now have learned that we must be
confident in the strategy we choose. Team BYNNO grew because we put ourselves in situation that could memick the real world enviorment. We accomplish every challenge by finding solutions that
would create a profit.
Even thought our financial records do not show the stability and the growth of other competiors. Team BYNNO was always taking a risk for example launch more products than any other team. We
were able to capitalized on some of the risk we took but other were failures. As whole we are satisified with the way we competed and the results we had.
SWOT Analyzes & Conclusion


