29
Baltic Sea Region University Network Marketing and Networking for Internationalization Seminar at Vilnius University, 25 November 2011
| Date post: | 29-Dec-2015 |
| Category: |
Documents |
| Upload: | rosanna-sullivan |
| View: | 214 times |
| Download: | 1 times |

Baltic Sea Region University Network
Marketing and Networking for InternationalizationSeminar at Vilnius University, 25 November 2011

Purpose and principles of review
Addresses the most popular global university rankings
Providing universities with analysis of the methodologies, not judging or ranking the rankings themselves
Only publicly available and freely accessible information was used
Efforts were made to discover what is actually measured, how the scores for indicators are calculatedhow the final scores are calculated, andwhat the results actually mean.

Selection of rankingsShanghai Ranking Times Higher– QS (until 2009)Thomson Reuters
US N&WR/ QS Reitor (Рейтор)
------------------Leiden RankingTaiwan RankingUniversity Research Assessment
---------------------
CHE/die ZeitU-Map classificationU-multirankAHELO
-------------Webometrics
…3…

…4…
Performance
Top20
Top500
Next 500
Num
ber o
f uni
vers
ities
Other 16,500universities
Global rankings cover not more than 3-5% of world’s
universities
…5…
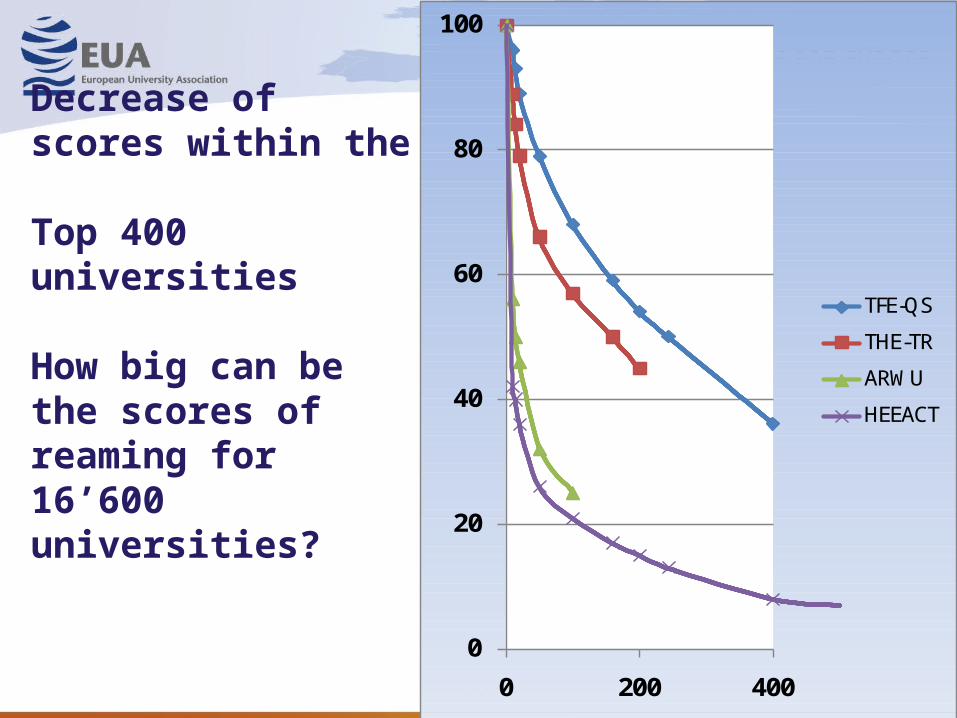
Decrease of scores within the Top 400 universities
How big can be the scores of reaming for 16’600 universities?
0
20
40
60
80
100
0 200 400
TFE-QS
THE-TR
ARWU
HEEACT

Indicators covering elite research universities only
• “Quality of faculty” = staff winning Nobel prizes (ARWU, Reitor)
• “Highly Cited” = belonging to worlds Top 200 in 21 areas, i.e. 4200 altogether (ARWU)
• “Peer review” = nominating 30 best universities from pre-selected list (THE-QS and other QS-based rankings)
• Reputation survey(s) = nominating 30 best (THE-QS, USN&WR, THE-TR)
• Universities considered: selection from elite group of universities: ARWU, THE, Reitor, Leiden
…6…

Indicator scores are usually not the indicator values themselves
Each indicator has a dimension or denominator, e.g.: articles count, staff numbers, citations per academic
To make indicator scores dimensionless, either
-values are usually expressed as percentage of the result of the “best” university
-Z-score is another option (difference between the current measure and the mean value divided by standard deviation)
…7…

Composite scores always contain rankers’ subjective view of quality
In all cases where a composite score is calculated from several indicators, ranking providers assign weights to each indicator in the overall score.
This means that the ranking provider’s subjective judgement determines which indicators are more important (e.g. citations – 10%, reputation – 40%)
In other words, the composite score reflects the ranking provider’s concept of quality.
…8…

Choosing between simple counts or relative values is not neutral
Using absolute values ranking favours large universities
Using relative values ranking allows small but efficient universities compoete with large ones.
Predominantly using absolute numbers are, e.g. ARWU (Shanghai) and Webometrics
HEEACT (Taiwan), THE-QS and THE-TR mainly use relative values (except for reputation surveys).
Leiden University offers both size-dependent and size-independent Rankings/indicators
…9…

Rankings and the research mission of universities: indicators
Publication count SCI & SSCI, Scopus: - production
Publication count in Nature & Science - excellence
Publications per staff - staff research productivity
Citations (count) – overall force of HEI
Citations - per paper or per staff - impact
Citations to articles in the top impact journals – excellence
Research income (by competition or direct allocation)
Research reputation surveys…10…

Rankings and the Teaching mission HEIS
Indicators:Alumni that have been awarded a Nobel Prize
Staff/Student ratio
Teaching reputation surveys
Teaching income
Dropout rate
Time to degree
PhD/ undergraduate ratio
All of the above are distant proxies,some strongly questionable
Learning outcomes – are we there yet?…11…

BIASES AND FLAWSNatural sciences and medicine
vs. social sciences bias
Bibliometric indicators primarily cover journal publications BUT
while natural and life scientists primarily publish in journals,
Engineering scientists - in conference proceedings, prototypes
Social scientists and humanists – in books/ monographs
…12…

Several indicators count by ISI 21 broad areas:
1. Agricultural Sciences2. Biology & Biochemistry3. Chemistry4. Clinical Medicine5. Computer Science6. Ecology/Environment7. Economics & Business8. Engineering9. Geosciences10.Immunology11.Materials Science
12. Mathematics13. Microbiology14. Molecular Biology &
Genetics15. Neuroscience16. Pharmacology17. Physics18. Plant & Animal Science19. Psychology/Psychiatry20. Social Sciences, General
21. Space Sciences
…13…

Different publication and citation cultures in different fields
Table from presentation of Cheng at IREG 2010 conference in Berlin
…14…

Field normalisation – solutions and issues
Field-normalised citations per publication indicator (Leiden ‘Crown indicator’)
Ci is the number of citations of the publication i
ei is the expected number of citations of publication i given the field and the year
Criticisms – prefers older publications,
– blurs the picture…15…

Mean-normalisation – solutions and issues
New attempt (2010) - mean-normalised citation score (MNCS)
Good idea, but: now the results are unstable for the very
newest publications (es change rapidly)
To avoid the new flaw, a modified MNCS2 indicator is used which leaves out publications of the last year
But after all, it just improves mathematics, not the issue that WoS and Scopus insufficiently cover books
…16…

‘Peer review’ biases and flaws
Why calling reputation surveys “Peer reviews”?
‘Peers’ are influenced by previous reputation of the institution (including positions in other rankings)
just try nominating 30 universities you know as best in teaching in your subject…
Limiting the number of universities nominated (THE, QS based rankings) makes approach elitist – and strengthens previous reputation dependence
Using pre-selected lists rather than allowing ‘peer’s’ free choice results in leaving out huge numbers of institutions
Is 5% response rate a sufficient result?
…17…

Risks of overdoing
Even keeping current position in ranking requires great effort (Red queen effect, J.Salmi, 2010)
Rankings encourage universities to improve scores
Universities are tempted to improve performance specifically in areas measured in rankings
There are risks that universities will concentrate funds and efforts on scores and pay less attention to issues that are not rewarded in ranking scores such as: quality of teaching, regional involvement, widening access, lifelong learning, social issues of students and staff etc.
…18…

Rankings and reforms in the EHEAYou will not be rewarded in rankings for
• improving access to next cycle ,
• establishing internal quality culture in universities, implementing ESG,
• linking credits and programmes with learning outcomes,
• establishing qualifications frameworks,
• improving recognition of qualifications and credits,
• establishing flexible learning paths for LLL,
• establishing recognition of non-formal and informal learning,
• improving social conditions of students,
• making HE more accessible
19

Direct abusesmerging universities just to get onto league tables
standardised test scores of applicants
number of academic staff
student/staff ratio – using different definitions of staff and students, the ratio could be between 6:1 to 39:1)
faculty salary – just plan when you should pay
reputation survey by students – tell students to lie
Nobel laureates – hire them
More ciations? – fund medicine not humanities
Want to move a university 52 positions up in the table?
Want to use completely different indicatos than announced? Go ahead…
20

Can rankings be improved?There will be no improvement from extending 5 distant proxies to 25 – they will still remain proxies...
Improve coverage of teaching – most probably through measuring learning outcomes,
Lift biases, eradicate flaws of bibliometric indicators: field, language, regional,
but first of all – address non-journal publications properly!
Change rankings so that they in reality help students to make their choices.
Addressing elite only, ranking results impact life all universities – it is time to produce rankings that cover all universities!
…21…
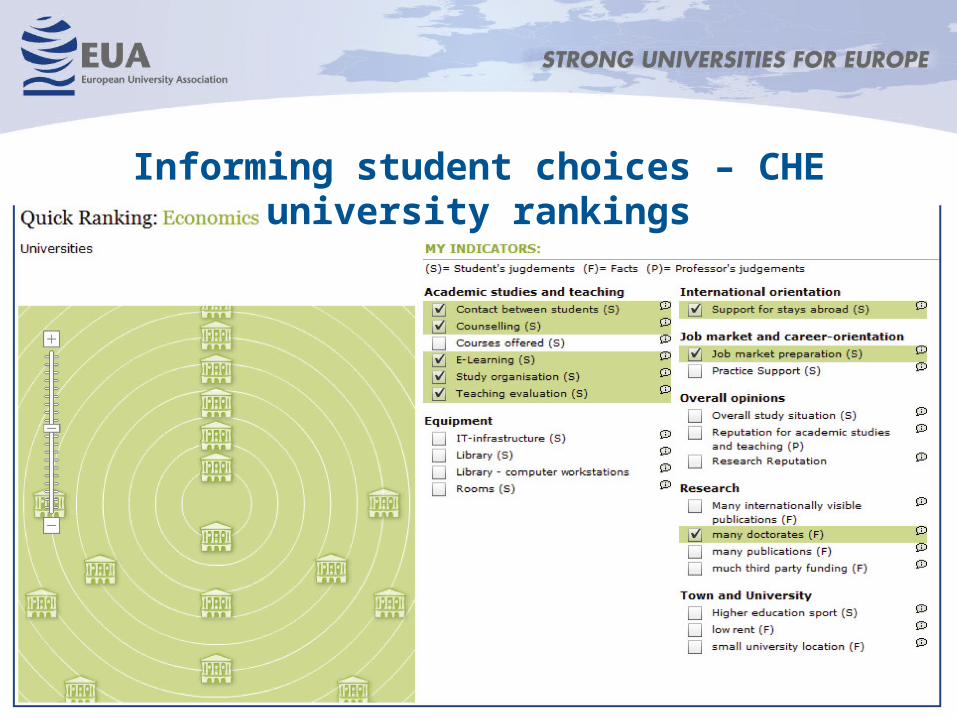
Informing student choices – CHE university rankings

Student profile
Teaching and learning
Research
Knowledge exc
International
Regional
U-map

The new developments: U-map U-Map has two visualisation tools allowing to classify HEIs and to make detailed comparison of selected HEIs.
Source: U-map
…24…

The new developments: U-Multirank
U-Multirank is a multidimensional ranking including all aspects of an HEI’s work – education, research, knowledge exchange and regional involvement.
No composite score is produced.
Has to be seen in future:
how well self-reported and student satisfaction data will work in international context,
whether other parties will turn Multirank into a league table and what will be the consequences
…25…

The new developments: AHELO
OECD’s AHELO project is an attempt to compare HEIs internationally on the basis of actual learning outcomes.
Three testing instruments will be developed:
one for measuring generic skills and
two for discipline-specific skills, in economics and engineering.
Questions yet to be answered are: whether it is possible to develop instruments to capture learning outcomes that are perceived as valid in diverse national and institutional contexts.
…26…

Main conclusions
1. Since arrival of global rankings then universities cannot avoid national and international comparisons, and this has caused changes in the way universities function.
2. Criteria that are appropriate for the top research universities only are applied for judging all unkversities
3. Rankings so far cover only some of university missions.
4. Rankings, it is claimed, make universities more ‘transparent’. However, the methodologies, especially those of the most popular league tables, still lack transparency themselves.
…27…

Each in his own opinionExceeding stiff and strong,Though each was partly in the right,And all were in the wrong!
by John Godfrey Saxe (1816–1887)

Thanks for your attention


