Baltic Sea Report Integrate. Compete. Grow Growth in the region is set to improve after a weak 2013 Baltic Sea index: no gains in structural competitiveness Reform push is needed to build competitiveness and growth Growth in the region is set to improve after a weak 2013 The Baltic Sea region growth in 2013 will be just 1%. The situation is very diverse, ranging from a 0.6% contraction in Finland to a 4.3% expansion in Latvia. The cause of the slowdown is not only weak external demand, but also structural weakness pertinent to the region’s economies themselves. With the global outlook improving, we see the region expanding by 2.4% in 2014 and 2015 − still below potential. Swedish growth will speed up to 3%, supported by an improving labour market, fiscal expansion, and export recovery. Its key risk is the housing market and rising household debt. For Latvia and Lithuania, we forecast about 4% growth in 2014 and 2015 on the back of a strong labour market and better global growth. Similarly for Estonia with perhaps somewhat slower growth in 2014 as it struggles with a very weak growth this year. The key challenge for the three Baltic states is the labour market, i.e., to balance wage and productivity growth. Baltic Sea index: no gains in structural competitiveness The region is in the top 30% globally for its structural quality, but its ranking has not improved over the past five years. The region’s top strength is education; the weakest areas are foreign trade, tax policy, and financial markets. Finland has risen to the top, while Russia is still the lowest. Over the recent years, the most improvement has come from those with the lowest ranks – Poland and Russia – but others have been less ambitious. In Sweden, the speed of reforms has slowed, and it has slid down the rankings. The Baltic states have regained macro stability but have failed to improve their structural quality faster than others. This lack of progress − especially for the Baltic states, − where structural quality is significantly below that of the Nordics and Germany − will impair their growth going forward. Reform push is needed to build competitiveness and growth Improving competitiveness is a major source of growth when the global economy is weak. Key to improving competitiveness is to strengthen regional integration, and structural quality is essential to facilitate this. Most of the growth potential in the region thus can be unlocked by raising structural quality in the lowest ranking countries, i.e., Poland, the Baltic states, and above all, Russia, which often ranks way behind the others. Swedish structural quality is very strong but would gain from improvements in education, infrastructure, and entrepreneurship. In the Baltics, improvements are necessary across the board to lift them closer to the Nordics and Germany, but the most urgent ones are those to support productivity growth and help ease labour market overheating pressures. A major boost to innovation is necessary for Latvia and Lithuania, and also for Estonia, to make adequate use of their education quality. Macro Research 28 November, 2013 Please see important disclosures at the end of this document
Transcript
November 28, 2013 Please see important disclosures at the end of this document Page 1 of 27
Macro Research - Baltic Sea Report
Baltic Sea Report
Integrate. Compete. Grow
Growth in the region is set to improve after a weak 2013
Baltic Sea index: no gains in structural competitiveness
Reform push is needed to build competitiveness and growth
Growth in the region is set to improve after a weak 2013 The Baltic Sea region growth in 2013 will be just 1%. The situation is very diverse, ranging from a 0.6% contraction in Finland to a 4.3% expansion in Latvia. The cause of the slowdown is not only weak external demand, but also structural weakness pertinent to the region’s economies themselves. With the global outlook improving, we see the region expanding by 2.4% in 2014 and 2015 − still below potential. Swedish growth will speed up to 3%, supported by an improving labour market, fiscal expansion, and export recovery. Its key risk is the housing market and rising household debt. For Latvia and Lithuania, we forecast about 4% growth in 2014 and 2015 on the back of a strong labour market and better global growth. Similarly for Estonia with perhaps somewhat slower growth in 2014 as it struggles with a very weak growth this year. The key challenge for the three Baltic states is the labour market, i.e., to balance wage and productivity growth.
Baltic Sea index: no gains in structural competitiveness The region is in the top 30% globally for its structural quality, but its ranking has not improved over the past five years. The region’s top strength is education; the weakest areas are foreign trade, tax policy, and financial markets. Finland has risen to the top, while Russia is still the lowest. Over the recent years, the most improvement has come from those with the lowest ranks – Poland and Russia – but others have been less ambitious. In Sweden, the speed of reforms has slowed, and it has slid down the rankings. The Baltic states have regained macro stability but have failed to improve their structural quality faster than others. This lack of progress − especially for the Baltic states, − where structural quality is significantly below that of the Nordics and Germany − will impair their growth going forward.
Reform push is needed to build competitiveness and growth Improving competitiveness is a major source of growth when the global economy is weak. Key to improving competitiveness is to strengthen regional integration, and structural quality is essential to facilitate this. Most of the growth potential in the region thus can be unlocked by raising structural quality in the lowest ranking countries, i.e., Poland, the Baltic states, and above all, Russia, which often ranks way behind the others. Swedish structural quality is very strong but would gain from improvements in education, infrastructure, and entrepreneurship. In the Baltics, improvements are necessary across the board to lift them closer to the Nordics and Germany, but the most urgent ones are those to support productivity growth and help ease labour market overheating pressures. A major boost to innovation is necessary for Latvia and Lithuania, and also for Estonia, to make adequate use of their education quality.
Macro Research
28 November, 2013
Please see important disclosures at the end of this document
November 28, 2013 Please see important disclosures at the end of this document Page 2 of 27
Macro Research - Baltic Sea Report
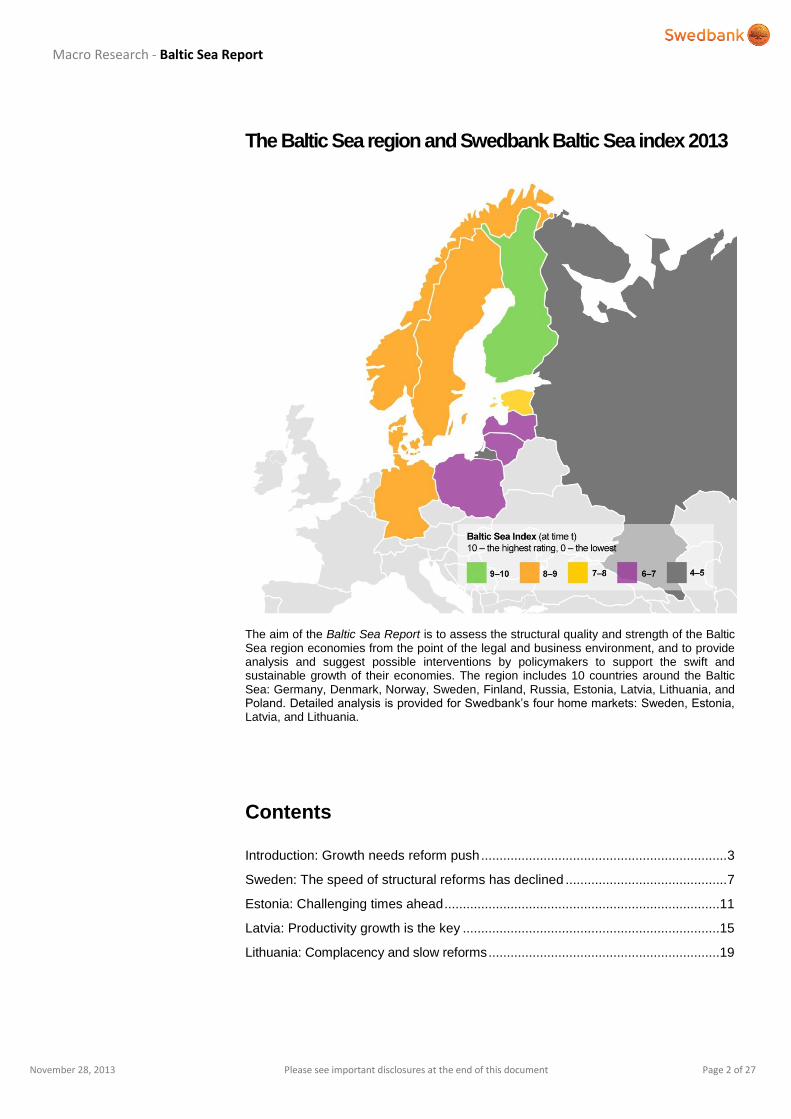
The Baltic Sea region and Swedbank Baltic Sea index 2013
The aim of the Baltic Sea Report is to assess the structural quality and strength of the Baltic Sea region economies from the point of the legal and business environment, and to provide analysis and suggest possible interventions by policymakers to support the swift and sustainable growth of their economies. The region includes 10 countries around the Baltic Sea: Germany, Denmark, Norway, Sweden, Finland, Russia, Estonia, Latvia, Lithuania, and Poland. Detailed analysis is provided for Swedbank’s four home markets: Sweden, Estonia, Latvia, and Lithuania.
Sweden: The speed of structural reforms has declined ............................................ 7
Estonia: Challenging times ahead ........................................................................... 11
Latvia: Productivity growth is the key ...................................................................... 15
Lithuania: Complacency and slow reforms ............................................................... 19
November 28, 2013 Please see important disclosures at the end of this document Page 3 of 27
Macro Research - Baltic Sea Report
Introduction: Growth needs reform push The global economy is gradually improving. The Baltic Sea region’s growth in 2013
has turned out to be weaker than expected, but the recovery is rooting in and growth
is set to speed up. The region can benefit from closer integration and bolder reform
agenda. According to the Baltic Sea index, most growth potential can be unlocked by
raising structural quality in Russia, Poland, and the Baltic states.
Global economic outlook: muddling through continues The euro area recession, which lasted for six quarters, ended in the second quarter of 2013, and growth is slowly picking up, supported by less fiscal tightening and loose monetary policy. There is progress on a banking union. The US has been quite robust to fiscal headwinds. China has so far managed to slow its growth in an orderly manner, and its recent Communist Party plenary session unveiled encouraging future structural reforms. For the Japanese economy, it seems that with “Abenomics”, this time it could be different, and it may finally break out of stagnation. Global confidence has improved, suggesting that the worst is most likely behind us. Long-term interest rates have risen sharply since the early summer. The talk of a US tapering heightened emerging markets’ turbulence but it soon calmed down. After a dip in global growth to 2.8% (PPP weights) this year, we expect it to strengthen to 3.5% and 3.9% in the next two years. While still contracting this year, the euro area will expand by 1.2% and 1.8%, and US growth will strengthen from 1.6% this year to 2.7% and 3.2% in the next two years, respectively. China will grow above 7% per annum.
1
But it is by no means smooth and easy. In Europe, growth is still fragile and patchy, demand is weak, inflation has slowed sharply, and fear of deflation has resurfaced. The ECB has cut its policy rate to a historic low 0.25% and will go to negative interest rates, if needed. There are views that an outright quantitative easing might still be necessary. The third quarter of 2013 GDP data have been less than robust – growth in France is not taking off, Spain has just marginally surfaced from recession, and Germany has had a soft patch. Unemployment in many European economies keeps rising. Structural reforms in countries that need them most (not least France) have often been less than half-hearted. The US political paralysis weighs down on recovery and confidence. Tapering, widely expected to start in September, has been postponed. In contrast, stock markets seem to have a life of their own, reaching for new highs amidst concerns about the robustness of economic recovery.
But why would this be smooth and easy? Subpar growth along with moody ups and downs dependent on policymakers’ decisions is the essence of the muddling through, which has long been our baseline scenario. For the global economy, these are still trying times. The decisions to be made are tough. Growth will remain bumpy and less than comfortable. Short-term interest rates will remain low for an extended period. The Fed is expected to start normalising its policy rate only in mid-2015, and the ECB will only follow. Yet, the worst seems to be behind us, and recovery is gradually gaining traction. Emerging markets still create most global growth, but advanced economies are gradually growing faster and increasing their contribution.
The Baltic Sea region growth is set to improve The region’s growth in 2013 has turned out to be much weaker than we had forecast in our previous Baltic Sea Report (October 2012). Throughout the year, the forecasts were
repeatedly lowered, and our current outlook for 2013 predicts only scanty 1% growth for the whole of the region, i.e., less than half of what we expected a year ago. This is set to be the second-weakest growth in more than a decade, scoring only above the 5.6% contraction of 2009. The major cause of the slowdown is weak external demand, but also structural weaknesses pertinent to the region’s economies themselves.
The situation across the region is very diverse, ranging from a 0.6% contraction in Finland to a 4.3% expansion in Latvia. Estonia and Russia unexpectedly slid into recession in the first half of this year (both exited it in the third quarter), and quite a few of the region’s ten economies have had a quarter of negative quarterly growth this year. The region is growing below its potential, and, perhaps, all but Norway and the three Baltic states have negative output gaps. With the global outlook improving, we see the region’s growth strengthening to 2.4% in 2014 and 2015. Better than the past two years, but below the past decade’s average, and most economies still struggling with negative output gaps. We believe that all the region’s economies by now have exited recession, but growth rates will still differ widely,
1 For details, see our latest Swedbank Economic Outlook http://www.swedbank-research.com/english/swedbank_economic_outlook/2013/q3/swedbank_economic_outlook_update_2013/index.cs
November 28, 2013 Please see important disclosures at the end of this document Page 4 of 27
Macro Research - Baltic Sea Report
e.g., in 2014 ranging from 1% in Finland to above 4% in Latvia. The Baltic Sea region over the next two years is forecast to grow faster than the euro area and Japan, but slower than the US and the global economy.
Germany, the region’s largest economy, has seen a volatile performance over the past year. Growth has been slow but now seems to be back solidly on track. Growth has turned more towards domestic demand as the labour market has been strong and exports were hit by global headwinds. With the headwinds calming, the labour market strong, and monetary policy easy, GDP growth is forecast to speed to about 2% in 2015 from just 0.5% this year. One of the major medium-term risks for Germany is the very low euro area interest rates (much below the ones suggested by Taylor rule-type estimates) – such a risk is likely to be addressed via macroprudential policies, but there is no need for additional measures as yet.
Finland and Denmark have also hit a soft patch, but recovery is finally there, and growth is seen to gradually rise to nearly 2% by 2015. Much depends on future export growth, and consumers are for now trying to bridge the gap. Many imbalances still need to be unwound, e.g., the unit labour cost rise and electronics industry decline in Finland. Norway recently fared better than any of the other Nordic economies, but its exceptionalism is over, and growth is forecast to flatten out at 2%. Weakening investment in the oil sector and housing is being counteracted by expansionary fiscal and monetary policies, and currency depreciation. Norway’s key risk is the housing market developments.
Poland – the region’s only economy to evade recession following the Lehman Brothers’ bust in 2008 – also sees growth gaining strength. Headwinds from a public investment slump and fiscal austerity are increasingly being counterbalanced by export recovery and consumption, but GDP growth is still forecast at only about 2.5% over the coming two years.
Russia has seen by far the largest forecast downgrades of the region’s economies this year. It has exited the recession it slid into early in the year, but the recovery is set to be disappointing by historic standards. A weak global commodity outlook and little room for fiscal (unemployment already low) and monetary (inflation above target) stimuli – but most crucially, a lack of reforms to boost business investment and industrial output – mean that Russia permanently shifts to a lower gear. We see 1.3% growth this year and it is unlikely to exceed 2.5% over the medium term. A weak Russian economy increases risks to its trade partners as in trying times it has often resorted to protectionism.
Developments have also been sundry in Swedbank’s four home markets. Sweden has seen a very volatile growth pattern over the past year, with quarterly growth rates interchangeably shifting from positive to negative numbers. We forecast growth to rise from 1.1% this year to about 3% in the next two years. With the global situation improving, export growth is set to turn positive again, and this will also pull up the currently very weak investment activity. But the key driver will remain household spending, supported by an improving labour market and fiscal expansion. A major internal risk is the housing market and rising household debt. The issue has long been identified, but an adequate policy response remains a challenge.
After deep recessions and forceful reactions to restore macro stability, the three Baltic states were back to growth already in 2009. Crisis economics is long gone, and standard business cycle issues are back. Due to poor external demand, exports and investments have weakened and consumption is now the key driver of growth. Yet, the underlying growth model for them is export-driven growth. Exports and investments will gain from the global recovery, and growth is seen at about 4% in 2014-2015. Perhaps a somewhat slower growth for Estonia in 2014 as it struggles with a very weak growth this year. The key challenge for the three Baltic states is to balance wage and productivity growth and build competitiveness
Economic growth in the Baltic Sea region, %
Average of 2001-2011 2012 2013f 2014f 2015f
Denmark 0.7 -0.5 0.4 1.7 1.9
Estonia 4.3 3.2 1.6 3.8 4.2
Finland 1.9 -0.2 -0.6 1.0 1.8
Germany 1.2 0.7 0.5 1.9 2.0
Latvia 4.1 5.6 4.3 4.3 4.2
Lithuania 4.8 3.6 4.0 4.0 4.5
Norw ay 1.5 3.1 1.7 2.0 2.0
Poland 4.0 1.8 1.3 2.4 2.7
Russia 4.9 3.4 1.3 2.8 2.8
Sw eden 2.3 0.7 1.1 3.2 2.9
Baltic Sea region (2012 PPP w eights) 3.0 1.9 1.0 2.4 2.4
Source: World Bank, Swedbank f orecasts (Swedbank Economic Outlook, October 2013)
The Baltic states:
watch out for labour
market warming up
Sweden: growth roots
in, watch out for
household debt
November 28, 2013 Please see important disclosures at the end of this document Page 5 of 27
Macro Research - Baltic Sea Report
– the Estonian labour market has already warmed up and this is a near-future risk for Latvia and Lithuania.
The Baltic Sea region can benefit from closer integration Foreign trade drives a large part of the region’s growth. In 2012, the region’s current account surplus was 5.4% of GDP. It was not only due to Germany’s 7% of GDP surplus – Russia, Denmark, Sweden, and Norway had surpluses from 3.5% to 14.3% of GDP. The remaining countries had low-single-digit deficits, largely driven by their investment needs. For the region’s smallest economies, within-the-region-trade is the largest share of their trade flows, e.g., for Estonia and Latvia in 2012 the share of the other Baltic Sea region countries stood at 68% of their total foreign trade turnover in goods (64% for Lithuania). Germany had the least exposure to the rest of the region, with only 14%. Interdependence amongst the region’s economies and the dependence of smaller economies on being subcontractors for larger ones is high. The close integration is in foreign direct investment flows – in the Baltic states, about half have come from the region’s other economies (for Sweden, the respective number is 18%). In many cases, the Baltic Sea region countries are each other’s best friend.
Strong competitiveness permits to decrease vulnerability to faltering global demand but also gain more during periods of strong global growth. Our region’s competitiveness can benefit from its exploring further avenues for closer integration, specialisation, cost advantages, and risk diversification. To support this, solid structural qualities of the economies are key.
Baltic Sea index points to lack of ambition; reform boost is needed Since 2010 we have published an index assessing the Baltic Sea region’s competitiveness and structural development: the Baltic Sea index (BSI). The region’s countries are ranked in relation to each other and the rest of the world. We have selected 10 areas as a basis for the overall index. Each area consists of several underlying components. The list is not complete, but it should serve as a good indicator of improvement in the business climate in relation to other countries. Countries are ranked from 0 to 10, where having a rank between 9 and 10 implies that in the selected area the country belongs to the top 10% of best- performing countries in the world. A country index is an average of all 10 areas. A regional index is an average of country indices. The index allows us to track a country’s performance compared with others overall, and across 10 selected areas against others and its own past.
Note that if every country in the world improves at the same rate, our index and the country ranking will not change, because it measures comparative progress. The changes between countries indicates whether they have improved or slid backward. The index is slow to react to policy changes since (i) reforms often take time to take effect, and (ii) there is a measurement lag because collecting internationally comparable data takes time and index values published in, e.g., 2009 are based on measurements done in 2008 or even 2007.
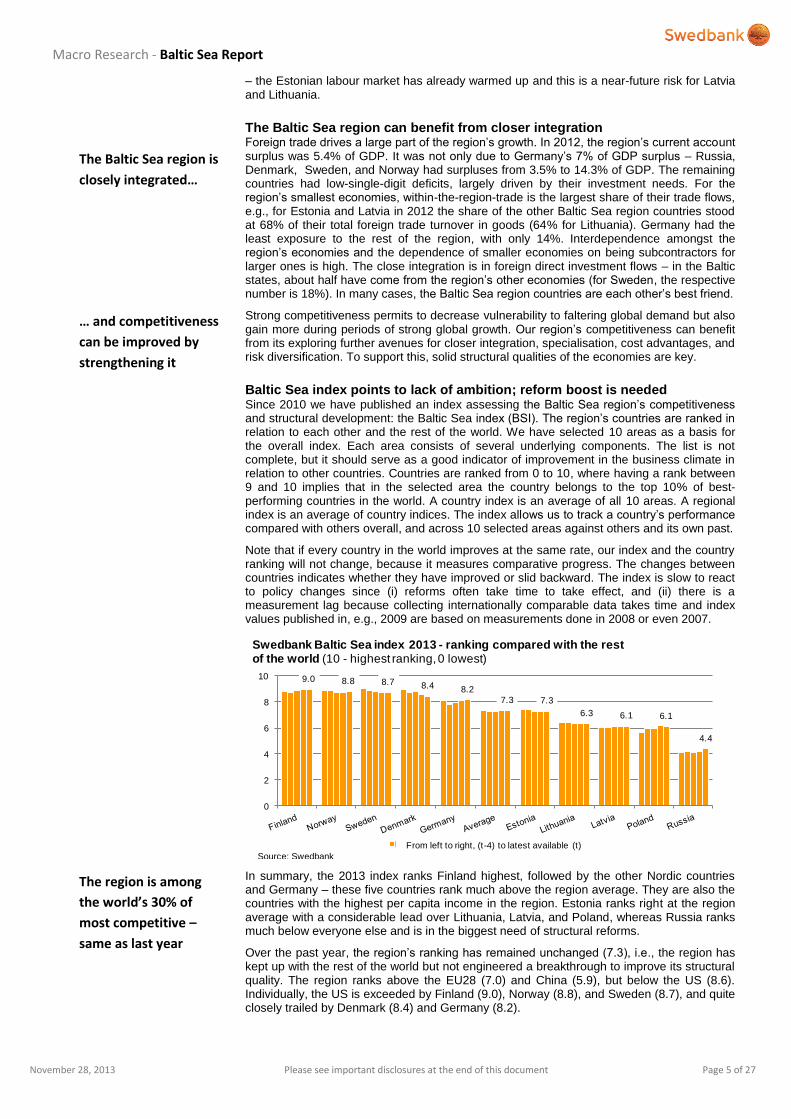
In summary, the 2013 index ranks Finland highest, followed by the other Nordic countries and Germany – these five countries rank much above the region average. They are also the countries with the highest per capita income in the region. Estonia ranks right at the region average with a considerable lead over Lithuania, Latvia, and Poland, whereas Russia ranks much below everyone else and is in the biggest need of structural reforms.
Over the past year, the region’s ranking has remained unchanged (7.3), i.e., the region has kept up with the rest of the world but not engineered a breakthrough to improve its structural quality. The region ranks above the EU28 (7.0) and China (5.9), but below the US (8.6). Individually, the US is exceeded by Finland (9.0), Norway (8.8), and Sweden (8.7), and quite closely trailed by Denmark (8.4) and Germany (8.2).
9.0 8.8 8.7 8.4 8.2
7.3 7.3
6.3 6.1 6.1
4.4
0
2
4
6
8
10
Swedbank Baltic Sea index 2013 - ranking compared with the rest of the world (10 - highest ranking, 0 lowest)
(t-4) (t-3) (t-2) (t-1) Latest available (t)
Source: Swedbank
From left to right, (t-4) to latest available (t)
The Baltic Sea region is
closely integrated…
… and competitiveness
can be improved by
strengthening it
The region is among
the world’s 30% of
most competitive –
same as last year
November 28, 2013 Please see important disclosures at the end of this document Page 6 of 27
Macro Research - Baltic Sea Report
Compared with last year’s index, Denmark and Poland have marginally slid down in their rankings, whereas Russia and Germany have somewhat improved; the rest have not seen noticeable changes. Russia made the largest advances last year but from very low levels.
A look at the whole of the BSI series (available since 2009) uncovers trends often disguised by year-to-year shifts. As for the country ranks, over the five years Sweden and Denmark have slid down in their ranks from the region’s first and second, respectively, to third and fourth positions. Finland has done the opposite by climbing from fourth place in the region to the top, with the key improvements in tax policy, financial markets and logistics. Other large movers up over the past five years have been Poland and Russia. Poland has been particularly persistent in improving its infrastructure, entrepreneurship environment, and tax policy. The overall feeling about the country dynamics is that improvement has come from those with the lowest ranks, whereas others have been less ambitious. It is disappointing that the Baltic countries have not improved significantly – they have held on with others, but, in contrast to Poland and Russia, been unable to outperform others and climb up the ranks. Recession in the Baltics was deep, and most attention seems to have gone to regaining macro stability while micro level structural reforms seem not to have been sufficiently addressed. This is likely to slow growth going forward, and it needs to be addressed quickly.
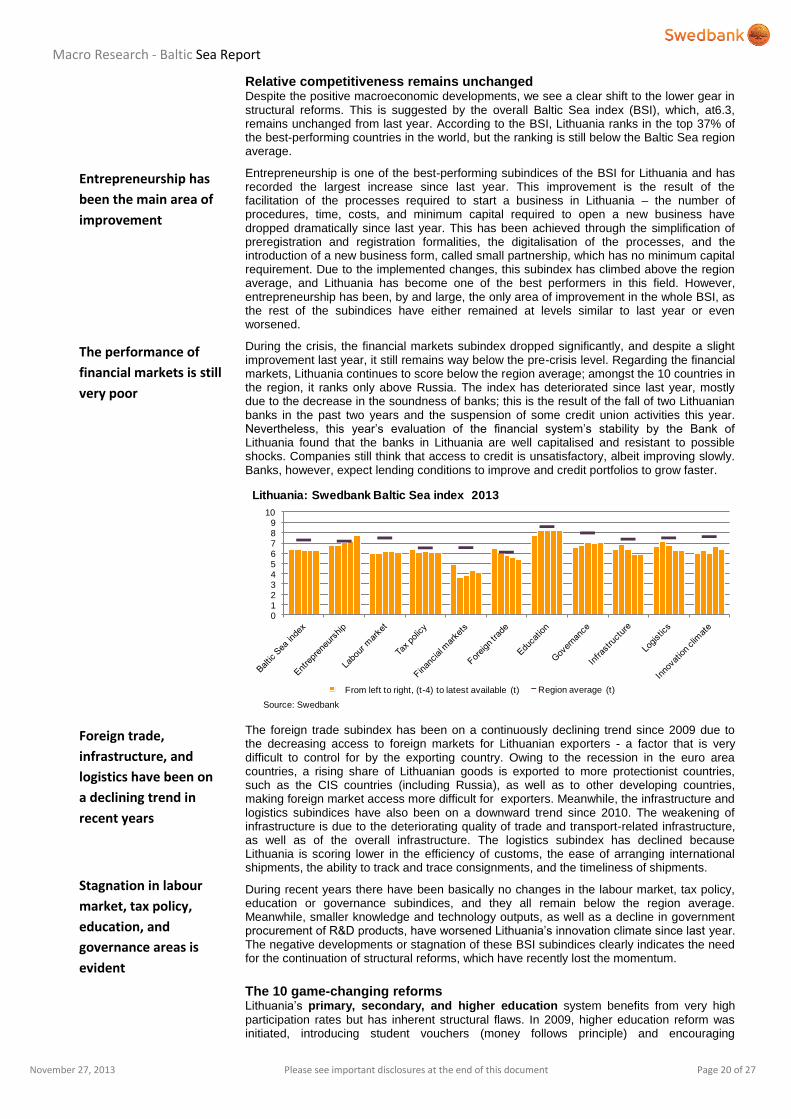
If we look at the 10 areas of the index, the Baltic Sea region’s strengths are in education (8.6) and governance (8.0). As for education, Finland is the best in the world, but others also rank well, showing that this is a common strength. Governance is exceptionally strong in the Nordics and Germany (all in the top 10% globally) and the rest of the region is quite good as all fit into the top 30%. The exception is Russia, which in governance ranks just a hair above the bottom 20% in the world. The region ranks well in innovation (7.7), but it should do better than that, given the overall good education quality. A major boost to innovation is necessary in Latvia, Lithuania, Poland, and Russia – they must raise investment in research and development from the currently very low levels, and make their institutional frameworks more innovation friendly to, e.g., patent registration.
The region’s weakest areas are foreign trade (6.2), tax policy (6.6), and the financial markets (6.6). Part of the financial markets’ problem is cyclical (i.e., banks in Denmark), but for many it is a lack of intermediaries other than banks and the shallowness of such alternative markets. Strengthening entrepreneurship (7.2) would also be beneficial – even the region’s two top performers can just squeeze into the world’s top 18%. But the key weakness comes from the region’s uneven structural quality. Yet, this also hides a great potential for income growth that could come by fixing it. Major gains are to be unlocked in Russia, Poland, Latvia, Lithuania, and also Estonia. For instance, Russia has by miles lower ranks than anyone else in governance, foreign trade, logistics, and infrastructure – it is quite obvious that Russia by many measures represents a very different quality and risk than the rest of the region. Improving Russia’s structural quality and competitiveness would sharply push up the region’s potential to create a more dynamic and productive environment.
Improving competitiveness is the key source of growth when the global economy is weak. Many economies are aggressively slashing their labour costs while the Baltic Sea region economies see theirs rising. Many long-term trends, such as aging and shrinking populations, put the region at disadvantage against others. The only sustainable way ahead is to raise productivity, which requires investment. The region’s strength is its institutional quality and well-educated labour force. The policymakers would benefit in the medium to long term by doing their best to advance structural qualities that have been proved to be crucial to generate growth – to create a dynamic basis for activity, start-ups, and ideas, and to attract capital to profit from it. And there is no time to wait – as the BSI clearly shows, improving against ourselves is not sufficient: to climb up the ranks, one must improve faster than others.
Mārtiņš Kazāks
7.3 7.2 7.5
6.6 6.66.2
8.68.0
7.4 7.5 7.7
0
2
4
6
8
10
Swedbank Baltic Sea index 2013
Region average Highest LowestSource: Swedbank
The region’s strength is
in education and
governance
Most growth potential
to be unlocked by
raising structural
quality in Russia,
Poland, and the Baltic
states
Lack of ambition:
Sweden has slid down
in the rankings, but the
Baltic states have
failed to improve
November 28, 2013 Please see important disclosures at the end of this document Page 7 of 27
Macro Research - Baltic Sea Report
Sweden: The speed of structural reforms has declined In the Baltic Sea index, Sweden has an unchanged score of 8.7; this was the third
best among Baltic Sea countries, surpassed by Finland and Norway. The trend,
however, is downward, which means other countries in the world are catching up. To
strengthen competitiveness and improve mobility on the labour market, more
emphasis on education, infrastructure, and entrepreneurship are needed.
Surge postponed but growth is set to pick up The recovery in the Swedish economy has been sluggish during 2013 despite an improvement in confidence and a resilient labour market, which has experienced robust job creation. Swedish exports have declined due to subdued external demand and a relatively strong krona. The combination of low inflation rate and rising household debt presents a dilemma for the Riksbank’s monetary policy. The probability of a cut in the repo rate has increased recently due to a weaker macroeconomic performance and a lower inflation rate. On the financial market, there is an expectation of a rate cut in December, and the krona has started to depreciate. The Financial Supervisory Authority (FSA), which will supervise the macroprudential tools, has announced that raising risk weights on mortgages from 15 % to 25% could be a sound decision for financial stability. Although FSA’s proposal will not be decided until later in 2014, this gives a possibility for the Riksbank to focus more on inflation targeting. An intense discussion about increasing the loan amortisation for households could explain the subdued growth in private consumption.
In 2014 and 2015, we foresee an increase in GDP growth to about 3% per year from approximately 1% in 2013. Lower income taxes, increasing asset prices, and an improving labour market are expected to boost private consumption. A more favorable demand composition in the external markets will raise Swedish exports next year after this year’s decline. We foresee a pickup in the inflation rate next year, due to base effects and stronger domestic demand. The Riksbank is expected to raise the repo rate during the second half of next year, but the risk of a postponement in the repo rate patch has increased lately. Also, implementation of macro prudential tools will play a more important role in monetary policy, going forward.
Expansionary fiscal policy before the 2014 election In September 2014, parliamentary and municipality elections will be held. The right-wing coalition government, the Alliance, has lost public support, with approval ratings falling to 35% in November 2013. Two parties within the Alliance could eventually drop out from the parliament if the low opinion figures – below 4% in different polls – do not improve. The opposition parties – the Social Democrats, the Left Party, and the Green Party – are now favored by a majority, 50.9%, according to opinion surveys. Left and Green government alternative will probably not be established before the next election, partly because of the resounding defeat of the Social Democrats in the 2010 election. Instead, the Social Democrats have been trying to invite a coalition with the right-wing parties. In this connection the third largest party, the anti-immigration party – Sweden Democrats – could have a significant impact on the composition of the new government. The Alliance, which earlier had been careful about implementing fiscal stimulus introduced in September an expansionary budget for next year; amounting to SEK 25 billion.
During spring 2013, the government put aside an extra SEK 0.9 billion for this year and SEK 1.2 billion for next year to investigate improving the possibilities for increasing investments in infrastructure directed to the operation and maintenance of the railway. The money allocated towards these sectors was relatively limited. In the budget proposal for 2014, the government announced that around 80% of the discretionary funds budget will focus on improving disposable income for households. The remaining approximately 20%
14 September, 2014 Gross nominal w age grow h, % 3.4 3.0 2.7 2.9 3.2
Next municipalities election: Current account balance, % of GDP 7.0 6.6 6.2 6.0 5.5
14 September, 2014 General government budget balance, % of GDP 0.9 -0.6 -1.4 -1.1 -0.5
Source: Statistics Sw eden, Sw edbank
November 28, 2013 Please see important disclosures at the end of this document Page 8 of 27
Macro Research - Baltic Sea Report
will be divided amongst labour market policy reforms, education, and small-scale ventures for small and medium-sized companies (SMEs). For example, the reforms include a two-step career ladder for teachers, tax deductions for small companies involved in R&D, and a 10% cut in payroll tax for people working in R&D. No comprehensive ventures to stimulate infrastructure construction were presented. However, the right-wing parties have now announced that SEK 25.7 billion will be spent on nine new metro stations in the Stockholm region and vehicles, etc. The project will partly be financed by the parties themselves, and partly by a higher congestion tax at existing and new stations.
Baltic Sea index – Sweden is losing steam Sweden still ranks amongst the highest-scoring countries in the Baltic Sea index. In 2013, Sweden’s total index is 8.7, unchanged from the year before. Sweden has dropped one place in the rankings from last year to third place, surpassed by Norway and Finland. Since 2009, Sweden’s trend has been downward, and the index has declined by 3.1% – the largest fall amongst the Baltic Sea countries except Denmark. This should be a signal for Swedish politicians to step up the pace of structural reforms in order to strengthen the growth potential in the Swedish economy.
During the past two years, Sweden’s subindex score for infrastructure has been lower than in 2009-2011. In comparison to other countries, however, Sweden still has a high score, and the ranking of the subindex has moved up from third to second place. The downward trend in the Swedish subindex is mainly driven by the overall quality of infrastructure. One explanation for this decline in quality is that, although the Alliance in 2012 proposed to invest SEK 522 billion in infrastructure over 12 years, less than half of the sum was to be spent on operations and maintenance, and on reinvestment in railways and roads. The parliament accepted the proposal. Since better infrastructure is crucial in order to alleviate the bottlenecks on the housing market, to lower the unemployment rate, and to meet the competition from Germany, we consider that the authorities should act as soon as possible in this area. An improved infrastructure in the greater metropolitan areas would make it more attractive to build in the suburbs, where land is cheaper, thereby increasing the housing supply and contributing to growth.
Although Sweden still scores above the average on the education subindex, the trend has been declining in recent years; Germany has now surpassed Sweden. According to Statistics Sweden, the share of people between the age of 25 and 64 who have higher education has been relatively constant (38-39%) since 2011. Going forward, Statistic Sweden forecasts that the number of students in upper secondary schools will decline due to demographics. This process already started in the 2008/2009.
The decline in the subindex for entrepreneurship should be an alarm bell for Swedish politicians. In the latest Baltic Sea index, the score is 7.5, the lowest figure in the Nordic countries. At the same time, other countries in the region are moving up. Cutting the red tape for Swedish SMEs has not worked out as expected. The innovation climate, although still favorable, with a score of 9.5 in the Baltic Sea index, has decreased slightly in recent years, mainly because the government’s effectiveness in procuring technical products has declined. We therefore welcome the less-costly ventures presented by the government in the budget bill for 2014. For example, higher tax incentives for research by smaller companies and a new innovation fund for environmental technology companies were suggested. Politics that improve the innovative climate can, in the long run, raise economic growth, foster job creation, and increase product development.
0123456789
10
Sweden: Swedbank Baltic Sea index 2013
(t-4) (t-3) (t-2) (t-1) Latest available (t) Region average (t)
Source: Swedbank
From left to right, (t-4) to latest available (t)
November 28, 2013 Please see important disclosures at the end of this document Page 9 of 27
Macro Research - Baltic Sea Report
During the government’s length of office, the Alliance has focused on increasing employment and the labour supply by lowering income taxes and making social benefits less favourable. These measures have, to some extent, had a positive impact on the labour market. The subindex for the labour market has improved lately and is, together with Norway’s subindex, the highest in the Baltic Sea region.
Nevertheless, further labour market reforms are needed to lower the unemployment rate, which is around 8%. Otherwise, the nonaccelerating inflation rate of unemployment (NAIRU) will be unsatisfactorily high. A larger share of those joining the labour force lack the qualifications that firms require, and an increase in long-term unemployed means that a larger group becomes less attractive to employers. Employers tend to be cautious about recruiting those who have been out of work for long periods. Taking these factors together, there is a risk that these people could prevent a permanent decrease in unemployment. These problems may, in addition, mean that the Riksbank will see risks to inflation at event relatively high levels of unemployment and thus pursue a less expansionary monetary policy.
Medium-term challenges and policy suggestions The Swedish economy has become more service intensive in recent decades, a trend that will continue. The knowledge-intensive services sector accounts for a large part of the job creation in the economy, and the surplus in foreign trade from services is now larger than from goods. The need for high-skilled labour will continue, driven by specialisation and increasing competition. To secure the supply of labour needed, additional measures to improve the education system should be taken. In this connection, Finland’s educational system is generally viewed as a success.
In a newly published report the Boston Consulting Group (BCG) concludes that the Finnish success comes from treating all students equally and giving them the possibility to use their full potential. According to the BCG, Finland has, amongst others, focused on basic subjects, redistributed the best teachers, established outstanding teacher training, and allocated resources flexibly. In the budget proposal for 2014, the Alliance put forward reforms that resemble the Finnish strategy. For example, beginning this autumn, the term for mathematics classes in elementary schools has been extended also, it should be easier for students to get help with homework. Going forward, we believe that the government should also look at the resources allocated to computer skills and programming since these subjects are gaining importance. In the BCG report, it is argued that the educational system should be changed. For example, higher education should be constructed in such a way that supplies the skills needed in the economy; also, more supervision from control bodies is needed. Currently, study and career advice is given low priority, and the collaboration between schools and the rest of the society could be improved.
In order to simplify young people’s adaption to the working life and to provide employers with a long-term skills supply, the government announced in the budget bill for 2014 that young people will get work-introduction jobs. To encourage the use of these jobs, the government will initiate a subsidy for wages and provide support to instructors, at a total cost of SEK 2,500 per month. This is the first step in the right direction.
Before the election in September next year, policies on education will most likely get more attention. The liberal party, Folkpartiet, whose lead issue has been education, has lost voters’ confidence on this matter, while the left-wing party, the Social Democrats, has used it to its advantage. We expect somewhat more aggressive policies to be implemented after the election. A challenge will be to find housing for the young people, not least the students. Investments in infrastructure to enlarge the labour market regions and make the labour and housing market more flexible could have a positive impact on growth, both nationally and locally. The demand for housing is outstripping supply – especially in urban areas – owing to several constraints, including the monopoly enjoyed by local municipalities over planning and zoning, a highly regulated rental market, lengthy bureaucratic processes for permits, and strict zoning and environmental regulations. These constraints, combined with low financing rates for consumers, have caused house prices to raise.
Well-coordinated steps to gradually increase land supply and to strengthen the incentives to invest in residential construction would help ease supply-side restrictions, e.g., by making additional reforms in the rental market, simplifying building regulations, and increasing competition in the construction sector. Stronger construction activity and the removal of bottlenecks for relocation would, in turn, support growth both in the short and longer term. This assumes a growing cooperation amongst municipalities. Positive signals have been coming from the Stockholm region lately, where there has been intensive cooperation to improve the infrastructure and increase investments in housing.
Sweden is a small, open economy and is to a large extent still very dependent on a few large firms, particularly in exports and investment in R&D. Since the competition has increased sharply in the manufacturing and private services sectors future investment plans depend largely on how the business climate develops. How to implement further measures
The education system
and the housing
market are upcoming
challenges
The education
system and the
housing market will
pose challenges
Strengthening the
business climate for
SMEs is an upcoming
challenge
Labour market reforms
are good, but not
enough
November 28, 2013 Please see important disclosures at the end of this document Page 10 of 27
Macro Research - Baltic Sea Report
to improve the business climate and strengthen entrepreneurship is still a challenge; another challenge is how to stimulate SMEs to grow. Today, a large share of SMEs are not planning to grow although they have potential to grow, according to a Swedbank SME surveys
The labour market reforms must continue. Vulnerable groups, such as the young, low-skilled, and foreign born, are particularly exposed to unexpected slowdowns in growth. They also face a higher risk than others of long-term unemployment, which could lead to a loss of skills and earning capacity. Stimulating demand for these groups in a targeted way and continuing to help them improve their job skills through vocational training and education would improve the matching process between workers and available vacancies; it would also facilitate career transition, especially from school to work. This would help reduce unemployment and support growth. Easing the still-high levels of job protection on permanent job contracts could reduce the duality in the labour market and improve the overall labour market efficiency.
Cathrine Danin Jörgen Kennemar
Additional labour
market reforms are
needed to address
unemployment
challenges
November 28, 2013 Please see important disclosures at the end of this document Page 11 of 27
Macro Research - Baltic Sea Report
Estonia: Challenging times ahead Estonia’s economy is struggling this year, with modest export and investment
volumes, but growth is expected to accelerate next year. A shrinking and aging
population will add pressure to the labour market and public finances. Estonia’s
business environment slightly improved in 2013, according to the Baltic Sea index,
but more efforts are needed to increase competitiveness and productivity.
Growth slows and main risks to the downside In Estonia, GDP growth will temporarily decelerate to around 1% in 2013 from 3.9% in 2012. The third quarter’s disappointing growth figure makes our latest forecast, shown in the table above, look too optimistic. Lower growth comes from a decline in general government investments in buildings and infrastructure, smaller growth in exports, hit by low demand, notably in Finland and Russia, and smaller volumes of transit goods and services. The logistics sector has been hurt by Russia’s development of a competitor port near St. Petersburg. This year, private consumption is the main engine of growth in Estonia, supported by fast growth of real wages and employment.
EU transfers and Estonia’s government revenues from carbon dioxide quota sales contributed to the fast growth of government investments in buildings and infrastructure last year. This year, government investments will decrease considerably until the funds under the new EU financial framework are deployed. Enterprises’ investments are hampered by low capacity utilisation figures. There is more spare production capacity in industries producing intermediate goods, hit by low export demand, and less in industries producing consumer goods, benefitting from strong domestic demand.
In our baseline scenario, we expect economic growth to gradually pick up to around 4% in the medium term with the recovery of foreign demand and investments. Economic activity in Estonia’s main trade partners is expected to slowly pick up next year, boosting Estonia’s exports.
However, there are several risks that threaten the outlined growth forecast. First, the recovery of demand of Estonia's trade partners may be slower than anticipated. The EU economy is still burdened by high public and private debt levels, high (structural) unemployment, and non-performing loans in some banks. Economic growth in Estonia, with its export share above 90% of GDP, substantially depends on external demand. Second, real estate prices in Sweden have been growing rapidly in recent years; there is a risk of a correction of these prices, if the policy response is not sufficient, that would have an impact on the region’s growth and financing.
Internally, Estonia’s real estate prices are also growing rather fast. However, there are currently no signs of overheating on the real estate market. Activity on this market has increased, but the rise in prices has been uneven and mostly affected by a limited supply in specific market segments. Although demand for loans has increased, the role played by the loan market in housing purchases or in financing construction has been smaller, and lending more conservative, than in the previous growth cycle.
The main risk to the economy stems from the labour market, as wages are growing much faster than productivity, driving up unit labour costs and prices, especially in the services sector. Although the unemployment rate remains relatively high, corporations are facing difficulties in finding suitable matches in the labour force. Labour demand is growing faster than labour supply, pushing up wages. In addition, Estonian employers face competition from abroad, especially Finland, where the wage level is considerably higher.
In the medium term, the challenge of the lack of suitable labour will sharpen. The supply of labour will decrease, as the decline in the working-age population will be bigger than the increase in the participation rate. The unemployment rate is also forecast to decline, making
1 March, 2015 Gross nominal w age grow h, % 9.6 5.7 6.7 6.6 6.6
Next municipalities election: Current account balance, % of GDP -7.4 -1.8 -1.4 -1.3 -1.1
15 Oct, 2017 General government budget balance, % of GDP 0.6 -0.2 -0.2 -0.6 -0.7
Source: Eurostat, Statistics Estonia, Bank of Estonia, Swedbank
November 28, 2013 Please see important disclosures at the end of this document Page 12 of 27
Macro Research - Baltic Sea Report
it even more difficult for companies to hire additional labour when demand picks up. Nevertheless, the share of enterprises’ personnel expenses in total costs or sales has not increased so far, and the overall profitability of Estonian enterprises remained good in the first half of 2013. Also, core inflation remains low and inflation expectations limited. But eventually growing labour costs are expected to start affecting enterprises’ profitability. It remains to be seen whether enterprises will be able to increase productivity levels to match higher labour costs.
The latest census showed that Estonia’s population is shrinking faster than was forecast. The UN projections
1 show that Estonia’s working-age population will decrease between
2010 and 2020 by 60,000, around half of the size of Estonia’s second-biggest city, Tartu. During just one year, 2012, Estonia’s population shrank by 0.6%, mostly due to negative net migration, although population growth also remains negative. This is increasing the pressure on the labour market and public finances. Emigrants are predominantly women and aged 20–44, so the country will lose not only it’s emloyees and taxpayers, but also potential mothers of future generations’ labour force and taxpayers. Already by 2012, more than 80,000 Estonians (6.4% of the population) were living abroad, either working or studying, according to the Population Register.
Estonia applies annual quotas for labour migration, up to a ceiling of 0.1% of the population. An Estonian government action plan stipulates that by 2015 residence permit regulations should be modified to create a favourable environment for foreign students and specialists.
2
In 2013, amendments were enforced to the Aliens Act, which facilitates the immigration of highly qualified specialists. However, the general attitude towards immigration remains cautious amongst politicians.
Shrinking and aging population will pressure labour market and public finance The tax burden in Estonia increased during the crisis years and reached 33% in 2011 (the EU average in 2011 was 39% of GDP). In 2007-2011, while the tax burden was decreasing by 0.5 percentage point in the EU, it was increasing by 1.5 percentage points in Estonia. Estonia’s tax burden is lighter than the EU average due to lower taxes on capital. At the same time, taxes on consumption are higher than the EU average. The ruling coalition aims to raise indirect taxes (excise and environmental taxes) and lower direct taxes (the unemployment insurance tax in 2013 and the income tax in 2015). The Ministry of Finance forecasts the tax burden to ease slightly in the coming years as tax revenues will grow a bit slower than nominal GDP.
The government’s medium-term objective is to maintain a general government structural surplus.
3 Estonia managed to achieve this objective until the global economic crisis hit in
2008, when the budgetary position of the general government fell into a structural deficit. Since 2009, the Estonian general government has again registered structural surpluses (0.4% of GDP in 2013 and 0.7% of GDP in 2014, according to the Ministry of Finance forecast
4).
The state budget for 2014, currently being discussed in the parliament, foresees an increase in most areas of government expenses. The government plans to raise the payroll in all areas of the government by 5.1% (i.e., below Swedbank’s latest forecast of the growth of average gross wages, 6.6% for 2014), and pensions by 5.8% on average. Average gross wages in public administration were 2.3% lower in 2012 than in 2008, while average gross wages in the whole economy have grown by 7.5% and consumer prices by 12.3% during the same period. In the area of infrastructure, Estonia plans to make the first contribution to the Rail Baltic joint venture, which is a step towards the construction of a fast railway between Tallinn and the Lithuanian-Polish border, and prepare the establishment of additional connections to the electrical systems of neighbouring countries.
5 It is hoped that improving
transport and energy connectivity will lower production costs and attract more foreign investments.
In 2012, general government debt increased from 6.1% to 9.9% of GDP. The main reasons for this increase were a rise in the volumes of the European Financial Stability Fund and the use of credit from the European Investment Bank to co-finance structural funds. General government debt is expected to stay around 10% of GDP in the medium term, the lowest level in the EU.
1 UN population projections, updated in 2012: http://esa.un.org/unpd/wpp/index.htm 2 OECD. Country Notes: Recent changes in migration movements and policies:
http://www.oecd.org/els/mig/ESTONIA.pdf 3 The actual budget balance net of the cyclical component and one-off and other temporary measures. The
structural balance gives a measure of the underlying trend in the budget balance. 4 Ministry of Finance. Estonian 2014 draft budgetary plan: http://www.fin.ee/doc.php?110120 5 Ministry of Finance. The government approved the state budget for 2014:
November 28, 2013 Please see important disclosures at the end of this document Page 13 of 27
Macro Research - Baltic Sea Report
Nevertheless, Estonia, like most countries in Europe, has to seriously think about the sustainability of its public finances in the long term. Although, at the moment, the public debt level is the lowest in the EU, Estonia’s population is shrinking and aging at one of the fastest paces in Europe. This is going to increase significantly public spending needs. The share of fixed costs is already around 70% of the state budget, and it is going to increase further in the coming years as social costs will rise faster than state revenues, limiting the flexibility of public finances and giving less room for infrastructure investment to enhance the state’s competitiveness.
In 2010, the parliament decided to increase the retirement age from the current level of 63 years for men and 62 years for women to 65 years for both by 2026. However, the Ministry of Finance admits itself that “additional decisions may be required in the future regarding the pension system.”
6 In addition to the pensions, reforms are also needed in the health care
sector, which is going to be affected by the changes in demographics. Currently, the tax burden is expected to be reduced in the medium term, as hikes in excise duties will not offset the one percentage point decrease in the income tax rate in 2015.
One way to increase tax receipts is to fight against tax evasion, and this is one of the priorities of the government for 2014. In order to curb VAT evasion and the payment of unofficial wages, the Tax and Customs Board is planning to implement a system of e-invoices and to improve the principles of registering employees.
7 Unofficial wages resulted
in an estimated EUR 146 million of unpaid labour taxes in 2012 (0.8% of GDP), according to the Estonian Institute of Economic Research.
8
Local elections changed the power structure in the current coalition The current ruling coalition has been in place since 2007. The incumbent Prime Minister’s liberal Reform Party won the parliamentary elections in the spring of 2011, and it chose to continue to run the government with its coalition partner, the conservative Pro Patria and Res Publica Union. Mr. Ansip has been the Prime Minister of Estonia since 2005, the longest period among all EU member states’ leaders.
The TNS Emor opinion polls show that the Prime Minister’s Reform Party has lost more than half of its supporters in three years. In November 2010, around 43% of the electorate supported the Reform Party. By November 2013, support had dropped to 18%. Lately, the image of the party has suffered from ongoing accusations of its use of unofficial channels for the party’s finances and from the selection of the new editor-in-chief of a public culture newspaper, which led to the resignation of the Minister of Culture in November. The coalition partner, the Pro Patria and Res Publica Union, has gained support, especially during last three months due to a vigorous campaign before the local government elections. In November 2013, support for the coalition parties was 40% of the voters. The leader of the opposition wing, the Centre Party, has increased its support; it has been the most popular party in Estonia since spring 2013 (29% of the votes, according to the November 2013 survey).
9
Municipal elections were held in October this year, cementing the power of the social liberal Centre Party in the capital city, Tallinn, for its third consecutive period of governance. The Centre Party’s power in Tallinn is largely based on the Russian electorate and shows the divide in the society between the Estonians and the Russians. The opposition between the more liberal national government and the more social liberal capital-city government could become a factor holding back economic growth in Estonia.
Out of the seven main goals of the government for 2015, the most challenging ones are related to the negative population growth, low productivity, and low health indicators (as measured by number of years lived in good health).
10 Population growth and the health
indicators have actually worsened in recent years. The latter is related to the impact of the economic crisis in 2009, the increased share of people with long-term diseases, and the reduced access to health care.
11 These long-standing health problems, skills mismatches,
and high unemployment amongst the youth and in some regions are hampering Estonia’s productivity and growth potential. A continued focus on reforming the labour market and education, building human capital, and addressing skills mismatches and regional disparities would ensure more sustainable and inclusive long-term growth.
Productivity growth is a necessary precondition for the growth of wages and living standards. In 2012, Estonia’s labour productivity amounted to 69% of EU27 total (based on
6 Ministry of Finance: Estonian Stability Programme 2013: http://www.fin.ee/doc.php?109386 7 Ministry of Finance: Estonian Stability Programme 2013: http://www.fin.ee/doc.php?109386 8 Estonian Institute of Economic Research. Shadow economy in Estonia in 2012:
http://www.ki.ee/publikatsioonid/valmis/Varimajandus_Eestis_2012_(elanike_hinnangute_alusel).pdf 9 TNS Emor. The ratings of parties: http://www.emor.ee/erakondade-toetus/ 10 The objectives of the government for 2011-2015: http://valitsus.ee/en/government/Programme 11 http://www.valitsus.ee/et/valitsus/tegevusprogramm/terve-eesti/valitsuse-eesmarkidega-seotud-ylevaated-
November 28, 2013 Please see important disclosures at the end of this document Page 14 of 27
Macro Research - Baltic Sea Report
purchasing power standards (PPS) per employed), or 60% of EU27 total (based on PPS per hours worked), according to Eurostat. Both indicators were flat during 2010-2012, so no convergence with the EU has taken place in productivity levels, according to this indicator. Estonia lags behind most of the countries in the EU, excluding Bulgaria, Romania, Latvia, and Poland (for the case of hours worked).
Estonia’s legal and business environment Baltic Sea region’s average According to Swedbank’s Baltic Sea structural index, the overall legal and business environment has slightly improved in Estonia in 2013 from last year and remains at the average level of the Baltic Sea region’s 10-country average included in the report. Estonia ranks below Finland (with the highest score), Norway, Sweden, Denmark, and Germany, and above Lithuania, Latvia, Poland, and Russia (with the lowest score).
Estonia’s index has improved by 0.1 point from the previous year, thanks to higher scores in the areas of tax policy and financial markets. The total tax rate for enterprises in Tallinn decreased after a local sales tax was abolished at the end of 2011. The financial market has received a higher ranking in 2013 as access to financing has improved.
Estonia is ranked high globally in the areas of education, labour market, and governance. Estonia is ranked third in the world after Iceland and Finland by internet access in schools, according to the WEF’s Global Competitiveness Report. Good scores have been received globally also in the areas of secondary and tertiary education enrolment, and quality and quantity of education. Still, education reforms continue, and efforts are being made to better match labour market needs.
The labour market has been ranked high globally because of Estonia’s flexible wage determination, low redundancy costs, and relatively high labour productivity and participation rates. However, the labour market remains the biggest risk in the economy today: the gap between the growth of wages and the growth of productivity is widening in 2013, having a negative impact on enterprises’ cost competitiveness. Governance has received a high rating in Estonia because of its strong rule of law and low corruption levels.
In Estonia, the biggest gains over the past five years have been made in the areas of the innovation climate and labour market. Estonia has made a strong commitment to advance its technological readiness. But Estonia is doing worse (and has fallen farther behind its peers in a five-year-comparison) in the areas of logistics and infrastructure. The World Bank’s logistics performance index shows that the efficiency of the customs clearance process, the timeliness of shipments, and the quality of trade and transport-related infrastructure deteriorated in 2012 compared with 2007. The foreign trade subindex was ranked lower in 2012 because market access to European companies in third countries worsened when trade protectionism increased after the global financial crisis, according to the World Economic Forum’s Global Enabling Trade Report.
Liis Elmik
0123456789
10
Estonia: Swedbank Baltic Sea index 2013
(t-4) (t-3) (t-2) (t-1) Latest available (t) Region average (t)
Source: Swedbank
From left to right, (t-4) to latest available (t)
Estonia’s business
environment slightly
improved in 2013 ...
... but continued
efforts are necessary to
improve
competitiveness
November 28, 2013 Please see important disclosures at the end of this document Page 15 of 27
Macro Research - Baltic Sea Report
Latvia: Productivity growth is the key Macro stability has been attained; the economy is firmly in an expansion phase. But
the reform agenda lacks ambition, the Baltic Sea index shows no improvement, and
institutional quality is below the region average. The authorities must speed up broad
reforms to support productivity growth and counter the risks of heating up the labour
market, reform education and improve its links to innovation, and clarify tax policy.
Business cycle: growth continues, but rising labour market challenges The crisis mood is over in Latvia – GDP growth has been back for over three years, it has been broad and quite steady, and has recently spilled over to the labour market. The improvement seen in macro numbers is at last being felt on a personal level. All major pre-crisis imbalances, such as the massive current account deficits, have gone. While GDP is still about 10% below the boom-time peak of 2007, exports and labour productivity exceed those levels by a wide margin. Adherence to the Maastricht criteria and overall sustainability were confirmed by the positive assessment made earlier this year by the ECB and the EC, which led to the invitation for Latvia to join the euro area as of January 1, 2014.
Latvia is now firmly in an expansion phase, and the rhetoric and actions of policymakers and entrepreneurs have shifted from crisis management to standard issues of business cycle dynamics. The recovery was kicked off in late 2009 by exports and then spilt over into domestic demand. In 2011-2012, GDP grew by about 5% per annum; it is forecast to exceed 4% the next few years. Weak export markets have slowed export and investment activity this year, and household consumption has temporarily become the largest driver of growth. However, with the European outlook improving, exports and investments are seen to pick up in 2014-2015 and grow swifter than household consumption again. Consumption growth will remain sturdy, but the underlying growth model fundamentally is export driven.
The improving economic activity is accompanied by job creation and wage growth. The unemployment rate came down from the peak of around 20% in early 2010 to 11.8% in the third quarter of 2013. In the hubs of economic activity, such as Riga, it is lower. Although companies have already been broadly voicing their concerns about the availability of a sufficient and qualified labour force, so far there is no evidence of a wide-scale buildup of imbalances. Wage growth has been moderate, and, though nominal unit labour costs have started to inch up, wage and productivity growth thus far has been largely balanced. Cost competitiveness remains good, as reflected in rising export market shares.
We see challenges in the labour market gradually rising over the next two-three years. By 2015, unemployment is forecast to fall permanently below 10% – a rough estimate of a level at which wage pressures are likely to become more evident. With lower unemployment, skill and/or location mismatches of labour supply and demand will intensify, thus strengthening employee bargaining power and wage pressures. We see this happening in Estonia. Wage growth is not a problem itself (it is necessary to lift living standards and reduce emigration), but it becomes a threat to competitiveness if productivity fails to keep up. Companies can adjust to rising labour costs by raising output prices and/or lowering profit margins. While such actions can temporarily postpone the problem, over time they are likely to weaken competitiveness – the former via cost increases, the latter via an impaired ability to invest.
Sustainable income convergence will depend on productivity gains Productivity growth is thus crucial. Businesses have done a good job so far, but it is a never-ending process. Capacity utilisation levels are high in manufacturing. Investment growth has faded away recently, and deleveraging has deepened; however, without adequate investments in production capacity and product/service development, productivity growth is likely to be timid. While the recent softening owes much to external demand uncertainty, in many cases businesses have done about all they can on their part, and a push from policymakers via systemic structural reforms to support productivity growth is needed.
4 Oct, 2014 Gross nominal w age grow h, % 11.4 3.7 4.3 5.2 6.0
Next municipalities election: Current account balance, % of GDP -9.1 -2.5 -1.4 -2.3 -2.9
3 Jun, 2017 General government budget balance, % of GDP -3.1 -1.3 -1.5 -0.9 -0.7
Source: Eurostat, CSBL, Swedbank
Broad and steady
economic growth…
Heating up of labour
market – risk for
future competitiveness
Productivity growth is
key to improve
competitiveness and
income convergence …
… accompanied by
employment and wage
growth
November 28, 2013 Please see important disclosures at the end of this document Page 16 of 27
Macro Research - Baltic Sea Report
Over the last few years, the EU has hardly grown, and, with Latvia expanding at above 4% per annum, it has been catching up steadily. In 2012, Latvia’s GDP per capita stood at 62% of the EU average (in purchasing power terms), up from 58% in 2008 (the pre-crisis maximum). However, unless the Latvian growth trajectory shifts up, growth differentials will shrink as Europe recovers. Convergence will become slower. Without productivity-boosting structural reforms, income per capita risks growing very slowly (recall the lack of reforms and consequent stagnation in Portugal during the 2000s). This raises the risks of higher net emigration when growth and labour demand in Europe picks up, thus eroding Latvia’s labour force and growth potential.
Political cycle slows the drive for reforms The short-term prospects of decisive policy action are challenging in light of the political cycle. In the run-up to the municipalities’ elections in June 2013, the reform agenda was somewhat downplayed. The reform drive does not seem to be getting any stronger in the run-up to the October 2014 parliamentary elections. There are plenty of open discussions on reforms, but deliverables are slow in coming. Reforms create resistance, and policymakers are unwilling to rock the boat before elections. The 2014 budget remains strongly built on policies of fiscal prudence, but it is less ambitious and quite stingy with broad reforms. The decision of the Prime Minister Dombrovskis to resign on November 27, means that a new government needs to be formed, which again takes attention away from structural reforms.
Many reforms can be implemented only when enacted jointly with changes in the financing mechanism through the state budget. Since the 2015 budget will be prepared in the run-up to the 2014 elections and the new parliament will not assemble until November − when it will be impossible to draft a brand new budget for 2015 − we foresee that the window of opportunity for pushing bolder reforms will open up only in 2015 and not have an effect until the 2016 budget. If so, time will be lost and by then it will be more difficult to, e.g., address labour market challenges.
Macro stability, but lack of institutional improvement will hamper growth There is by no means a policy standstill. The most progress in past years has been made to establish macro stability, which has allowed for, e.g., the reduction of financial market stress, improvement of sovereign credit ratings, stabilisation of banks, easing of access to credit, and buildup export capacity. Macro stability is key to set the foundation for growth, but climbing up the productivity ladder depends heavily on the quality of institutions. Quite a few reforms have already been executed in this area, but our measure of structural strength – the Swedbank Baltic Sea index (BSI) – shows that overall progress has been disappointing.
According to the BSI, Latvia ranks in the top 39% of best-performing countries in the world. Latvia’s latest BSI score is 6.1, same as last year. Latvia is outperformed by its closest neighbours, scoring below Lithuania (6.3) and Estonia (7.3), as well as the region’s average (7.3), and miles behind the region’s top performer Finland (9.0). It only scores better than Russia (4.4) and is the same as Poland (6.1). In none of the BSI subindices does Latvia score above the region average. Because of the measurement lag, some improvements have not yet been reflected – e.g., the most recent labour tax cuts and the soon-to-come easing of construction permits and changes in feed-in tariffs for renewable energy, aimed at reducing rent seeking and energy costs. However, similar things are true for other countries.
To discount year-to-year volatility, we next look at general trends. The BSI runs back to 2009. We therefore map (i) developments in Latvia from 2009 to 2013, and (ii) a 2013 reading vis-à-vis the region average. Since the 2009 index reading is built on 2008 or even 2007 data, the time span encompasses the agenda to improve the business environment during and after the crisis.
30
40
50
60
70
1995 1997 1999 2001 2003 2005 2007 2009 2011
GDP per capita and labour productivity, % of EU28 (purchasing power standards)
GDP per capita
Labour productivity*
Source: Eurostat
*Break in series for employment data in 2011,
earlier data have not yet been
adjusted according to the
Population census results
… for which timely
policy support is
crucial ...
… but the political
cycle has narrowed the
window of opportunity
for reforms
Latvia is in the top
39% of the world’s
best-performing
countries…
Policy has been geared
towards achieving
macro stability
November 28, 2013 Please see important disclosures at the end of this document Page 17 of 27
Macro Research - Baltic Sea Report
Four major conclusions can be drawn from the data. First, Latvia’s ranking has not changed, showing its ability to keep up with the rest of the world but not to engineer a breakthrough. Only three indices – entrepreneurship, the labour market, and tax policy – are at about the region average. Of these areas, the most improvement has been shown in the quality of the entrepreneurship environment, with gains from lower costs in starting a business, registering a property, getting a construction permit, and resolving insolvency. Contract enforcement has weakened. Improving entrepreneurship was a targeted policy, most of which occurred in the midst of the recession. Lately, this seems to have run out of steam. The improvement in the labour market ranking comes from better participation rates and productivity. Labour market efficiency has been a traditional strong point. The tax policy ranking has risen partly because of the recent tax rate cutbacks in Latvia, while other countries have been slower to exit the recession and therefore have yet been unable to reverse the tax increases they had introduced during the recession to fix public finances.
Second, in three areas – logistics, infrastructure, and foreign trade – Latvia has fallen behind. Since 2009, the most dramatic fall is in logistics. Indicators of timeliness and arrangements of international shipments have worsened, other qualities largely have stayed the same, while customs has improved a bit. However, competitors have moved faster. In infrastructure, there have been improvements since 2009, but competitors have also run ahead. The weakest link is the quality of trade and transport-related infrastructure. Recent public investments have been geared towards this area, but the gap with competitors is still large. Latvia has improved a bit in foreign trade, which combines market access, border administration, and the related business environment, but others have worked harder on it.
Third, innovation climate and financial markets’ indices have improved substantially, but they are still much below the region average. As for innovation, the advance is a combination of Latvia’s doing better and a (recession-induced?) weakening elsewhere. The same is true for financial markets: an improvement in local conditions, such as venture capital availability, has been combined with a weakening in other countries − in, e.g., ease of access of credit. Due to poor financial market diversity and depth, this is Latvia’s lowest-ranked subindex.
Fourth, there has been almost no shift in the governance or education ranking; both are below the region average. There has been no breakthrough for governance (which comprises corruption perception, rule of law, and control of corruption); e.g., the expected municipality/state-owned enterprise governance reform has not yet been implemented. Education, as assessed by a wide set of quantitative measures, shows a faint downward trend. Education does earn the highest rank of all subindices, but, as this is the strong point of the region, there is still a wide gap for Latvia to make up. Here, Latvia ranks only above Russia, which is narrowing the gap at a swift pace.
What to do next to support swift and sustainable growth? There is no silver bullet: all areas need improvement. It is easy to lose one’s foothold if one’s progress lags behind that of competitors. Latvia has gained from an earlier exit from the recession – an advantage it risks losing when growth resumes elsewhere, unless further structural improvements are introduced. The rule of thumb to reach income levels of advanced economies is to reach the institutional and structural levels of such economies.
We shall not list detailed policy prescriptions as they have already been set out in multiple strategy guidelines drafted by the current/previous governments; one simply needs to implement them. We bring attention to three areas that we see as not having received adequate attention and of critical importance for shaping growth in the short to medium term.
Labour market. Since 2001, Latvia’s population has shrunk by 14%, about two-thirds of
which is due to emigration. As the hardest hit are cohorts aged 30-44 and children, this
0123456789
10
Latvia: Swedbank Baltic Sea index 2013
(t-4) (t-3) (t-2) (t-1) Latest available (t) Region average (t)
Source: Swedbank
From left to right, (t-4) to latest available (t)
No silver bullet – policy
response needed in all
areas
Plans must be put into
action, not shelved
… but institutional
framework has not
improved much
November 28, 2013 Please see important disclosures at the end of this document Page 18 of 27
Macro Research - Baltic Sea Report
depletes growth potential and puts at risk the sustainability of the welfare system.1 With
growth resuming and jobs easier to find, emigration has slowed. But net emigration will continue mainly because the income gap with advanced economies remains wide. To lessen emigration and attract emigrants back, wages need to rise. The good news is that wages are rising again and will continue to do so as the labour market improves. Yet, we see that structural policy is lagging behind and the risks of undue wage growth have risen.
Allowing the labour market to overheat, a brief surge in employment will be followed by a sharp stop and emigration. Hence, productivity-boosting policies are crucial to ensure that wage growth is swift (a faster catch-up means less emigration) and sustainable (no boom-bust scenario). This must be linked to a better utilisation of existing resources by raising the participation rate (a gap with the Nordics is still wide) and reducing structural unemployment (better labour mobility physically and via the benefits system, requalification programs for long-term unemployed, etc.). This would promote employment, but also improve skills and support productivity. Population density is low, and infrastructure investment must be prioritised around centres of activity, with less support given elsewhere. Administrative reform must be speeded up to build stronger regions. Skills-based immigration should be used as a viable instrument to raise productivity and sustain economic activity.
Education, science, and innovation. It is hard to boost productivity without innovations.
Latvia scores well in creativity but is poor at bringing innovation output to life. It is amongst the countries spending least on research and development (0.7% of GDP, with a target of 1.5% in 2020; the current EU average is 2.1%). The science-innovation link is weak: the patent system fails to motivate academia to link up with businesses. While there have been quite a few reforms in primary, secondary, and vocational education (e.g., most recently, a German-type dual education pilot project to link education to business needs), tertiary education and science have seen but very few. More funding is necessary, but this alone will not mend a broken system – it must be opened to international competition, funding should flow towards quality, and the number of institutions must be reduced (e.g., Latvia has 56 tertiary education institutions, and Finland, with a population twice as large, has 48.)
Tax policy. The key trend is to cut labour taxes since the labour tax wedge is wider than
that of neighbours and the EU average, and income inequality is the highest in the EU. The 2014 budget sets a plan to cut the personal income tax rate to 22% in 2016 while increasing tax-free allowances, and to cut the total social security contribution rate to 34.09% in 2014. Without the raising of other taxes, the overall tax burden is set to ease.
The overall tax burden stands at 28% of GDP, i.e., the third lowest in the EU, where the average is 39%. We are not as downbeat as the Ministry of Finance, which forecasts it with the current policy to ease to about 25% in 2016 (we see it staying somewhat higher as the business cycle turns more to consumption, which is more tax intensive, and drives some income legalisation); nevertheless, it will most likely be below the current level of 28%.
This situation raises three issues. First, there is a contradiction inherent in the Ministry of Finance’s strategic target of reaching a tax burden of 33% of GDP in 2016. This means policy uncertainty for companies, i.e., which is the true target, and what will be done when to reach it? Second, other countries have also set plans to cut labour taxes, i.e., the current plan of tax cuts in Latvia may fail to improve its competitiveness. To make labour tax cuts larger, other taxes may need to rise, or budget expenditures may need to grow slower. Third, is there enough funding for reforms at this level of revenues, given that, e.g., pension indexation and public sector wage demands will strengthen?
What are the risks? The primary one is policy uncertainty. The structure, size, and pace of labour tax cuts are likely to differ from those currently specified. To cushion the lack of revenues, other taxes may rise, harming activity and job creation in smaller niche sectors. We already saw this in the 2014 budget. After the elections next fall, the discussion on the size of the overall tax burden will resume, and the most likely decision will be to increase it.
How? By reducing tax evasion and sharply raising residential real estate tax revenues (it may also permit labour taxes to be cut more aggressively). Residential real estate tax has certain advantages over other taxes: (i) tax evasion is impossible with it; (ii) it is known to have a low negative impact on economic activity; and (iii) it addresses income inequality issues. Such a shift in residential real estate and labour taxes must take place at the same time, and come together with adequate changes in the redistribution of financial means across municipalities and a safety net for less-well-off groups, e.g., pensioners. Alas, such a change is politically difficult, and, most likely, only small steps will be taken; the labour tax wedge will decrease from current levels but remain relatively high vis-à-vis the competition.
Lija Strašuna Mārtiņš Kazāks
Kristilla Skrūzkalne
1 See Swedbank Discussion Paper “Demography and its economic consequences in the Baltics: the case of Latvia”
November 27, 2013 Please see important disclosures at the end of this document Page 19 of 27
Macro Research - Baltic Sea Report
Lithuania: Complacency and slow reforms Reforms have lost momentum since 2012 and the Baltic Sea index remains
unchanged at 6.3. Economic growth remains sustainable; domestic demand is
starting to play a more important role than net exports. But there are long-term
challenges. We propose 10 game-changing reforms that could significantly improve
the competitiveness and long-term growth of the Lithuanian economy.
Economic developments: good, not great During the first half of this year, the economy continued expanding at a similar pace as in 2012; however, growth disappointed in the third quarter of this year, when GDP was only 2.0% higher than in the same period a year ago. Part of the growth slowdown is explained by last year’s upward revision of GDP, but we have also seen stalling exports and industrial production. The good news is that the manufacturing weakness was not broad based – the main reason was a very weak performance from producers of fertilizers and refined petroleum products. Their nominal exports in the third quarter were, respectively, 36.4% and 9.4% lower than a year ago. Exports except for those two product groups in the third quarter were 10.2% higher than a year ago.
The road ahead is not without obstacles. As of October, the Russian Federal Service for Supervision of Consumer Rights Protection and Human Well-Being (Rospotrebnadzor) has banned imports of all Lithuanian dairy products due to, allegedly, illicit materials found in them. Last year, Lithuanian exports of dairy products to Russian amounted to LTL 0.52 billion (0.5% of GDP). This is not much in terms of total economic output, but a prolonged embargo would nevertheless hurt the sector as 29% of total exports used to go to the Russian market. However, as the prohibition of imports seems to have lacked solid ground, we do not expect it to last. This year, the economy will probably expand by slightly less than the 4.0% forecasted in our most recent Swedbank Economic Outlook.
Although we expect a gradual slowdown in the growth of exports, at the same time we foresee a steady improvement in domestic demand. In the third quarter, unemployment declined to 10.9%, and this trend is likely to continue in 2014, albeit at a slower pace. Nominal wage growth, which has accelerated to 4.5% this year (not least because of the increase in the minimum wage), and receding inflation have significantly boosted the purchasing power of households, as reflected in the more rapid growth of retail trade. Investments have grown somewhat faster this year than last year, but slower than expected. Capacity utilisation has returned to its pre-crisis peak of 75% during recent months. This, together with low interest rates, high retained earnings, and a stabilising situation in the euro area, suggests that we should expect a more robust recovery in investments. However, as some companies are probably expecting support from the structural funds in the 2014-2020 EU budget, a surge of investments is more likely in 2015.
Favourable trends in commodities markets pushed average annual inflation down to 1.4% in October, and we forecast that it will drop farther this year. This puts Lithuania’s inflation comfortably below the Maastricht criterion and indicates that the risk of not meeting the price stability criterion is very low. More uncertainty remains regarding the sustainability of public finances – the Ministry of Finance projects that this year the government deficit will decline to 2.9% of GDP, only a tick below the 3.0% GDP threshold required by the convergence criteria. Nevertheless, since the general government budget deficit has declined significantly – from an eye-watering 9.4% in 2009 – and is close to the reference value, Lithuania’s prospects of being invited to join the euro area will rely on how the ECB and European Commission view the sustainability of prices and public finances. However, it is important to note that the Fiscal Discipline Law restricts government spending as long as the budget is in the red, and that the government has drafted a 2014 budget with a deficit projected to decline to 1.9% of GDP. Also, the government expects the budget to be in surplus in 2016. This indicates a clear commitment to continued fiscal consolidation; thus, we forecast that Lithuania will become the 19
9 Oct, 2016 Gross nominal w age grow h, % 7.3 3.8 4.6 4.8 6.0
Next municipalities election: Current account balance, % of GDP -6.3 -0.2 -0.9 -2.2 -3.1
Feb/Mar, 2015 General government budget balance, % of GDP -3.2 -3.2 -2.7 -1.7 -0.7
Source: Eurostat, Statistics Lithuania, Swedbank
Economic growth has
eased, but slowdown is
temporary and not
broad based
Household
consumption is
supported by
increasing wages and
employment, as well as
low inflation
November 27, 2013 Please see important disclosures at the end of this document Page 20 of 27
Macro Research - Baltic Sea Report
Relative competitiveness remains unchanged Despite the positive macroeconomic developments, we see a clear shift to the lower gear in structural reforms. This is suggested by the overall Baltic Sea index (BSI), which, at6.3, remains unchanged from last year. According to the BSI, Lithuania ranks in the top 37% of the best-performing countries in the world, but the ranking is still below the Baltic Sea region average.
Entrepreneurship is one of the best-performing subindices of the BSI for Lithuania and has recorded the largest increase since last year. This improvement is the result of the facilitation of the processes required to start a business in Lithuania – the number of procedures, time, costs, and minimum capital required to open a new business have dropped dramatically since last year. This has been achieved through the simplification of preregistration and registration formalities, the digitalisation of the processes, and the introduction of a new business form, called small partnership, which has no minimum capital requirement. Due to the implemented changes, this subindex has climbed above the region average, and Lithuania has become one of the best performers in this field. However, entrepreneurship has been, by and large, the only area of improvement in the whole BSI, as the rest of the subindices have either remained at levels similar to last year or even worsened.
During the crisis, the financial markets subindex dropped significantly, and despite a slight improvement last year, it still remains way below the pre-crisis level. Regarding the financial markets, Lithuania continues to score below the region average; amongst the 10 countries in the region, it ranks only above Russia. The index has deteriorated since last year, mostly due to the decrease in the soundness of banks; this is the result of the fall of two Lithuanian banks in the past two years and the suspension of some credit union activities this year. Nevertheless, this year’s evaluation of the financial system’s stability by the Bank of Lithuania found that the banks in Lithuania are well capitalised and resistant to possible shocks. Companies still think that access to credit is unsatisfactory, albeit improving slowly. Banks, however, expect lending conditions to improve and credit portfolios to grow faster.
The foreign trade subindex has been on a continuously declining trend since 2009 due to the decreasing access to foreign markets for Lithuanian exporters - a factor that is very difficult to control for by the exporting country. Owing to the recession in the euro area countries, a rising share of Lithuanian goods is exported to more protectionist countries, such as the CIS countries (including Russia), as well as to other developing countries, making foreign market access more difficult for exporters. Meanwhile, the infrastructure and logistics subindices have also been on a downward trend since 2010. The weakening of infrastructure is due to the deteriorating quality of trade and transport-related infrastructure, as well as of the overall infrastructure. The logistics subindex has declined because Lithuania is scoring lower in the efficiency of customs, the ease of arranging international shipments, the ability to track and trace consignments, and the timeliness of shipments.
During recent years there have been basically no changes in the labour market, tax policy, education or governance subindices, and they all remain below the region average. Meanwhile, smaller knowledge and technology outputs, as well as a decline in government procurement of R&D products, have worsened Lithuania’s innovation climate since last year. The negative developments or stagnation of these BSI subindices clearly indicates the need for the continuation of structural reforms, which have recently lost the momentum.
The 10 game-changing reforms Lithuania’s primary, secondary, and higher education system benefits from very high
participation rates but has inherent structural flaws. In 2009, higher education reform was initiated, introducing student vouchers (money follows principle) and encouraging
0123456789
10
Lithuania: Swedbank Baltic Sea index 2013
(t-4) (t-3) (t-2) (t-1) Latest available (t) Region average (t)
Source: Swedbank
From left to right, (t-4) to latest available (t)
The performance of
financial markets is still
very poor
Foreign trade,
infrastructure and
logistics have been on
a declining trend in
recent years
Stagnation in labour
market, tax policy,
education, and
governance areas is
evident
Entrepreneurship has
been the main area of
improvement
Foreign trade,
infrastructure, and
logistics have been on
a declining trend in
recent years
November 27, 2013 Please see important disclosures at the end of this document Page 21 of 27
Macro Research - Baltic Sea Report
competition amongst higher-education institutions. However, the desired result of consolidation in this sector was not achieved – only 3 out of almost 50 higher-education institutions have merged, and the problem of inefficient and superfluous universities that do not have enough students remains. Another problem in higher education is related to the gap between education programs and industry needs. Although obligatory internships have been institutionalised, they are too short (only three months) and very often viewed as a formality. This leads to a situation in which graduates frequently have neither relevant skills nor a sufficient understanding of what is expected of them in the job market. Finally, secondary and higher-education processes are artificially overextended. Schoolchildren have 3 months of holidays and do not graduate until they are 19; moreover, keeping them occupied during these holidays is a big challenge for the parents. Bachelor programs last four years, compared with only three years in most of Europe. Making study programs more concentrated and shorter would provide a very necessary boost for a shrinking labour force.
The Lithuanian labour market, in our opinion, is unnecessarily rigid and restricting.
Lithuania, in terms of hiring-and-firing practices, dropped to 130th place in the 2013-2014 World Economic Forum global competitiveness index (its lowest rank since the index was first published). Lithuania is one of the six worst performers in this area of labour regulation in the EU, and one of the three worst if founding members of the EU were not included. Before terminating a job contract in Lithuania, an employer has to warn the employee two to four months in advance, whereas, e.g., in Latvia only one month is required. The Labour Code describes the relationship and responsibilities of employer and employee in great detail, but at the same time it forbids a company to sign a collective agreement that would „worsen the condition of the employer compared to that described in the Labour Code”. This provision has to go – companies should be allowed to have more flexible agreements, depending on the industry and region in which they operate. In some cases, it is almost impossible to dismiss employees, even if they underperform or the company, facing a challenging economic environment, is unable to maintain the same amount of labour. Severance pay is also very high – up to six months’ salary, depending on the years worked in that company. In order to encourage the creation of new jobs, a temporary exception for the Labour Code was introduced in 2010 when firms were allowed to make fixed-term contracts for the newly created jobs. This helps to create new jobs for now, but the exception is still temporary and, even if it were not, it makes the Labour Code more complicated. Fixed-term contracts create a two-tier labour market, in which some employees are well protected and others are not. Thus, we think that a better long-term strategy is to ease the liabilities associated with permanent contracts.
We also think that, although providing proper safety nets for the unemployed is very important, it should not be the sole responsibility of employers, especially during economic recessions. It is not difficult to imagine a situation in which falling domestic or foreign demand requires a company to let go a large fraction of its employees, but, by being unable to do this quickly or by having to make large severance payments, it may push itself over the brink of bankruptcy. Considering that social security contributions paid by companies are amongst the largest in the EU, it would be only fair that some of the social safety net should be provided by the government (via social security funds).
The labour force is set to shrink in the coming decade due to the low fertility rate of the 1990s, high emigration after accession to the EU, and strict immigration laws. Lifting the
fertility rate above 2.1 is a challenge that few developed countries have managed to tackle, but fostering remigration and encouraging immigration could stabilise the labour force and the dependency ratios. One option is to follow the practice of, e.g., Greece, Portugal, and Latvia, where a given investment in residential property enables a non-EU citizen to obtain a resident’s permit. Another option is to provide financial incentives for potential immigrants to register patents in Lithuania. The already-high dependency ratio (the ratio of the number of pensioners to the working-age population) is set to increase further; thus, finding ways to open up the country to a foreign labour force, especially skilled, is going to be crucial for long-term potential GDP growth.
Both the World Bank’s Doing Business and the WEF’s Global Competitiveness Report” indicate that the Lithuanian tax system is not very favourable for businesses. The heaviest
burden stems from labour taxes – the tax wedge on labour (the share of labour costs that is not taken home by the employee) is above 40%. Although this is close to the EU average, low tax morale leads to pervasive tax evasion – notably, salary payments “under the table.“ The government has taken a step towards lowering labour taxes by increasing the tax-exempt amount; however, more needs to be done. Tax increases during the crisis have lowered tax income as a share of GDP and domestic demand, indicating that Lithuania could be on the right side of the Laffer curve, where higher tax rates lead to more tax evasion and smaller government revenues. This was also shown by a recent analysis by the Lithuanian Free Market Institute.
1 Lithuania still has relatively low property taxes – private
cars are not taxed and the real estate tax is levied only on very expensive properties. One
November 27, 2013 Please see important disclosures at the end of this document Page 22 of 27
Macro Research - Baltic Sea Report
option to rebalance the tax system is to introduce broader property taxes while lowering labour taxes. However, we think that priority for increasing budget revenues should be given not to the new taxes, but, e.g., to finding ways to reduce the shadow economy and increase income from state-owned enterprises.
The social security fund, Sodra, suffers from chronic deficits and large debt, mainly
because of a relatively high dependency ratio and small (official) average wage. One way to solve this is to move a big fraction of its liabilities – state retirement pensions – to the state budget. This pension does not depend on the wage or lifetime contributions of the pensioner, but is something the state guarantees to its citizens; thus, it should have never been part of the social security fund’s liabilities. This move would lower the annual expenditure of Sodra by around LTL 2.5 billion, or more than 2% of GDP. Additional resources would have to be found in the state budget, but this would be much easier, considering that the budget is almost three times larger than Sodra and receives revenues from a wider range of taxes and has other sources of income. Furthermore, financial benefits provided by the social security fund should be more closely linked to employee contributions. Currently, this link is very weak – retirement pension, maternity, and unemployment insurance benefits are capped at a very low level and do not motivate users to declare income or pay social contributions.
Lithuanian tax revenues as a share of GDP are the lowest in the EU. There are three main reasons for this: first, the almost nonexistent individual property (e.g., real estate or car) taxes; second, the abundant value-added and personal income tax exemptions, which provide tax breaks for high earners; and, finally, the thriving smuggling and shadow economy. The most recent empty-pack survey by Nielsen shows that 30% of the cigarettes
smoked in Lithuania have been smuggled into the country. We calculate that this alone costs the state budget around LTL 330 million per year in lost value-added tax and excise duty revenues. The reasons for the thriving shadow economy are complex – ranging from Lithuania’s unfavourable geographical location (a shared border with Russia and Belarus, where taxes on fuel, alcohol, and tobacco are a few times smaller) to an inefficient public sector, which leads to low tax morale. A recent survey showed that 61% of respondents tolerate or do not condemn the consumption of smuggled goods. The measures used against this public finance-crippling and competition-distorting phenomenon have to be complex as well – both sticks and carrots are needed.
Another almost untapped source of potential government revenues is the state-owned enterprises (SOEs). Their reform was started two years ago with the aim of increasing
transparency and efficiency, as well as depoliticising them. Quarterly financial statements are already published for all SOEs; however, they still have no financial objectives (such as to reach a specific ROE and very few have independent board members.
Listing a fraction of all SOE’s shares would provide a tremendous boost to the Lithuanian
stock market, which is very illiquid. A greater capitalisation of the stock market would attract more investors (including, perhaps, local pension funds) and provide an alternative and more viable source of capital - not only for SOEs, but also for private companies. Furthermore, the current debt-to-equity ratio of SOEs is a meagre 12.5%, compared with 75% on average in all companies operating in Lithuania. This is an inefficient capital structure, and increasing the financial leverage would allow companies to return a large fraction of their capital to the state, which, in turn, could pay down its debt or, e.g., invest in infrastructure.
Overall, the public sector in Lithuania is too large and cannot be supported by the current
tax receipts and shrinking labour force and number of taxpayers. Around 25% of the labour force is employed in the public sector, which is well above the OECD average of 15%. Furthermore, the number of hospital beds, doctors, and many other public sector employees per thousand inhabitants is amongst the highest in the EU. Although Lithuania has lost 13% of its population during the last 10 years, the public sector has not adapted accordingly. There is a lot of room to optimise the public sector by eliminating unnecessary and overlapping functions of public institutions and allowing more private companies to provide public services. The quantity of public services should rarely, if ever, take precedence over the quality.
Finally, the overall investment environment would be improved by a more consistent and sustained implementation of economic policies, especially concerning long-term
strategic projects. A lack of consistency and continuation is especially visible in the energy sector, where Lithuania is struggling to achieve long-term objectives because every new government has a somewhat different vision about what is best in the long run and how it should be achieved. This may be a characteristic of a young democracy, but it is time for Lithuania to grow up.
Nerijus Mačiulis Laura Galdikienė
Vaiva Šečkutė
Moving the state
retirement pension to
the state budget would
improve the financial
situation of Sodra
Introduction of
property taxes,
elimination of tax
exemptions, and
reduction of shadow
economy could
increase tax revenues
Public sector should be
optimised
Moving the state
retirement pension to
the state budget would
improve the finances
of Sodra
State-owned
enterprises could be
another source of
government revenues
November 27, 2013 Please see important disclosures at the end of this document Page 23 of 27
Macro Research - Baltic Sea Report
Appendix: Swedbank Baltic Sea Index The Swedbank Baltic Sea index assesses the Baltic Sea region’s competitiveness and structural development. The region’s countries are ranked in relation to each other and the rest of the world on the basis of ten areas that are considered relevant. Each area consists of several underlying components. The list is not complete, but it should serve as a good indicator of improvement in the business climate in relation to other countries. The samples vary, but in most cases cover most countries in the world. Countries are ranked from 0 to 10 where having a rank between 9 and 10 implies that in the selected area the country belongs to the top 10% “best” performing countries in the world. A country index is an average of all ten areas. A regional index is an average of country indices. The index allows to track a country’s performance compared to others overall and also across ten selected areas against others and own past.
(t-4) (t-3) (t-2) (t-1) Jaunākie dati (t)From left to right, (t-4) to latest available (t)
Contents and sources of Swedbank Baltic Sea Region index 2013
I Entrepreneurship VI Education
Starting a Business Higher education and training
Dealing w ith construction permits Source: Global Competitiv eness Report (World Economic Forum)
Registering property VII Governance
Protecting investors Corruption perception index
Enforcing contracts Rule of law
Resolving insolvency Control of Corruption
Source: Doing Business (World Bank) Source: Transparancy International and World Bank
II Labour market VIII Infrastructure
Labour market eff iciency Quality of overall infrastructure
Labour productivity Trade and transport-related infrastructure
Labour force participation rate Source: Global Competitiv eness Report (World Economic Forum) and
Source: World Bank and Global Competitiv eness Report (World Economic Forum) Logistics Perf ormance Index (WB)
III Tax policy IX Logistics
Ease of paying taxes Customs
(number of payments, time, total tax rate) International shipments
Sources: Doing Business (World Bank) Logistics competence
IV Financial markets Tracking&Tracing
Financing through local equity market Timeliness
Ease of access to loans Source: Logistics Perf ormance Index (World Bank)
Venture capital availability X Innovation climate
Soundness of banks Innovation Input
Regulation of securities exchanges Innovation Output
Source: Global Competitiv eness Report (World Economic Forum) Capacity of innovation
V Foreign trade Quality of scientif ic research institutions
Market access Company spending on R&D
Border administration Gov’t procurement of advanced tech products
Business environment Availability of scientists and engineers
Source: Enabling trade index (World Economic Forum) Source: Global Innov ation Index (INSEAD (Institut Européen d'Administration
des Af f aires)) and Global Competitiv eness Report (World Economic Forum)
0
2
4
6
8
10
Swedbank Baltic Sea index 2013
0
2
4
6
8
10
Swedbank Baltic Sea index 2013
November 27, 2013 Please see important disclosures at the end of this document Page 24 of 27
Macro Research - Baltic Sea Report
0
2
4
6
8
10
I Entrepreneurship
(t-4)From left to right, (t-4) to latest available (t)
0
2
4
6
8
10
II Labour market
0
2
4
6
8
10
III Tax Policy
0
2
4
6
8
10
V Foreign trade
0
2
4
6
8
10
VI Education
0
2
4
6
8
10
VII Governance
0
2
4
6
8
10
VIII Infrastructure
0
2
4
6
8
10
IX Logistics
0
2
4
6
8
10
X Innovation Climate
0
2
4
6
8
10
IV Financial Market
November 27, 2013 Please see important disclosures at the end of this document Page 25 of 27
Macro Research - Baltic Sea Report
I Entrepreneurship
(t-4) (t-3) (t-2) (t-1)
Latest
available
(t)
Norw ay 8.2 8.1 8.2 8.5 8.4
Denmark 7.8 8.0 8.1 8.2 8.1
Lithuania 6.8 6.8 7.1 7.1 7.7
Finland 7.7 7.7 7.6 7.7 7.6
Sw eden 7.5 7.8 7.7 7.6 7.5
Average 6.9 6.9 7.0 7.2 7.2
Latvia 6.1 6.2 7.0 6.9 7.0
Germany 7.1 7.1 7.0 7.0 7.0
Estonia 7.1 7.0 6.9 7.0 6.9
Poland 5.2 5.2 5.2 6.0 6.2
Russia 5.4 5.3 5.4 5.6 5.8
II Labour Market
(t-4) (t-3) (t-2) (t-1)
Latest
available
(t)
Sw eden 8.8 8.9 8.6 8.7 8.9
Norw ay 9.0 9.0 8.9 8.8 8.9
Denmark 9.1 9.1 9.0 8.9 8.8
Finland 8.5 8.5 8.5 8.6 8.5
Estonia 7.9 8.2 8.1 8.3 8.4
Germany 6.9 6.9 7.1 7.4 7.7
Average 7.4 7.4 7.4 7.5 7.5
Latvia 7.0 6.9 6.9 7.4 7.5
Lithuania 6.0 6.0 6.2 6.2 6.1
Russia 6.2 6.0 5.7 5.4 5.7
Poland 5.0 5.1 5.1 5.3 4.8
III Tax Policy (t-4) (t-3) (t-2) (t-1) (t)
Denmark 8.2 8.0 8.1 8.1 8.1
Norw ay 8.1 7.9 7.8 7.8 7.8
Finland 5.6 6.2 7.7 7.5 7.6
Estonia 7.2 7.2 6.7 6.4 7.1
Sw eden 6.8 6.8 6.8 6.8 6.7
Average 6.3 6.3 6.4 6.5 6.6
Latvia 6.3 6.1 6.0 6.4 6.4
Lithuania 6.4 6.1 6.2 6.1 6.1
Russia 5.0 5.1 5.1 6.0 6.1
Germany 6.1 5.4 5.3 5.7 5.3
Poland 3.1 4.3 4.4 4.7 4.5
V Foreign Trade (t-4) (t-3) (t-2) (t-1) (t)
Norw ay 9.6 8.9 8.5 8.3 8.2
Sw eden 9.2 7.4 7.2 7.4 7.6
Denmark 9.4 7.6 7.4 7.5 7.6
Finland 9.4 7.6 7.4 7.5 7.5
Germany 9.3 7.0 6.6 6.6 6.7
Estonia 7.2 7.0 6.9 6.8 6.6
Average 7.4 6.3 6.1 6.1 6.2
Poland 5.7 4.5 4.6 5.1 5.6
Lithuania 6.4 6.1 5.8 5.6 5.4
Latvia 6.1 5.8 5.5 5.3 5.2
Russia 1.4 1.3 1.3 1.2 1.1
VI Education (t-4) (t-3) (t-2) (t-1) (t)
Finland 10.0 10.0 10.0 10.0 10.0
Germany 8.4 8.7 9.6 9.7 9.9
Sw eden 9.8 9.9 9.9 9.6 9.5
Norw ay 9.1 9.2 9.0 9.2 9.4
Denmark 9.9 9.9 9.6 9.1 9.1
Average 8.5 8.6 8.6 8.5 8.6
Estonia 8.4 8.5 8.4 8.3 8.5
Lithuania 7.8 8.2 8.2 8.2 8.2
Poland 8.0 8.2 7.8 7.5 7.6
Latvia 7.4 7.5 7.6 7.1 7.3
Russia 6.1 6.4 6.3 6.4 6.9
VII Governance (t-4) (t-3) (t-2) (t-1) (t)
Denmark 9.9 9.9 9.9 9.9 9.9
Finland 9.8 9.9 9.9 9.9 9.9
Sw eden 9.8 9.9 9.9 9.9 9.9
Norw ay 9.5 9.6 9.7 9.8 9.8
Germany 9.3 9.3 9.2 9.2 9.3
Estonia 8.3 8.2 8.3 8.3 8.2
Average 7.8 7.9 7.9 8.0 8.0
Poland 6.7 6.9 7.1 7.4 7.3
Lithuania 6.6 6.8 7.1 7.0 7.0
Latvia 6.9 6.8 6.7 6.7 6.8
Russia 1.6 1.7 1.6 2.2 2.1
VIII Infrastructure (t-4) (t-3) (t-2) (t-1) (t)
Finland 9.4 9.5 9.6 9.7 9.7
Germany 9.8 9.7 9.7 9.7 9.7
Sw eden 9.4 9.4 9.4 9.2 9.2
Denmark 9.2 9.2 9.5 9.3 9.1
Norw ay 8.5 8.5 8.2 8.2 8.6
Average 7.4 7.6 7.5 7.3 7.4
Estonia 7.2 7.3 7.1 6.9 6.9
Lithuania 6.3 6.8 6.4 5.9 5.9
Poland 4.0 4.8 5.6 5.9 5.9
Latvia 6.0 6.6 5.7 5.3 5.6
Russia 3.9 4.0 3.6 3.4 3.7
IX Logistics (t-4) (t-3) (t-2) (t-1) (t)
Finland 9.1 9.1 9.4 9.8 9.8
Denmark 9.1 9.1 9.4 9.7 9.7
Germany 9.8 9.8 9.7 9.6 9.6
Sw eden 9.8 9.8 9.4 9.1 9.1
Norw ay 9.1 9.2 9.0 8.7 8.7
Poland 7.8 8.2 8.2 8.3 8.3
Average 7.9 8.1 7.8 7.5 7.5
Lithuania 6.7 7.2 6.7 6.3 6.3
Estonia 6.8 7.1 6.3 5.5 5.5
Latvia 7.4 7.6 6.3 5.0 5.0
Russia 3.4 3.7 3.6 3.5 3.5
X Innovation Climate (t-4) (t-3) (t-2) (t-1) (t)
Finland 9.3 9.6 9.6 9.6 9.6
Sw eden 9.7 9.8 9.8 9.7 9.5
Germany 9.1 8.9 8.9 9.0 9.2
Norw ay 8.7 8.9 8.4 8.6 8.7
Denmark 9.3 9.5 9.2 8.8 8.6
Estonia 7.0 7.3 7.8 8.1 7.7
Average 7.5 7.7 7.7 7.8 7.7
Lithuania 6.0 6.3 6.0 6.6 6.4
Latvia 4.4 5.1 5.9 6.4 6.1
Poland 5.9 6.1 5.7 6.0 5.6
Russia 5.5 5.5 5.5 5.2 5.2
IV Financial Market (t-4) (t-3) (t-2) (t-1) (t)
Norw ay 9.1 9.4 9.6 9.6 9.5
Finland 9.0 9.0 9.1 9.4 9.4
Sw eden 9.2 9.1 9.4 9.4 9.3
Estonia 7.2 6.2 6.5 6.7 7.2
Germany 5.5 5.4 6.2 7.0 7.2
Average 6.3 5.9 6.5 6.5 6.6
Denmark 7.9 6.9 7.5 6.0 5.5
Poland 5.5 5.9 5.8 5.5 5.3
Latvia 2.9 1.8 4.0 4.6 4.7
Lithuania 4.9 3.6 3.7 4.3 4.1
Russia 2.2 2.0 2.6 2.8 3.9
November 27, 2013 Please see important disclosures at the end of this document Page 26 of 27
November 27, 2013 Please see important disclosures at the end of this document Page 27 of 27
Macro Research - Baltic Sea Report
General disclaimer
This research report has been prepared by analysts of Swedbank Large Corporates & Institutions’ Macro Research department. The Macro Research department consists of research units in Estonia, Latvia, Lithuania, Norway and Sweden, and is responsible for preparing reports on global and home market economic developments. Analyst’s certification The analyst(s) responsible for the content of this report hereby confirm that notwithstanding the existence of any such potential conflicts of interest referred to herein, the views expressed in this report accurately reflect their personal and professional views. Research reports are independent and based solely on publicly available information. Issuer, distribution & recipients This report by Swedbank Large Corporates & Institutions Macro Research department is issued by the Swedbank Large Corporates & Institutions business area within Swedbank AB (publ) (“Swedbank”). Swedbank is under the supervision of the Swedish Financial Supervisory Authority (Finansinspektionen). In no instance is this report altered by the distributor before distribution. In Finland this report is distributed by Swedbank’s branch in Helsinki, which is under the supervision of the Finnish Financial Supervisory Authority (Finanssivalvonta). In Norway this report is distributed by Swedbank’s branch in Oslo, which is under the supervision of the Financial Supervisory Authority of Norway (Finanstilsynet). In Estonia this report is distributed by Swedbank AS, which is under the supervision of the Estonian Financial Supervisory Authority (Finantsinspektsioon). In Lithuania this report is distributed by “Swedbank” AB, which is under the supervision of the Central Bank of the Republic of Lithuania (Lietuvos bankas). In Latvia this report is distributed by Swedbank AS, which is under the supervision of The Financial and Capital Market Commission (Finanšu un kapitala tirgus komisija). In the United States this report is distributed by Swedbank First Securities LLC ('Swedbank First'), which accepts responsibility for its contents. This report is for distribution only to institutional investors. Any United States institutional investor receiving the report, who wishes to effect a transaction in any security based on the view in this document, should do so only through Swedbank First. Swedbank First is a U.S. broker-dealer, registered with the Securities and Exchange Commission, and is a member of the Financial Industry Regulatory Authority. Swedbank First is part of Swedbank Group. For important U.S. disclosures, please reference: http://www.swedbankfs.com/disclaimer/index.htm In the United Kingdom this communication is for distribution only to and directed only at "relevant persons". This communication must not be acted on – or relied on – by persons who are not "relevant persons". Any investment or investment activity to which this document relates is available only to "relevant persons" and will be engaged in only with "relevant persons". By "relevant persons" we mean persons who:
Have professional experience in matters relating to investments falling within Article 19(5) of the Financial Promotions Order.
Are persons falling within Article 49(2)(a) to (d) of the Financial Promotion Order ("high net worth companies, unincorporated associations etc").
Are persons to whom an invitation or inducement to engage in investment activity (within the meaning of section 21 of the Financial Services and Markets Act 2000) – in connection with the issue or sale of any securities – may otherwise lawfully be communicated or caused to be communicated.
Limitation of liability All information, including statements of fact, contained in this research report has been obtained and compiled in good faith from sources believed to be reliable. However, no representation or warranty, express or implied, is made by Swedbank with respect to the completeness or accuracy of its contents, and it is not to be relied upon as authoritative and should not be taken in substitution for the exercise of reasoned, independent judgment by you. Opinions contained in the report represent the analyst's present opinion only and may be subject to change. In the event that the analyst's opinion should change or a new analyst with a different opinion becomes responsible for our coverage, we shall endeavour (but do not undertake) to disseminate any such change, within the constraints of any regulations, applicable laws, internal procedures within Swedbank, or other circumstances. Swedbank is not advising nor soliciting any action based upon this report. This report is not, and should not be construed as, an offer to sell or as a solicitation of an offer to buy any securities. To the extent permitted by applicable law, no liability whatsoever is accepted by Swedbank for any direct or consequential loss arising from the use of this report. Reproduction & dissemination This material may not be reproduced without permission from Swedbank Large Corporates & Institutions. This report is not intended for physical or legal persons who are citizens of, or have domicile in, a country in which dissemination is not permitted according to applicable legislation or other decisions. Produced by Swedbank Large Corporates & Institutions. Address Swedbank LC&I, Swedbank AB (publ), SE-105 34 Stockholm. Visiting address: Regeringsgatan 13, Stockholm.