79
i

i


Baltimore Water Transit Strategic Plan June 22, 2015
i
Acknowledgments This report is prepared for the Baltimore City Department of Transportation (BCDOT) with assistance from Whitman, Requardt and Associates, LLP and funded through a grant provide by the Baltimore Regional Transportation Board, the Maryland Department of Transportation and the US Department of Transportation.
City of Baltimore Stephanie Rawlings-Blake, Mayor William M. Johnson, Director of Transportation Lindsay Wines, Deputy Director, Administration Veronica P. McBeth, Transit Bureau Chief Valorie LaCour, RLA, LEED AP, Division Chief, Transportation Planning
Project Team BCDOT
Linda Taylor-Newton, City Planner II Ciara M. Willis, Transit Services Administrator Frances Knauff - Dockmaster
Whitman, Requardt and Associates, LLP Thomas J. Hannan, PE, Senior Vice President James M. Ritchey, Vice President Patrick R. Christian, Transit Technical Specialist Andrea Trabelsi, AICP, Transportation Planner Wendy Haubert, Geographic Information System Specialist Abbi Hoff, Graphics Artist
Special thanks to eleven business and community leaders who participated in a Water Transit Workshop on February 24, 2015 including representatives from Greater Baltimore Committee, Waterfront Partnership, Under Armour, Legg Mason, Workshop Development, Watermark Cruises, Baltimore Development Corporation, Locust Point Civic Association, Baltimore Zipcar, and Cruise Maryland. Harbor Care, LLC the operator of the Water Taxi and Harbor Connector cooperated fully over the course of the study providing operating data and water transit expertise.

Baltimore Water Transit Strategic Plan June 22, 2015
ii
ACKNOWLEEDGEMENT PAGE TABLE OF CONTENTS EXECUTIVE SUMMARY ........................................................................................................................................................................................................ 1 1 BALTIMORE WATER TRANSIT AND INNER HARBOR OVERVIEW .................................................................................................................. 5 1.1 Baltimore Water Transit Program ................................................................................................................................................................................ 5 1.2 Baltimore Harbor .......................................................................................................................................................................................................... 6 1.3 Water Taxi .................................................................................................................................................................................................................... 8 1.4 Harbor Connector ....................................................................................................................................................................................................... 10 1.5 Dockmaster ................................................................................................................................................................................................................ 10 1.6 Inner Harbor Property Ownership ............................................................................................................................................................................. 10 1.7 Inner Harbor Wharfage Agreements .......................................................................................................................................................................... 12 1.8 BBMR Management Research Project - Dockmaster ................................................................................................................................................. 14 1.9 Inner Harbor 2.0 ......................................................................................................................................................................................................... 14 2 WATER TAXI SERVICE ............................................................................................................................................................................................. 15 2.1 Water Taxi History ...................................................................................................................................................................................................... 15 2.2 Water Taxi Wharfage Agreement .............................................................................................................................................................................. 15 2.3 Water Taxi Operations ............................................................................................................................................................................................... 16 2.4 Water Taxi Service Design .......................................................................................................................................................................................... 16 2.5 Water Taxi Ridership .................................................................................................................................................................................................. 18 2.6 Public Wharfs ............................................................................................................................................................................................................. 18 2.7 Water Taxi Observations and Recommendations ...................................................................................................................................................... 18 3 HARBOR CONNECTOR SERVICES .......................................................................................................................................................................... 19 3.1 Harbor Connector History .......................................................................................................................................................................................... 19 3.2 Harbor Connector Service Design .............................................................................................................................................................................. 20 3.3 Harbor Connector Ridership and Analysis .................................................................................................................................................................. 22 3.4 Harbor Connector Financial ....................................................................................................................................................................................... 25 3.5 Comparison to other Ferry Operations ...................................................................................................................................................................... 26 3.6 Harbor Connector Observations and Recommendations .......................................................................................................................................... 27 4 DOCKMASTER ............................................................................................................................................................................................................ 30 4.1 Dockmaster Duties ..................................................................................................................................................................................................... 30 4.2 Dockmaster Operations ............................................................................................................................................................................................. 30

Baltimore Water Transit Strategic Plan June 22, 2015
iii
4.3 Dockmaster Financial and Performance .................................................................................................................................................................... 32 4.4 Dockmaster Observations and Recommendations .................................................................................................................................................... 33 5 BALTIMORE WATER TRANSIT TRAVEL MARKET ............................................................................................................................................ 34 5.1 Work Trip Market Analysis ......................................................................................................................................................................................... 34 5.2 Visitor Travel .............................................................................................................................................................................................................. 43 6 ASSESSMENT OF WATER TRANSIT SERVICE EXPANSION .............................................................................................................................. 45 6.1 Visitor Market............................................................................................................................................................................................................. 45
6.1.1 Year Round Service .................................................................................................................................................................................................. 45 6.1.1 Fare Policy ............................................................................................................................................................................................................... 46 6.1.2 Marketing ................................................................................................................................................................................................................ 46
6.2 Inner Harbor Residents .............................................................................................................................................................................................. 46 6.2.1 Inner Harbor Resident Water Transit Services .......................................................................................................................................................... 47 6.2.1 Boston Street Pier Park Landing ............................................................................................................................................................................... 47 6.2.2 Resident Fare Policy ................................................................................................................................................................................................. 47
6.3 Commuter Market ...................................................................................................................................................................................................... 49 6.3.1 Travel Markets North of the Inner Harbor ................................................................................................................................................................ 49 6.3.2 Travel Markets South of the Inner Harbor ................................................................................................................................................................ 51
7 WATER TRANSIT STRATEGIC FINANCIAL PLAN .............................................................................................................................................. 62 7.1 Federal Grant Programs ............................................................................................................................................................................................. 62
7.1.1 FHWA Ferry Boat Program ....................................................................................................................................................................................... 62 7.1.2 FTA Passenger Ferry Grant Program ......................................................................................................................................................................... 62 7.1.1 FTA 5307 and 5339 Formula Program ...................................................................................................................................................................... 63 7.1.2 Congestion Mitigation and Air Quality ...................................................................................................................................................................... 64
7.2 Fare Policy .................................................................................................................................................................................................................. 64 7.3 Financial Plan .............................................................................................................................................................................................................. 65 8 BALTIMORE WATER TRANSIT STRATEGIC PLAN RECOMMENDATIONS .................................................................................................. 68

Baltimore Water Transit Strategic Plan June 22, 2015
iv
List of Figures Figure 1-1: Baltimore Water Transit Study Area .................................................................................................................................................... 7 Figure 1-2: Baltimore Water Taxi .......................................................................................................................................................................... 8 Figure 1-3: Water Taxi Routes - 2014 .................................................................................................................................................................... 9 Figure 1-4: Harbor Connector Vessel Raven .........................................................................................................................................................10 Figure 1-5: Inner Harbor Property Ownership by Type .........................................................................................................................................11 Figure 1-6: Inner Harbor Wharfage Agreements ..................................................................................................................................................13 Figure 2-1: Water Taxi Routes - 2014 ...................................................................................................................................................................17 Figure 2-2: Water Taxi Riders by Year ..................................................................................................................................................................18 Figure 2-3: Water Taxi Riders per Month, 2014 ....................................................................................................................................................18 Figure 3-1: Harbor Connector Ridership by Year ..................................................................................................................................................20 Figure 3-2: Harbor Connector Routes ...................................................................................................................................................................21 Figure 3-3: Harbor Connector Ridership 2012 to 2014 .........................................................................................................................................22 Figure 3-4: Harbor Connector Riders by hour of the Day ......................................................................................................................................23 Figure 3-5: Harbor Connector – AM Peak Riders by Direction ...............................................................................................................................24 Figure 3-6: Harbor Connector – PM Peak Riders by Direction ...............................................................................................................................25 Figure 3-7: Savannah Belles Ferry ........................................................................................................................................................................27 Figure 3-8: Elizabeth River Ferry ..........................................................................................................................................................................27 Figure 3-9: Casco Bay Lines Ferry .........................................................................................................................................................................27 Figure 4-1: Dockmaster Transient Dockings per Month - 2014 .............................................................................................................................30 Figure 4-2: Baltimore Dockmaster Docking Locations ...........................................................................................................................................31 Figure 5-1: Travel Demand Districts – Regional ....................................................................................................................................................35 Figure 5-2: Travel Demand Districts—City of Baltimore.........................................................................................................................................36 Figure 5-3: Travel Demand Districts – City Core....................................................................................................................................................37 Figure 5-4: Work trips from North I-95 Corridor to Harbor East, Downtown, Riverside/Locust Point districts ........................................................40 Figure 5-5: Work trips from BWI and Anne Arundel to Downtown, Harbor East, and Hopkins districts ..................................................................41 Figure 5-6: Work trips from Riverside / Locust Point to Harbor East, Hopkins, and Canton / Highlandtown districts ..............................................42 Figure 6-1: Multi-stop Passenger Ferry Service ....................................................................................................................................................48 Figure 6-2: Harbor Connector Alternative Route – S. Clinton Street to Harbor Point and Downtown ....................................................................50 Figure 6-3: Potential Parking Locations – Locust Point and Federal Hill ................................................................................................................52

Baltimore Water Transit Strategic Plan June 22, 2015
v
Figure 6-4: Westport to Maritime Park / Harbor Point .........................................................................................................................................54 Figure 6-5: Westport Parking and Ferry Service Option ........................................................................................................................................55 Figure 6-6: Cherry Hill to Maritime Park / Harbor Point ........................................................................................................................................57 Figure 6-7: Cherry Hill Medstar Hospital Parking and Ferry Service Option ...........................................................................................................58 Figure 6-8: Fort Armistead to Maritime Park / Harbor Point .................................................................................................................................60 Figure 6-9: Fort Armistead Parking and Ferry Service Options ..............................................................................................................................61
List of Tables Table 1-1: Wharfage Agreement Goals and Progress............................................................................................................................................. 6 Table 3-1: Harbor Connector – Ridership and Cost per Passenger Trip by Time Period .........................................................................................23 Table 3-2: Select Passenger Ferry Operations – 2013 ...........................................................................................................................................26 Table 4-1: Dockmaster Revenue and Expenses.....................................................................................................................................................32 Table 4-2: Dockmaster Performance Measures ....................................................................................................................................................32 Table 5-1: Estimates of home-based work trips to Baltimore City, 2011 ................................................................................................................39 Table 5-2: Baltimore Visitors Children and Adults ................................................................................................................................................43 Table 5-3: Baltimore Visitors by Trip Purpose .......................................................................................................................................................43 Table 5-4: Season of Trips ....................................................................................................................................................................................44 Table 5-5: Activity Participation ...........................................................................................................................................................................44 Table 6-1: Water Taxi Fare Products - 2015 ..........................................................................................................................................................46 Table 6-2: Inner Harbor Population ......................................................................................................................................................................46 Table 6-3: Downtown / Harbor East to I-95 North Travel Market Analysis ............................................................................................................51 Table 6-4: Harbor East to Westport Travel Market Analysis .................................................................................................................................53 Table 6-5: Harbor East to Cherry Hill Travel Market Analysis ................................................................................................................................56 Table 6-6: Harbor East to Fort Armistead Travel Market Analysis .........................................................................................................................59 Table 7-1: Harbor Connector Estimate of Annual FTA Formula Funding ...............................................................................................................63 Table 7-2: Financial Plan Assumptions .................................................................................................................................................................65 Table 7-3: Projected Harbor Connector Revenue Hours .......................................................................................................................................66 Table 7-4: Harbor Connector Operating Costs and Revenues ...............................................................................................................................66 Table 7-5: Harbor Connector Capital Costs ...........................................................................................................................................................67 Table 7-6: Harbor Connector Capital Financing ....................................................................................................................................................67 Table 8-1: Summary of Recommendations ...........................................................................................................................................................68

Baltimore Water Transit Strategic Plan June 22, 2015
1
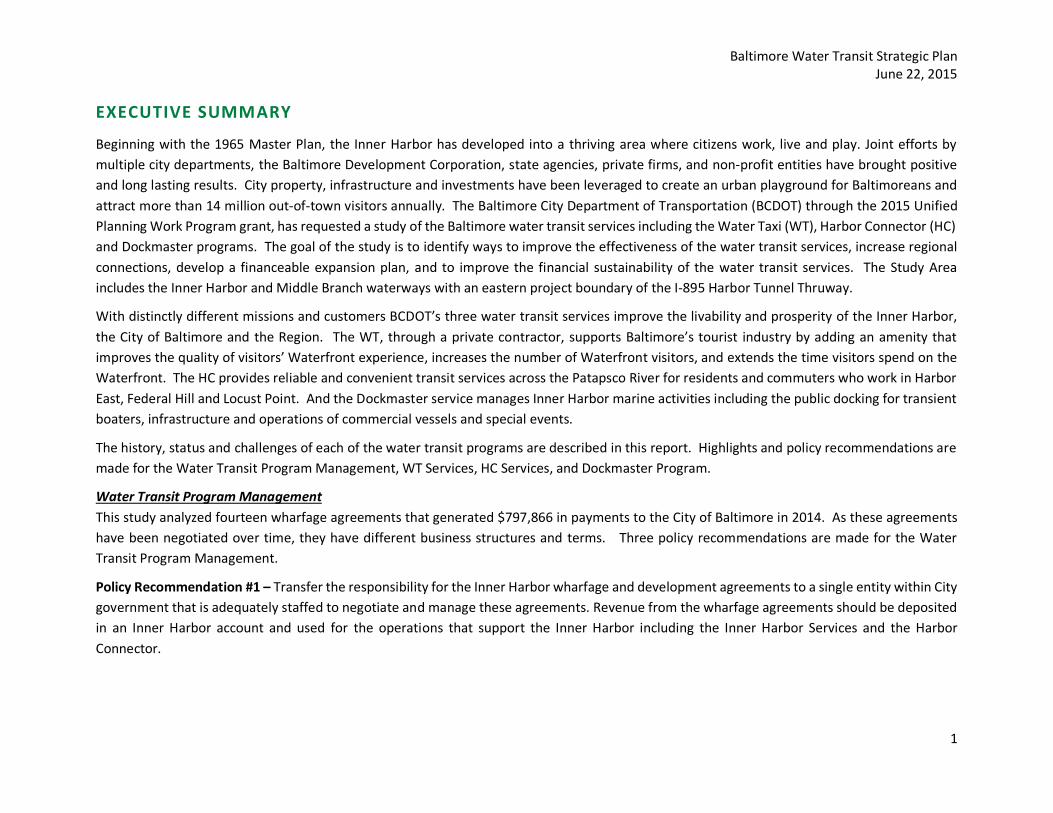
EXECUTIVE SUMMARY
Beginning with the 1965 Master Plan, the Inner Harbor has developed into a thriving area where citizens work, live and play. Joint efforts by multiple city departments, the Baltimore Development Corporation, state agencies, private firms, and non-profit entities have brought positive and long lasting results. City property, infrastructure and investments have been leveraged to create an urban playground for Baltimoreans and attract more than 14 million out-of-town visitors annually. The Baltimore City Department of Transportation (BCDOT) through the 2015 Unified Planning Work Program grant, has requested a study of the Baltimore water transit services including the Water Taxi (WT), Harbor Connector (HC) and Dockmaster programs. The goal of the study is to identify ways to improve the effectiveness of the water transit services, increase regional connections, develop a financeable expansion plan, and to improve the financial sustainability of the water transit services. The Study Area includes the Inner Harbor and Middle Branch waterways with an eastern project boundary of the I-895 Harbor Tunnel Thruway.
With distinctly different missions and customers BCDOT’s three water transit services improve the livability and prosperity of the Inner Harbor, the City of Baltimore and the Region. The WT, through a private contractor, supports Baltimore’s tourist industry by adding an amenity that improves the quality of visitors’ Waterfront experience, increases the number of Waterfront visitors, and extends the time visitors spend on the Waterfront. The HC provides reliable and convenient transit services across the Patapsco River for residents and commuters who work in Harbor East, Federal Hill and Locust Point. And the Dockmaster service manages Inner Harbor marine activities including the public docking for transient boaters, infrastructure and operations of commercial vessels and special events.
The history, status and challenges of each of the water transit programs are described in this report. Highlights and policy recommendations are made for the Water Transit Program Management, WT Services, HC Services, and Dockmaster Program.
Water Transit Program Management This study analyzed fourteen wharfage agreements that generated $797,866 in payments to the City of Baltimore in 2014. As these agreements have been negotiated over time, they have different business structures and terms. Three policy recommendations are made for the Water Transit Program Management.
Policy Recommendation #1 – Transfer the responsibility for the Inner Harbor wharfage and development agreements to a single entity within City government that is adequately staffed to negotiate and manage these agreements. Revenue from the wharfage agreements should be deposited in an Inner Harbor account and used for the operations that support the Inner Harbor including the Inner Harbor Services and the Harbor Connector.

Baltimore Water Transit Strategic Plan June 22, 2015
2
Policy Recommendation #2 – Hire a transit grants coordinator for the City’s Sustainable Transportation Program to identify and apply for grants and maintain federal compliance.
Policy Recommendation #3 – Continue the WT / HC business structure with a private operator bearing the financial risk and benefits of the WT while the City pays the cost of the HC.
Water Taxi During the past ten years under the current wharfage agreement, the WT Service has become a fun and recognizable service. However, the City and WT operator can do more to increase the number of visitors that come to the City and to make the WT an amenity for City residents. Three policy recommendations are made for the WT service that should be implemented through the upcoming WT / HC request for proposals.
Policy Recommendation #4 - Brand the WT service as an attraction rather than a means of transportation.
Policy Recommendation #5 - Change the WT pricing for Baltimore area residents to attract a larger number of family and friends.
Policy Recommendation #6 - Increase the amount of WT service operated during the off season especially on weekends so that usable year round service may be available for Baltimore residents. Consideration should be given to operating a year round multi-stop route as shown in Figure 6-1.
Harbor Connector The HC service is popular with commuters. Since its beginning in 2010 HC ridership has grown to more than 200,000 trips per year. From 2013 to 2014, HC average daily ridership grew by 47 percent. Eight policy recommendations are offered for the HC.
Policy Recommendation #7 – Rebrand the HC so that it is separate from the WT and clearly identified as an extension of the Charm City Circulator (CCC). New signage and branding should be placed on each of the vessels and at each HC landing. Wayfinding signs should be installed so that it is easy for potential customers to find the HC landings.
Policy Recommendation #8 – Reduce service hours for HC Route 2 and Route 3 to peak periods only including the hours of 6:30 AM to 9:30 AM and 3:30 PM to 7:30 PM.
Policy Recommendation #9 – Establish HC fares with a $5 daily pass and an $80 monthly pass. The daily pass will be sold on-board the vessel by crew members and the monthly passes should be sold through employers and the WT / HC website.
Policy Recommendation #10 – Start-up a new HC Route 4 from Canton Waterfront Park to Maritime Park / Harbor Point before the opening of the Harbor Point development. Transportation impact fees and contributions from Harbor Point / Harbor East employers should be utilized to pay for the capital and operating costs for this service.

Baltimore Water Transit Strategic Plan June 22, 2015
3
Policy Recommendation #11 – Reserve the Baltimore Department of Transportation property at Boston and S. Clinton Streets for use as HC passenger parking. A transit facility at this site should be developed in coordination with the Canton Crossing Phase II. A feasibility study should be undertaken to determine the number of parking spaces, preliminary design, project costs, potential grants and financing. Upon completion of the parking facility, HC Route 4 should be extended to Harbor Place offering service for Downtown employees.
Policy Recommendation #12 – Provide HC parking in the Riverside / Locust Point area so that HC customers do not create a parking problem for neighborhood residents. Potential parking facility sites include the Fire Department Repair Facility on Key Highway and a warehouse at 1450 Beason Street that is currently used by Under Armour for parking. In each case, the HC parking should be part of a larger joint development project. A feasibility study should be undertaken to determine the number of parking spaces, preliminary design, project costs, potential grants and financing.
Policy Recommendation #13 – Qualify for Federal Transit Administration (FTA) 5307 and 5339 grant funds by completing National Transit Database (NTD) reports. Federal Highway Administration (FHWA) ferry boat formula funds should also be pursued by completing the 2014 National Census of Ferry Operators through the Bureau of Transportation Statistics.
Policy Recommendation #14 – Apply for FTA Ferry Boat Discretionary grants to support the proposed parking improvements and to acquire three all-weather ferries for HC Route 4.
Dockmaster The Dockmaster’s office performs very well in special event planning and management of the commercial vessels that operate from the City’s docks and finger piers. However, the Dockmaster’s office does not perform well in the collection of fees from transient boaters. There is stiff competition from six private Inner Harbor marinas and the City’s facilities have limited amenities. One policy recommendation is offered for the Dockmaster.
Policy Recommendation #15 – Equip the Dockmaster’s staff with technology to collect credit card payments from transient boaters.
Baltimore Water Transit Strategic Plan June 22, 2015
4
Financial Impact
During Fiscal Year 2016 the Water Transit services including the HC and Dockmaster’s office are budgeted to receive $928,069 in funding from the City (HC $663,408 and Dockmaster $264,661) while receiving $356,281 in revenues ($159,741 WT, Under Armour $94,540 and $102,000 Dockmaster dockage fees) for a net operating cost to the City of $571,788.
During fiscal year 2017, the operating costs of the HC are expected to increase to $971,100 following completion of the new WT/HC wharfage agreement. This would increase the net cost to the City to $1,039,221. In order to manage the financial impact while improving services, fares should be charged generating an estimated $150,000 in additional revenues while service hours should be limited on routes 2 and 3 to peak hours only saving $249,000 annually. In total, these items will result in a projected net operating cost to the City of $640,221. The proposed Route 4 will add $199,200 in additional expenses while earning $50,000 in revenues. The City should also seek contributions from employers and apply transportation fees to support this Harbor Connector Route 4. Beginning in fiscal year 2018, FTA 5307 funding should be available for vessel maintenance and FHWA ferry boat formula funds should be available for dock and landing improvements. With these combined actions, the Fiscal Year 2018 net operating cost to the City will be $789,421.
Taken together, these recommendations should provide for the financial sustainability of the Water Transit services.

Baltimore Water Transit Strategic Plan June 22, 2015
5
1 BALTIMORE WATER TRANSIT AND INNER HARBOR OVERVIEW
Baltimore Water Transit services, wharfage agreements, Inner Harbor property ownership and related studies are summarized in this section.
1.1 Baltimore Water Transit Program
BCDOT’s three water transit programs improve the livability and prosperity of the Inner Harbor, City and Region. However, they have distinctly different missions and customers.
The WT, through a private contractor, supports Baltimore’s tourist industry by adding an amenity that improves the quality of visitors’ Waterfront experience, increases the number of Waterfront visitors, and extends the time visitors spend on the Waterfront.
The HC provides reliable and convenient transit services across the Patapsco River for residents and commuters who work in Harbor East, Federal Hill and Locust Point.
The Dockmaster program does a great job with special events and commercial vessel management providing a much needed management function for the Inner Harbor. There is stiff competition for transient boaters from the six Inner Harbor Private marinas. This competition along with limited amenities makes it unlikely that the Dockmaster program can succeed in operating at a profit.
The 2005 Water Taxi Wharfage Agreement states seven goals for the water transit program including: 1. To become the model among great waterfront cities for providing affordable, financially viable, reliable, recognizable, and state-of-the-
art water taxi/commuter service; 2. To support the city's tourism industry by providing a fun, affordable and recognizable water taxi service to the array of historic, cultural,
recreational and entertainment venues in the Inner Harbor. To participate in cross promotional and marketing efforts with other attractions, retailers and hotels;
3. To broaden the appeal of the WT to commuters working within the Inner Harbor, Central Business District, and waterfront neighborhoods from Canton to Locust Point;
4. To better integrate the WT service with land based public and private commuter services; 5. To secure federal transportation funds to enhance commuter service; 6. To provide an escalating, maximized and auditable stream of revenue to Baltimore City and provide job and training opportunities for
Baltimore City residents; 7. Maximize navigational safety in the Harbor based on the recommendations of the Baltimore Maritime Plan;
Progress towards these goals is shown in Table 1-1.

Baltimore Water Transit Strategic Plan June 22, 2015
6
Table 1-1: Wharfage Agreement Goals and Progress
Wharfage Agreement Goals Achievements Status Comments Water Taxi Harbor Connector 1 To become the model among great waterfront cities for providing: No No
While Inner Harbor investments have received national awards, the water transit service has not received recognition.
1A Affordable No – not affordable for Baltimore residents
Yes – currently a free service
A $14 day pass for the water taxi may not be affordable for commuters
1B Financially viable Yes Financial sustainability could be improved
The opportunities presented by both services make them financially viable for the City
1C Reliable No - limited operation Yes The WT has a limited operation for seven months per year 1D Recognizable Yes No The HC should have a distinct and identifiable brand 1E State of the Art The ferry landings are state of the art although some
can use additional investment. Vessels for both services are not all weather and need improvement.
The City anticipates improving and updating vessels through federal grants and the upcoming wharfage agreement
2A Support City’s tourism industry Yes Not applicable Good coordination with visitor industry 2B Participate in cross promotional events Yes Not applicable Could be expanded to include joint ticket sales and joint venue
advisory committees 3 Appeal to commuters No – limited hours Yes The WT does not appeal to commuters due to limited hours 4 Integrate Water Taxi with land based commuter services No No There is no apparent coordination with the land based
commuter services 5 Secure federal transportation funds to enhance commuter service
Not applicable Partial While federal funding has been received some federal funding opportunities have been missed
6A Provide escalating, maximized and auditable stream of revenue
Partial - $156,000 per year payments to City
Employers pay 15% of operating costs
There are opportunities for passenger fare revenues and employer contributions that should be considered
6B Provide job training Yes Yes There are opportunities to hire and introduce lower wage employees to the maritime trade,
7 Maximize navigational safety Follows Coast Guard guidelines All weather vessels could further improve navigational safety
1.2 Baltimore Harbor
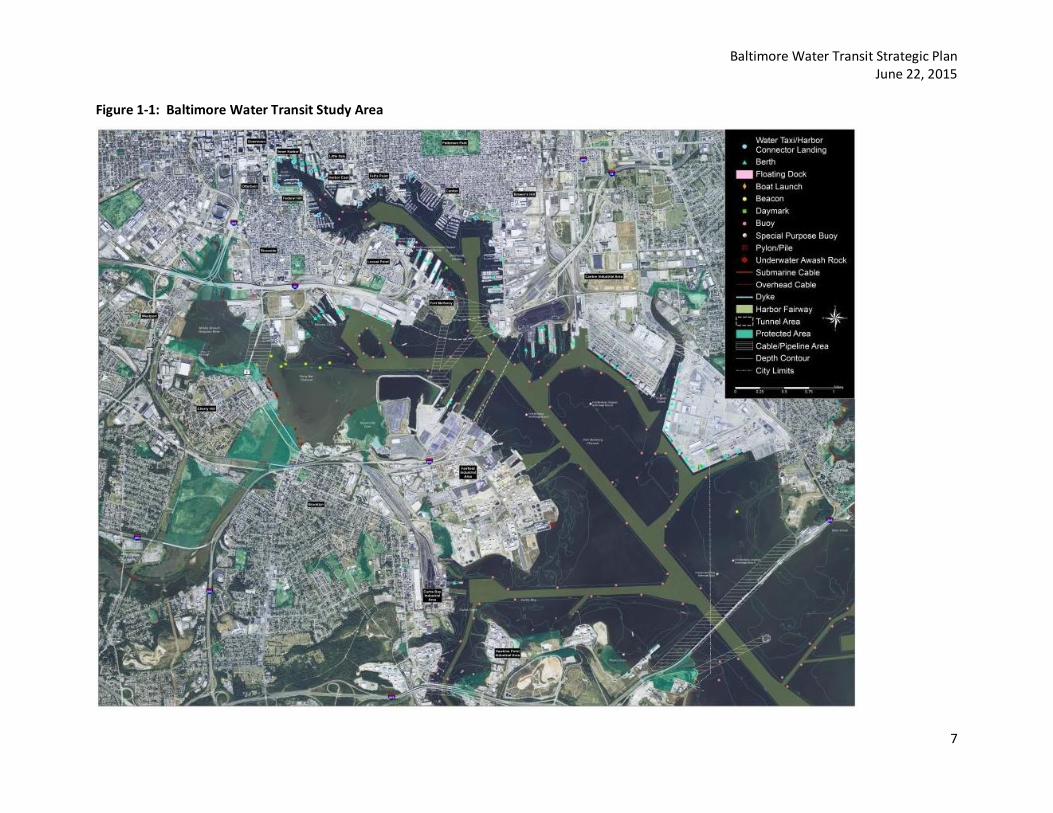
As shown in Figure 1-1, the Study Area includes the Inner Harbor and Middle Branch waterways with an eastern project boundary of the I-895 Harbor Tunnel Thruway.
Baltimore Water Transit Strategic Plan June 22, 2015
7
Figure 1-1: Baltimore Water Transit Study Area
Baltimore Water Transit Strategic Plan June 22, 2015
8
1.3 Water Taxi
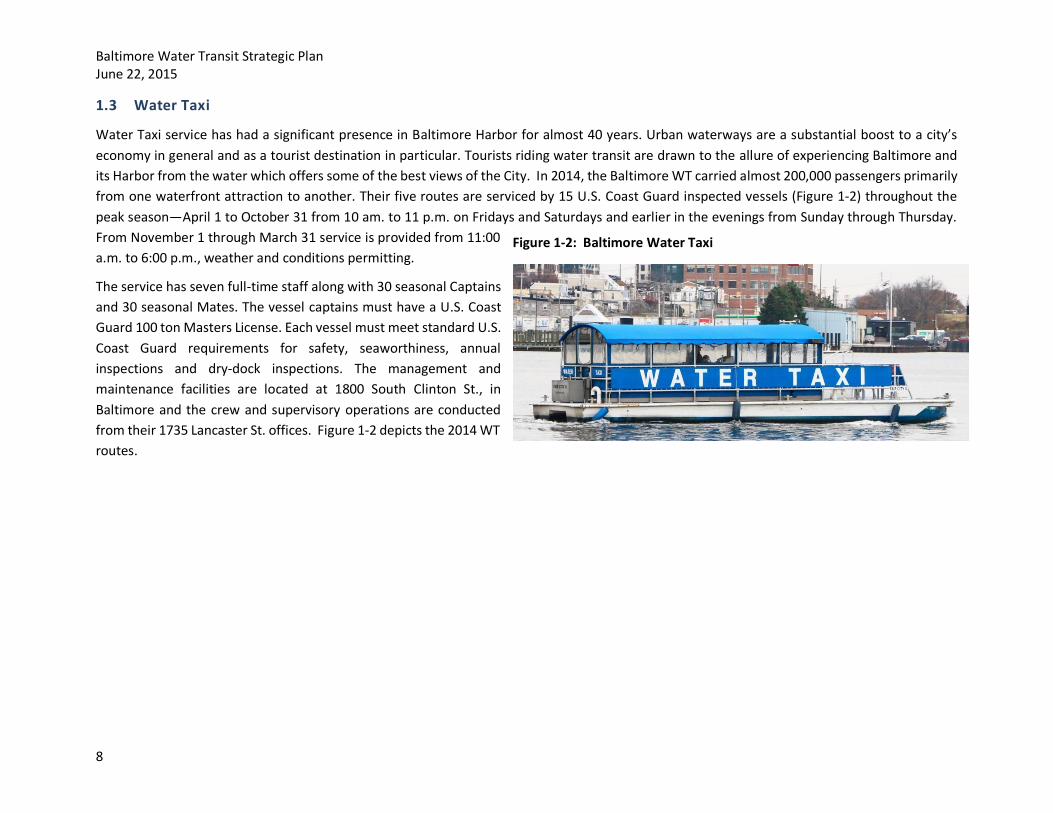
Water Taxi service has had a significant presence in Baltimore Harbor for almost 40 years. Urban waterways are a substantial boost to a city’s economy in general and as a tourist destination in particular. Tourists riding water transit are drawn to the allure of experiencing Baltimore and its Harbor from the water which offers some of the best views of the City. In 2014, the Baltimore WT carried almost 200,000 passengers primarily from one waterfront attraction to another. Their five routes are serviced by 15 U.S. Coast Guard inspected vessels (Figure 1-2) throughout the peak season—April 1 to October 31 from 10 am. to 11 p.m. on Fridays and Saturdays and earlier in the evenings from Sunday through Thursday. From November 1 through March 31 service is provided from 11:00 a.m. to 6:00 p.m., weather and conditions permitting.
The service has seven full-time staff along with 30 seasonal Captains and 30 seasonal Mates. The vessel captains must have a U.S. Coast Guard 100 ton Masters License. Each vessel must meet standard U.S. Coast Guard requirements for safety, seaworthiness, annual inspections and dry-dock inspections. The management and maintenance facilities are located at 1800 South Clinton St., in Baltimore and the crew and supervisory operations are conducted from their 1735 Lancaster St. offices. Figure 1-2 depicts the 2014 WT routes.
Figure 1-2: Baltimore Water Taxi

Baltimore Water Transit Strategic Plan June 22, 2015
9
Figure 1-3: Water Taxi Routes - 2014
Map provided by Harbor Care, LLC

Baltimore Water Transit Strategic Plan June 22, 2015
10
1.4 Harbor Connector
The HC is the water transit portion of the CCC. The CCC and its HC commenced service in 2010. This free service was funded primarily through a parking tax, advertising revenues, state grants and other sources (University of Maryland, East Baltimore Development, Inc., Under Armour and impact or development contributions). One time federal grants have also been used for the operation on a limited basis. The CCC has 4 routes and the HC 3 routes.
In 2014 the HC transported over 201,000 passengers. The service is operated by a contractor, Harbor Care, LLC, which also owns and operates the Baltimore Water Taxi. The City of Baltimore’s responsibilities include providing two of the three vessels (the Raven – Figure 1-4 and the Oriole) under a “bareboat lease agreement” and provide and maintain the service’s landings and docks. The Operator is responsible for the third vessel, all vessel maintenance and crew, and marketing and sales. The proposed FY 2016 City budget includes $663,408 for the HC services.
1.5 Dockmaster
The Dockmaster’s Office manages numerous marine activities in the Inner Harbor including the public docking for transient boaters, infrastructure and operations of commercial vessels and managing special events. This is done to ensure the safe and enjoyable use of the navigable waters of the Inner Harbor and is intended to generate revenues necessary to maintain the waterfront infrastructure. In practice however, the Dockmaster’s office as currently structured requires ongoing City funding for its operation and does not generate funding for the waterfront infrastructure.
The Dockmaster’s Office manages the public docking area, collects fees from boats docking at its facilities, provides some limited amenities to visiting boats, schedules visiting ships and enforces boating rules and regulations. During the peak season, the office contributes to special events by planning for and hosting commercial vessels operating in the inner harbor.
1.6 Inner Harbor Property Ownership
Figure 1-5 shows the Inner Harbor property ownership by type.
Figure 1-4: Harbor Connector Vessel Raven

Baltimore Water Transit Strategic Plan June 22, 2015
11
Figure 1-5: Inner Harbor Property Ownership by Type

Baltimore Water Transit Strategic Plan June 22, 2015
12
1.7 Inner Harbor Wharfage Agreements
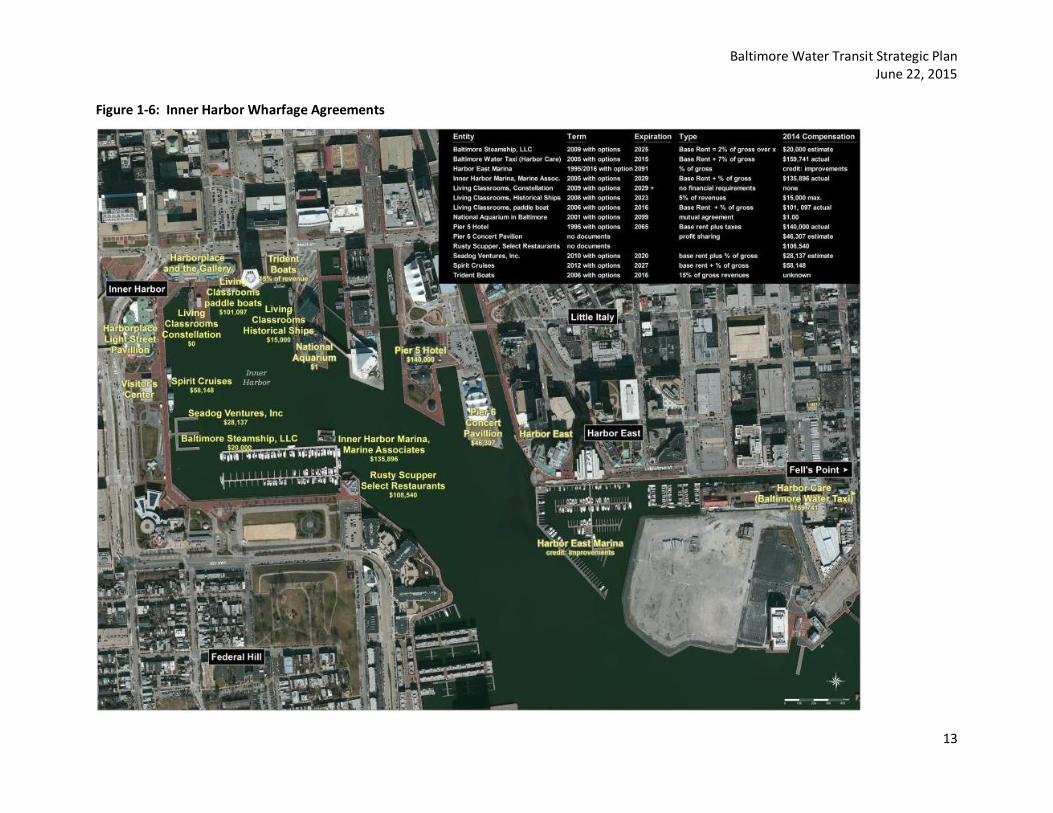
Agreements for properties along the Inner Harbor were analyzed to document the location, entity, term, purpose, financial parameters, and revenues for each wharfage agreement. Figure 1-6 identifies the wharfage agreement location and revenues produced. Each of the wharfage agreements has specific purposes. The National Aquarium is a major attraction that anchors the waterfront and requires a long term lease in order for the Aquarium to make the necessary capital investments. The Historical Ships—USS Constellation, USS Torsk, USCG Cutter Taney and the Lightship Chesapeake – help enhance an exciting maritime atmosphere but are not significant revenue generators. Meanwhile, the water taxi, paddle boat, electric boat, and sightseeing boat operations, restaurants and marinas are revenue generators. Their wharfage agreements call for a base rent and percentage of the gross revenues be paid to the City. During 2014 the fourteen wharfage agreements analyzed in this study generated $797,866 in payments to the City of Baltimore in 2014. As these agreements have been negotiated over time, they have different business structures and terms. In addition to the wharfage agreements there is a Baseline Memorandum of Understanding between the City and the Waterfront Management Authority for establishing a level of services to be maintained in the Waterfront Management District. The joint efforts of the District and City Departments (Transportation, Public Works, Police, and Parks and Recreation) have proven successful in keeping the promenade and common areas clean, safe, secure, well-lit, well maintained, and landscaped. This attention to detail is critical to the success of the Inner Harbor as a positive experience for the customer.
Baltimore Water Transit Strategic Plan June 22, 2015
13
Figure 1-6: Inner Harbor Wharfage Agreements

Baltimore Water Transit Strategic Plan June 22, 2015
14
1.8 BBMR Management Research Project - Dockmaster
In April 2013, the City of Baltimore’s Bureau of the Budget and Management Research (BBMR) issued the following report--Evaluating the Operations and Revenue Generating Potential of the Inner Harbor Dockmaster. Looking primarily at the Dockmaster’s role of collecting all transient boater docking fees in the Inner Harbor and increasing revenue potential, the BBMR Report made the following recommendations:
1. Shift to a fee structure based on length of the vessel and hours docked. 2. Extend Dockmaster’s Office hours during the peak season in an effort to reduce the number of boaters who do not pay. 3. Change the current organizational structure of the service to reflect work of the staff and reduce the number of full-time positions while
increasing temporary staff for the peak season. 4. Provide credit card payment capabilities either by kiosk machine or hand held machines utilized by Dockmaster staff. 5. Apply for the Boating Infrastructure Grant from the U.S. Fish and Wildlife Service to improve existing infrastructure in order to help remain
competitive with private marinas and surrounding jurisdictions. 6. Restrict any revenues above the cost to provide the Dockmaster service for capital improvements or debt service on capital improvements
at the Finger Piers, West Wall, and Piers 3, 4, and 5. 7. Require charter vessels to reserve docking space in advance and develop a charter boat fee structure. 8. Develop an MOU with the BCPD Marine Unit to establish when docks and piers will be patrolled by the Unit for illegally docked vessels. 9. Develop a return on investment analysis for extending utilities to all available transient docking locations.
1.9 Inner Harbor 2.0
The Waterfront Partnership of Baltimore, Inc. undertook a long range study published in 2013. In the opening of the report they state, “Baltimore’s Inner Harbor is an incredible asset for Baltimore City and the State of Maryland, fueling $2.3 billion in overall economic activity, creating 21,000 jobs in the region and generating $102 million in annual tax revenue to the City and State.”
The Final Plan proposals include: enhance the Promenade to make it a clear and comprehensive system, create a series of clear connections near the Inner Harbor that allow safe crossings and clear vistas to visually connect neighborhoods to the water and the harbor, integrate green infrastructure throughout the district, identify significant new attractions in the Inner Harbor that are strategically located to extend the destination experience. One of the project elements is the construction of an Inner Harbor Bridge Connector that would connect Rash Field and its adjacent neighborhoods to the north shore with a designated footbridge. A fare free boat is proposed by Inner Harbor 2.0 to operate continuously along this route connecting the neighborhoods in the interim.

Baltimore Water Transit Strategic Plan June 22, 2015
15
2 WATER TAXI SERVICE
2.1 Water Taxi History
As noted previously, water taxi services have had a significant presence in Baltimore Harbor for almost 40 years. Into the early 2000’s there were two companies competing for the water taxi business: Harbor Shuttle and Harbor Boating. In 2004, a tragedy occurred when winds, vessel location, outdated regulations and vessel design converged to cause the Harbor Shuttle water taxi, Lady D, to capsize and led to the deaths of 6 passengers. This accident had a profound impact on the City of Baltimore and water transit operations throughout the Country. The revised U.S. Coast Guard Passenger Weight and Inspected Vessel Stability Requirements issued on December 14, 2010, are in-part a result of the accident and subsequent investigations carried out by the National Transportation Safety Board.
Soon after the Lady D accident, the City of Baltimore advertised a Request for Proposals (RFP) for water transit services. Harbor Boating, Inc. and Learning Classrooms Foundation were awarded the Wharfage Agreement in 2005. Harbor Boating, Inc., operating as the Baltimore Water Taxi, continued the service until July 2010 when the business was purchased by Harbor Care, LLC. The City of Baltimore approved the assignment of the 2005 Wharfage Agreement, as amended in 2009, to Harbor Care, LLC.
2.2 Water Taxi Wharfage Agreement
The WT wharfage agreement provides that the Operator, in exchange for exclusive operating rights, provide year round service with its own vessels and crew, vessel maintenance, marketing and sales, with an emphasis on safe, reliable, and customer friendly service. The Wharfage Agreement also provides that the City construct and maintain landings/docks and provide landscaping and general upkeep. The Agreement, which began April 1, 2005, is for seven years with three one-year renewals. The City has extended the Wharfage Agreement until September 30, 2016 to permit the City time to issue a RFP for a new agreement.
The Agreement provides that the Operator pay the City as follows: - Year 1: 5% of monthly gross income from ticket sales and charters - Years 2-3: 6% of monthly gross income from ticket sales and charters - Years 4-7: 7% of monthly gross income from ticket sales and charters - In addition the City will receive 2% of gross revenues over $2.5 million from ticket sales and charters - The minimum wharfage fee is $70,000 annually
For the 2014 calendar year, the Baltimore Water Taxi paid the City $159,741 based on 7% of the total gross revenue from ticket sales and charters in the amount of $2,281,516.

Baltimore Water Transit Strategic Plan June 22, 2015
16
2.3 Water Taxi Operations
Harbor Care, LLC has seven full-time staff along with 30 seasonal Captains and 30 seasonal Mates. The vessel captains are required to have a U.S. Coast Guard 100 ton Masters License. Each vessel must meet standard U.S. Coast Guard requirements for safety, seaworthiness, and annual inspections and dry-dock inspections. The management and maintenance facilities are located at 1800 South Clinton St., in Baltimore and the crew and supervisory operations are conducted from their 1735 Lancaster St. offices.
The Baltimore Water Taxi has a total fleet of 18 vessels. Fifteen are dedicated to the water taxi operation and three are dedicated to the HC operation. Of the 15 vessels dedicated to the WT operation, two are assigned to each of the five routes daily during the peak season. The fleet has the capacity to carry a range of passengers from as few as eleven to as many as 100. This is based on the size of the vessels and its U.S. Coast Guard Certificate of Inspection. Two vessels have a passenger capacity of 100 each, one with 74, one with 51, seven with 49, one with 39, one with 36, one with 25, one with 20 and three with 11. Combined, the total seating capacity is 821 seats.
The peak season for the WT is May 1 to September 1 (Labor Day). During the peak season the service begins each day at 10:00 a.m. and operates to 11:00 p.m. daily except for Sundays when service ends at 9:00 p.m.
During the “shoulder seasons” of April 1 to April 30 and September 2 through October 31, service begins each day at 10:00 a.m. and ends at 11:00 p.m. on Fridays and Saturdays and ends at 8:00 p.m. Sundays through Thursdays.
During the off-season, the WT operates limited service seven days a week from 11:00 a.m. to 6:00 p.m., weather and conditions permitting.
2.4 Water Taxi Service Design
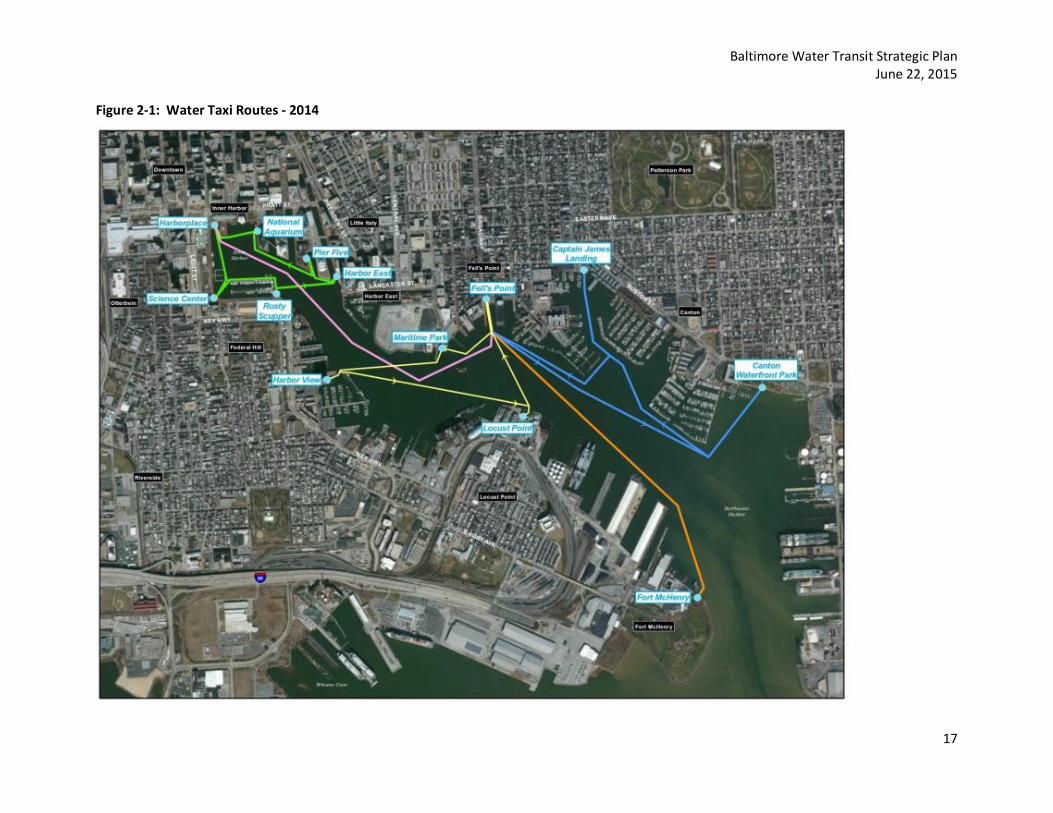
During 2014 the WT operated five routes to and from 13 docks/floats in Baltimore Harbor (Figure 2-1). Twelve of these docks are publicly owned and maintained while one is privately owned. The docks are generally in good condition with some repairs and maintenance required at selected facilities. The docks at Fells Point were financed through a Federal Ferryboat Discretionary Grant (FBD) and the City of Baltimore. The five routes operated by the WT primarily serve the tourist attractions in the Harbor. These WT routes are:
- The Green Route operates a loop between National Aquarium, Harbor Place, Science Center, Rusty Scupper, Harbor East and Pier 5. - The Red Route is a direct route between Harbor Place and Fells Point. - The Yellow Route operates a loop between Maritime Park, Harbor View, Locust Point, and Fells Point. - The Blue Route operates a loop between Fells Point, Canton Waterfront Park and Captain James Landing. - The Purple route operates directly between Fells Point and Fort McHenry.
Baltimore Water Transit Strategic Plan June 22, 2015
17
Figure 2-1: Water Taxi Routes - 2014
Baltimore Water Transit Strategic Plan June 22, 2015
18
2.5 Water Taxi Ridership
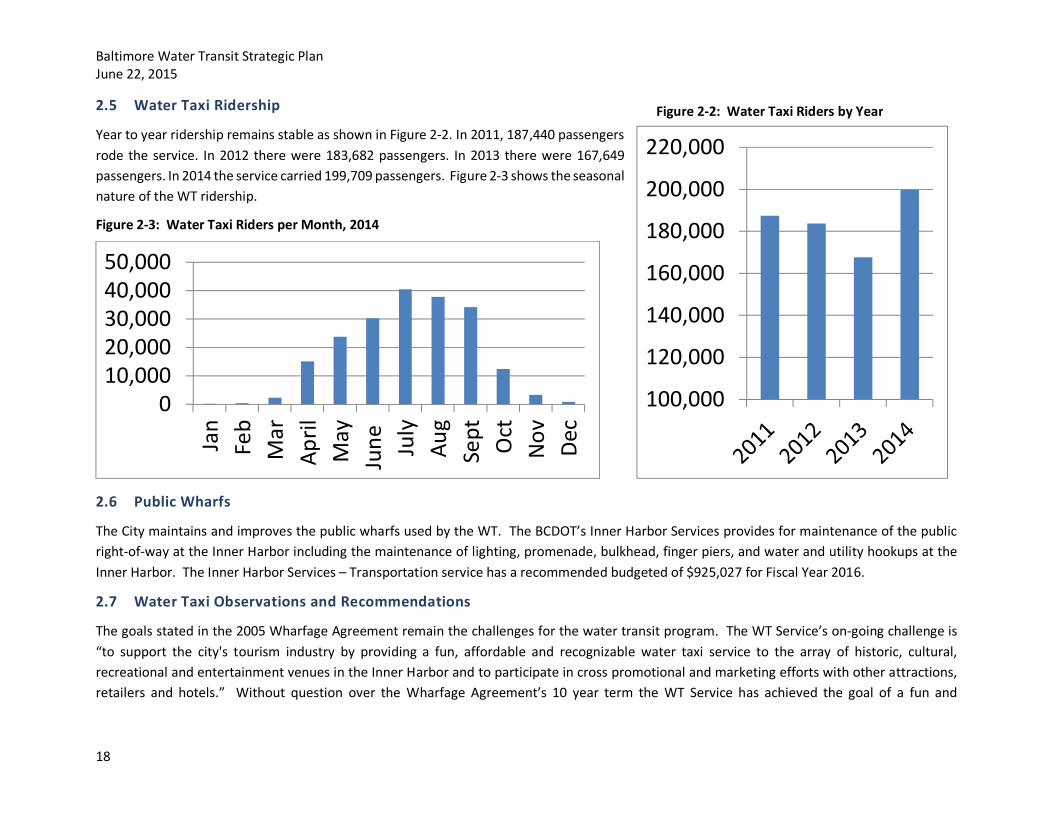
Year to year ridership remains stable as shown in Figure 2-2. In 2011, 187,440 passengers rode the service. In 2012 there were 183,682 passengers. In 2013 there were 167,649 passengers. In 2014 the service carried 199,709 passengers. Figure 2-3 shows the seasonal nature of the WT ridership.
Figure 2-3: Water Taxi Riders per Month, 2014
2.6 Public Wharfs
The City maintains and improves the public wharfs used by the WT. The BCDOT’s Inner Harbor Services provides for maintenance of the public right-of-way at the Inner Harbor including the maintenance of lighting, promenade, bulkhead, finger piers, and water and utility hookups at the Inner Harbor. The Inner Harbor Services – Transportation service has a recommended budgeted of $925,027 for Fiscal Year 2016.
2.7 Water Taxi Observations and Recommendations
The goals stated in the 2005 Wharfage Agreement remain the challenges for the water transit program. The WT Service’s on-going challenge is “to support the city's tourism industry by providing a fun, affordable and recognizable water taxi service to the array of historic, cultural, recreational and entertainment venues in the Inner Harbor and to participate in cross promotional and marketing efforts with other attractions, retailers and hotels.” Without question over the Wharfage Agreement’s 10 year term the WT Service has achieved the goal of a fun and
010,00020,00030,00040,00050,000
Jan
Feb
Mar
April
May
June Ju
lyAu
gSe
pt Oct
Nov De
c
100,000
120,000
140,000
160,000
180,000
200,000
220,000
Figure 2-2: Water Taxi Riders by Year

Baltimore Water Transit Strategic Plan June 22, 2015
19
recognizable service. But what more can the City and the WT operator do to increase the number of visitors that come to the City and to increase visitor participation in Waterfront activities?
The upcoming WT / HC RFP will seek ideas from private firms in achieving this goal. A key challenge for the City will be to conduct this RFP in a way that permits maximum competition and allows the successful proposer to build upon the accomplishments of the current operation.
Some suggestions the City and WT operator may consider are: - Brand the WT service as an attraction rather than a means of transportation. Consider dropping “taxi” from the name. - Create separate and distinct brands for the HC and WT services. - Increase the outreach to Baltimore area citizens to advocate the WT as a fun activity for visiting friends and relatives. - Change the pricing for Baltimore area residents to attract a larger number of family and friends. For example, it may be appropriate to
reduce the price of the frequent floater pass and sell it as a monthly or quarterly product. - Sell joint attraction tickets with other Inner Harbor Attractions such as a National Aquarium / WT combined ticket. - Rather than a membership program for each attraction, create an Inner Harbor membership program that includes the WT and each of
the Inner Harbor attractions. - Develop a monthly commuter pass for use on the Harbor Connector (see Section 7-2) that would allow the use of the WT during the mid-
day and evening hours. - Increase the amount of WT service operated during the off season especially on weekends. Consider operating a multi-stop route as
shown in Figure 6-1. - Extend the WT full service period on weekends through the Christmas holidays and New Year’s Day.
3 HARBOR CONNECTOR SERVICES
3.1 Harbor Connector History
The CCC and HC services were started to:
- help reduce traffic congestion in and around Downtown Baltimore and the Harbor - offer modal options for downtown residents to have more accessibility to work places, businesses and education - improve connections among City communities - offer tourists a fun and free way to get around downtown and visit the major tourist destinations. - reduce vehicular emissions contributing to air pollution

Baltimore Water Transit Strategic Plan June 22, 2015
20
While service on the CCC operates 7 days a week, service on the HC operates Monday through Friday, from 7 a.m. to 7 p.m. Convenience, reliability, frequency and free transportation make both services popular.
The 2005 Wharfage Agreement with the WT Operator anticipated that water transit commuter service would be in place at some point in the future. The HC service began in 2010 through a “bareboat charter lease” where the City provides two vessels for the operation, the Raven and the Oriole. The HC costs are paid by the City to the Baltimore Water Taxi based on a fixed monthly rate increased annually according to the CPI. The fee is currently $16,810 per route per month with the City paying the fuel costs.
Beginning in 2010, the first of three routes commenced operation. For a short period of time before the advent of the Harbor Connector Route 1, several businesses worked with the Baltimore Water Taxi operator to transport employees to and from designated docks during morning and afternoon peak hours. Initially this operation was funded by a substantially reduced fare with the expectation that it would likely go to full fares. The advent of the HC shifted the focus and design of the transportation service by expanding frequency of service and increasing the number of routes.
Ridership as shown in Figure 3-1 has steadily increased over the past five years due partly to the increased number of routes but also due to the popularity of the service. In 2014 there were over 201,000 passengers transported.
3.2 Harbor Connector Service Design
The HC service supplements the CCC service with three ferry boats operating Monday through Friday (when weather conditions permit) from 7:00 a.m. to 7:00 p.m. except holidays.
The HC service has three routes as shown in Figure 3-2: - Route 1 service operates between Maritime Park and Locust Point. The frequency of each trip is 15 minutes. This service began in 2010
and has shown steady increases in ridership. - Route 2 service operates between Canton Waterfront Park and Locust Point. The frequency of each trip is 30 minutes. This service began
in 2011 and has shown steady increases in ridership. - Route 3: service operates between Harborview (due to the dock being out of service the landing site is currently the Rusty Scupper) and
Harbor East. The frequency of this trip is every 15 minutes. This service began in November 2013.
050,000
100,000150,000200,000250,000
Harbor Connector Ridership
Figure 3-1: Harbor Connector Ridership by Year

Baltimore Water Transit Strategic Plan June 22, 2015
21
Figure 3-2: Harbor Connector Routes

Baltimore Water Transit Strategic Plan June 22, 2015
22
3.3 Harbor Connector Ridership and Analysis The HC has shown steady increase in ridership over its relatively short lifespan. The service was begun in 2010 with HC1 and soon followed in 2011 with HC2 and 2013 with HC3. Figure 3-3 presents the average daily ridership for the HC service. Overall average daily ridership has grown from 332 riders in 2012 to 835 riders in 2014. Each route has shown steady growth during the time period.
Figure 3-3: Harbor Connector Ridership 2012 to 2014
During December 2014 an on-off survey was conducted for every trip for a week. Passengers were counted when and where they boarded. This data was tabulated and analyzed. Figure 3-4 shows the HC riders by hours of the day for December 2014, while Table 3-1 presents the ridership and average cost per rider by time period.
332373
463
44114
176
0
81
197
375
569
835
0
100
200
300
400
500
600
700
800
900
2012 2013 2014
HC 1
HC 2
HC 3
Total

Baltimore Water Transit Strategic Plan June 22, 2015
23
Figure 3-4: Harbor Connector Riders by hour of the Day
Table 3-1: Harbor Connector – Ridership and Cost per Passenger Trip by Time Period
AM Peak Mid Day PM Peak Weekday Total Route To / From Riders Cost per
Passenger Trip
Riders Cost per Passenger
Trip
Riders Cost per Passenger
Trip
Riders Cost per Passenger
Trip HC1 Maritime Park to Locust Point 178 $ 1.09 84 $ 5.52 184 $ 1.06 446 $ 1.92
HC2 Canton Waterfront Park to Locust Point
68 $ 2.87 20 $ 23.31 62 $ 3.13 150 $ 5.71
HC3 Rusty Scupper to Harbor East 54 $ 3.62 27 $ 17.01 70 $ 2.78 151 $ 5.67
Total 299 $ 1.95 132 $ 10.60 315 $ 1.80 746 $ 3.40
Figures 3-5 and 3-6 present HC ridership by route and direction.
0100200
Harbor Connector Riders by Hour

Baltimore Water Transit Strategic Plan June 22, 2015
24
Figure 3-5: Harbor Connector – AM Peak Riders by Direction

Baltimore Water Transit Strategic Plan June 22, 2015
25
Figure 3-6: Harbor Connector – PM Peak Riders by Direction
3.4 Harbor Connector Financial
During 2014, the Harbor Connector operating costs were $602,949 plus fuel costs of $40,929 for total costs of $643,878. The proposed FY 2016 City Budget includes $663,408 for the Harbor Connector. Two boats in the Harbor Connector fleet, the Raven and the Oriole, were built with
Baltimore Water Transit Strategic Plan June 22, 2015
26
federal funds ($1.59 million) and the City has recently received a grant from the USDOT Ferry Boat Discretionary (FBD) Grant program administered by the FTA. This grant for $854,000, to be matched by $150,000 funding from the City of Baltimore, is to design and construct an electric powered water taxi with a capacity for 49 passengers and smart charging infrastructure. This U.S. Coast Guard inspected vessel will continue the City’s goal to provide clean, efficient, and environmentally friendly public transportation.
3.5 Comparison to other Ferry Operations
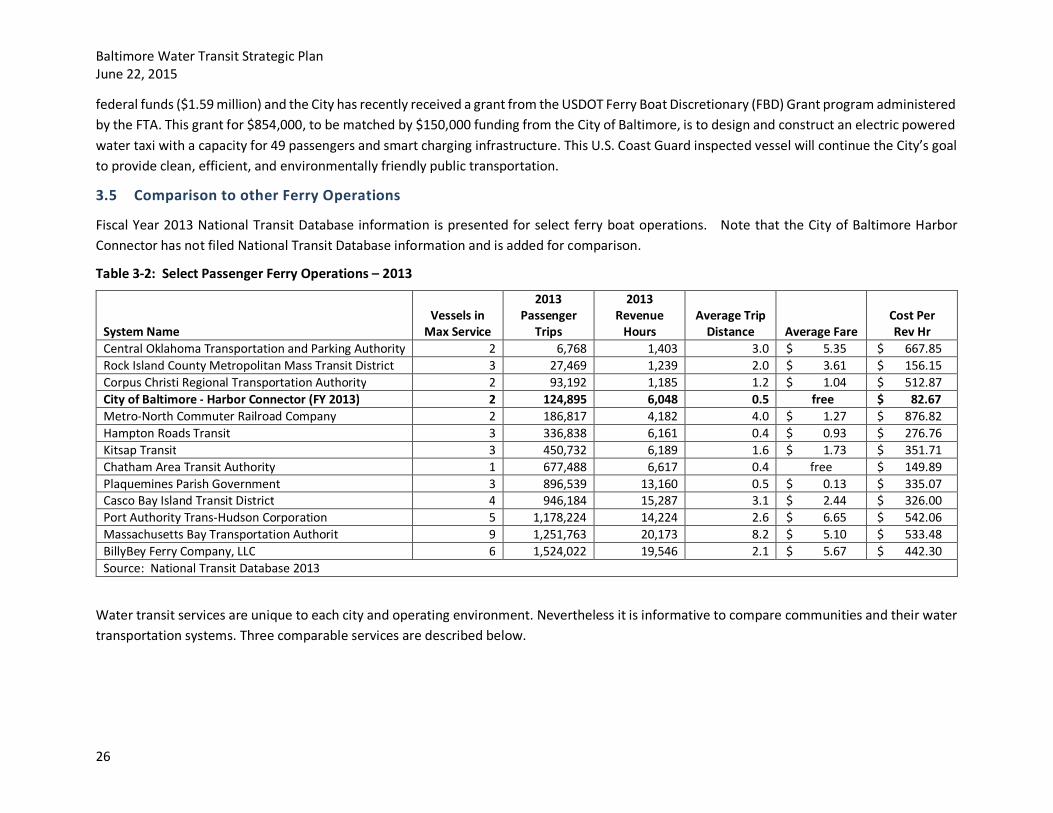
Fiscal Year 2013 National Transit Database information is presented for select ferry boat operations. Note that the City of Baltimore Harbor Connector has not filed National Transit Database information and is added for comparison.
Table 3-2: Select Passenger Ferry Operations – 2013
System Name Vessels in
Max Service
2013 Passenger
Trips
2013 Revenue
Hours Average Trip
Distance Average Fare Cost Per Rev Hr
Central Oklahoma Transportation and Parking Authority 2 6,768 1,403 3.0 $ 5.35 $ 667.85 Rock Island County Metropolitan Mass Transit District 3 27,469 1,239 2.0 $ 3.61 $ 156.15 Corpus Christi Regional Transportation Authority 2 93,192 1,185 1.2 $ 1.04 $ 512.87 City of Baltimore - Harbor Connector (FY 2013) 2 124,895 6,048 0.5 free $ 82.67 Metro-North Commuter Railroad Company 2 186,817 4,182 4.0 $ 1.27 $ 876.82 Hampton Roads Transit 3 336,838 6,161 0.4 $ 0.93 $ 276.76 Kitsap Transit 3 450,732 6,189 1.6 $ 1.73 $ 351.71 Chatham Area Transit Authority 1 677,488 6,617 0.4 free $ 149.89 Plaquemines Parish Government 3 896,539 13,160 0.5 $ 0.13 $ 335.07 Casco Bay Island Transit District 4 946,184 15,287 3.1 $ 2.44 $ 326.00 Port Authority Trans-Hudson Corporation 5 1,178,224 14,224 2.6 $ 6.65 $ 542.06 Massachusetts Bay Transportation Authorit 9 1,251,763 20,173 8.2 $ 5.10 $ 533.48 BillyBey Ferry Company, LLC 6 1,524,022 19,546 2.1 $ 5.67 $ 442.30 Source: National Transit Database 2013
Water transit services are unique to each city and operating environment. Nevertheless it is informative to compare communities and their water transportation systems. Three comparable services are described below.

Baltimore Water Transit Strategic Plan June 22, 2015
27
Savannah, Ga.—The Chatham Area Transit (CAT) operates two vessels across the Savannah River and a very heavy shipping lane. The free ferry service operates one route to downtown Savannah and connects with the free downtown bus circulator service. The average trip distance is 0.4 miles.
Hampton Roads, VA—The Hampton Roads Transit Authority (HRT) operates three vessels across the James River between Norfolk and Portsmouth, VA and charges an average fare of $.93 for the 0.4 mile trip.
Portland, ME – The Casco Bay Island Transit District operates a fleet of five ferry boats including one passenger / car ferry between Portland and the islands surrounding Casco Bay. The ferry service operates year round and charges an average fare of $2.44 per passenger for an average 3.1 mile trip.
3.6 Harbor Connector Observations and Recommendations
The HC service is quite popular and meets some of the expressed goals of the initial mission. Nonetheless, there are many areas in which the service could be improved and generate even more ridership. Challenges include:
- Potential customers are confused by the HC branding which cannot be easily distinguished from the Water Taxi.
- While the HC landings are generally different than the Water Taxi landings, the signs at each location are branded with the Water Taxi graphics. Graphics at each HC stop should clearly state the HC route and destination.
- The HC ridership is focused during the peak hours with little ridership during the mid-day period. - The connection to the CCC is not clearly identified at the HC landings or on the CCC buses. There is also no apparent connection to other
public transportation services. - There is no HC route to and from the downtown which is the largest employment concentration. - The vessels are not all weather and must suspend service during strong winds and winter weather.
Figure 3-7: Savannah Belles Ferry
Figure 3-8: Elizabeth River Ferry
Figure 3-9: Casco Bay Lines Ferry

Baltimore Water Transit Strategic Plan June 22, 2015
28
Overall, the HC service is popular with commuters and ridership is increasing. Fine tuning the current operation and expanding to other locations would increase commuter options and mobility. Section 6 provides an assessment of the expansion of HC services. Recommendations that will improve the sustainability for both the existing and expanded HC services include fare policy, branding, service reductions, service expansions and facility additions are classified below by time period.
Short-range (1 to 2 years) Recommendations:
A Request for Proposals for the Water Taxi / HC services should be issued. The City should request a NTD account and submit an NTD report for FY 2015. HC routes 2 and 3 should be modified to operate during peak periods only including the hours of 6:30 AM to 9:30 AM and 3:30 PM to 7:30
PM. The HC should be re-branded so that it is clearly an extension of the CCC. New signage and branding should be placed on each of the
vessels and at each HC landing. In preparation for the evaluation of a HC fare, a Title VI survey should be completed for HC riders. Attractive waiting shelters with good lighting should be constructed at each of the HC landings. Wayfinding signs should be improved to permit new riders to easily connect between the HC and CCC services. New signage and branding
should be placed on each of the vessels and at each HC landing. Employees of both services should be trained to guide customers between the CCC and HC routes.
The City should modify the height of the floats at HC landings so that they have the same deck height as the Oriole and Raven. This change, if implemented, will improve passenger safety and access by persons with disabilities. The railings on the Harbor Connector floats should be relocated away from the leading edge of the float so that approaching vessels cannot strike the railings.
During the negotiation of the next WT wharfage agreement, the City should seek to increase WT services during the fall, winter and spring seasons so that it becomes a regular service that is usable by Inner Harbor area residents. The multi-stop route shown on Figure 6-1 should be used as the basis for the negotiation.
Timed to coincide with the opening of Harbor Point offices, the City should add a fourth HC route (see Figure 6-2) from Canton Waterfront Park to Maritime Park / Harbor Point on a one-year trial basis. Harbor East businesses and transportation impact fees should provide funding for this service. The new HC electric powered vessel should be used in this service when available.
Using the BMC travel forecast model, the City should refine ridership and parking space estimates for future HC routes. The City should evaluate options for passenger ferry customer parking in the Locust Point / Riverside areas (see Figure 6-3).

Baltimore Water Transit Strategic Plan June 22, 2015
29
Mid-range (3 to 5 years) Recommendations:
A fare system should be implemented for HC routes. Suggested fares are $5 per day and $80 per month with monthly passes sold through employers (see Section 7-2).
The additional FTA funding that directly results from the NTD reporting should be secured through the Maryland Transit Administration (MTA).
The City should design and construct passenger ferry customer parking in the Locust Point / Riverside areas utilizing either city parking funds or Ferry Boat Discretionally funding (see Figure 6-3).
The City should evaluate options for passenger ferry parking in the Boston Street and S. Clinton Street area. The City should work with the developers of Harbor Point to construct a new Harbor Connector landing that replaces the Maritime Point
landing. The Harbor Point landing should have good connections with the CCC and other transit routes serving Harbor Point.
Long-range (5 to 10 years) Recommendations:
Utilizing Ferry Boat Discretionary grant funds, the City should acquire thee additional all weather passenger ferries. Passenger ferry customer parking (approximately 500 parking spaces) should be constructed using either city parking funds or Ferry Boat Discretionally funding in the Boston Street and S. Clinton St. area.
Upon completion of the additional Boston Street and S. Clinton Street area parking the HC Route 4 should be extended to Downtown (Harbor Place). Congestion Mitigation and Air Quality (CMAQ) funds should be sought to cover the first three years of operating cost for this new service.
The City should work with developers of Westport to identify parking and dock space that may be used for a long term passenger ferry service to Harbor Point. Note that dredging may be required and must be coordinated with other investments.
The Oriole and Raven should be replaced with vessels designed for all weather service. Standard amenities such as heat, comfortable seating and seaworthiness are needed to entice passengers to use the service year round.

Baltimore Water Transit Strategic Plan June 22, 2015
30
4 DOCKMASTER 4.1 Dockmaster Duties
The Dockmaster’s Office manages numerous marine activities in the Inner Harbor including public docking for transient boaters, infrastructure and operations of commercial vessels, and managing special events. This is done to ensure the safe and enjoyable use of the navigable waters of the Inner Harbor and to generate revenues necessary to maintain the waterfront infrastructure. Some of the Office’s specific functions include:
- Managing the public docking area - Contributing to planning and hosting special events - Collecting fees from boats docking against the West Wall and city piers in the Inner Harbor and Fells Point - Scheduling visiting ships and assisting the Sail Baltimore Program in welcoming and accommodating visiting vessels - Assisting in the oversight of docking by commercial vessels operating in the Inner Harbor
4.2 Dockmaster Operations
The Dockmaster’s Office manages docking facilities as shown in Figure 4-2. The locations are located some distance from the Dockmaster Office located at the Rusty Scupper. They include the Finger Piers, West Wall, Pier 3, Pier 4 and Pier 5. Figure 4-1 shows the number of transient dockings per month during 2014.
0200400
Transient Dockings per Month - 2014
Figure 4-1: Dockmaster Transient Dockings per Month - 2014

Baltimore Water Transit Strategic Plan June 22, 2015
31
Figure 4-2: Baltimore Dockmaster Docking Locations
Baltimore Water Transit Strategic Plan June 22, 2015
32
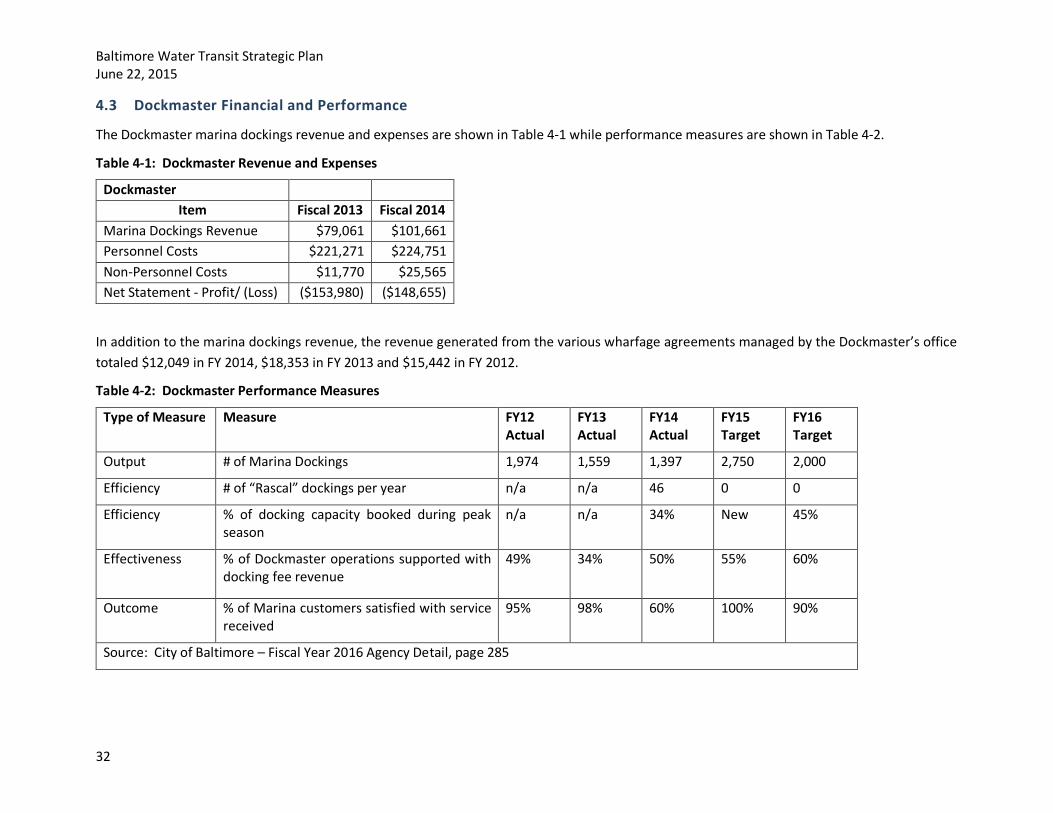
4.3 Dockmaster Financial and Performance
The Dockmaster marina dockings revenue and expenses are shown in Table 4-1 while performance measures are shown in Table 4-2.
Table 4-1: Dockmaster Revenue and Expenses
Dockmaster Item Fiscal 2013 Fiscal 2014
Marina Dockings Revenue $79,061 $101,661 Personnel Costs $221,271 $224,751 Non-Personnel Costs $11,770 $25,565 Net Statement - Profit/ (Loss) ($153,980) ($148,655)
In addition to the marina dockings revenue, the revenue generated from the various wharfage agreements managed by the Dockmaster’s office totaled $12,049 in FY 2014, $18,353 in FY 2013 and $15,442 in FY 2012.
Table 4-2: Dockmaster Performance Measures
Type of Measure Measure FY12 Actual
FY13 Actual
FY14 Actual
FY15 Target
FY16 Target
Output # of Marina Dockings 1,974 1,559 1,397 2,750 2,000
Efficiency # of “Rascal” dockings per year n/a n/a 46 0 0
Efficiency % of docking capacity booked during peak season
n/a n/a 34% New 45%
Effectiveness % of Dockmaster operations supported with docking fee revenue
49% 34% 50% 55% 60%
Outcome % of Marina customers satisfied with service received
95% 98% 60% 100% 90%
Source: City of Baltimore – Fiscal Year 2016 Agency Detail, page 285

Baltimore Water Transit Strategic Plan June 22, 2015
33
4.4 Dockmaster Observations and Recommendations
Marina operations are dynamic in every port. Baltimore has six marinas either in or near the Inner Harbor. The Dockmaster’s Office has unique areas it manages that present challenges including:
- Most of the transient boating space at the finger piers and along the West Wall is now utilized as berthing for vessels through wharfage agreements. There is limited space available for transient boaters.
- Along the locations managed by the Dockmaster there are a limited number of facilities such as ladders, planks, rub rails, shorepower and restroom facilities.
- There are no sailboat mooring locations within the Inner Harbor. - Six private marinas are located in or near the Inner Harbor. Some of the competing marinas accept on-line reservations, have full amenities
and are priced competitively with the Dockmaster’s rates. - There is no tender type water craft available to collect fees and service customers. Dockmaster staff use an old golf cart to traverse the
land side of the waterfront to request payment of fees from “rascal” boaters. - Dockmaster staff has difficulty collecting fees due to a lack of enforcement powers. - The Dockmaster’s operating hours are limited during the peak season. - There is a lack of technology to collect fees including no on-line reservations, no credit cards for payment either at the Dockmaster’s office
or by handheld device at the docking location and no kiosks for remote payment at the docking locations.
Two near term recommendations are:
- The Dockmaster’s office should utilize commercially available technology such as Square with City provided cell phones to collect fees. - The City should review the function of the Finger Piers and West Wall as berthing locations for the Baltimore Steamship, Seadog Ventures
and Spirit Cruises. If improvements are needed to accommodate these operations, they should be paid for by each operator.
In the longer term, the Dockmaster’s office should focus on scheduling docking locations for visiting ships and should no longer provide transient docking services.

Baltimore Water Transit Strategic Plan June 22, 2015
34
5 BALTIMORE WATER TRANSIT TRAVEL MARKET The Baltimore Water Transit travel market has two primary components: work trips and visitors trips. In order to quantify these markets, the US Census Bureau’s Longitudinal Employer-Household Dynamics (LEHD) data was used for work trips and the Visit Baltimore 2014 – 2015 Annual Report and Business Plan was reviewed for the visitor trip data.
The largest unserved potential HC work trip market is to Downtown. It is estimated that from Canton-Highlandtown, East Baltimore, and the north I-95 corridor there are 8,566 daily work trips to Downtown. From Southeast Baltimore, BWI and Anne Arundel County there are also an estimated 5,777 daily work trips to Downtown. This market is already served by the Central Light Rail. A second large underserved market is the work trip market to Harbor East. From the north I-95 corridor there are 2,702 daily work trips to Harbor East and from Southeast Baltimore, BWI and Anne Arundel County areas there are 1,163 daily work trips to Harbor East. For the HC to be successful in attracting additional users to the Downtown and Harbor East markets, commuter parking areas must be convenient to I-95 and the ferry ride must be time competitive with driving times.
5.1 Work Trip Market Analysis
The Baltimore water transit work trip travel market was analyzed by the subarea geography shown in Figures 5-1, 5-2 and 5-3. The areas were generated by aggregating the Baltimore Metropolitan Commission (BMC) regional transportation model traffic analysis zones into larger travel demand districts. Districts are a smaller geographic area within the city core and grow in size with distance from the city core.

Baltimore Water Transit Strategic Plan June 22, 2015
35
Figure 5-1: Travel Demand Districts – Regional
Note: The colors in this graphic are intended to differentiate the individual districts and do not have any other significance.

Baltimore Water Transit Strategic Plan June 22, 2015
36
Figure 5-2: Travel Demand Districts—City of Baltimore
Note: The colors in this graphic are intended to differentiate the individual districts and do not have any other significance.

Baltimore Water Transit Strategic Plan June 22, 2015
37
Figure 5-3: Travel Demand Districts – City Core
Note: The colors in this graphic are intended to differentiate the individual districts and do not have any other significance.

Baltimore Water Transit Strategic Plan June 22, 2015
38
The U.S. Census Bureau’s Longitudinal Employer-Household Dynamics (LEHD) data were aggregated according to the subarea geography to better understand commuter travel characteristics and market potential for additional water transit in Baltimore. The LEHD data1 provide information about the home and work locations for a worker’s “primary job” in 2011.
This analysis focused on work trips originating in any district in the study area with destinations in one of the city core districts shown in Figure 5-3. Although water transit could serve work trips that originate in locations external to the study area (Pennsylvania or Eastern Shore for example) the numbers of these external trips are expected to be relatively small. Table 5-1 presents the work trip matrix for trips with destinations in the city and origins across the study area. The city core areas are highlighted.
Figures 5-4, 5-5 and 5-6 present data for the geographic areas most likely to use water transit for work trips including the North I-95 corridor, BWI and Anne Arundel County, and Riverside / Locust Point.
1 LEHD program combines federal, state, and Census Bureau data on employers and employees under the Local Employment Dynamics (LED) Partnership. Through the LED Partnership, states share Unemployment Insurance earnings data and the Quarterly Census of Employment and Wages data with the Census Bureau. The data produced for the LEHD program is generated, partially synthetically, from these numerous sources and does not account for self-employed or certain military workers, nor does it necessarily factor in secondary or other work locations.

Baltimore Water Transit Strategic Plan June 22, 2015
39
Table 5-1: Estimates of home-based work trips to Baltimore City, 2011 Work Trip Matrix WORK (Destination)
Baltimore Work Trip Matrix using US Census LEHD Data 2011 1 2 3 4 5 6 7 8 9 10 11 12
Home Zone Area
Total Origin
Northwest Baltimore
Northeast Baltimore
West Baltimore
Mt. Vernon
Pigtown / Barre Circle
Southeast Baltimore
Riverside / Locust
Point Downtown Harbor
East Hopkins
Canton / High-
landtown East
Baltimore
HO
ME
(Orig
in)
1 Northwest Baltimore 27,479 8,672 2,178 1,342 1,439 1,972 626 489 5,302 909 3,114 664 772
2 Northeast Baltimore 29,546 6,203 4,534 1,255 1,226 1,792 851 556 5,866 856 3,563 1,299 1,545
3 West Baltimore 13,921 2,755 1,043 1,917 619 1,137 491 271 2,700 356 1,104 450 1,078
4 Mt. Vernon 3,942 749 243 179 441 356 79 99 886 195 492 105 118
5 Pigtown / Barre Circle 2,035 304 132 159 96 396 72 80 482 66 138 64 46
6 Southeast Baltimore 3,412 541 235 369 148 331 492 153 628 76 218 101 120
7 Riverside / Locust Point 4,039 452 131 162 135 529 131 467 1,118 307 331 75 201
8 Downtown 1,498 166 45 38 105 304 14 37 424 99 195 29 42
9 Harbor East 3,594 429 166 95 124 326 66 147 709 647 543 167 175
10 Hopkins 3,407 661 310 175 138 235 94 76 670 140 577 178 153
11 Canton / Highlandtown 8,240 1,227 590 328 295 504 226 260 1,643 651 1,035 882 599
12 East Baltimore 1,793 159 110 240 50 91 56 44 226 153 137 189 338
13 Towson / Hunt Valley 20,600 4,869 1,787 717 990 1,604 416 506 4,422 1,145 2,601 622 921
14 Randallstown / Owings Mills 26,503 7,173 2,025 1,558 1,294 2,128 647 460 6,021 991 2,732 619 855
15 White Marsh / Essex 38,673 6,276 4,157 1,486 1,361 2,537 1,773 1,009 7,416 1,876 3,850 2,194 4,738
16 Catonsville / Security
Square 11,263 1,906 739 1,436 493 1,229 493 402 2,304 473 946 328 514
17 BWI 5,211 599 276 518 204 529 670 228 1,099 212 297 185 394
18 Anne Arundel County 16,595 1,933 823 1,190 868 1,879 1,310 708 4,050 875 1,279 549 1,131
19 Howard County 15,828 2,400 673 1,259 737 2,343 538 443 3,617 973 1,615 443 787
20 Prince George's County / Montgomery County 16,160 2,791 1,096 1,074 734 1,393 1,444 482 3,932 1,043 970 457 744
21 Carroll County 6,158 1,561 371 504 262 489 226 122 1,464 280 474 147 258
22 Frederick County 2,287 423 162 202 122 193 69 86 588 117 115 63 147
23 Harford County 14,206 2,088 1,433 477 557 1,089 596 429 3,319 634 1,451 642 1,491
24 Cecil County 1,357 147 140 38 73 119 97 39 336 39 86 62 181
25 District of Columbia 1,769 275 116 80 81 139 253 57 424 113 130 35 66
Total 279,516 54,759 23,515 16,798 12,592 23,644 11,730 7,650 59,646 13,226 27,993 10,549 17,414
*Data from US Census, LEHD On The Map: 2011 Primary Jobs

Baltimore Water Transit Strategic Plan June 22, 2015
40
Figure 5-4: Work trips from North I-95 Corridor to Harbor East, Downtown, Riverside/Locust Point districts

Baltimore Water Transit Strategic Plan June 22, 2015
41
Figure 5-5: Work trips from BWI and Anne Arundel to Downtown, Harbor East, and Hopkins districts

Baltimore Water Transit Strategic Plan June 22, 2015
42
Figure 5-6: Work trips from Riverside / Locust Point to Harbor East, Hopkins, and Canton / Highlandtown districts

Baltimore Water Transit Strategic Plan June 22, 2015
43
5.2 Visitor Travel
The Water Taxi primarily serves Inner Harbor visitors. In order to evaluate the visitor market for Water Taxi trips, the Visit Baltimore 2014 – 2015 Annual Report and Business Plan has been reviewed. Excerpts from the Appendix A: Baltimore Visitor Profile are shown in Tables 5-2 through 5-5.
Table 5-2: Baltimore Visitors Children and Adults
Type of Visitor Day Visitors Overnight Visitors
Age Classification Number of Visitors
% of Day Visitors
Number of Visitors
% of Overnight Visitors
Children 3,300,000 24% 2,200,000 21%
Adults 10,600,000 76% 7,800,000 79%
Total 13,900,000 100% 10,000,000 100%
Source: Visit Baltimore 2014 – 2015 Annual Report and Business Plan – Appendix A – Longwoods International as of 2013
Table 5-3: Baltimore Visitors by Trip Purpose
Type of Visitor Day Visitors Overnight Visitors
Trip Purpose Number of Visitors
% of Day Visitors
Number of Visitors
% of Overnight Visitors
Visit Friends and Relatives 5,560,000 40% 4,900,000 49%
Leisure 6,950,000 50% 3,300,000 33%
Business 1,251,000 9% 1,500,000 15%
Business & Leisure 139,000 1% 300,000 3%
Total 13,900,000 100% 10,000,000 100%
Source: Visit Baltimore 2014 – 2015 Annual Report and Business Plan – Appendix A – Longwoods International as of 2013

Baltimore Water Transit Strategic Plan June 22, 2015
44
Table 5-4: Season of Trips
Type of Visitor Day Visitors Overnight Visitors
Trip Season Number of Visitors
% of Day Visitors
Number of Visitors
% of Overnight Visitors
January – March 3,336,000 24% 2,300,000 23%
April –June 3,475,000 25% 2,700,000 27%
July – September 3,892,000 28% 2,800,000 28%
October - December 3,197,000 23% 2,200,000 22%
Total 13,900,000 100% 10,000,000 100%
Source: Visit Baltimore 2014 – 2015 Annual Report and Business Plan – Appendix A – Longwoods International as of 2013
Table 5-5: Activity Participation
Activity Participation % of Day Visitors % of Overnight Visitors
Shopping 28% 39%
Fine Dining 18% 23%
Museum 17% 20%
Landmark / Historic 13% 17%
Waterfront 10% 11%
Night Life 7% 14%
Source: Visit Baltimore 2014 – 2015 Annual Report and Business Plan – Appendix A – Longwoods International as of 2013

Baltimore Water Transit Strategic Plan June 22, 2015
45
In estimating the Water Transit market share for the visitor market, the following factors have been considered:
Business travelers are not likely to use the Water Taxi Water Taxi usage is very seasonal with ridership primarily in the April through October period Ten (10) to eleven (11) percent of all visitors participate in waterfront activities
With these factors considered, it is estimated that there are approximately 1.2 million visitors to the Baltimore Waterfront during the period April through October who could use the Water Taxi services. Considering Water Taxi 2014 ridership of 202,069 approximately one out of six visitors to the Inner Harbor use the Water Taxi.
6 ASSESSMENT OF WATER TRANSIT SERVICE EXPANSION
Baltimore’s water transit services cater to three distinct groups: Visitors, Inner Harbor Residents and Commuters. Visitors use the Baltimore Water Taxi both to navigate the Inner Harbor to various attractions and as an attraction itself; enjoying a boat ride and seeing the City from the water. Inner Harbor residents primarily use the HC for home based work trips. Other Inner Harbor resident trip types including shopping and recreation are not well served by the existing WT and HC services. Commuters use the HC as a cross harbor link. Some drive to the Locust Point or Canton Waterfront Park and use the HC to reach their jobs. It is anticipated that other sites could be developed further from downtown and near the interstates where park and ride lots could be built and ferry services developed to transport a larger number of commuter trips. These three markets are examined in the following section to identify opportunities for water transit service expansion.
6.1 Visitor Market
The Visitor Market is primarily the responsibility of the private operator through the Water Taxi Wharfage Agreement. However, increased WT utilization can improve the visitor experience and lead to greater visitor spending. Recommendations are offered in three areas: year round service, fare policy and marketing.
6.1.1 Year Round Service During the five month period November through March the WT service operates very limited service with only one boat in operation. This level of service is not likely to encourage many visitors or residents to ride the WT and extend their stay near the waterfront. During the negotiation of the next wharfage agreement, the City should negotiate with the private operator to offer a higher level of service during the November through March period.

Baltimore Water Transit Strategic Plan June 22, 2015
46
6.1.1 Fare Policy Table 6-1: Water Taxi Fare Products - 2015
In comparison to the other attractions in Baltimore and water taxi services in other localities, the Baltimore Water Taxi fares appear to be reasonable for visitors. Table 6-1 presents the WT current fee structure. For residents and those visiting with friends and family, a monthly frequent floater pass could prove attractive. It is also recommended that an All Day Family Pass could prove to be popular. An All-Day Family pass for $35.00 would attract more ridership. Instituting an All Day Senior Pass priced at $12.00 could also be popular.
6.1.2 Marketing The operator of the Baltimore Water Taxi has developed a brand that is consistent across the vessels, landings, promotional materials and website. The private operator should consider refining the brand so that it presents the service as an attraction rather than a means of transportation. The private operator with assistance from the City should also enter into joint agreements with other major attractions so that a Water Taxi Family Day Pass might be sold along with the Family Tickets purchased at major attractions—“Visit the Aquarium and enjoy a Boat Ride for the Very Best View of Baltimore!”
6.2 Inner Harbor Residents
As presented in Table 6-2, from 2000 through 2010, the number of Inner Harbor residents grew by 16 percent to 44,866 persons. Based upon ongoing residential construction in the Downtown, Harbor Point and other in-town areas, this trend appears to be continuing. The Water Taxi Operator and the City should consider water transit services that cater to this growing population.
Table 6-2: Inner Harbor Population
Fare Product Rate Adult All Day Ticket $14 Adult One-Way Ticket $ 8 Children’s Ticket $ 7 Annual Individual Pass $150 Annual Buddy Pass $200 Family Pass $250
Inner Harbor Neighborhood 2000 2010 Change % Change Federal Hill / Locust Point 13,760 14,501 741 5% Downtown / Inner Harbor 4,843 8,121 3,278 68% Fells Point / Canton 20,215 22,244 2,029 10% Inner Harbor Area Total 38,818 44,866 6,048 16% Source: US Census 2010

Baltimore Water Transit Strategic Plan June 22, 2015
47
6.2.1 Inner Harbor Resident Water Transit Services The existing WT services are designed primarily for the visitor market and the HC services are designed for peak period work trips. Additionally, the WT service has limited services during the months of October through April. To meet the needs of the growing Inner Harbor population, a year-round seven days a week multi-landing WT route is recommended. During weekdays the service should operate during the mid-day and evenings until 11 PM and weekend service should be from 10 AM until 11 PM. The recommended routing includes landings at Harbor Place, Harbor View, Harbor Point, Locust Point and Boston Street Pier Park (Figure 6-1). The service will require two vessels to maintain 40 minute headways(the time between boat trips). Assuming 18 revenue hours per weekday, and 26 revenue hours per weekend day, the service would require 3,640 annual revenue hours. Assuming a $100 per revenue hour operating expense the service would cost $364,000 annually. This service should be operated as a WT route with regular WT fares except that the proposed HC fare products including the day and monthly passes should be accepted. Provision for this service should be negotiated in the upcoming WT wharfage agreement.
6.2.1 Boston Street Pier Park Landing The Boston Street Pier Park has many advantages as both a destination and departure site. The area itself is attractive, secure and the home to a substantial number of residential units. With coffee shops, eating establishments, a grocery store and other attractions, it could be a popular destination for those travelling across the harbor. With some improvements, a boat landing could be developed in this area.
6.2.2 Resident Fare Policy High daily ticket prices and the current price of the Frequent Floater Pass at $200 are impediments to residents using the WT. Baltimore Water Taxi should consider offering a monthly pass at $50 per month and a quarterly pass at $100 per quarter. If prices are charged on the HC joint fare products should be considered.

Baltimore Water Transit Strategic Plan June 22, 2015
48
Figure 6-1: Multi-stop Passenger Ferry Service

Baltimore Water Transit Strategic Plan June 22, 2015
49
6.3 Commuter Market
As described in the following subsections, potential services have been identified for travel markets north and south of the Inner Harbor. Estimated work trips have been estimated using the US Census LEHD data, automobile travel times have been estimated using google maps, and water travel times have been estimated assuming a 6 miles per hour Inner Harbor speed limit. For each market there may be multiple automobile routes so that the estimates should be considered as representative.
6.3.1 Travel Markets North of the Inner Harbor The travel market analysis from Section 5 (Figure 5-4) shows strong work trip demand from the I-95 north corridor to Downtown with 8,566 work trips and to Harbor East with 2,702 work trips. Travel from Downtown and Harbor East along Boston Street or Eastern Avenue to the I-95 corridor is often heavily delayed during the afternoon peak hours. Potential ferry service routing for this corridor is shown in Figure 6-2. Table 6-3 compares the estimated work trips, automobile travel times, and passenger ferry travel times.
With heavy and unpredictable traffic along the East Baltimore arterials leading to I-95 north, a year round all weather passenger ferry service may attract substantial ridership. A ferry service in this corridor could supplement the proposed Red Line Light Rail and could help to mitigate traffic delays during the Red Line’s construction. An adequate supply of parking and easy access from I-95 north will be critical for the success of the service.
Considering the number of work trips to both Downtown and Harbor East / Harbor Point daily demand has been preliminarily estimated to be 500 commuters (1,000 daily trips). Ridership forecasts utilizing the BMC travel demand forecasting model should be undertaken to refine this estimate before developing plans for parking facilities. Another way to test the demand is to start with a peak hour only passenger ferry service from the Canton Waterfront Park to Maritime Park/Harbor Place. Utilizing the existing Canton Waterfront Park parking, this service could be in place before the opening of the Harbor Point offices.
As project planning is undertaken, three options for the expanded parking should be considered:
1. Expand parking at Canton Waterfront Park. While this property is owned by the City it may not be available because it may have been improved with federal or state funds through the Fish and Wildlife Service Boating Infrastructure Grant Program. The Canton Waterfront Park’s status as a park may also restrict the use of federal funds for transportation improvements. The Canton Waterfront Park is classified as a 4(f) property. As stated in federal transportation legislation, Section 4(f) protects the publicly owned park and recreation areas that are open to the general public, publicly owned wildlife and waterfowl refuges, and public or privately owned historic sites. Section 4(f) protected property may not be used for federal transportation projects unless no other reasonable and feasible alternative can be identified.

Baltimore Water Transit Strategic Plan June 22, 2015
50
2. Existing parking lots near the corner of S. Clinton and Boston. These properties are prime locations for waterfront development as part of Canton Crossing Phase II. It may be possible to consider a joint parking structure.
3. Develop a parking structure near 1700 – 1800 Clinton Street.
Figure 6-2: Harbor Connector Alternative Route – S. Clinton Street to Harbor Point and Downtown

Baltimore Water Transit Strategic Plan June 22, 2015
51
Table 6-3: Downtown / Harbor East to I-95 North Travel Market Analysis
Market Work Trips Start End Distance Auto Travel Time Water Travel Time
Downtown to I-95 North 8,566 Pratt at Light Boston and S. Clinton 4.4 miles 16 to 35 minutes 30 minutes
Harbor East to I-95 North
2,702 Aliceanna and S. President
Boston and S. Clinton 2.0 miles 8 to 18 minutes 18 minutes
6.3.2 Travel Markets South of the Inner Harbor The travel market analysis from Section 5 (Figure 5-5 and 5-6) shows work trip demand from the south of the Inner Harbor. Four alternatives have been evaluated for expanding water transit services including:
- Adding a parking facility for the Locust Point or Riverside area to support the existing Harbor Connector routes, - Developing a new ferry service from Westport to Harbor Point including new parking facilities and ferry boat landing, - Establishing a new ferry service from Cherry Hill by acquiring parking from the Cherry Hill Medstar Hospital and constructing a new landing, - Utilizing existing parking and docks at Fort Armistead Park to establish a longer distance ferry operation.
6.3.2.1 Locust Point / Riverside Parking Facility Ridership on HC 1 has continued to grow (see Figure 3-3) reaching 463 average daily boardings during fiscal year 2014. The short trip distance across the Patapsco River which requires approximately five minutes of water travel time has contributed to the popularity of the service. From trip by trip counts, it is estimated that there are up to 200 daily commuters using the Locust Point and Harbor View landings each morning. Based upon conversations with frequent riders, it is estimated that half of these daily commuters drive a vehicle to the landings resulting in congested on-street parking becoming a problem for the Locust Point and Riverside neighborhoods. Considering additional employment at Harbor Point in the near future, the number of commuters driving a vehicle to the Locust Point and Riverside landings can be expected to continue to increase.
An off-street parking facility with a minimum of 200 parking spaces and good access to I-95 and Key Highway should be obtained near either the Locust Point or Harbor View landings. The two locations that should be considered for this off-street parking facility are shown in Figure 6-3. It may be possible to incorporate passenger ferry customer parking along with other redevelopment of the Fire Department Repair Facility. The Locust Point area shown on the map is currently leased by Under Armour for parking and could be the site of a joint use parking facility. If off-street parking is constructed, the City should offer a combined parking and HC monthly pass that is comparably priced with Harbor East parking.

Baltimore Water Transit Strategic Plan June 22, 2015
52
Figure 6-3: Potential Parking Locations – Locust Point and Federal Hill

Baltimore Water Transit Strategic Plan June 22, 2015
53
6.3.2.2 Westport As a means of improving access to Harbor East / Harbor Place and reducing the number of vehicles that use Pratt and Lombard Streets a Westport to Harbor Place passenger ferry has been considered as shown in Figures 6-4 and 6-5 and Table 6-4.
A Westport location would offer convenient access to I-295 and the Central Light Rail and the Westport neighborhood with a 2010 population of 1,593 persons. For a passenger ferry service operating every 30 minutes, three all-weather ferry vessels and up to 250 parking spaces would be required. Estimated costs are three vessels $4.5 million ($1.5 million each); 250 parking spaces $3.75 million ($15,000 each); and, ferry landing $200,000. Because of shallow waters, dredging may also be required. Along with coordination with potential development, additional studies will be required to refine the parking space estimate and determine the extent of dredging that would be required for passenger ferry operations. Operating costs are estimated to be $468,000 annually for a Westport to Harbor Place peak period only ferry service.
While the Westport facility would offer convenient access, the water travel time at 40 minutes is longer than the worst auto travel times. Because shorter combined travel times are possible using the existing Locust Point and Harbor View passenger ferries, a Westport facility should be a long term option that would be considered only after Locust Point and Riverside parking facilities have been developed.
Table 6-4: Harbor East to Westport Travel Market Analysis
Market Work Trips Start End Distance Auto Travel Time Water Travel Time
Harbor East to I-95 South
1,163 800 S. Caroline Street Westport 4.3 miles 16 to 35 minutes 40 minutes
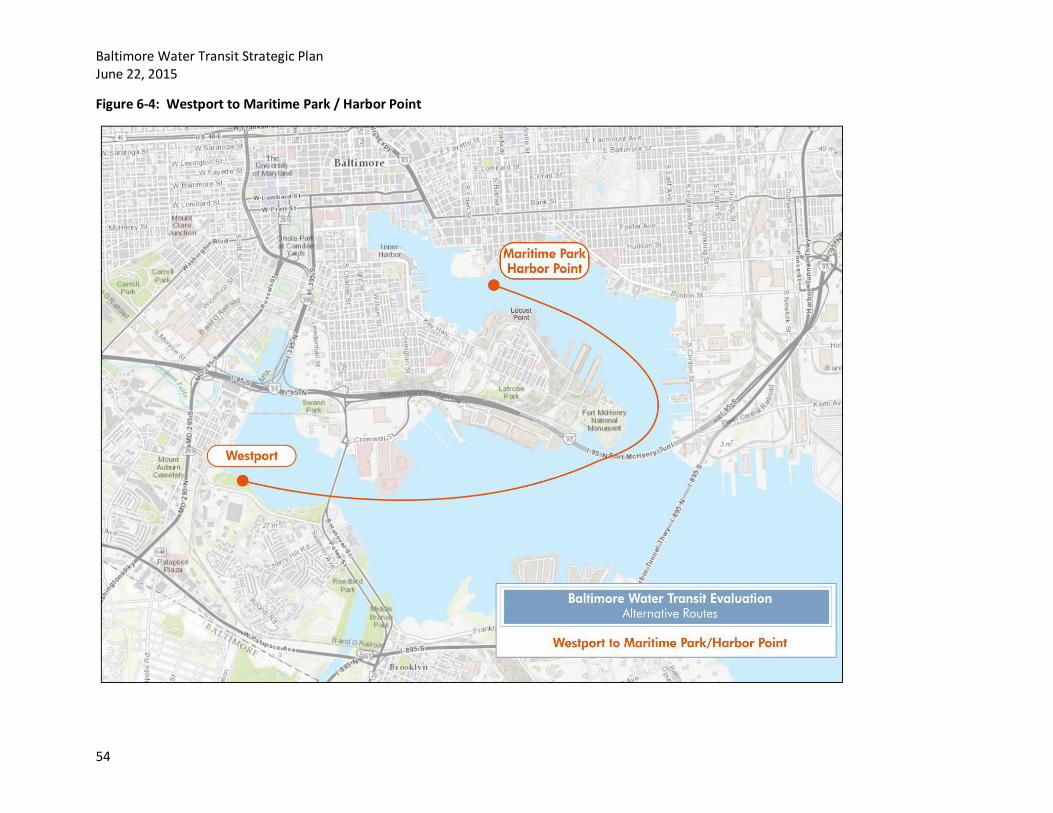
Baltimore Water Transit Strategic Plan June 22, 2015
54
Figure 6-4: Westport to Maritime Park / Harbor Point
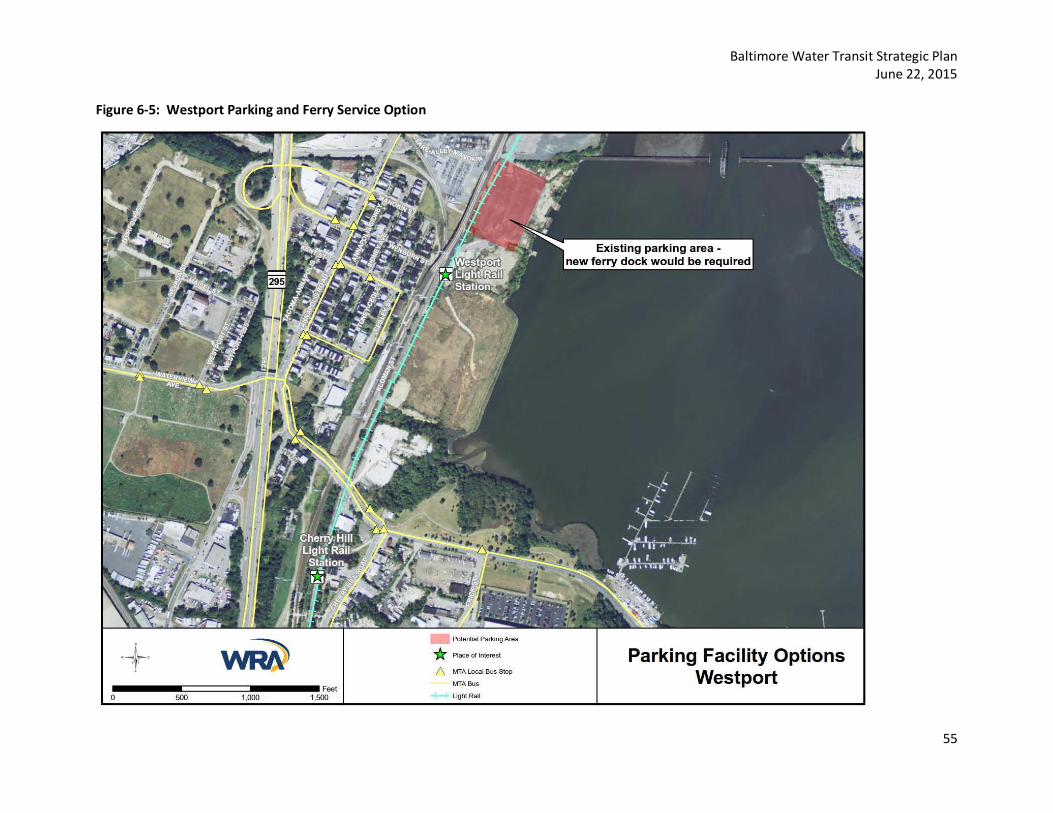
Baltimore Water Transit Strategic Plan June 22, 2015
55
Figure 6-5: Westport Parking and Ferry Service Option
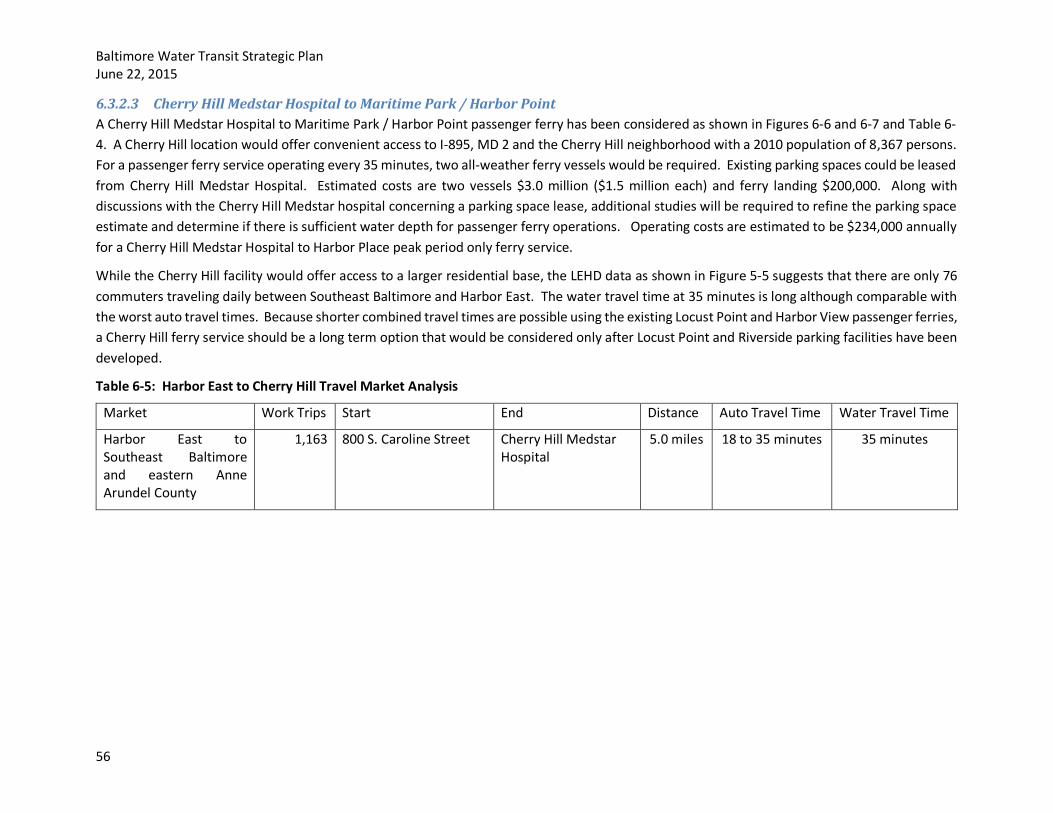
Baltimore Water Transit Strategic Plan June 22, 2015
56
6.3.2.3 Cherry Hill Medstar Hospital to Maritime Park / Harbor Point A Cherry Hill Medstar Hospital to Maritime Park / Harbor Point passenger ferry has been considered as shown in Figures 6-6 and 6-7 and Table 6-4. A Cherry Hill location would offer convenient access to I-895, MD 2 and the Cherry Hill neighborhood with a 2010 population of 8,367 persons. For a passenger ferry service operating every 35 minutes, two all-weather ferry vessels would be required. Existing parking spaces could be leased from Cherry Hill Medstar Hospital. Estimated costs are two vessels $3.0 million ($1.5 million each) and ferry landing $200,000. Along with discussions with the Cherry Hill Medstar hospital concerning a parking space lease, additional studies will be required to refine the parking space estimate and determine if there is sufficient water depth for passenger ferry operations. Operating costs are estimated to be $234,000 annually for a Cherry Hill Medstar Hospital to Harbor Place peak period only ferry service.
While the Cherry Hill facility would offer access to a larger residential base, the LEHD data as shown in Figure 5-5 suggests that there are only 76 commuters traveling daily between Southeast Baltimore and Harbor East. The water travel time at 35 minutes is long although comparable with the worst auto travel times. Because shorter combined travel times are possible using the existing Locust Point and Harbor View passenger ferries, a Cherry Hill ferry service should be a long term option that would be considered only after Locust Point and Riverside parking facilities have been developed.
Table 6-5: Harbor East to Cherry Hill Travel Market Analysis
Market Work Trips Start End Distance Auto Travel Time Water Travel Time
Harbor East to Southeast Baltimore and eastern Anne Arundel County
1,163 800 S. Caroline Street Cherry Hill Medstar Hospital
5.0 miles 18 to 35 minutes 35 minutes

Baltimore Water Transit Strategic Plan June 22, 2015
57
Figure 6-6: Cherry Hill to Maritime Park / Harbor Point

Baltimore Water Transit Strategic Plan June 22, 2015
58
Figure 6-7: Cherry Hill Medstar Hospital Parking and Ferry Service Option

Baltimore Water Transit Strategic Plan June 22, 2015
59
6.3.2.4 Fort Armistead to Maritime Park / Harbor Point A Fort Armistead to Maritime Park / Harbor Point passenger ferry has been considered as shown in Figures 6-8 and 6-9 and Table 6-6.
A Fort Armistead location in the City of Baltimore would offer access to the eastern side of I-695 and eastern Anne Arundel County. While the site would offer existing water access and parking, there is little residential population near Fort Armistead. For a passenger ferry service operating every 45 minutes, two all-weather ferry vessels would be required. Existing parking spaces should be sufficient. Estimated costs are two vessels $3.0 million ($1.5 million each) and ferry landing improvements $50,000. Along with discussions with the Department of Parks and Recreation concerning the use of the parking spaces additional studies will be required to refine the ridership forecast. Operating costs are estimated to be $234,000 annually for a Fort Armistead to Maritime Park / Harbor Point peak period only ferry service.
While the Fort Armistead Park would offer existing parking and docking facilities, there is little work trip demand between the area and Harbor East. The water travel time at 46 minutes is shorter than the worst auto travel times. Because there is a greater market and shorter combined travel times are possible using the existing Locust Point and Harbor View passenger ferries, a Fort Armistead ferry service should not be developed.
Table 6-6: Harbor East to Fort Armistead Travel Market Analysis
Market Work Trips Start End Distance Auto Travel Time Water Travel Time
Harbor East to eastern Anne Arundel County
Less than 875
800 S. Caroline Street Fort Armistead 15.3 miles
28 to 50 minutes 46 minutes
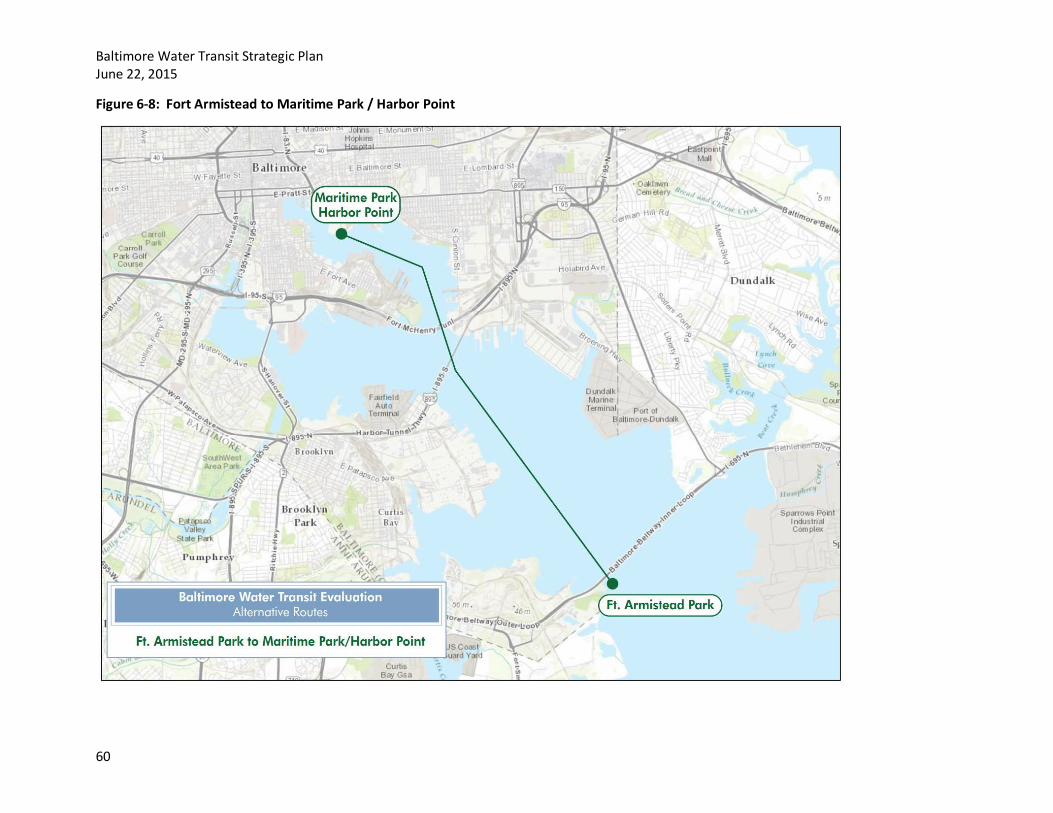
Baltimore Water Transit Strategic Plan June 22, 2015
60
Figure 6-8: Fort Armistead to Maritime Park / Harbor Point

Baltimore Water Transit Strategic Plan June 22, 2015
61
Figure 6-9: Fort Armistead Parking and Ferry Service Options

Baltimore Water Transit Strategic Plan June 22, 2015
62
7 WATER TRANSIT STRATEGIC F INANCIAL PLAN
This section describes federal funding programs that are available for the Baltimore Water Transit Program, fare policies, operating and capital costs and a consolidated financial plan. The operating and capital costs presented in this section are intended to be high level estimates. Site selection for proposed capital improvements has not been undertaken and engineering feasibility must be completed before developing project and grant application budgets. Operating costs are also expected to change with the new WT wharfage agreement.
7.1 Federal Grant Programs
Federal transportation grant programs through the FTA and the FHWA are available to fund the public transportation services that are open to the general public. Federal requirements come with the use of federal funds such as procurement regulations, civil rights, NTD reporting and drug and alcohol testing. Compliance with FTA regulations requires staff expertise and time. While other programs may also be used, four federal programs may have applicability to Baltimore’s passenger ferry services.
7.1.1 FHWA Ferry Boat Program Beginning with MAP-21(Moving Ahead for Progress in the 21st Century), the FHWA Ferry Boat Program provides up to 80% federal funding for the construction of ferry boats and ferry boat terminals. Eligibility is limited to public ferries and private services where the fares charged for passage on the ferry are under the control of the State or other public entity. FHWA distributes funding to eligible entities based on the number of passengers carried (20 percent), vehicles carried (45 percent), and total route miles (35 percent). Eligible entities are determined in accordance with 23 U.S.C. 129(c). The formula is applied using the latest data collected in the National Census of Ferry Operators (NCFO) as implemented by the Bureau of Transportation Statistics (BTS). The BTS NCFO Data Query Tool found at http://www.ncfodatabase.bts.gov/ncfodb/NCFO_DQ.jsp. does not list either the Baltimore Water Taxi or the Harbor Connector as operators. During FY 2014 other similar passenger operators receiving FHWA Ferry Boat Program funding included the Savannah Belle Ferry $58,529 and Hampton Roads Transit $52,369.
The FHWA Ferry Boat Program funds flow through the State Departments of Transportation and are subject to the annual authorization levels set for each state. It is recommended that the City of Baltimore work with the State Highway Administration to determine eligibility and provide the data necessary to the BTS.
7.1.2 FTA Passenger Ferry Grant Program Under MAP-21, FTA’s Passenger Ferry Grant Program was authorized to provide competitive funding to public ferry systems in urbanized areas. Funds are awarded based on factors such as the age and condition of existing ferry boats, terminals and related infrastructure; benefits to riders, such as increased reliability; project readiness; and connectivity to other modes of transportation. FTA’s Passenger Ferry Grant Program provides up to 80% federal funding for ferry boat capital expenditures. During FY 2014, 25 ferry boat projects were awarded grant funds totaling nearly

Baltimore Water Transit Strategic Plan June 22, 2015
63
$60 million including the City of Baltimore’s recent submission for an all-electric powered ferry and smart charging station. The largest grants awarded during FY 2014 were $6 million.
7.1.1 FTA 5307 and 5339 Formula Program The FTA’s 5307 and 5339 formula programs are intended to distribute federal funding for transit systems generally at 80% federal participation. These funds can be used for transit capital, maintenance and planning activities. Transit capital is broadly defined and can include capital cost of contracting where payments are made to private contractors for equipment or facility expenses. The 5307 program distributes funding based upon a formula that includes population, population density, revenue vehicle miles, passenger miles, fixed guideway miles and fixed guideway revenue vehicle miles. The most recent US census establishes the population and population density values while the reports made by transit operators through the NTD provide the operating data used in the formula calculations.
The HC and WT services as public services sponsored by the City of Baltimore and may qualify for funding through the FTA’s 5307 and 5339 programs. For the NTD reporting the water transit services are considered fixed guideways. Table 7-1 estimates the amount of additional funding that would accrue to the State of Maryland if NTD reports were filed for the HC. Baltimore Water Taxi data was not available for this estimate but if reported would add to these values.
Table 7-1: Harbor Connector Estimate of Annual FTA Formula Funding
FTA Program Factor Estimated FY 15 Data
FY 14 Formula Rates Estimated Annual FTA Formula Funding
5307
Revenue Vehicle Miles 16,683 $0.4199683 $7,006 Fixed Guideway Route Miles 3.8 $38,736 $147,197
Fixed Guideway Revenue Vehicle Miles 16,683 $0.6373891 $10,634
5339 Revenue Vehicle Miles 16,683 $.0521291 $870
Total $165,706
The FY 2015 FTA formula funding is based upon data that was reported in FY 2013 and rates that are set through the annual appropriations process. The 5307 formula rates have been relatively consistent over time. Each year the FTA formula funding allocations are distributed to the designated recipient for each urbanized area. In the Baltimore area the designated recipient is the MTA. Consequently, if the City of Baltimore were to file FY 2015 NTD reports for the HC, an estimated $165,000 in additional FTA formula funding would be available to the MTA. It is up to the designated

Baltimore Water Transit Strategic Plan June 22, 2015
64
recipient to determine the distribution of the 5307 / 5339 funds, but many urbanized areas, such as Atlanta for example, distribute the FTA formula funds to grantees based upon the federal formula.
7.1.2 Congestion Mitigation and Air Quality The Baltimore Regional Transportation Board’s (BRTB) Congestion Mitigation and Air Quality (CMAQ) Improvement Program seeks transportation programs and projects that can help the Baltimore region reduce emissions from mobile sources and meet National Ambient Air Quality Standards. CMAQ eligible projects must be able to reduce air pollution emissions and in some cases reduce traffic congestion. The CMAQ program is administered by the FHWA and the FTA and is available to state and local governments. The net operations and maintenance costs of new transit services, including additional passenger ferry services, may be funded for a three year period with up to 80% CMAQ funds.
7.2 Fare Policy
In economics terms, transit is a mixed good with public and private benefits. In theory, the public entity providing the transit services should charge the user for the transit user’s private benefit and subsidize the service for the public benefits that the transit service provides. The private benefits that accrue to the rider are typically the distance based value of the ride and the travel time savings, if any, since transit typically takes longer for the same commute. The public benefits are often lessened traffic congestion, lower air pollutants and access to opportunities for lower income citizens.
In the case of the HC, there are significant travel time savings for commuters that cross the Patapsco River. From Locust Point to Harbor Point, driving through the congested roadways can take 30 minutes or more while the HC ride takes five minutes plus some time to wait for the ferry and walk to work. For Harbor East or Locust Point commuters earning $60,000 per year the travel time savings from the Harbor Connector (assuming a 15 minute travel time savings) could be as high $7.50 per trip.
When establishing fare products, transit agencies must consider the capital and operating costs to collect the fares and the delays that fare collection may cause. In the case of the HC, there are two crew members. The captain operates the vessel while the deck hand assists the passengers on and off the ferry. During the typical HC trip the deck hand has sufficient time between landings to inspect and collect fares. Passengers paying fares should be able to board the vessel without causing delays. While fare collection and money counting procedures will be required, no fare boxes will be needed. As compared to the costs of collecting fares on the CCC, fare collection costs on the HC should be low.
Since most HC commuters are regular riders, fare products could include daily tickets and month passes. Monthly passes could be sold, and perhaps subsidized, through employers. Daily tickets could be sold through ticket vending machines at HC landings or by deck hands on-board the vessels.
Two fare collection scenarios are suggested for the City’s consideration. They are:
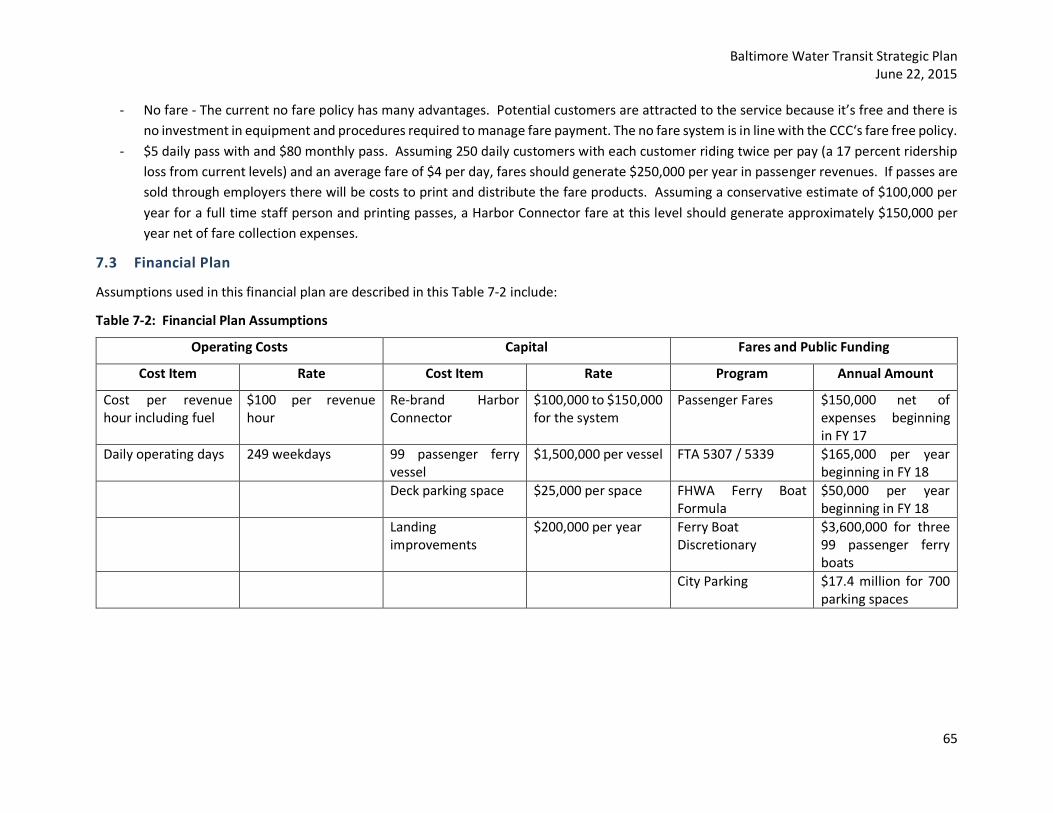
Baltimore Water Transit Strategic Plan June 22, 2015
65
- No fare - The current no fare policy has many advantages. Potential customers are attracted to the service because it’s free and there is no investment in equipment and procedures required to manage fare payment. The no fare system is in line with the CCC‘s fare free policy.
- $5 daily pass with and $80 monthly pass. Assuming 250 daily customers with each customer riding twice per pay (a 17 percent ridership loss from current levels) and an average fare of $4 per day, fares should generate $250,000 per year in passenger revenues. If passes are sold through employers there will be costs to print and distribute the fare products. Assuming a conservative estimate of $100,000 per year for a full time staff person and printing passes, a Harbor Connector fare at this level should generate approximately $150,000 per year net of fare collection expenses.
7.3 Financial Plan
Assumptions used in this financial plan are described in this Table 7-2 include:
Table 7-2: Financial Plan Assumptions
Operating Costs Capital Fares and Public Funding
Cost Item Rate Cost Item Rate Program Annual Amount
Cost per revenue hour including fuel
$100 per revenue hour
Re-brand Harbor Connector
$100,000 to $150,000 for the system
Passenger Fares $150,000 net of expenses beginning in FY 17
Daily operating days 249 weekdays 99 passenger ferry vessel
$1,500,000 per vessel FTA 5307 / 5339 $165,000 per year beginning in FY 18
Deck parking space $25,000 per space FHWA Ferry Boat Formula
$50,000 per year beginning in FY 18
Landing improvements
$200,000 per year
Ferry Boat Discretionary
$3,600,000 for three 99 passenger ferry boats
City Parking $17.4 million for 700 parking spaces

Baltimore Water Transit Strategic Plan June 22, 2015
66
Table 7-3 includes the recommend revenue hours assuming the services operate 249 days per year.
Table 7-3: Projected Harbor Connector Revenue Hours
Service Alternatives FY 16 FY 17 FY 18 FY 19 FY 20 FY 21 FY 22
Route 1 3,237 3,237 3,237 3,237 3,237 3,237 3,237
Route 2 3,237 1,992 (1) 1,992 1,992 1,992 1,992 1,992
Route 3 3,237 1,992 (1) 1,992 1,992 1,992 1,992 1,992
Route 4 Canton to Harbor Point 1,992 (2) 1,992 (2) 1,992 (2) 3,984 (2) 3,984
Total 9,711 7,221 9,213 9,213 9,213 11,205 11,205
Note (1) Routes 2 and 3 would be reduced to peak hours only with 8 daily operating hours for each route Note (2) Route 4 would operate from Canton to Maritime Park / Harbor Point. In FY 21 when additional parking is available Route 4 would extend service to Downtown / Harbor Place
Table 7-4 presents the HC operating costs and revenues.
Table 7-4: Harbor Connector Operating Costs and Revenues
Operating Costs 2016 2017 2018 2019 2020 2021 2022 Operating Hours 9,711 7,221 9,213 9,213 9,213 11,205 11,205 Operating Costs $971,100 $722,100 $921,300 $921,300 $921,300 $1,120,500 $1,120,500 Operating Revenues Fares $150,000 $200,000 $200,000 $200,000 $250,000 $250,000 Employer Contributions $94,540 $94,540 $125,000 $125,000 $125,000 $150,000 $150,000 FTA 5307 - Maintenance $55,000 $55,000 $55,000 $55,000 $55,000 City Transportation - Operating $876,560 $477,560 $596,300 $596,300 $596,300 $720,500 $720,500
Table 7-5 presents HC capital costs.

Baltimore Water Transit Strategic Plan June 22, 2015
67
Table 7-5: Harbor Connector Capital Costs
Capital Costs 2016 2017 2018 2019 2020 2021 2022 Re-brand Harbor Connector $100,000 Electric Water Taxi $503,021 $503,021 Locust Point Parking $50,000 $1,500,000 $3,450,000 S. Clinton Parking $50,000 $500,000 $2,000,000 $9,950,000 Landing Improvements $200,000 $200,000 $200,000 $200,000 $200,000 99 Passenger Ferry $1,500,000 $1,500,000 $1,500,000 Total Capital Costs $50,000 $1,650,000 $4,653,021 $2,703,021 $11,650,000 $1,700,000 $1,700,000
Table 7-6 presents the proposed financing for the HC capital projects.
Table 7-6: Harbor Connector Capital Financing
Funding 2016 2017 2018 2019 2020 2021 2022 FTA Ferry Boat Discretionary $427,568 $427,568 $1,200,000 $1,200,000 $1,200,000 FTA 5307 / 5339 $110,000 $110,000 $110,000 $110,000 $110,000 FHWA - Ferry Boat $50,000 $50,000 $50,000 $50,000 $50,000 City Parking or FTA Discretionary $1,500,000 $3,950,000 $2,000,000 $9,950,000 City Transportation - Capital $50,000 $150,000 $115,453 $115,453 $340,000 $340,000 $340,000 Total City Transportation $926,560 $627,560 $711,753 $711,573 $936,300 $1,060,500 $1,060,500

Baltimore Water Transit Strategic Plan June 22, 2015
68
8 BALTIMORE WATER TRANSIT STRATEGIC PLAN RECOMMENDATIONS
This Baltimore Water Transit Strategic Plan has been prepared to assist in improving the current operations and focusing the long range planning for Baltimore’s water transit services including the WT, HC and Dockmaster programs. The goal of the study is to identify ways to improve the effectiveness of the water transit services, develop a financeable expansion plan and to improve the financial sustainability of the water transit services. The Study Area includes the Inner Harbor and Middle Branch waterways with an eastern project boundary of the I-895 Harbor Tunnel Thruway.
While observations and recommendations are included in each section of this strategic plan, the recommendations are summarized in Table 8-1 by program area and time period. Recommendations classified as short-range are intended to be implemented within two-years, mid-range recommendations are intended to be implemented within five years and long-range recommendations may require up to ten years for implementation.
Table 8-1: Summary of Recommendations
# Program Area Recommendation Time Frame City Cost
1 Water Transit Program The City should continue the Water Taxi / Harbor Connector business structure with a private operator bearing financial risk and benefits of the Water Taxi while the City bears the cost of the Harbor Connector.
Short-range None
2 Water Transit Program The Inner Harbor wharfage and development agreements should be the responsibility of a single entity within City government that is adequately staffed to manage these agreements. Revenue from the wharfage agreements should be deposited in an Inner Harbor account and used for the operations that support the Inner Harbor including the Inner Harbor Services and the HC.
Short-range None
3 Water Transit Program A request for proposals should be issued for a seven to ten year contract for the operation of the WT and HC.
Short-range None
4 Water Transit Program NTD reporting should be completed for both the CCC and the HC. The City should work with MTA to obtain the additional federal funding resulting from the City’s NTD reports.
Short-range Less than $20,000 per year for an audit of the NTD data and financial information.
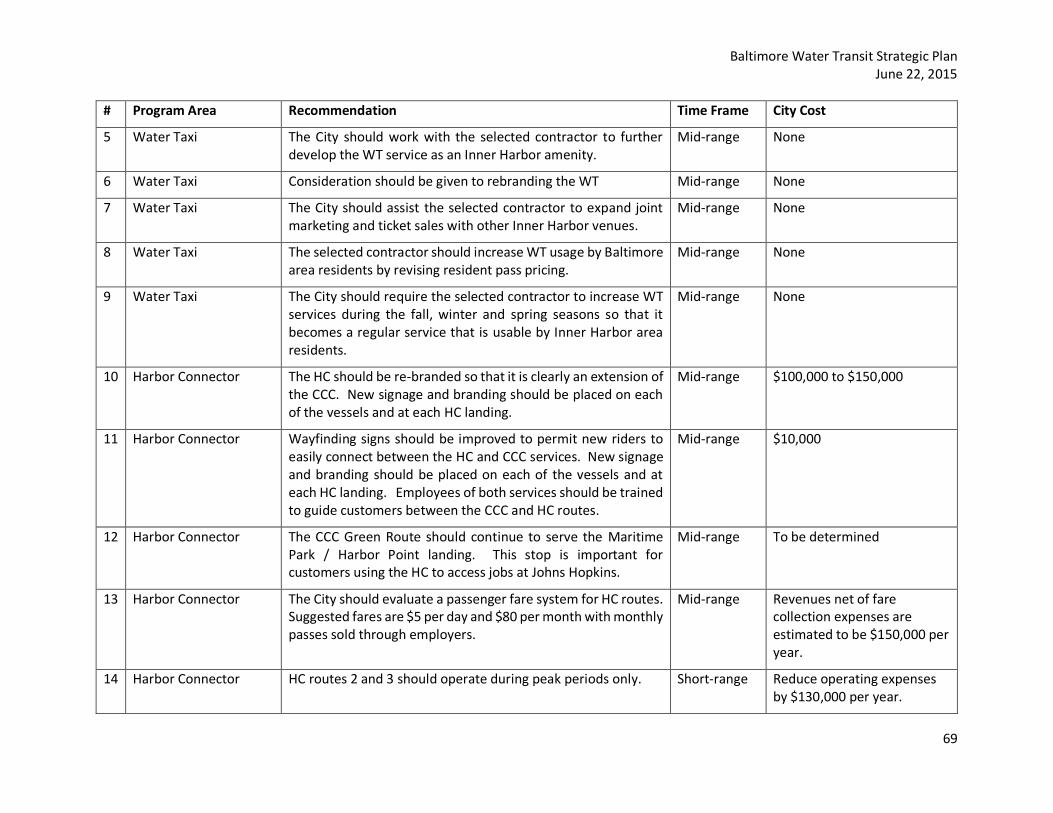
Baltimore Water Transit Strategic Plan June 22, 2015
69
# Program Area Recommendation Time Frame City Cost
5 Water Taxi The City should work with the selected contractor to further develop the WT service as an Inner Harbor amenity.
Mid-range None
6 Water Taxi Consideration should be given to rebranding the WT Mid-range None
7 Water Taxi The City should assist the selected contractor to expand joint marketing and ticket sales with other Inner Harbor venues.
Mid-range None
8 Water Taxi The selected contractor should increase WT usage by Baltimore area residents by revising resident pass pricing.
Mid-range None
9 Water Taxi The City should require the selected contractor to increase WT services during the fall, winter and spring seasons so that it becomes a regular service that is usable by Inner Harbor area residents.
Mid-range None
10 Harbor Connector The HC should be re-branded so that it is clearly an extension of the CCC. New signage and branding should be placed on each of the vessels and at each HC landing.
Mid-range $100,000 to $150,000
11 Harbor Connector Wayfinding signs should be improved to permit new riders to easily connect between the HC and CCC services. New signage and branding should be placed on each of the vessels and at each HC landing. Employees of both services should be trained to guide customers between the CCC and HC routes.
Mid-range $10,000
12 Harbor Connector The CCC Green Route should continue to serve the Maritime Park / Harbor Point landing. This stop is important for customers using the HC to access jobs at Johns Hopkins.
Mid-range To be determined
13 Harbor Connector The City should evaluate a passenger fare system for HC routes. Suggested fares are $5 per day and $80 per month with monthly passes sold through employers.
Mid-range Revenues net of fare collection expenses are estimated to be $150,000 per year.
14 Harbor Connector HC routes 2 and 3 should operate during peak periods only. Short-range Reduce operating expenses by $130,000 per year.

Baltimore Water Transit Strategic Plan June 22, 2015
70
# Program Area Recommendation Time Frame City Cost
15 Harbor Connector Timed to coincide with the opening of Harbor Point offices, the City should consider adding a fourth HC route from Canton Waterfront Park to Maritime Park / Harbor Point on a one-year trial basis. Harbor East businesses should consider sponsoring this service. The new electric water vessel should be used in this service when available.
Short-range Increase operating expenses by $132,000 per year. Harbor East sponsorships may offset a portion of this expense.
16 Harbor Connector As a means to increase transportation capacity in the Boston Street corridor, the City should extend HC 4 to Downtown (Harbor Place) and acquire parking capacity (approximately 500 parking spaces) near Boston and S. Clinton streets. Grant funds should be pursued for the parking spaces and three additional vessels.
Long-range Parking $12,500,000; 3 vessels $4,500,000 and additional ferry landing $200,000. Additional operating expenses of $500,000 per year.
17 Harbor Connector The City should modify the height of the floats at HC landings so that they have the same deck height as the Oriole and Raven. This change, if implemented, will improve passenger safety and access by persons with disabilities. The railings on the HC floats should be relocated away from the leading edge of the float so that approaching vessels cannot strike the railings.
Mid-range $100,000.
18 Harbor Connector The City should work with the developers of Harbor Point to construct a new HC landing that replaces the Maritime Point landing. The Harbor Point landing should have good connections with the CCC and other transit routes serving Harbor Point.
Mid-range Harbor Point landing costs should be part of the Harbor Point development.
19 Harbor Connector The City should obtain an estimated 200 passenger ferry parking spaces through lease or construction of new facilities in the Riverside and/or Locust Point neighborhoods.
Mid-range 200 parking spaces - $5,000,000 and additional ferry landing $200,000.
20 Harbor Connector The City should work with developers of Westport to identify parking and dock space that may be used for a long term passenger ferry service to Harbor Point. Because of shallow waters dredging may be required.
Long-range Additional studies will be required to determine the extent of dredging and facility costs.
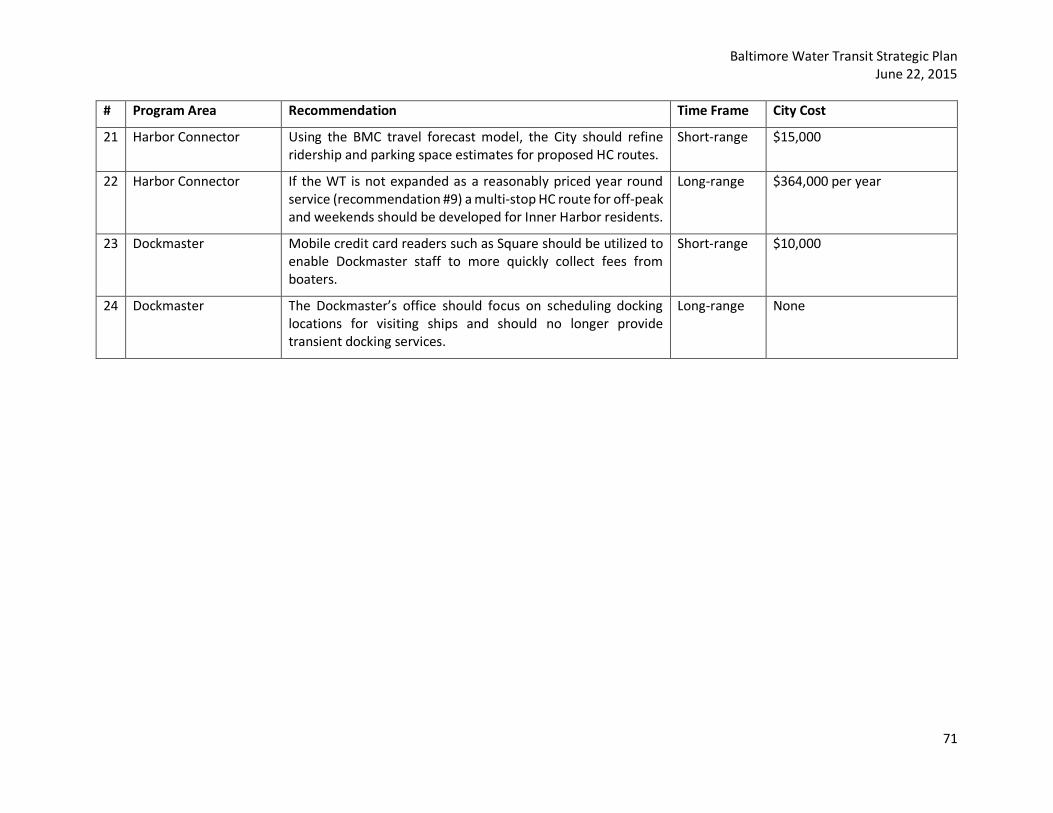
Baltimore Water Transit Strategic Plan June 22, 2015
71
# Program Area Recommendation Time Frame City Cost
21 Harbor Connector Using the BMC travel forecast model, the City should refine ridership and parking space estimates for proposed HC routes.
Short-range $15,000
22 Harbor Connector If the WT is not expanded as a reasonably priced year round service (recommendation #9) a multi-stop HC route for off-peak and weekends should be developed for Inner Harbor residents.
Long-range $364,000 per year
23 Dockmaster Mobile credit card readers such as Square should be utilized to enable Dockmaster staff to more quickly collect fees from boaters.
Short-range $10,000
24 Dockmaster The Dockmaster’s office should focus on scheduling docking locations for visiting ships and should no longer provide transient docking services.
Long-range None


