Bandwidths for the perception of head orientation decrease during childhood Mark D. Vida a,⇑ , Hugh R. Wilson b , Daphne Maurer a a McMaster University, 1280 Main Street West, Hamilton, ON, L8S 4L8, Canada b York University, 4700 Keele Street, Toronto, ON M3J 1P3, Canada article info Article history: Received 10 November 2013 Received in revised form 6 March 2014 Available online 25 March 2014 Keywords: Head orientation Face viewpoint Children Aftereffects Adaptation Computational modeling abstract Adults use the orientation of people’s heads as a cue to the focus of their attention. We examined devel- opmental changes in mechanisms underlying sensitivity to head orientation during childhood. Eight-, 10-, 12-year-olds, and adults were adapted to a frontal face view or a 20 left or right side view before judging the orientation of a face at or near frontal. After frontal adaptation, there were no age differences in judgments of head orientation. However, after adaptation to a 20 left or right side view, aftereffects were larger and sensitivity to head orientation was lower in 8- and 10-year-olds than in adults, with no difference between 12-year-olds and adults. A computational model indicates that these results can be modeled as a consequence of decreasing neural tuning bandwidths and decreasing additive internal noise during childhood, and/or as a consequence of increasing inhibition during childhood. These results pro- vide the first evidence that neural mechanisms underlying sensitivity to head orientation undergo con- siderable refinement during childhood. Ó 2014 Elsevier B.V. All rights reserved. 1. Introduction The orientation of people’s heads provides a useful cue to the focus of their attention, and may thereby allow inferences about their intentions. Sensitivity to head orientation (i.e., precision in discriminating differences in head orientation) may also contribute to humans’ ability to recognize faces across changes in head orien- tation (see Habak et al., 2008; Wilson et al., 2011). Evidence from behavioral experiments and computational modeling suggests that neural mechanisms underlying sensitivity to head orientation de- grade in healthy aging (Wilson, Mei, Habak, & Wilkinson, 2011). Here, we used visual adaptation and computational modeling to investigate whether developmental changes in children’s judg- ments of head orientation are the mirror image of the declines ob- served in healthy aging. 1.1. Adults’ sensitivity to head orientation Adults are highly sensitive to head orientation: they require a deviation of around 1–2 from frontal to reach 75% accuracy in detecting the deviation in a single face (e.g., Wilson et al., 2011) or between sequentially presented faces (Chen et al., 2010; Wilson et al., 2000). Prolonged exposure (adaptation) to a particular head orientation leads to repulsive aftereffects in which perceived head orientation is shifted in a direction opposite to that of the adapting orientation (Bi et al., 2009; Chen et al., 2010; Fang and He, 2005; Fang et al., 2007; Ryu and Chaudhuri, 2006; Wilson et al., 2011). Aftereffect size and sensitivity to head orientation appear to vary with adapting orientation. In one study, participants judged the orientation of heads at or near frontal, with no adaptation (baseline) or following adaptation to heads varying in orientation (0–90 , in increments of 15 )(Chen et al., 2010). The size of after- effects increased gradually as the adapting orientation varied from 0 to 15–30 , with a gradual decrease beyond 30 (Chen et al., 2010). Relative to baseline, sensitivity was higher following adap- tation to a frontal face view, and was lower for adapting orienta- tions 15–60 to either side of frontal (Chen et al., 2010). A computational model indicated that the effects of adapting orien- tation on aftereffect size and sensitivity could be modeled as a con- sequence of reductions in response magnitude in neurons selective for head orientation, with a preferred orientation at or near the adapting orientation (Chen et al., 2010). Aging appears to influence mechanisms underlying sensitivity to head orientation. In one study, younger (M age = 26 years) and older (M age = 67 years) adults were adapted to a frontal face view or a 20 left or right side view before judging the orientation of a head oriented toward or near frontal (Wilson et al., 2011). Following frontal adaptation, there were no age differences in judgments of http://dx.doi.org/10.1016/j.visres.2014.03.005 0042-6989/Ó 2014 Elsevier B.V. All rights reserved. ⇑ Corresponding author. E-mail addresses: [email protected](M.D. Vida), [email protected](H.R. Wilson), [email protected](D. Maurer). Vision Research 98 (2014) 72–82 Contents lists available at ScienceDirect Vision Research journal homepage: www.elsevier.com/locate/visres
Adults use the orientation of people’s heads as a cue to the focus of their attention. We examined devel-opmental changes in mechanisms underlying sensitivity to head orientation during childhood. Eight-,10-, 12-year-olds, and adults were adapted to a frontal face view or a 20� left or right side view beforejudging the orientation of a face at or near frontal. After frontal adaptation, there were no age differencesin judgments of head orientation. However, after adaptation to a 20� left or right side view, aftereffectswere larger and sensitivity to head orientation was lower in 8- and 10-year-olds than in adults, with nodifference between 12-year-olds and adults. A computational model indicates that these results can bemodeled as a consequence of decreasing neural tuning bandwidths and decreasing additive internal noiseduring childhood, and/or as a consequence of increasing inhibition during childhood. These results pro-vide the first evidence that neural mechanisms underlying sensitivity to head orientation undergo con-siderable refinement during childhood.
� 2014 Elsevier B.V. All rights reserved.
1. Introduction
The orientation of people’s heads provides a useful cue to thefocus of their attention, and may thereby allow inferences abouttheir intentions. Sensitivity to head orientation (i.e., precision indiscriminating differences in head orientation) may also contributeto humans’ ability to recognize faces across changes in head orien-tation (see Habak et al., 2008; Wilson et al., 2011). Evidence frombehavioral experiments and computational modeling suggests thatneural mechanisms underlying sensitivity to head orientation de-grade in healthy aging (Wilson, Mei, Habak, & Wilkinson, 2011).Here, we used visual adaptation and computational modeling toinvestigate whether developmental changes in children’s judg-ments of head orientation are the mirror image of the declines ob-served in healthy aging.
1.1. Adults’ sensitivity to head orientation
Adults are highly sensitive to head orientation: they require adeviation of around 1–2� from frontal to reach 75% accuracy indetecting the deviation in a single face (e.g., Wilson et al., 2011)or between sequentially presented faces (Chen et al., 2010; Wilson
et al., 2000). Prolonged exposure (adaptation) to a particular headorientation leads to repulsive aftereffects in which perceived headorientation is shifted in a direction opposite to that of the adaptingorientation (Bi et al., 2009; Chen et al., 2010; Fang and He, 2005;Fang et al., 2007; Ryu and Chaudhuri, 2006; Wilson et al., 2011).Aftereffect size and sensitivity to head orientation appear to varywith adapting orientation. In one study, participants judged theorientation of heads at or near frontal, with no adaptation(baseline) or following adaptation to heads varying in orientation(0–90�, in increments of 15�) (Chen et al., 2010). The size of after-effects increased gradually as the adapting orientation varied from0� to 15–30�, with a gradual decrease beyond 30� (Chen et al.,2010). Relative to baseline, sensitivity was higher following adap-tation to a frontal face view, and was lower for adapting orienta-tions 15–60� to either side of frontal (Chen et al., 2010). Acomputational model indicated that the effects of adapting orien-tation on aftereffect size and sensitivity could be modeled as a con-sequence of reductions in response magnitude in neurons selectivefor head orientation, with a preferred orientation at or near theadapting orientation (Chen et al., 2010).
Aging appears to influence mechanisms underlying sensitivity tohead orientation. In one study, younger (M age = 26 years) and older(M age = 67 years) adults were adapted to a frontal face view or a 20�
left or right side view before judging the orientation of a headoriented toward or near frontal (Wilson et al., 2011). Followingfrontal adaptation, there were no age differences in judgments of
M.D. Vida et al. / Vision Research 98 (2014) 72–82 73
head orientation. Following adaptation to a 20� side view, sensitivitywas 2.0 times lower and aftereffects were 2.4 times larger in olderadults. A computational model indicated that the effects of agingcould be modeled as a consequence of increasing additive internalnoise (i.e., more random fluctuation in neural responses) by a factorof 1.7, and increasing bandwidths (i.e., less selectivity for a particularhead orientation) in neurons selective for head orientation, by afactor of 2.5. The authors suggested that degradation of mechanismsunderlying sensitivity to head orientation could be related tofindings that the ability to match facial identities across changes inhead orientation declines in healthy aging, whereas the ability tomatch identities within the same head orientation does not (Habak,Wilkinson & Wilson, 2008).
1.2. Children’s sensitivity to head orientation
Coarse sensitivity to head orientation may be present frombirth. After habituation to a photograph of a person’s face with aparticular viewpoint (e.g., frontal), newborns look longer at thesame person’s face viewed from a different angle (e.g., 45� sideview) than at the image viewed during habituation, a result sug-gesting that newborns can discriminate large differences in headorientation (Turati, Bulf, & Simion, 2008). At 3 months of age, in-fants orient in the direction of an adult’s head turn (D’Entremont,Hains, & Muir, 1997; Scaife & Bruner, 1975). At 2–3 years of age,children exceed chance in using large head turns to make explicitjudgments about which of two heads is oriented toward the child,or which of several widely spaced objects an adult’s head is ori-ented toward (Doherty & Anderson, 1999). Previous studies havenot investigated children’s ability to discriminate small differencesin head orientation. However, previous research indicates that un-til at least age 10 (oldest age tested) children make more errorsthan adults in recognizing faces across changes in head orientation,but not across changes in facial expression or eye gaze (Mondlochet al., 2003, but also see Jeffery et al., 2013), a pattern that couldreflect immature sensitivity to head orientation.
In sum, previous studies suggest that adults are highly sensitiveto head orientation (Wilson, Wilkinson, Lin, & Castillo, 2000), butthat neural mechanisms underlying the perception of head orien-tation may degrade in healthy aging, as indicated by larger afteref-fects and decreasing sensitivity following adaptation to a 20� sideview (Wilson et al., 2011). Previous studies have not investigatedthe development of these mechanisms during childhood. The pur-pose of the current study was to investigate this question by com-paring sensitivity to head orientation and head orientationaftereffects between children and adults. Using the same stimulias a previous study of healthy aging (Wilson et al., 2011), and aprocedure similar to that of the previous study, we adapted8-, 10-, 12-year-olds, and adults to a frontal face view or a 20� leftor right side view before participants judged the orientation of aface at or near the frontal orientation. For each adapting orienta-tion, we measured sensitivity to head orientation. For the leftand right adaptation conditions, we measured the size of head ori-entation aftereffects. We expected that if developmental changesin children’s judgments of head orientation are the mirror image
0º (fron6º left 2º left20º left
Fig. 1. Examples of stimuli present
of the declines observed in healthy aging (Wilson et al., 2011),adaptation to a side view would produce larger aftereffects inyoung children than in adults, and would lead to lower sensitivityto head orientation in young children than in adults. We used acomputational model to investigate whether our data could bemodeled as a consequence of changes during childhood in neuralbandwidths and additive internal noise, and/or as a consequenceof changes in inhibition.
2. Method
2.1. Participants
Participants were 8-year-olds (8.5 ± 0.25 years, M = 8.38 years,9 female), 10-year-olds (10.5 ± 0.25 years, M = 10.33 years, 10 fe-male), 12-year-olds (12.5 ± 0.25 years, M = 12.58 years, 7 female)and adults (18–24 years, M = 18.77 years, 17 female) (n = 20/group). Adult participants were undergraduate students whoreceived course credit for participation. Child participants wererecruited from a database of children whose parents volunteeredto participate in research at the time of their child’s birth. All par-ticipants were visually screened and had normal or corrected-to-normal vision. All participants were required to have at least 20/20 letter acuity on the Lighthouse eye chart and normal stereoacu-ity as measured by the Randot test. Five additional participantswere tested, but were excluded and replaced because they wereobviously inattentive during the procedure (one 8-year-old), be-cause they failed visual screening (one 8-year-old, one 10-year-old), or because they had a r or aftereffect value (see Sections3.2 and 3.4 for description of these measures) further than 3 SDfrom the group mean in at least one condition (one 8-year-old,one 12-year-old). A statistically deviant r or aftereffect was takenas an indication of inattentiveness or poor understanding of thetask.
2.2. Stimuli
Stimuli were the same as in a previous study using a similarmethod (Wilson et al., 2011). Stimuli were synthetic faces con-structed as in previous research (Wilson, Loffler, & Wilkinson,2002; Wilson et al., 2011). These synthetic faces are based on thelayout of real faces, so that it is possible to recognize an individualfrom the synthetic version of his/her face (Wilson, Loffler &Wilkinson, 2002). Importantly, these faces yield judgments of headorientation comparable to those made from photographs of livemodels (Wilson et al., 2000; Wilson et al., 2011). The face identitypresented in the current study was the mean of 40 individual malefaces. As in Wilson et al. (2011), all face images were bandpassfiltered to 10 cycles/face width, a value within a range of low tomid spatial frequencies important for face identification in adultsand children as young as age 5 (youngest tested) (Deruelle & Fagot,2005; Gao & Maurer, 2011; Leonard, Karmiloff-Smith, & Johnson,2010). Images of the face were rendered with the following orien-tations: 0� (frontal), and 2�, 4�, 6�, and 20� to the left and right (seeFig. 1). Face images were 3.22� wide and 4.56� high at the testing
tal) 2º right 6º right 20º right
ed in the current experiment.
74 M.D. Vida et al. / Vision Research 98 (2014) 72–82
distance of 131 cm. Stimuli were displayed on a Dell P1130Trinitron 21 inch display set to a resolution of 1152 x 870 and a re-fresh rate of 75 Hz. The display had a mean luminance of 52.8 cd/m2, as measured with a Minolta LS-200 photometer at a distance of50 cm. The mean luminance of each face image and thebackground against which all stimuli were presented were set tothe mean luminance of the display. The experiment was run inMATLAB R2008a (MathWorks, Natick, MA, USA) using thePsychophysics Toolbox extensions (Brainard, 1997) on an Applecomputer.
2.3. Apparatus
Participants sat 131 cm from the center of the screen. They useda chin rest to maintain a constant head position. They entered re-sponses by pressing designated keys on a keyboard placed on a ta-ble in front of them. The experimenter used a second keyboard toadvance trials.
2.4. Design
Each participant completed a practice block, followed by threetest blocks. In the practice block, participants viewed a frontallyoriented adapting face, followed by a test face directed 6� to left(4 trials) or right (4 trials). At the beginning of each trial, a whitefixation cross appeared at the center of the screen. When the par-ticipant appeared to fixate the cross, the experimenter pressed akey to display the adapting face. The adapting face appeared be-hind the cross, at a random position within 21 arcmin (0.35�) fromthe center of the screen. To disrupt low-level contour adaptation,the position of the adapting stimulus changed once per second,to a random position within 21 arcmin from the previous position.After 5 s, the adapting face disappeared and the screen returned tothe mean luminance for 1 s. The test face was then flashed for200 ms. A black question mark then appeared at the center of thescreen. Participants pressed a key to indicate whether the test facewas directed to the left or right. During practice trials, participantsreceived feedback indicating whether their responses were corrector not (a cartoon image of a happy face with a 1000 Hz tone for cor-rect responses and a cartoon image of a sad face with a 400 Hz tonefor incorrect responses). Participants were allowed three attemptsto reach a criterion of 75% accuracy. All participants met this crite-rion on the first attempt.
After completing the practice block, participants began the testblocks. The purpose of the test blocks was to measure the influ-ence of adaptation on participants’ sensitivity to head orientation(i.e., precision in discriminating differences in head orientation)and on perceived head orientation. The orientation of the adapt-ing face was held constant within each test block. In the firstblock, the adapting face always had a frontal orientation. In thesecond and third blocks, the adapting face was oriented 20� tothe left or right. Half of the participants received the left adaptingorientation in the second block and the right adapting orientationin the third block, with the other half receiving the opposite or-der. In each block, participants received 8 trials with each of 7 testorientations (6� left to 6� right, in 2� steps), for a total of 56 trialsper block. To assess attentiveness, we included three catch trialsthat appeared at random positions within each block, with theconstraint that catch trials were never fewer than five trials apart.In each catch trial, a cartoon image of rocks appeared on thescreen. Participants were instructed to press a button to soundan alarm when they saw this image. During the test blocks, par-ticipants received general encouragement but no trial-specificfeedback.
2.5. Procedure
After the procedure was explained, written consent was ob-tained from adult participants, and from the parent of each childparticipant. Verbal assent was also obtained from each child partic-ipant. After positioning each participant appropriately in the appa-ratus, the experimenter displayed a cartoon image of the inside of acave, and explained the task as follows:
My friend James is an explorer who loves to search for buried trea-sure. He has been out searching for treasure deep in this cave, and nowhe is lost! To find his way out of the cave, James has to face straightahead. Sometimes James gets distracted and turns his head to this side[experimenter points to left of display] or to this side [points toright]. Your job will be to help James stay on course by deciding whichway his head is pointing. You’re going to see a white cross in the mid-dle of the screen, with a face behind it. When the cross is on the screen,stare directly at it. When the cross disappears and James’ face flashesup on the screen, press one of these two buttons to show where his facewas pointing [points to response buttons]. If the face is pointing thisway [points to left] press this button [points to left button]. If theface is pointing this way [points to right] press this button [pointsto right button].
The experimenter then initiated practice trials. Once the partic-ipant reached criterion, the experimenter displayed a photographof rocks, and delivered the following instruction:
James is lost in a part of a cave that has lots of rocks. If you seerocks like these, you can sound an alarm to warn James so that he doesnot trip on the rocks. To sound the alarm, press this button [experi-menter points to silver star button].
The experimenter then initiated the first test block. The exper-imenter carried out visual screening after the first test block, andoffered a break after the second test block. Participants typicallycompleted the entire procedure in 35–40 min.
3. Results
3.1. Accuracy on catch trials
Accuracy (expressed here as the proportion of correct responses)on catch trials was high in 8-year-olds (M = .93, SD = .09,range = .67–1.00), 10-year-olds (M = .96, SD = .07, range =.78–1.00), 12-year-olds (M = .96, SD = .11, range = .78–1.00), andadults (M = .98, SD = .05, range = .89–1.00). We carried out a mixedANOVA with age and order (i.e., whether the participant receivedthe right or left adaptation block first) as between-subject variables,adapting condition (frontal, left, right) as a within-subject variable,and accuracy as the dependent variable. There were no main effectsor interactions, ps > .65. The high accuracy in each age group and theabsent effect of age on accuracy suggest that participants in all agegroups were attentive throughout the procedure.
3.2. Curve fitting
For each participant, adapting orientation, and test orientation,we calculated the proportion of rightward responses (see Fig. 2).For each adapting orientation, we fit each participant’s data witha cumulative Gaussian function. All fits were carried out with thePalamedes Toolbox (Prins & Kingdom, 2009) extensions in MATLABR2011b. For each fit, we assessed goodness of fit by calculatingdeviance, defined as:
D ¼ 2½lðhmax; yÞ � lðh; yÞ� ð1Þ
where lðhmax; yÞ is the likelihood of a model that has a free parame-ter for each empirical data point, and therefore has no residual error(i.e., the ‘‘saturated’’ model), and lðh; yÞ is the likelihood of the
−5 0 50
0.2
0.4
0.6
0.8
1Adults
−5 0 50
0.2
0.4
0.6
0.8
18−year−olds
−5 0 50
0.2
0.4
0.6
0.8
110−year−olds
−5 0 50
0.2
0.4
0.6
0.8
112−year−olds
Head orientation (deg)
Prop
ortio
n of
righ
twar
d re
spon
ses
Fig. 2. Cumulative Gaussian functions fit to the mean proportion of rightward responses (±1 SE) as a function of head orientation (in degrees), adapting condition, and agegroup. In each plot, the green, red, and blue curves and data points represent the data for the 20� left, frontal and 20� right adaptation conditions, respectively. Negative valueson the x axis refer to leftward orientations and positive values refer to rightward orientations. The dashed black horizontal line marks the 0.5 point on the y axis. (Forinterpretation of the references to colour in this figure legend, the reader is referred to the web version of this article.)
M.D. Vida et al. / Vision Research 98 (2014) 72–82 75
best-fitting model (McCullagh & Nelder, 1989; Prins & Kingdom,2009; Wichmann & Hill, 2001). A larger deviance value indicatesgreater discrepancy between the model and data. We comparedthe observed deviance value against a distribution of deviance val-ues computed using a bootstrap method with 1000 iterations per fit(Prins & Kingdom, 2009). Deviance values below the 5th percentilein the deviance distribution are taken as evidence of a poor fit (Prins& Kingdom, 2009). All fits in the current experiment had deviancevalues above the 5th percentile.
From each fitted function, we extracted the parameter b, whichcontrols the slope of the function. As in a previous study using asimilar method (Wilson et al., 2011), we converted b to r, thestandard deviation of the Gaussian distribution, by taking the reci-procal of b (Prins & Kingdom, 2009). A smaller r (steeper slope) re-flects higher sensitivity to head orientation (i.e., the ability todetect smaller deviations from a frontal orientation). r is linearlyrelated to the 75% discrimination threshold (threshold = 0.68r)reported in previous research (Chen et al., 2010; Wilson et al.,2000; Wilson et al., 2011), which provides an estimate of thesmallest deviation from a frontal head orientation required forthe participant to reach 75% accuracy in detecting the deviation.We also extracted the point of subjective equality (PSE), which isthe head orientation at which the fitted function crossed the 0.5point on the y axis (i.e., the head orientation corresponding tothe transition between ‘left’ and ‘right’ responses). Values of thePSE were coded so that a positive value indicates a shift of per-ceived head orientation to the left of frontal, whereas a negativevalue reflects a rightward shift.
3.3. Adaptation to frontal face view
We did not expect frontal adaptation to produce large shifts inperceived head orientation. For this reason, we carried out separateanalyses for the frontal and 20� side adaptation conditions, as in aprevious study using a similar method (Wilson et al., 2011). For the
frontal adaptation condition, we carried out a univariate ANOVAwith age as the independent variable and PSE as the dependentvariable (see Fig. 3A). There was no effect of age, p > .75. However,a single-sample t-test indicated that the PSE differed from 0(M = �.32�, SD = .45), t(79) = 6.40, p < .0001, d = .71. This resultindicates that across age groups, there was a small but significantbias to perceive the head as being oriented to the right. This biasseems likely to reflect a very minor asymmetry in the face usedin the current study (see Fig. 1).
We also carried out a univariate ANOVA with age as the inde-pendent variable and r as the dependent variable (see Fig. 3B).There was no effect of age, p > .45.
3.4. Adaptation to 20� side view
3.4.1. Preliminary analyses of orderGroup differences in the extent to which participants’ perfor-
mance varied between the second and third blocks of the experi-ment (e.g., greater fatigue in young children) could lead to groupdifferences in performance across these blocks. To evaluate thispossibility, we carried out two mixed ANOVAs (one with aftereffectsize [see Section 3.4.2 for description of this measure] as thedependent variable, one with r as the dependent variable) with or-der (i.e., whether a participant completed the left or right adapta-tion block first), age, and direction of adaptation (left, right) asindependent variables. In each ANOVA, there was no effect of or-der, and order did not interact with any other variable, ps > .6. Thispattern suggests that in each age group, performance did not varybetween the second and third blocks of the experiment. Hence,data were collapsed across orders for all further analyses.
3.4.2. Aftereffect sizeWe expected that as in previous research (Chen et al., 2010;
Wilson et al., 2011), adaptation to a 20� side view would lead torepulsive aftereffects in which perceived head orientation is
8 10 12 14 16 18 20 8 10 12 14 16 18 20
−2
−1
0
1
2
(A) Point of subjective equality (PSE)
Age (years)
Mea
n PS
E (d
eg) ±
1 S
E
0
1
2
3
4
(B) Standard deviation
Age (years)
Mea
n st
anda
rd d
evia
tion
± 1
SE
Fig. 3. Results for the frontal adaptation condition. (A) Mean point of subjective equality (PSE) (in degrees, ±1 SE) as a function of age. (B) Mean standard deviation (±1 SE) as afunction of age.
76 M.D. Vida et al. / Vision Research 98 (2014) 72–82
shifted in a direction opposite to the orientation of the adaptingstimulus. In the current paradigm, these aftereffects are indicatedby a shift of the PSE toward the adapting orientation. For each par-ticipant and direction of adaptation (left, right), we calculated thesize of the aftereffect from the difference in PSE between the fron-tal and 20� side adaptation conditions. Values of the differencewere coded so that larger aftereffects in the expected direction leadto more positive values.
We carried out a mixed ANOVA with age and direction of adap-tation (left, right) as independent variables and aftereffect size asthe dependent variable (see Fig. 4A). There was a significant effectof age, F(3, 76) = 4.09, p < .01, f 2 ¼ :11, with no effect of directionand no interaction, ps > .064. A Dunnett’s post hoc following upthe effect of age indicated that aftereffects were larger in 8-year-olds (M = 2.96�, SD = 1.06) than in adults (M = 1.48�, SD = 1.17),p < .003, and were larger in 10-year-olds (M = 2.54�, SD = 1.55) thanin adults, p < .03, with no difference between 12-year-olds(M = 2.03�, SD = 1.13) and adults, p > .2.
The absent effect of adapting direction on aftereffect size, andthe absent interaction between age and adapting direction indicatethat the slight rightward bias observed in the frontal adaptationcondition (see Section 3.3 for details) did not lead to a differencein aftereffect size between the 20� left and 20� right adapting direc-tions, and that the influence of adapting direction did not differ be-tween age groups. Hence, the bias observed in the frontal
8 10 12 14 16 18 20
0
1
2
3
4
(A) Aftereffect size
Age (years)
Mea
n af
tere
ffect
siz
e (d
eg) ±
1 S
E
Fig. 4. Results for the 20� side adaptation conditions. (A) Mean aftereffect size (in degrees
adaptation condition does not affect our interpretation of the re-sults for the 20� side adaptation conditions.
3.4.3. Standard deviation (r)We carried out a mixed ANOVA with age and direction as inde-
pendent variables and r as the dependent variable (see Fig. 4B).There was an effect of age F(3, 76) = 7.35, p < .0005, f 2 ¼ :23, butthere was no effect of direction and no interaction, ps > .07. A Dun-nett’s post hoc following up the effect of age indicated that r waslarger in 8-year-olds (M = 3.37, SD = 1.86) than in adults (M = 1.14,SD = 0.91), p < .001, and was larger in 10-year-olds (M = 2.22,SD = 1.63) than in adults, p < .05, with no difference between12-year-olds (M = 1.67, SD = 1.74) and adults, p > .3. Since therewas no difference between the left and right adapting directions,we collapsed across directions for all further analyses of r.
In light of previous research indicating that sensitivity to headorientation is greater when the adapting and test orientations arethe same than when they differ by 15–60�, and our finding of amain effect of age following 20� side adaptation, but not followingfrontal adaptation, it was of interest whether sensitivity would dif-fer between the frontal and 20� side adaptation conditions in eachage group. To evaluate this possibility, we first carried out a mixedANOVA with adapting direction (frontal, 20� side) and age as theindependent variables and r as the dependent variable. Therewas an effect of age, F(3, 76) = 7.07, p < .001, f 2 ¼ :22, an effect of
8 10 12 14 16 18 20
0
1
2
3
4
(B) Standard deviation
Age (years)
Mea
n st
anda
rd d
evia
tion
± 1
SE
, ±1 SE) as a function of age. (B) Mean standard deviation (±1 SE) as a function of age.
M.D. Vida et al. / Vision Research 98 (2014) 72–82 77
adapting direction, F(1, 76) = 69.21, p < .001, f 2 ¼ :28, and a signif-icant interaction, F(3, 76) = 4.94, p < .004, f 2 ¼ :07. We followed upthe interaction with Holm–Bonferroni-corrected (Holm, 1979)paired-samples t-tests (one per age group) evaluating differencesbetween adapting directions for each age group. r was larger fol-lowing adaptation to a 20� side view than for frontal adaptation(8-year-olds: M = .78, SD = .94, 10-year-olds: M = .54, SD = .60,12-year-olds: M = .58, SD = .84, adults: M = .40, SD = .61) in8-year-olds, t(19) = 6.94, p < .0001, a ¼ :01, d = 1.76, 10-year-olds,t(19) = 3.88, p < .002, a ¼ :025, d = 1.37, 12-year-olds, t(19) = 2.75,p < .015, a ¼ :05, d = .80, and adults, t(19) = 3.18, p < .005,a ¼ :017, d = .94. Inspection of the group means and effect sizessuggests that the interaction between age and adapting directionarose from a decrease in the difference in sensitivity between the20� side and frontal adaptation conditions with increasing age.
3.5. Computational neural model
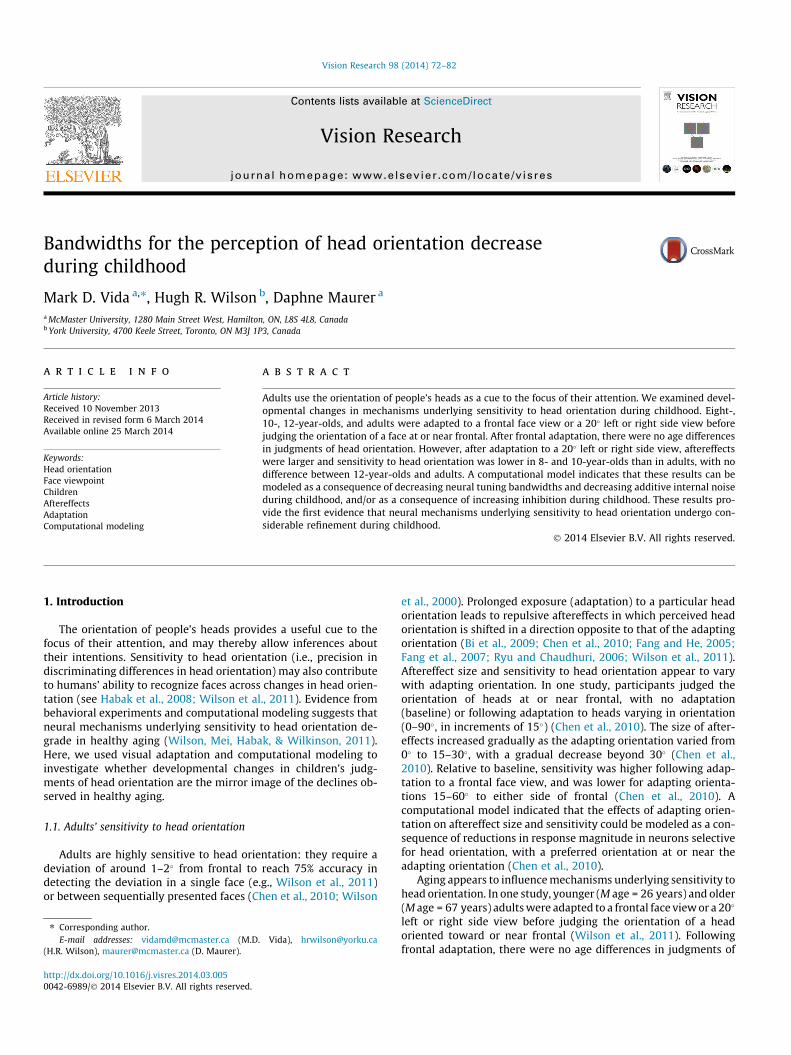
To interpret our results, we developed a model based on previ-ous models of aftereffects for head orientation (Chen et al., 2010;Wilson et al., 2011) and grating orientation (Clifford et al., 2001).In view of evidence that expression of the inhibitory neurotrans-mitter GABA increases throughout childhood (Pinto et al., 2010),and that GABA inhibition is inversely related to tuning bandwidthsand spontaneous activity in visual cortical neurons (Leventhalet al., 2003; Thiele et al., 2012; Wang et al., 2003), we first at-tempted to model the data for 8-year-olds and adults (the youn-gest and oldest groups in the current study, respectively) as aconsequence of developmental changes in one or both of thesecharacteristics. We also attempted to model the data as a conse-quence of developmental changes in inhibition.
As in previous models (Chen et al., 2010; Clifford, Wyatt, Arnold,Smith, & Wenderoth, 2001), we used a circular Gaussian (VonMises) function to simulate the tuning function of neurons selec-tive for head orientation, defined as:
RwðhÞ ¼ expfbðcosðh� h0Þ � 1Þg ð2Þ
where b is inversely related to the bandwidth of the curve and h0 isthe head orientation leading to the peak response (see Figs. 5 and6A). We assume that the tuning curves are evenly distributed, withh0 ranging from �180� to 180� in 10� steps. The number of curvesdoes not appear to be critical, as using half or double the numberof curves had little effect on model results.
We simulated adaptation by reducing response magnitude byAw, a factor proportional to the response to the adapting stimulus.The proportionality factor was set to 0.5, a value within the rangeused in previous models of head orientation aftereffects (Chenet al., 2010; Wilson et al., 2011), so that Aw ¼ 1� 0:5 � Rwð0Þ.
We used vector population decoding to estimate predicted headorientation from the population of model neurons (see Cliffordet al., 2001; Georgopolous, Kalaska, & Caminiti, 1982; Pougetet al., 2003). In this method, each model neuron contributes a vec-tor in the direction of its preferred view direction, with a lengthproportional to its response to the stimulus. Predicted head orien-tation is calculated from the vector sum of the responses of allmodel neurons. Without adaptation, the perceived orientation pre-dicted by the model matched the true orientation (see Figs. 5 and6B). We calculated the size of the predicted aftereffect from the dif-ference in predicted head orientation with and without adaptation(see Figs. 5c and 6C). We did not incorporate the slight rightwardbias in perceived head orientation observed in the frontal adapta-tion condition (see Section 3.3 for details) into the model becausethe bias was quite small (0.32� ), did not differ between age groups,did not lead to a significant difference in aftereffect size betweenthe 20� left and 20� right adapting conditions, and seems likely
to reflect a small asymmetry in the stimuli instead of a bias in neu-ral mechanisms for decoding head orientation.
To model participants’ sensitivity to head orientation, we firsttook into account the influence of adaptation on the slope of thefunction relating predicted head orientation to true head orienta-tion (see Figs. 5B and 6B). Adaptation increases the steepness ofthe slope at and near the adapting orientation, and decreases thesteepness away from the adapting orientation. The former mayincrease perceived differences in head orientation, leading toincreased sensitivity, whereas the latter would have the oppositeeffect (Clifford et al., 2001). As in previous models (Chen et al.,2010; Clifford et al., 2001), we estimated the change in perceiveddifferences (d) from the slope of the function relating perceivedhead orientation to true head orientation following adaptation(see Fig. 5 and 6D).
We also took into account the influences of additive internalnoise (Wilson et al., 2011) and the magnitude of the populationneural response (Clifford et al., 2001) on sensitivity to head orien-tation. On each of 10,000 simulated trials, we added Gaussian noise(M = 0, SD varied to fit data) to the response of each model neuron,and estimated perceived head orientation as described above. Aseparate noise sample was generated for each trial and model neu-ron. The response of each model neuron was constrained so thatnoise could not lead to a negative response. We calculated thestandard deviation of the estimates of perceived head orientationacross all simulated trials (rnoise) (see Figs. 5E and 6E). A largerrnoise reflects lower sensitivity. Adaptation increases rnoise at andaround the adapting orientation (see Figs. 5 and 6E). This reductionin sensitivity reflects a decrease in signal to noise ratio caused by adecrease in the magnitude of the population response at andaround the adapting orientation (see Figs. 5 and 6A).
We then calculated rpredicted, an estimate of standard deviationcombining information from rnoise and d:
rpredictedðhÞ ¼ rnoiseðhÞ �1
dðhÞk
!ð3Þ
where k controls the extent to which d influences r. k was set to5.75 for all fits (see Figs. 5 and 6F). Hence, the model yields esti-mates of sensitivity (rpredicted) in the same units (r) as our measuresof human sensitivity.
To fit the aftereffect and sensitivity data for 8-year-olds andadults, it was necessary to vary bandwidth (b) and the standarddeviation of additive internal noise. To fit adults’ data, we set bto 32.5. This value of b corresponds to a full width at half height(FWHH) of 23�, a value similar to that used for young adults(27�) in a previous study using a similar method (Wilson et al.,2011). We set the standard deviation of additive internal noise to.01. These parameter values yielded simulated aftereffect (seeFig. 5C) and rpredicted (see Fig. 5F) values similar to the aftereffect(see Fig. 4A) and r (see Figs. 3 and 4B) values observed in adults.Increasing bandwidths and internal noise by setting b to 14.5(FWHH = 34�) and setting the noise parameter to .05 yieldedsimulated aftereffect (see Fig. 8C) and rpredicted (see Fig. 6F) valuessimilar to the aftereffect (see Fig. 4A) and r (see Figs. 3 and 4B)values observed in 8-year-olds.
The model captures our finding of no significant age differencein sensitivity to head orientation following frontal adaptation,with much lower sensitivity in 8-year-olds than adults following20� side adaptation. Following frontal adaptation, the higherinternal noise (rnoise) in 8-year-olds (see Fig. 6E) is offset by largeperceived differences (d, see Fig. 6D), a pattern leading to onlyslightly lower predicted sensitivity in 8-year-olds than adults(see Fig. 5F and Fig. 6F). Following 20� side adaptation, the higherrnoise in 8-year-olds (see Fig. 6E) is no longer offset by large d (seeFig. 6D), a pattern leading to much lower predicted sensitivity in
−150 −100 −50 0 50 100 1500
0.2
0.4
0.6
0.8
1(A) Tuning curves after adaptation
Rel
ativ
e ne
ural
resp
onse
−60 −40 −20 0 20 40 60
−3
−2
−1
0
1
2
3
(C) Aftereffect size
Afte
reffe
ct s
ize
(deg
)
0 10 20 30 40 50 600
10
20
30
40
50
60(B) Perceived angle after adaptation
−60 −40 −20 0 20 40 600.8
0.9
1
1.1
1.2
1.3(D) Perceived differences
Perc
eive
d di
ffere
nces
−60 −40 −20 0 20 40 600.5
1
1.5
2
2.5
3
3.5(E) Influence of internal noise
−30 −20 −10 0 10 20 300
1
2
3
4(F) Predicted standard deviation
Pred
icte
d st
anda
rd d
evia
tion
Angle between adaptor and test (deg)
Stan
dard
dev
iatio
n of
perc
eive
d he
ad o
rient
atio
n
Perc
eive
d an
gle
betw
een
adap
tor a
nd te
st (d
eg)
Fig. 5. Computational model fit to adults’ data. For each plot, the red line shows the model prediction following adaptation, and the dotted blue line shows the modelprediction without adaptation. For each plot, the x axis shows the difference between the adapting orientation and the test orientation (in degrees), with positive valuesreferring to adapting orientations to the right of the test orientation, and negative values referring to adapting orientations to the left. (A) Relative response of each modelneuron following adaptation. (B) Predicted perceived angle (in degrees) between the adaptor and test. (C) Predicted aftereffect size (in degrees). The black data points showthe mean aftereffect (±1 SE) observed in adults. (D) Predicted perceived differences (d). (E) Standard deviation (rnoise) of perceived head orientation over 10,000 simulatedtrials. (F) Predicted sensitivity (rpredicted), an estimate of sensitivity to head orientation taking into account information from d (panel D) and rnoise (panel E). The black datapoints show the mean standard deviation r (±1 SE) observed in adults. (For interpretation of the references to colour in this figure legend, the reader is referred to the webversion of this article.)
78 M.D. Vida et al. / Vision Research 98 (2014) 72–82
8-year-olds than in adults (see Fig. 5F and Fig. 6F). The model alsocaptures our finding of larger aftereffects following 20� side adap-tation in 8-year-olds than in adults. The wider bandwidths in8-year-olds (see Fig. 6A) cause adaptation to spread over a widerrange of orientations than in adults (see Fig. 5A), a pattern lead-ing to larger predicted aftereffects in 8-year-olds (see Figs. 5 and6C). Hence, our model indicates that developmental changes injudgments of head orientation after age 8 can be modeled as aconsequence of decreasing additive internal noise and decreasingbandwidths.
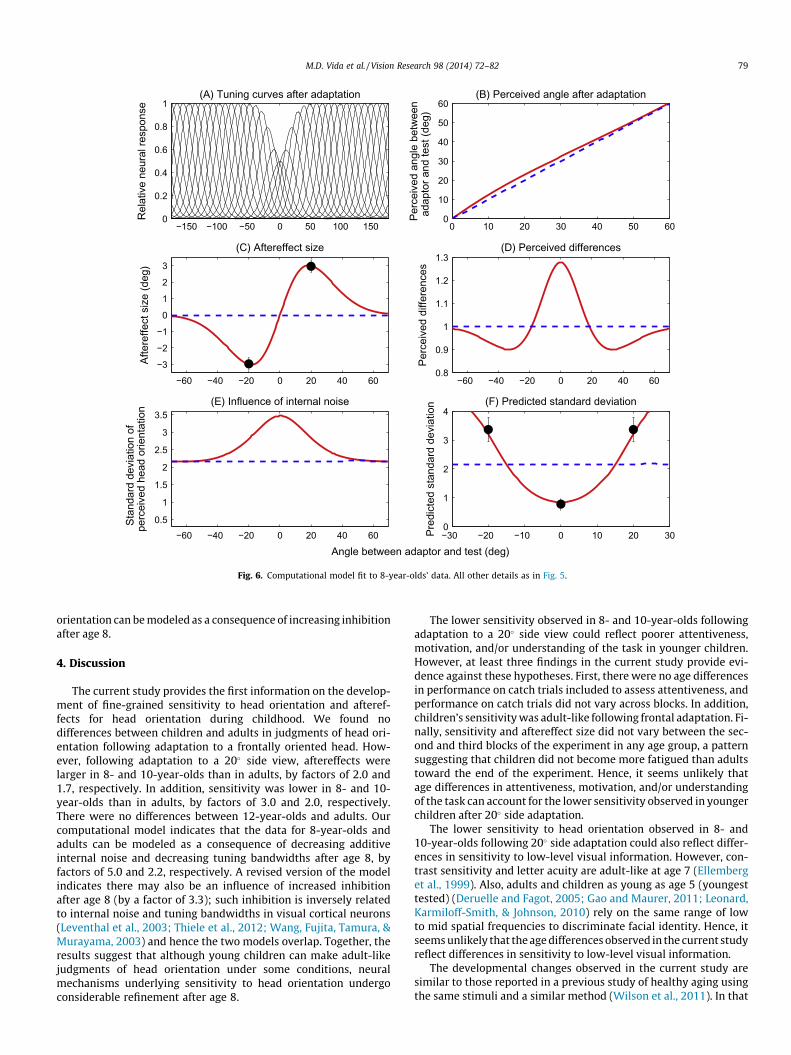
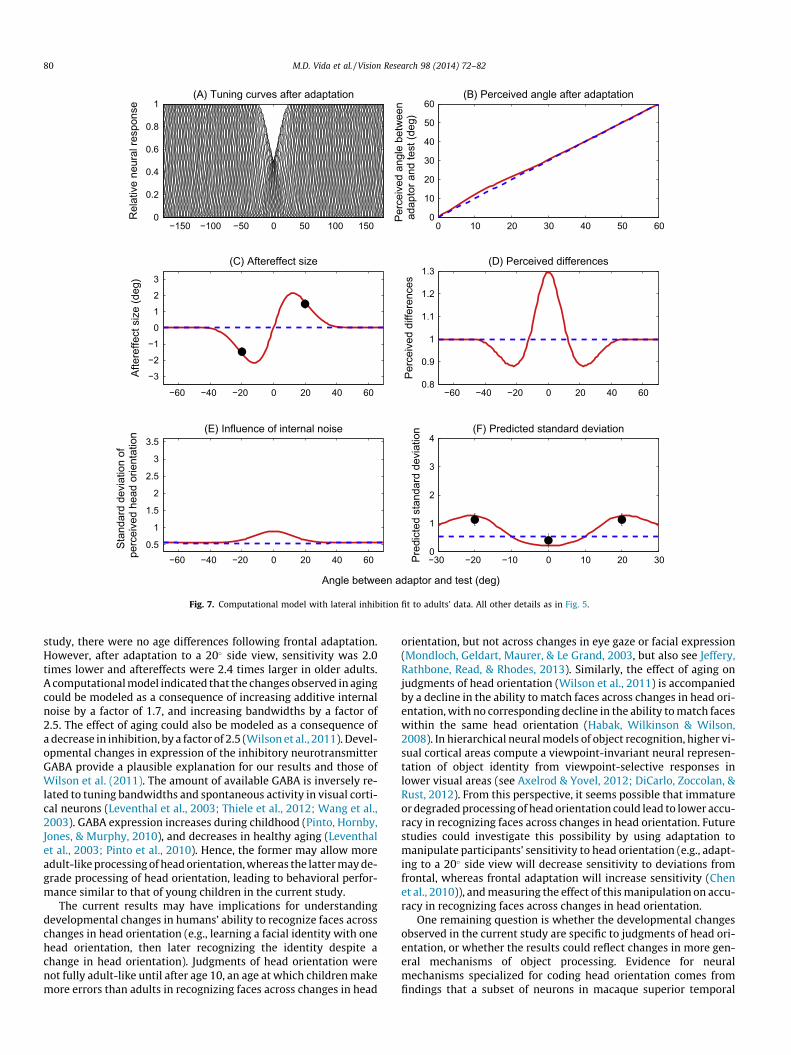
We also investigated whether the developmental changes ob-served during childhood could be modeled as a consequence ofincreasing inhibition after age 8. To test this possibility, we incor-porated lateral inhibition to control the tuning bandwidths of thesimulated neurons, so that increasing inhibition decreased the tun-ing bandwidths. The tuning functions were replaced by:
RwðhÞ ¼ Aw � expfbðcosðh� h0Þ�1Þg�G �Xa¼�1
expfbðcosðh� h0Þ�1Þg" #
þ
þgð4Þ
where G is the gain of lateral inhibition, and a ¼ �1 represents sum-mation over adjacent tuning curves. The subscripted bracket ½X�þ is athreshold function indicating that any negative values of X are set tozero, so that lateral inhibition cannot generate negative responses.The noise termg was set to�0:24Gþ :14. Hence, noise decreased withincreasing inhibition, as is reported physiologically (Leventhal, Wang,Pu, Zhou, & Ma, 2003). We used a spacing of 2:5
�between adjacent tun-
ing curves instead of the 10�
spacing used in the previous version of themodel, because the smaller spacing allowed a slightly smoother dcurve. However, the spacing does not appear to be critical, as we wereable to fit the data equally well with the 10
�spacing. We used a band-
width parameter of 14 (FWHH = 36� ) for both 8-year-olds and adults,so that only G was varied to fit the data as a function of age. All otherdetails were the same as in the previous version of the model. To fitthe data for young adults, we set G to 0.49, a value similar to that usedfor young adults (0.50) in a previous study using a similar method(Wilson et al., 2011). To fit the data for 8-year-olds, we set G to0.15. These parameter values yielded simulated aftereffect (seeFig. 7C and Fig. 8C) and rpredicted (see Fig. 7F and Fig. 8F) values similarto those observed in 8-year-olds and adults. Hence, our refined modelindicates that developmental changes in judgments of head
−150 −100 −50 0 50 100 1500
0.2
0.4
0.6
0.8
1(A) Tuning curves after adaptation
Rel
ativ
e ne
ural
resp
onse
−60 −40 −20 0 20 40 60
−3
−2
−1
0
1
2
3
(C) Aftereffect size
Afte
reffe
ct s
ize
(deg
)
0 10 20 30 40 50 600
10
20
30
40
50
60(B) Perceived angle after adaptation
−60 −40 −20 0 20 40 600.8
0.9
1
1.1
1.2
1.3(D) Perceived differences
Perc
eive
d di
ffere
nces
−60 −40 −20 0 20 40 600.5
1
1.5
2
2.5
3
3.5(E) Influence of internal noise
−30 −20 −10 0 10 20 300
1
2
3
4(F) Predicted standard deviation
Pred
icte
d st
anda
rd d
evia
tion
Angle between adaptor and test (deg)
Stan
dard
dev
iatio
n of
perc
eive
d he
ad o
rient
atio
n
Perc
eive
d an
gle
betw
een
adap
tor a
nd te
st (d
eg)
Fig. 6. Computational model fit to 8-year-olds’ data. All other details as in Fig. 5.
M.D. Vida et al. / Vision Research 98 (2014) 72–82 79
orientation can be modeled as a consequence of increasing inhibitionafter age 8.
4. Discussion
The current study provides the first information on the develop-ment of fine-grained sensitivity to head orientation and afteref-fects for head orientation during childhood. We found nodifferences between children and adults in judgments of head ori-entation following adaptation to a frontally oriented head. How-ever, following adaptation to a 20� side view, aftereffects werelarger in 8- and 10-year-olds than in adults, by factors of 2.0 and1.7, respectively. In addition, sensitivity was lower in 8- and 10-year-olds than in adults, by factors of 3.0 and 2.0, respectively.There were no differences between 12-year-olds and adults. Ourcomputational model indicates that the data for 8-year-olds andadults can be modeled as a consequence of decreasing additiveinternal noise and decreasing tuning bandwidths after age 8, byfactors of 5.0 and 2.2, respectively. A revised version of the modelindicates there may also be an influence of increased inhibitionafter age 8 (by a factor of 3.3); such inhibition is inversely relatedto internal noise and tuning bandwidths in visual cortical neurons(Leventhal et al., 2003; Thiele et al., 2012; Wang, Fujita, Tamura, &Murayama, 2003) and hence the two models overlap. Together, theresults suggest that although young children can make adult-likejudgments of head orientation under some conditions, neuralmechanisms underlying sensitivity to head orientation undergoconsiderable refinement after age 8.
The lower sensitivity observed in 8- and 10-year-olds followingadaptation to a 20� side view could reflect poorer attentiveness,motivation, and/or understanding of the task in younger children.However, at least three findings in the current study provide evi-dence against these hypotheses. First, there were no age differencesin performance on catch trials included to assess attentiveness, andperformance on catch trials did not vary across blocks. In addition,children’s sensitivity was adult-like following frontal adaptation. Fi-nally, sensitivity and aftereffect size did not vary between the sec-ond and third blocks of the experiment in any age group, a patternsuggesting that children did not become more fatigued than adultstoward the end of the experiment. Hence, it seems unlikely thatage differences in attentiveness, motivation, and/or understandingof the task can account for the lower sensitivity observed in youngerchildren after 20� side adaptation.
The lower sensitivity to head orientation observed in 8- and10-year-olds following 20� side adaptation could also reflect differ-ences in sensitivity to low-level visual information. However, con-trast sensitivity and letter acuity are adult-like at age 7 (Ellemberget al., 1999). Also, adults and children as young as age 5 (youngesttested) (Deruelle and Fagot, 2005; Gao and Maurer, 2011; Leonard,Karmiloff-Smith, & Johnson, 2010) rely on the same range of lowto mid spatial frequencies to discriminate facial identity. Hence, itseems unlikely that the age differences observed in the current studyreflect differences in sensitivity to low-level visual information.
The developmental changes observed in the current study aresimilar to those reported in a previous study of healthy aging usingthe same stimuli and a similar method (Wilson et al., 2011). In that
−150 −100 −50 0 50 100 1500
0.2
0.4
0.6
0.8
1(A) Tuning curves after adaptation
Rel
ativ
e ne
ural
resp
onse
−60 −40 −20 0 20 40 60
−3
−2
−1
0
1
2
3
(C) Aftereffect size
Afte
reffe
ct s
ize
(deg
)
0 10 20 30 40 50 600
10
20
30
40
50
60(B) Perceived angle after adaptation
−60 −40 −20 0 20 40 600.8
0.9
1
1.1
1.2
1.3(D) Perceived differences
Perc
eive
d di
ffere
nces
−60 −40 −20 0 20 40 600.5
1
1.5
2
2.5
3
3.5(E) Influence of internal noise
−30 −20 −10 0 10 20 300
1
2
3
4(F) Predicted standard deviation
Pred
icte
d st
anda
rd d
evia
tion
Angle between adaptor and test (deg)
Perc
eive
d an
gle
betw
een
adap
tor a
nd te
st (d
eg)
Stan
dard
dev
iatio
n of
perc
eive
d he
ad o
rient
atio
n
Fig. 7. Computational model with lateral inhibition fit to adults’ data. All other details as in Fig. 5.
80 M.D. Vida et al. / Vision Research 98 (2014) 72–82
study, there were no age differences following frontal adaptation.However, after adaptation to a 20� side view, sensitivity was 2.0times lower and aftereffects were 2.4 times larger in older adults.A computational model indicated that the changes observed in agingcould be modeled as a consequence of increasing additive internalnoise by a factor of 1.7, and increasing bandwidths by a factor of2.5. The effect of aging could also be modeled as a consequence ofa decrease in inhibition, by a factor of 2.5 (Wilson et al., 2011). Devel-opmental changes in expression of the inhibitory neurotransmitterGABA provide a plausible explanation for our results and those ofWilson et al. (2011). The amount of available GABA is inversely re-lated to tuning bandwidths and spontaneous activity in visual corti-cal neurons (Leventhal et al., 2003; Thiele et al., 2012; Wang et al.,2003). GABA expression increases during childhood (Pinto, Hornby,Jones, & Murphy, 2010), and decreases in healthy aging (Leventhalet al., 2003; Pinto et al., 2010). Hence, the former may allow moreadult-like processing of head orientation, whereas the latter may de-grade processing of head orientation, leading to behavioral perfor-mance similar to that of young children in the current study.
The current results may have implications for understandingdevelopmental changes in humans’ ability to recognize faces acrosschanges in head orientation (e.g., learning a facial identity with onehead orientation, then later recognizing the identity despite achange in head orientation). Judgments of head orientation werenot fully adult-like until after age 10, an age at which children makemore errors than adults in recognizing faces across changes in head
orientation, but not across changes in eye gaze or facial expression(Mondloch, Geldart, Maurer, & Le Grand, 2003, but also see Jeffery,Rathbone, Read, & Rhodes, 2013). Similarly, the effect of aging onjudgments of head orientation (Wilson et al., 2011) is accompaniedby a decline in the ability to match faces across changes in head ori-entation, with no corresponding decline in the ability to match faceswithin the same head orientation (Habak, Wilkinson & Wilson,2008). In hierarchical neural models of object recognition, higher vi-sual cortical areas compute a viewpoint-invariant neural represen-tation of object identity from viewpoint-selective responses inlower visual areas (see Axelrod & Yovel, 2012; DiCarlo, Zoccolan, &Rust, 2012). From this perspective, it seems possible that immatureor degraded processing of head orientation could lead to lower accu-racy in recognizing faces across changes in head orientation. Futurestudies could investigate this possibility by using adaptation tomanipulate participants’ sensitivity to head orientation (e.g., adapt-ing to a 20� side view will decrease sensitivity to deviations fromfrontal, whereas frontal adaptation will increase sensitivity (Chenet al., 2010)), and measuring the effect of this manipulation on accu-racy in recognizing faces across changes in head orientation.
One remaining question is whether the developmental changesobserved in the current study are specific to judgments of head ori-entation, or whether the results could reflect changes in more gen-eral mechanisms of object processing. Evidence for neuralmechanisms specialized for coding head orientation comes fromfindings that a subset of neurons in macaque superior temporal
−150 −100 −50 0 50 100 1500
0.2
0.4
0.6
0.8
1(A) Tuning curves after adaptation
Rel
ativ
e ne
ural
resp
onse
−60 −40 −20 0 20 40 60
−3
−2
−1
0
1
2
3
(C) Aftereffect size
Afte
reffe
ct s
ize
(deg
)
0 10 20 30 40 50 600
10
20
30
40
50
60(B) Perceived angle after adaptation
−60 −40 −20 0 20 40 600.8
0.9
1
1.1
1.2
1.3(D) Perceived differences
Perc
eive
d di
ffere
nces
−60 −40 −20 0 20 40 600.5
1
1.5
2
2.5
3
3.5(E) Influence of internal noise
−30 −20 −10 0 10 20 300
1
2
3
4(F) Predicted standard deviation
Pred
icte
d st
anda
rd d
evia
tion
Angle between adaptor and test (deg)
Stan
dard
dev
iatio
n of
perc
eive
d he
ad o
rient
atio
n
Perc
eive
d an
gle
betw
een
adap
tor a
nd te
st (d
eg)
Fig. 8. Computational model with lateral inhibition fit to 8-year-olds’ data. All other details as in Fig. 5.
M.D. Vida et al. / Vision Research 98 (2014) 72–82 81
sulcus respond selectively to images of heads over other body parts(e.g., hands, hair). The majority of these cells respond selectively toa particular head orientation, with the preferred orientationvarying between cells (Perrett et al., 1991; Perrett et al., 1992).The current results could reflect changes in this neural population.However, our results could also reflect changes in more generalmechanisms of object processing. For example, cells in macaqueinferior temporal cortex are tuned to a wide variety of complexshapes, and vary widely in selectivity for viewing angle (seeDiCarlo, Zoccolan & Rust, 2012, for review). Future studies couldevaluate the specificity of the developmental changes observedin the current study by repeating the current study with complexobjects other than heads (e.g., bodies, cars, houses).
Another remaining question is whether the current results arelimited to the perception of head orientation for orientations ator near frontal. It is possible that neural mechanisms underlyingthe perception of head orientation are specialized for orientationsat or near frontal, perhaps because humans receive more experi-ence with this range of orientations than with orientations far fromfrontal. Evidence consistent with this hypothesis comes from thefinding that adults are able to detect smaller differences in headorientation between sequentially presented faces when these facesare oriented around frontal or 15� to the side than when they areoriented around 30� to the side (Wilson et al., 2000). Future studiescould investigate whether neural mechanisms underlying the per-ception of head orientation are specialized for orientations at ornear frontal by repeating the current study with test faces orientedfar from frontal.
5. Conclusions
We examined developmental changes in sensitivity to head ori-entation and head orientation aftereffects during childhood. Wefound no age differences in judgments of head orientation follow-ing adaptation to a frontally oriented head. However, after adapta-tion to a 20� left or right side view, aftereffects were larger andsensitivity was lower in 8- and 10-year-olds than in adults, withno differences between 12-year-olds and adults. We modeled thedata for 8-year-olds and adults as a consequence of decreases inadditive internal noise and neural bandwidths after age 8, and/oras a consequence of increases in inhibition after age 8. Together,these results provide the first evidence that neural mechanismsunderlying the perception of head orientation are refined duringmid to late childhood. These results also provide the first evidenceof parallels between childhood and healthy aging (Wilson et al.,2011) in the development of mechanisms underlying the percep-tion of head orientation, a pattern that could reflect changesthroughout the lifespan in expression of the neurotransmitterGABA (Pinto et al., 2010).
Acknowledgments
We thank Natasha Rana for her valuable assistance in data col-lection. This research was supported by a Natural Sciences andEngineering Research Council (NSERC) Vanier Canada GraduateScholarship (CGS-V) to MDV, a grant from NSERC (9797) to DM,and grants from the Canadian Institutes of Health Research (CIHR)
82 M.D. Vida et al. / Vision Research 98 (2014) 72–82
(172103) and the Canadian Institute for Advanced Research (CI-FAR) to HRW. A preliminary version of the results was presentedat the 2013 European Conference on Visual Perception (ECVP).
References
Axelrod, V., & Yovel, G. (2012). Hierarchical processing of face viewpoint in humanvisual cortex. Journal of Neuroscience, 32, 2442–2452.
Bi, T., Su, J., Chen, J., & Fang, F. (2009). The role of gaze direction in face viewpointaftereffect. Vision Research, 49, 2322–2327.
Brainard, D. H. (1997). The psychophysics toolbox. Spatial Vision, 10, 433–439.Chen, J., Yang, H., Wang, A., & Fang, F. (2010). Perceptual consequences of face
viewpoint adaptation: Face viewpoint aftereffect, changes of differentialsensitivity to face view, and their relationship. Journal of Vision, 10, 1–11.
Clifford, C. W. G., Wyatt, A. M., Arnold, D. H., Smith, S. T., & Wenderoth, P. (2001).Orthogonal adaptation improves orientation discrimination. Vision Research, 41,151–159.
D’Entremont, B., Hains, S. M. J., & Muir, D. W. (1997). A demonstration of gazefollowing in 3- to 6-month-olds. Infant Behavior and Development, 20, 569–572.
Deruelle, C., & Fagot, J. (2005). Categorizing facial identities, emotions, and genders:Attention to high- and low-spatial frequencies by children and adults. Journal ofExperimental Child Psychology, 90, 172–184.
DiCarlo, J. J., Zoccolan, D., & Rust, N. C. (2012). How does the brain solve visual objectecognition? Neuron, 73, 415–434.
Doherty, M. J., & Anderson, J. R. (1999). A new look at gaze: preschool children’sunderstanding of eye direction. Cognitive Development, 14, 549–571.
Ellemberg, D., Lewis, T. L., Maurer, D., Liu, C., & Brent, H. P. (1999). Spatial andtemporal vision in patients treated for bilateral congenital cataracts. VisionResearch, 39, 3480–3489.
Fang, F., & He, S. (2005). Viewer-centered object representation in the human visualsystem revealed by viewpoint aftereffects. Neuron, 45, 793–800.
Fang, F., Ijichi, K., & He, S. (2007). Transfer of the face viewpoint aftereffect fromadaptation to different and inverted faces. Journal of Vision, 7, 1–9.
Gao, X., & Maurer, D. (2011). A comparison of spatial frequency tuning for therecognition of facial identity and facial expressions in children and adults. VisionResearch, 51, 508–519.
Georgopolous, A., Kalaska, J., & Caminiti, R. (1982). On the relations between thedirection of two-dimensional arm movements and cell discharge in primatemotor cortex. Journal of Neuroscience, 2, 527–1537.
Habak, C., Wilkinson, F., & Wilson, H. R. (2008). Aging disrupts the neuraltransformations that link facial identity across views. Vision Research, 48, 9–15.
Holm, S. (1979). A simple sequentially rejective multiple test procedure.Scandinavian Journal of Statistics, 6, 65–70.
Jeffery, L., Rathbone, C., Read, A., & Rhodes, G. (2013). Children’s face identityrepresentations are no more view specific than those of adults. Journal ofExperimental Psychology: Human Perception and Performance, 39, 450–463.
Leonard, H. C., Karmiloff-Smith, A., & Johnson, M. H. (2010). The development ofspatial frequency biases in face recognition. Journal of Experimental ChildPsychology, 106, 193–207.
Leventhal, A. G., Wang, Y. C., Pu, M. L., Zhou, Y. F., & Ma, Y. Y. (2003). GABA and itsagonists improved visual cortical function in senescent monkeys. Science, 300,812–815.
McCullagh, P., & Nelder, J. A. (1989). Generalized linear models. London: Chapmanand Hall.
Mondloch, C. J., Geldart, S., Maurer, D., & Le Grand, R. (2003). Developmentalchanges in face processing skills. Journal of Experimental Child Psychology, 86,67–84.
Perrett, D. I., Hietanen, J. K., Oram, M. W., Benson, E. T., Rolls, P. J., et al. (1992).Organization and functions of cells responsive to faces in the temporal corte.Philosophical Transactions: Biological Sciences, 335, 23–30.
Perrett, D. I., Oram, M. W., Harries, M. H., Bevan, R., Hietanen, J. K., Benson, P. J., et al.(1991). Viewed-centred and object-centred coding of heads in the macaquetemporal cortex. Experimental Brain Research, 86, 159–173.
Pinto, J. G., Hornby, K. R., Jones, D. G., & Murphy, K. M. (2010). Developmentalchanges in GABAergic mechanisms in human visual cortex across the lifespan.Frontiers in Cellular Neuroscience, 4.
Pouget, A., Dayan, P., & Zemel, R. S. (2003). Inference and computation withpopulation codes. Annual Review of Neuroscience, 26, 381–410.
Prins, N., & Kingdom, F. A. A. (2009). Psychophysics: A practical introduction.Academic Press.
Ryu, J., & Chaudhuri, A. (2006). Representations of familiar and unfamiliar faces asrevealed by viewpoint aftereffects. Vision Research, 46, 4059–4063.
Scaife, M., & Bruner, J. S. (1975). The capacity for joint visual attention in the infant.Nature, 253, 265–266.
Thiele, A., Herrero, J. L., Distler, C., & Hoffmann, K. (2012). Contribution ofcholinergic and GABAergic mechanisms to direction tuning, discriminability,response reliability, and neuronal rate correlations in macaque middle temporalarea. The Journal of Neuroscience, 32, 16602–16615.
Turati, C., Bulf, H., & Simion, F. (2008). Newborns’ face recognition over changes inviewpoint. Cognition, 106, 1300–1321.
Wang, Y., Fujita, I., Tamura, H., & Murayama, Y. (2003). Contribution of GABAergicinhibition to receptive field structures of monkey inferior temporal neurons.Cerebral Cortex, 12, 62–74.
Wichmann, F. A., & Hill, N. J. (2001). The psychometric function: I. Fitting, sampling,and goodness of fit. Perception & Psychophysics, 63, 1293–1313.
Wilson, H. R., Loffler, G., & Wilkinson, F. (2002). Synthetic faces, face cubes, and thegeometry of face space. Vision Research, 42, 2909–2923.
Wilson, H. R., Mei, M., Habak, C., & Wilkinson, F. (2011). Visual bandwidths for faceorientation increase during healthy aging. Vision Research, 51, 160–164.
Wilson, H. R., Wilkinson, F., Lin, L. M., & Castillo, M. (2000). Perception of headorientation. Vision Research, 40, 459–472.