Food, Feed, Fuel: Transforming the Competition for Grains Arindam Banerjee ABSTRACT Critical changes are underway in the domain of grain utilization. With the large-scale diversion of corn for the manufacture of ethanol, the bulk of it in the USA, there has been a transformation of the food–feed competition that emerged in the twentieth century and characterized the world’s grain consumption after World War II. Concerns have already been expressed in several quarters regarding the role of corn-based ethanol in the recent foodprice spike and the global food crisis. In this context, this article attempts to outline the the ore tic al tenets of a food–feed–fuelcompetit ionin the domain of grain consumption. The study focuses on developments in the US economy from 1980 onwards, when the earliest initiatives on bio-fuel promotion were undertaken. The transformation of the erstwhile food–feed competition with the introduction of fuel as a further use for grains has caused a new dynamics of adjustments between the different uses of grains. This tilts the distribution of cereal consumption drastically against the low-income classes and poses tougher challenges in the fight against global hunger. INTRODUCTION The world is witnessing critical changes in the domain of grain utilization. With the ongoing efforts to substitute fossil fuels with bio-fuels, there has been a rise in the importance of cereals being used for fuel. This adds a new dimension to the food–feed competition that emerged in the twentieth centur y and particularly chara cteriz ed the world’s use of grains after WorldWar II. 1 The last few years have seen a large-scale diversion of corn, the bulk of it in the United States, to feed the ethanol distilleries. While the I would like to thank three anonymous referees for their comments which substantially improvedthe paper. I thank Utsa Patnaik for her insightful comments during the course of this study. I am also grateful to all participants for their comments and discussions at the Young Scholars’ Seminar at the Centre for Economic Studies and Planning, Jawaharlal Nehru University (14–15 March 2010), where an earlier version of this paper was presented. Needless to say, all errors and omissions are mine. 1. While th e cultivat ion of lives tock produc ts and their con sumpti on have existe d for a long time, large-scale operations in this sector first emerged in the twentieth century. The horizontal and vertical integration in agriculture, the emergence of large transnational foodcorporations in the second half of the twentieth century and the faster growth of income Develop ment and Change 42(2): 529–557. C 2011 International Institute of Social Studies. Pub li shed by Blackwell Publ is hi ng, 9600 Gars ingt on Roa d, Oxford OX4 2DQ, UK and350 Main St., Malden, MA 02148, USA
Transcript
8/10/2019 Banerjee Food, feed and fuel. Transforming the competition for grains
Critical changes are underway in the domain of grain utilization. With thelarge-scale diversion of corn for the manufacture of ethanol, the bulk of itin the USA, there has been a transformation of the food–feed competition
that emerged in the twentieth century and characterized the world’s grainconsumption after World War II. Concerns have already been expressed inseveral quarters regarding the role of corn-based ethanol in the recent food
price spike and the global food crisis. In this context, this article attempts tooutline the theoretical tenets of a food–feed– fuel competition in the domain of grain consumption. The study focuses on developments in the US economyfrom 1980 onwards, when the earliest initiatives on bio-fuel promotion wereundertaken. The transformation of the erstwhile food–feed competition withthe introduction of fuel as a further use for grains has caused a new dynamicsof adjustments between the different uses of grains. This tilts the distributionof cereal consumption drastically against the low-income classes and poses
tougher challenges in the fight against global hunger.
INTRODUCTION
The world is witnessing critical changes in the domain of grain utilization.With the ongoing efforts to substitute fossil fuels with bio-fuels, there has
been a rise in the importance of cereals being used for fuel. This adds anew dimension to the food–feed competition that emerged in the twentieth
century and particularly characterized the world’s use of grains after World War II.1 The last few years have seen a large-scale diversion of corn, the
bulk of it in the United States, to feed the ethanol distilleries. While the
I would like to thank three anonymous referees for their comments which substantially improved
the paper. I thank Utsa Patnaik for her insightful comments during the course of this study. I
am also grateful to all participants for their comments and discussions at the Young Scholars’
Seminar at the Centre for Economic Studies and Planning, Jawaharlal Nehru University (14–15
March 2010), where an earlier version of this paper was presented. Needless to say, all errors
and omissions are mine.
1. While the cultivation of livestock products and their consumption have existed for a long
time, large-scale operations in this sector first emerged in the twentieth century. The
8/10/2019 Banerjee Food, feed and fuel. Transforming the competition for grains
amount of corn used for ethanol grew by around 60 per cent in the 1990s,the annual diversion of corn for ethanol production in 2008/9 was roughlysix times that of 2000/1 (calculations based on data from the USDA Feed-
Grains Database). The corn-ethanol industry has simultaneously undergonea massive expansion.2 This probably has more serious implications than firstmeet the eye.
While concerns over climate change and the urge to reduce carbon emis-sions have boosted the production of bio-fuels and bio-diesels in a number of countries in recent years, the effort to substitute gasoline with bio-fuelsdates back to the mid-1970s when Brazil first adopted the strategy to replacegasoline by ethanol, manufactured from sugarcane.3 Brazil was quickly fol-lowed by the US when it started supporting the production of ethanol from
corn through the 1978 Energy Act.4 Several other countries, including NewZealand, Australia and Austria in the developed world and South Africa,Sudan and Thailand among the developing nations, started exploring thefeasibility of bio-fuel production in the 1980s. At that juncture, it was theoil-shock of the 1970s more than environmental concerns that drove the pushto reduce dependence on crude oil and motivated policy makers to searchfor alternative, economically viable energy sources.
The trajectory along which ethanol production from corn in the US hasdeveloped since 1980 reveals that the linkages between crude oil prices and
bio-fuel production are currently stronger than ever. Whether the substitutionof fossil fuels with bio-fuels serves the purpose of reducing greenhouse gas(GHG) emissions or not is a contentious issue but that is not the primaryconcern of this article. My central focus is to investigate the impact of large-scale grain-based fuel production on the overall grain-use equilibrium (i.e.the balance between the different possible uses for grains), particularly indeveloped nations. This has widespread implications for the whole world
but particularly for the global south where hunger is an everyday reality of life.
The primary aim of the article is to illuminate the theoretical tenets of the food–feed–fuel competition with an empirical analysis of grain use in
and demand for animal products in the developed world since World War II, have resulted
in the contemporary food–feed competition (Warnock, 1987; Yotopoulos, 1985).2. The production of ethanol in the US, which barely doubled in the whole of the 1990s, has
surged in the 2000s. The annual ethanol output in 2007 was more than five times that in
2000 (based on data from the Renewable Fuels Association, USA — ‘Historical US Fuel
Ethanol Production’, Industry Statistics: http://www.ethanolrfa.org/pages/statistics#A).3. Brazil launched an alcohol-fuel programme based on sugarcane feedstocks in 1975 with an
estimated US$ 5 billion subsidy to support the National Alcohol Programme over the nextten years (Brown, 1980).
4 The Energy Act of 1978 exempted every gallon of gasohol (gasoline blended with ethanol)
8/10/2019 Banerjee Food, feed and fuel. Transforming the competition for grains
Food, Feed, Fuel: Transforming the Competition for Grains 531
the US since 1980. The discussion also touches upon the recent global food crisis, which testifies to the fact that the integration of oil and grain priceshas been reinvigorated in recent times with the emergence of the ‘new’
demand linkages. Finally, some possible spatial and temporal ramificationsof expanding grain-based bio-fuels production are briefly dealt with from a
broader and longer-term point of view.
THE CONTOURS OF FOOD–FEED COMPETITION
In a sense, the use of grains for ethanol production ‘externalizes’ (moreon this term later) the grain-use equilibrium that had evolved over the lastcentury. The transition from food–feed to food–feed–fuel competition for grains implies that the grain-use equilibrium comes to be intricately linked with the movement of oil prices. In this context, it would be useful to revisitthe theoretical foundations of the grain-use equilibrium before we explorethe more recent developments.
The composition of the end utilization of grains has been influenced bymultiple factors in the history of development. Rising incomes play a major role in the diversification of diets towards more meat products, causing anenhanced use of grains as animal feed. Rapid urbanization and changinglifestyles of population, which accompany modern development processes,also cause a higher demand for meat products.5 In a seminal article writtenin 1985, Yotopoulos had theorized the relationship between the food use and feed use of grains and how it unfolds with rising incomes and the graduationof people from lower to higher income classes. He identified the growth of
population and growth in incomes as the two sources of rising demand for grains in the world. This is expressed by the following relation:
.
D =.
N+ e..y (1)
where.
D,.
N, and .y, are the growth rates of the total demand for grains,
population and per capita real income over time. In relation (1), ‘e’ is theelasticity of food demand with respect to income. The elasticity of demand for food with respect to population was assumed to be unity.
There are two basic tenets of the Yotopoulos hypothesis. First, the elas-ticity of demand for the middle-income classes is higher than for the lower classes due to the high indirect consumption of grains in the form of ani-mal products by the former. As income rises, the expanding middle-incomeclasses consume more meat and diary products leading to a much higher demand for grains (indirectly as feed) given the poor conversion ratios
8/10/2019 Banerjee Food, feed and fuel. Transforming the competition for grains
between grains and animal products.6 The income elasticity of feed demand for the middle-income classes is also higher than for the richer classes. Atvery high levels of income and food consumption, a rise of income amongstthe uppermost classes in society causes a relatively small increase in their expenditure on food consumption; rather, their consumption of non-food items and savings increase much faster with rising incomes. This differen-
tial rise in demand for grains with growing incomes was demonstrated bythe 1974–5 food consumption data for Tunisia (Yotopoulos, 1985: 474–5).
The combination of direct and indirect consumption of grains constitutesthe total demand for grains in any single economy or for the world as awhole. Figure 1 represents this demand curve for grains as income levels rise.The changes in dietary patterns of different income classes with increasesin income explain the very high per capita consumption of grains in thedeveloped countries with high per capita incomes. With higher incomes and larger middle- and rich-income classes, the total demand for grains, both
direct and indirect, is much higher in the developed countries compared
8/10/2019 Banerjee Food, feed and fuel. Transforming the competition for grains
Food, Feed, Fuel: Transforming the Competition for Grains 533
with the rest.7 The elasticities computed by Yotopoulos for the period 1966– 80 also show that feed elasticities were higher than the food elasticities inall regions including less developed regions.
The other major theoretical aspect is that the food–feed competition occursin a dynamic setting. The competition for grains is based on the linkage
between the food and feed markets that exist as soft grains are also fed toanimals for livestock production. The demand for meat products rises withincreasing income and pushes up the meat price over time; this leads to anincrease in livestock production which demands more animal feed, whichincreases feed-grain prices, and grains are diverted from food use to feed use. In a situation where the supply of feed grains is insufficient to meetthe rising demand, soft grains like wheat or corn are also used as animal
feed, leading to a rise in food prices. This increase in food prices deflatesthe real income of the poorer classes relatively more than that of the middleand richer classes, as the former consume larger proportions of grain directlycompared with the others. Thus, a redistribution of grain consumption acrossdifferent income classes is accomplished with the richer classes corneringa greater share of grains through their indirect consumption. The level of food and feed price rises and the extent to which this redistribution takes
place depend on the corresponding elasticities of food and feed demand withrespect to real income for the different classes.8 The food–feed competition
essentially operates through an adjustment of prices and can have differentoutcomes under different combinations of demand elasticities. This can beassumed to be occurring within the boundaries of a country as well as in theworld as a whole.
Interestingly, while this is generally a gradual occurrence, there is a coun-tervailing process in the short run that is intrinsic to the food–feed compe-tition. In case of any short-run grain supply shortfall, particularly in highincome countries where animal products form a significantly large compo-nent in the average diet and the corresponding livestock herd in the economy
7. The per capita consumption of food grains in a developing region like South Asia was
roughly 166 kg in 1980. In the same year, the figure in the USA was nearly 739 kg
and in the European Union (EU-15) was around 485 kg of food grains (based on World
Agricultural Supply and Demand Estimates — WASDE — published by the USDA).8. In the case of developed countries like the US, the diet composition across income classes is
slightly more complex. Given that an economy like the US has already walked a long path
of food transition (towards higher indirect consumption of grains through animal products
by its sizeable middle classes), a major portion of the grains are used as animal feed. The
low-income classes also consume cheap, low quality meat products. As a result, we find
that only around one-eigth of the total grains consumed are done so directly. A significantamount of grains (around one-tenth) is also consumed as processed food. However, it can
be observed from nutritional data that even in the US the lower socio economic classes
8/10/2019 Banerjee Food, feed and fuel. Transforming the competition for grains
is also substantial, the livestock herd plays the role of a cushion or buffer which can absorb minor or major shocks arising due to grain productionshortfalls. A fall in production and supply of grains, especially coarse cere-
als used as animal feed, causes an increase in feed-grain prices. This leadsto a rise in meat prices and a fall in the demand for meat. This happens moresignificantly in economies with a fairly large and expanding middle classwhose income elasticity for feed demand is high. Any consequent cutback inlivestock feeding releases large volumes of grains for direct consumption asfood. In the early 1970s, steep reductions in livestock feeding were observed in the US (Yotopoulos, 1985: 478).
In the long-run redistribution of grains between income classes, whether the consumption of the poorer classes is actually depressed (or ‘crowded
out’, to use Yotopoulos’s term) depends on the relative income elasticitiesof food and feed consumption of the different classes. The extent of the food
price rise is determined by the income elasticity of the feed-grains demandsof the middle and richer classes. When the middle classes are not very largein size and the bulk of the demand for feed originates from the rich eliteclasses, the overall income elasticity of feed demand is low in the economy.In such cases, a much greater price increase is required to release feed grainsfor food use so that the supply shortfall in grains can be mitigated. In the
process, there is a more adverse effect on the real incomes of the poorer
classes, who may end up finding it difficult to maintain their subsistencelevel grain consumption. This will be typical of a less developed countrywith large income inequalities.
This ‘crowding out’ of food demand was observed for Africa byYotopoulos in the late 1960s and 1970s. The total demand for grains was de-clining and that for direct consumption of food was stagnating in this period even as the income elasticities for feed demand were higher in Africa thananywhere else in the less developed world. There may also be other scenariosin which demand for food would decline or stagnate. In countries with high
per capita grain consumption and more than required calorie intakes, a fallin the demand for food can occur due to a shift towards animal products bylarge sections of the population for the purpose of improving their nutritionalstatus. This happened in the centrally planned economies between 1966 and 1980 as a result of the government policy of providing large meat subsidiesaimed at improving the quality of diets of their population on an egalitarian
basis (Yotopoulos, 1985: 469–71). This was accompanied by the fastest risein demand for grains in these countries experienced anywhere in the world during this period. Poor countries like those in Africa with declining average
per capita total demand for grains did not enjoy this luxury.I have outlined the hypothesis and findings of Yotopoulos for the period
8/10/2019 Banerjee Food, feed and fuel. Transforming the competition for grains
Food, Feed, Fuel: Transforming the Competition for Grains 535
competition can be best understood when we contrast the features and dy-namics of the ‘new’ competition of grains with that which had evolved inthe post World War II period.
THE TRANSITION FROM FOOD–FEED TO FOOD–FEED–FUEL
The competition to food from bio-fuels can occur at multiple levels. First, itcan be observed in the domain of production. A bio-fuel like ethanol, whichis chemically a hydro-carbon, can be produced from any crop that containssugar. While ethanol can be produced from cereals like wheat or corn, it canalso be extracted from sugarcane and its by-products, sugar beets or sweet
sorghum. A higher price for bio-fuels can generate competition for arablelands, natural resources and even financial capital and investments and candisplace the production of food crops in favour of the non-cereal crops thatare used as feedstocks in bio-fuel distilleries. The expansion of bio-fuelsdemand can also lead to environmental concerns regarding degradation of natural habitat and loss of forests and embedded resources. Such concerns arealready a reality in the Brazilian natural forests in Cerrado, home to some of the rarest and and most endangered species on the planet, and the SoutheastAsian rainforests, which run the risk of being destroyed, along with their
mega-fauna, by rapidly expanding palm oil plantations (Worldwatch, 2007).The destruction of natural habitat can also adversely affect the food securityof ethnic communities dependent for their livelihood on forest resources.
The competition generated by bio-fuels or bio-diesels for natural re-sources, including arable land, is of serious concern and warrants carefulstudies and assessments. This article, however, focuses on the competi-tion for cereals caused by grain-based bio-fuels (and specifically corn-based ethanol) at the level of grain consumption or use.9 In a situation where thereis no apparent reduction in food crop production, there is still an intensified
competition for grains between food, feed and fuel. When grains (corn inthe US) are used for fuel use (ethanol), new contours emerge in the former food versus feed competition. Various changes occur in the nature of thecompetition and new factors surface as the drivers of this competition.
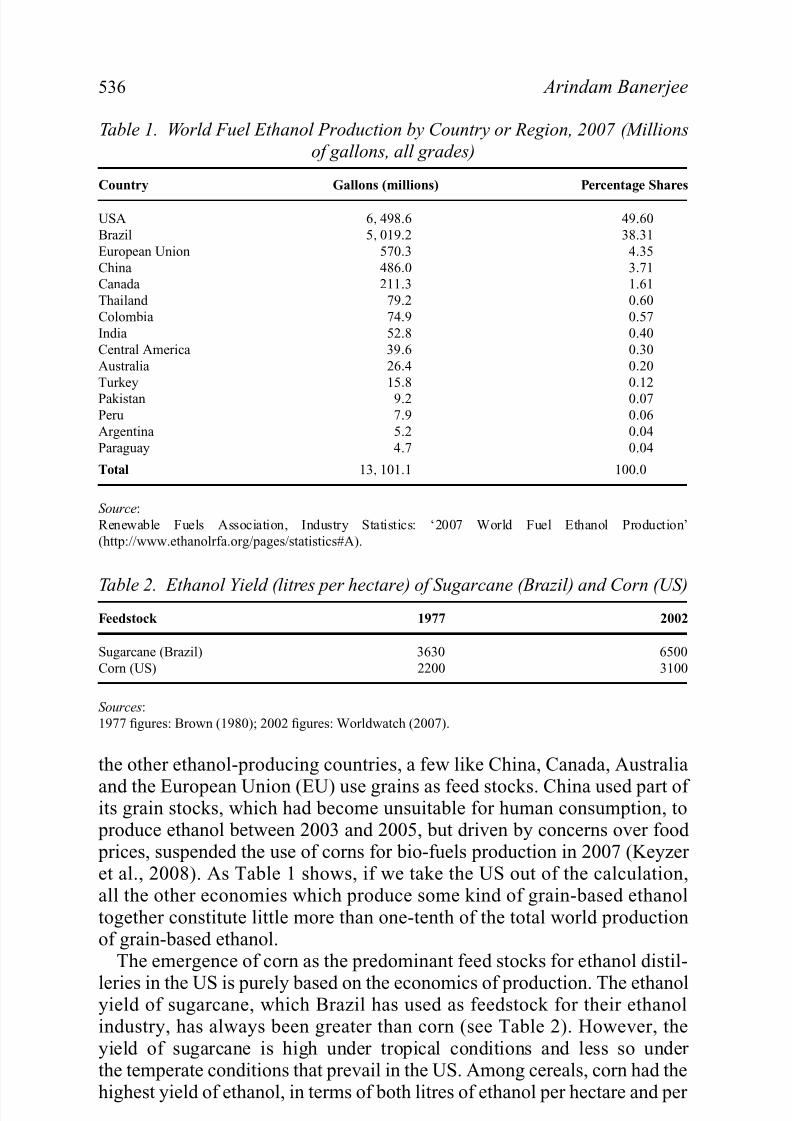
This study focuses on the US economy because the bulk of the productionof grain-based ethanol is presently located there (see Table 1). The US
produced nearly half (49.6 per cent) of the world ethanol in 2007. The onlyother country that produces a significant amount of ethanol is Brazil (38.3 per cent), where it is manufactured not from grains but from sugarcane. Among
9 For non grain feed stocks like soybean oil which is used for producing bio diesel a similar
8/10/2019 Banerjee Food, feed and fuel. Transforming the competition for grains
Table 1. World Fuel Ethanol Production by Country or Region, 2007 (Millions
of gallons, all grades)
Country Gallons (millions) Percentage Shares
USA 6, 498.6 49.60
Brazil 5, 019.2 38.31
European Union 570.3 4.35
China 486.0 3.71Canada 211.3 1.61
Thailand 79.2 0.60
Colombia 74.9 0.57
India 52.8 0.40
Central America 39.6 0.30
Australia 26.4 0.20
Turkey 15.8 0.12Pakistan 9.2 0.07
Peru 7.9 0.06
Argentina 5.2 0.04
Paraguay 4.7 0.04
Total 13, 101.1 100.0
Source:
Renewable Fuels Association, Industry Statistics: ‘2007 World Fuel Ethanol Production’
(http://www.ethanolrfa.org/pages/statistics#A).
Table 2. Ethanol Yield (litres per hectare) of Sugarcane (Brazil) and Corn (US)Feedstock 1977 2002
Sugarcane (Brazil) 3630 6500
Corn (US) 2200 3100
Sources:
1977 figures: Brown (1980); 2002 figures: Worldwatch (2007).
the other ethanol-producing countries, a few like China, Canada, Australia
and the European Union (EU) use grains as feed stocks. China used part of its grain stocks, which had become unsuitable for human consumption, to
produce ethanol between 2003 and 2005, but driven by concerns over food prices, suspended the use of corns for bio-fuels production in 2007 (Keyzer et al., 2008). As Table 1 shows, if we take the US out of the calculation,all the other economies which produce some kind of grain-based ethanoltogether constitute little more than one-tenth of the total world productionof grain-based ethanol.
The emergence of corn as the predominant feed stocks for ethanol distil-
leries in the US is purely based on the economics of production. The ethanolyield of sugarcane, which Brazil has used as feedstock for their ethanol
8/10/2019 Banerjee Food, feed and fuel. Transforming the competition for grains
unit cost of production (Brown, 1980) and given that corn was already beinggrown in the US on a large scale, primarily for feed in the livestock industry,it readily emerged as the leading feedstock for ethanol distilleries.
THE CORN-BASED ETHANOL INDUSTRY IN THE USA
Let us now look at developments in the domain of grain use in the era of corn-based ethanol. We can divide the history of the ethanol industry inthe US into two phases that have quite different characteristics, namely the
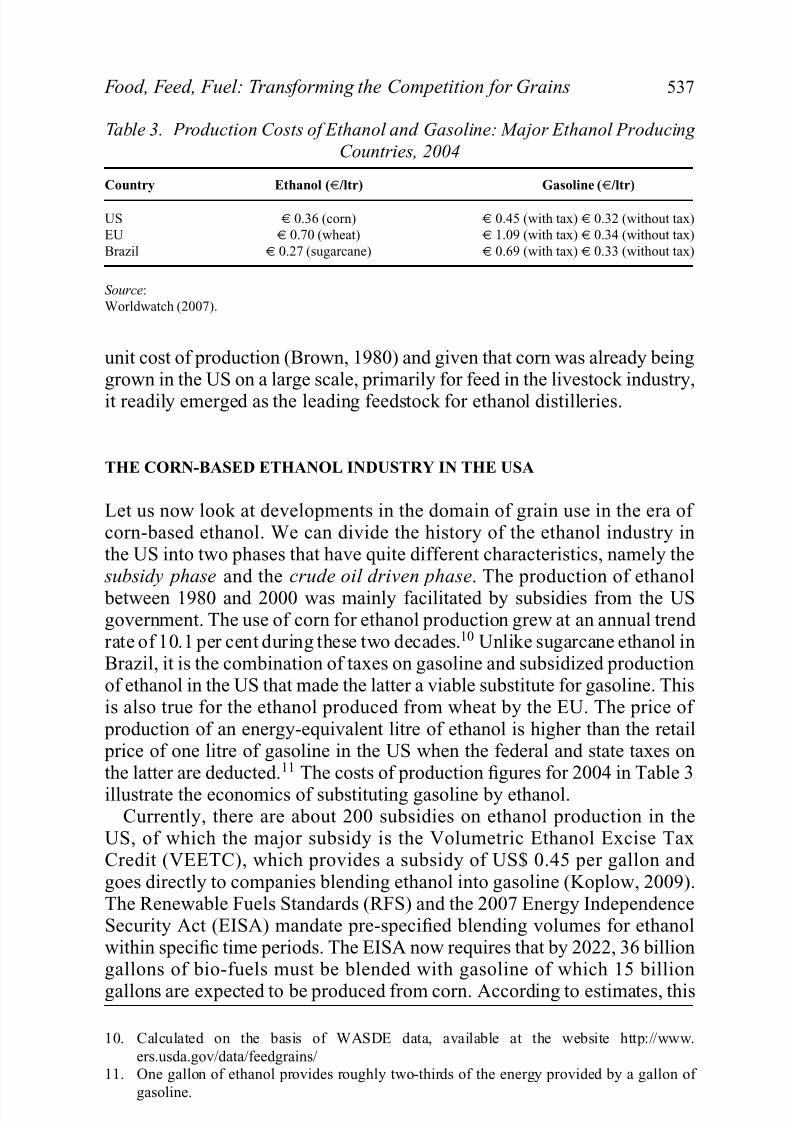
subsidy phase and the crude oil driven phase. The production of ethanol between 1980 and 2000 was mainly facilitated by subsidies from the USgovernment. The use of corn for ethanol production grew at an annual trend rate of 10.1 per cent during these two decades.10 Unlike sugarcane ethanol inBrazil, it is the combination of taxes on gasoline and subsidized productionof ethanol in the US that made the latter a viable substitute for gasoline. Thisis also true for the ethanol produced from wheat by the EU. The price of
production of an energy-equivalent litre of ethanol is higher than the retail price of one litre of gasoline in the US when the federal and state taxes onthe latter are deducted.11 The costs of production figures for 2004 in Table 3illustrate the economics of substituting gasoline by ethanol.
Currently, there are about 200 subsidies on ethanol production in theUS, of which the major subsidy is the Volumetric Ethanol Excise TaxCredit (VEETC), which provides a subsidy of US$ 0.45 per gallon and goes directly to companies blending ethanol into gasoline (Koplow, 2009).The Renewable Fuels Standards (RFS) and the 2007 Energy IndependenceSecurity Act (EISA) mandate pre-specified blending volumes for ethanolwithin specific time periods. The EISA now requires that by 2022, 36 billiongallons of bio-fuels must be blended with gasoline of which 15 billiongallons are expected to be produced from corn. According to estimates, this
8/10/2019 Banerjee Food, feed and fuel. Transforming the competition for grains
Figure 2. Crude Oil Prices (Domestic First Purchase) in USA: 1983 to 2009
0
10
20
30
40
50
60
70
80
90
100
1 9 8 3
1 9 8 5
1 9 8 7
1 9 8 9
1 9 9 1
1 9 9 3
1 9 9 5
1 9 9 7
1 9 9 9
2 0 0 1
2 0 0 3
2 0 0 5
2 0 0 7
2 0 0 9
$ p e r b a r r e l
Source: Crude oil annual prices historical series, US Energy Information Administration(www.eia.doe.gov).
target will require an accumulated subsidy of US$ 420 billion between 2008and 2022. The 2008 level of US$ 9.5 billion annual subsidy to the ethanolindustry is expected to rise to US$ 60 billion by 2022 (ibid.).
In reality, the actual subsidies required to fulfil the EISA targets may beless if the crude oil price continues at its current high levels. In the second
period of our analysis, from 2001 to 2009, ethanol production increased exponentially, driven by high crude oil prices. In the period after 2001,when oil prices started surging, and given the gasoline taxes and carboncredits to bio-fuels that were already in place, ethanol production began to
expand briskly. It moved into the competitive zone and made substitutionof gasoline with gasohol (gasoline blended with ethanol) profitable once the
price for crude crossed the US$ 55 per barrel mark in 2005/6 (Figure 2). Thecorresponding annual trend growth rate of corn use for ethanol production
between 2001/2 and 2008/9 was a staggering 25.7 per cent.12 The crash inthe oil prices following the financial crisis of 2007/8 caused considerablestress on the margins of the ethanol industry, but the situation eased as theoil price started to rise again in the later months of 2009. We shall now look at the varying impact of ethanol production on the competition for grains in
these two periods, in the light of the modern food–feed competition outlined in the previous section.
8/10/2019 Banerjee Food, feed and fuel. Transforming the competition for grains
Food, Feed, Fuel: Transforming the Competition for Grains 541
Table 4. Income Elasticity of Food, Feed and Fuel demand in USA:
1980/1 to 2000/1
Use category Income Elasticity
Food 0.30Feed 0.01
Fuel 1.68
Total cereals 0.14
Source:
Estimated by the author using WASDE and WDI database.
This high elasticity was partly due to the low base effect, as there wasnegligible corn use for ethanol at the beginning of the period.
The elasticities reveal quite a dissimilar picture from that observed byYotopoulos between 1966 and 1980.14 This reversal of the situation withregard to food and feed elasticities warrants some explanation on the basisof the developments that were occurring in the US food economy. However,
before that discussion, I will briefly clarify some specifics of the data for the sake of precision. The food demand component used in the analysis has
been residually derived by deducting feed and fuel use from the total cerealdemand. Apart from food use, this residual component also includes seed,waste and other uses (such as non-food processing uses, e.g. the manufactureof oil for soap).
The USDA WASDE dataset does not supply data separately for thesecategories, but the FAO Food Balance Sheets (FBS)15 does. On the other hand, the drawback with the FBS is that it does not provide any informationon the use of grains for bio-fuels (ethanol) manufacture separately as of now, whereas the WASDE does. To resolve this conundrum, the FBS datawere also used, and the information on fuel use of grains available from theWASDE was superimposed on them for a re-examination. The FBS data givea category called ‘processing’ which includes all food and non-food (mainlyfuel) processing. Deducting the WASDE data on corn use for ethanol fromthis category, we can obtain the residual food-processing component.
My calculations using the FBS dataset reveal that the category of seed and other utilization (including waste) together constituted a mere 4.4 per cent of total grain use on average during the entire period between 1980/1and 2005/6. Food use alone constituted 12.5 per cent and ‘food along withfood-processing’ comprised 22.5 per cent of total grain use. When we recal-culate the income elasticity for food demand after excluding seed and other utilization between 1980/1 and 2000/1, it is 0.35 (only food) and 0.38 (for
14 Yotopoulos (1985) had estimated the income elasticities for market developed countries
8/10/2019 Banerjee Food, feed and fuel. Transforming the competition for grains
food plus food-processing), only slightly higher than the earlier estimationusing WASDE data. The non-exclusion of seed and other utilizations doesnot pose any major problem due to the minor share of these use categories.
We can now return to the issue of why, in contrast to earlier experiences,the income elasticity of food is now higher than that for feed. There are at leastthree reasons behind the stagnation exhibited by feed use demand for grainsafter 1980. First, the period which Yotopoulos studied was characterized bya high rate of growth in cereal output. The annual growth rate of total grainoutput in the world in 1966–80 was 2.9 per cent which was much higher than the 1.3 per cent in 1980/1 to 2000/1. For the US, these figures were3.3 and 0.9 per cent respectively for the two periods.16 Naturally this slower growth in cereals output put a constraint on feed supplies and prevented fast
increases in animal product consumption as had happened in the 1960s and 1970s. The second reason lies in the introduction of subsidized productionof ethanol from corn. Although feed use retained its role as a buffer for supply fluctuation, there was much lesser space for feed demand to growfaster without jeopardizing the demand for food in an absolute sense. The
per capita corn use for ethanol production grew at an annual rate of 8.7 per cent during this period. The ethanol subsidies prevented any faster increaseof feed use in the livestock industry.
Third and finally, we must also recognize the dietary changes that have
been occurring in the US since the 1980s. The nutritional history of the USreveals that the intake of meat and poultry were declining between 1909and 1939, roughly the period between the two World Wars. In the 1940s,this trend turned positive and animal product intakes by the US consumer increased rapidly until the 1970s (Page and Friend, 1978). However, there has
been considerable substitution of animal products by processed cereals/foodsin the average diet in the US since 1976/7. It was noted as early as 1993that the US diet was shifting: using the 1977/8 and 1987/8 National Food Consumption Survey data of the US, Popkin (1993) identified significant
increases in the consumption of low-fat pasta dishes, low-fat poultry and high-fat grain and pasta dishes between 1977 and 1987. These food itemsdisplaced the consumption of medium and high-fat red meat. A later study
by Popkin et al. in 1996 confirmed that there has been a significant reductionin consumption of high-fat red meat for both high and low socio-economicclasses among the white as well as the black population in the US.17 Theconsumption of other food items like bacon and low-fat red meat has alsodeclined. Such changes in dietary patterns in the US are also responsible for the relatively low increase in feed demand that we witness after 1980.
16 All growth rates of grain production are calculated based on USDA’s WASDE estimates
8/10/2019 Banerjee Food, feed and fuel. Transforming the competition for grains
Food, Feed, Fuel: Transforming the Competition for Grains 543
However, what is central to our interest is that during this period, feed demand continued to play the role of a shock-absorber adjusting to changesin the grains supply in the short run. This allowed the low-income classes
to maintain their direct consumption of grains and not get crowded out by the food–feed competition. In the next section, we will trace the morefundamental changes that have emerged in the grain-use equilibrium since2001, when ethanol production in the US has been driven by the high and surging crude oil prices.
The Crude Oil Driven Phase
The decade of the 2000s witnessed the rapid expansion of corn-based ethanol
production with a surge in crude oil prices and consequently high ethanol prices. Between 1980 and 2001, the production of ethanol was mainly sus-tained by the subsidies provided by the US government. Although thesesubsidies rendered ethanol an economically viable replacement for gaso-line, there was no boom in production since any increase in production alsomeant a concomitant increase in the government subsidy. Since the latter isconstrained by several factors and is essentially an external policy decision,the ethanol industry expanded only by the extent to which the governmentallowed, through its quota of subsidies.
This situation changed when crude oil prices, and correspondingly gaso-line prices, started to increase to a level where ethanol emerged as a cheaper option for running cars, even without any government subsidy. This momentwas reached when the crude oil price crossed the US$ 55 per barrel mark in 2005. Withdrawing subsidies once the oil price has moved beyond thismark poses no danger to the ethanol industry, although the profit marginswould decrease to some extent. Nevertheless, the strong corn-ethanol indus-try lobby, led by large players such as ADM and Cargill, managed to ensurethat the government continued to provide the ‘not so necessary’ subsidies.
With the subsidies in place, ethanol production had started to increase assoon as oil prices started to increase after 2002. The expansion of ethanol
production from corn exactly corresponds to the surge in the crude oil priceas portrayed by Figure 4. The demand for ethanol, which increased at a fastrate even in the earlier period, exploded in the era of high crude prices. Theannual growth rate of per capita corn use for ethanol production between2000/1 and 2008/9 was a remarkable 24.5 per cent.
We can now examine the intrinsic changes that have occurred with regard to grain use in the US. Figure 3 demonstrated that the total per capita
consumption of grains rose at a faster pace in the second period compared with the first period.18 Among the three components of grain use, only fuel
8/10/2019 Banerjee Food, feed and fuel. Transforming the competition for grains
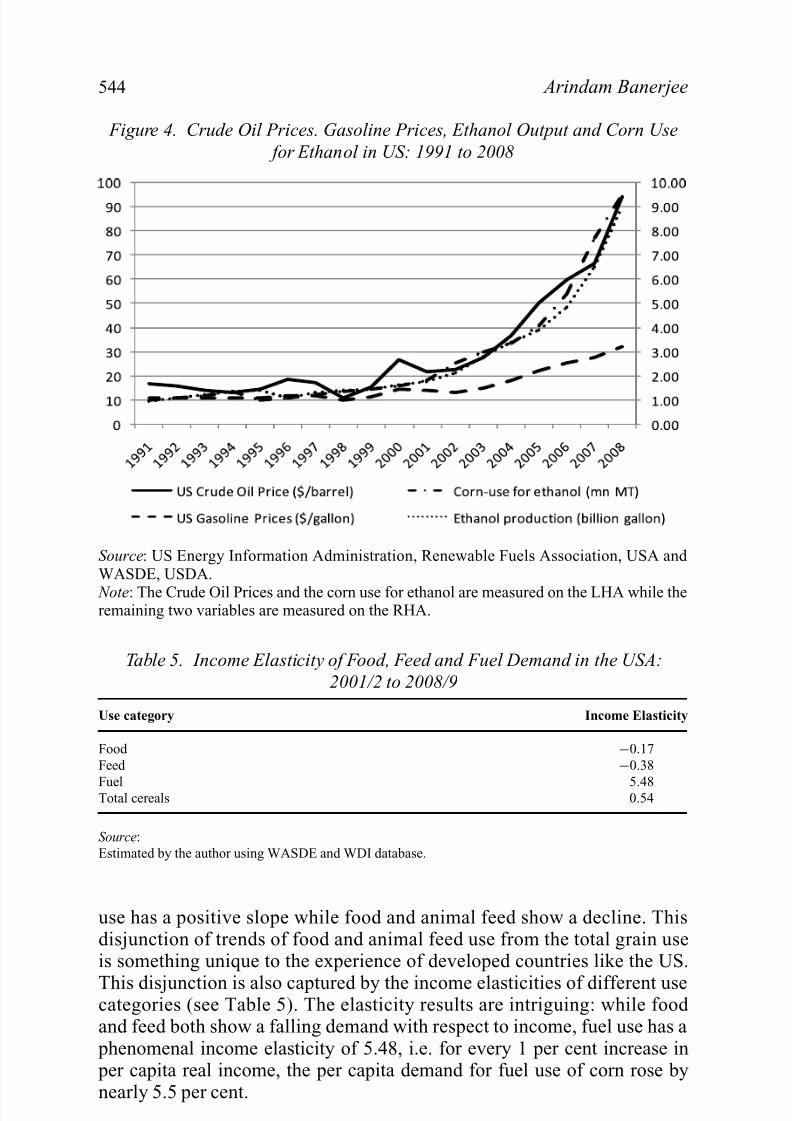
Figure 4. Crude Oil Prices. Gasoline Prices, Ethanol Output and Corn Use
for Ethanol in US: 1991 to 2008
Source: US Energy Information Administration, Renewable Fuels Association, USA and WASDE, USDA.
Note: The Crude Oil Prices and the corn use for ethanol are measured on the LHA while theremaining two variables are measured on the RHA.
Table 5. Income Elasticity of Food, Feed and Fuel Demand in the USA:
2001/2 to 2008/9
Use category Income Elasticity
Food −0.17
Feed −0.38
Fuel 5.48Total cereals 0.54
Source:
Estimated by the author using WASDE and WDI database.
use has a positive slope while food and animal feed show a decline. Thisdisjunction of trends of food and animal feed use from the total grain useis something unique to the experience of developed countries like the US.
This disjunction is also captured by the income elasticities of different usecategories (see Table 5). The elasticity results are intriguing: while food
8/10/2019 Banerjee Food, feed and fuel. Transforming the competition for grains
Food, Feed, Fuel: Transforming the Competition for Grains 545
Since grain prices have risen exceptionally in this period (at a much higher rate than the general inflation rate), it is necessary to account for the own
price effect on food demand separately.19 Rising grain prices depress the
demand for food and feed to the extent that demand falls even when realincome growth rates are positive. With higher ethanol and corn prices, theown price effect should also have reduced the demand for ethanol and fueluse of grains, in which case the total demand for grains should have declined.Interestingly, this did not happen. Instead, the expansion of fuel use demand caused the total grain demand to also rise, offsetting the negative effect of higher prices on food and animal feed demand. What then is the source of such a high and unexpected demand for fuel use of grains? The answer tothat question leads us to explore the new paradigms of grain competition
that have emerged as a result of using grains for bio-fuel production.It is evident from the elasticity results that an additional factor existed
which generated demand for grains, apart from the factors of populationand income that we have considered so far. The crucial transformation thatoccurred in the character of competition for grains was its new linkage withcrude oil prices. The food–feed competition of the post World War II period was based on the changes in dietary patterns which occurred along withrise in incomes. In the present situation, the demand for corn for ethanol
production is not generated primarily by rising incomes but by the rise in
crude oil prices. As ethanol is a substitute for crude oil, the corn use demand,derived from ethanol demand, has a positive cross-price elasticity with oil
prices. As oil prices increase, the demand for corn as fuel feedstock willincrease to the extent determined by this cross-price elasticity. Thus, thecurrent demand for grains is determined additionally by oil prices, which iscaptured by the new demand function for grains (relation 2):
D = D( N , y, p g , pc) (2)
where ‘D’ is the demand for grains, ‘pg’ is the composite grain price, ‘pc’ isthe crude oil price and ‘N’ and ‘y’ are population and per capita real incomerespectively. The earlier grain demand function (relation 1) modifies as grain
prices and crude oil price come in to the scenario. The oil price elasticityof corn demand for ethanol is the new critical variable that has to be takeninto account from now on when attempting to explain the rates at which thedemand for fuel feedstock will increase.
19. As noted above, the Yotopoulos model also took account of the role that prices played inthe food–feed competition implicitly through changes in real income. Such an approach
may give results which are not unrealistic when the rate of food price inflation is largely
8/10/2019 Banerjee Food, feed and fuel. Transforming the competition for grains
At the initial point from which Yotopoulos started his analysis, we have:
D = N .q (3)
where ‘ N ’ is the population and ‘q’ is the per capita demand for grains. Now, in the fuel feedstock era, instead of q = f(y), we have:
q = h( y, p g , pc) (4)
Consequently, the change in per capita demand for grains (q) over time is:
δq
δt .
1
q=
δq
δ y. y
q.δ y
δt .
1
y+
δq
δ p g
. p g
q.δ p g
δt .
1
p g
+δq
δ pc
. pc
q.δ pc
δt .
1
pc
(5)
Taking the time derivative of total demand for grains ( D = N.q), we get.
D=.
N + e y.
.
y+ e g .
.
p g + ec. .
pc (6)
where
e y =δq
δ y. y
q, e g =
δq
δ p g
. p g
qand ec =
δq
δ pc
. pc
q.
‘ey’, ‘eg’ and ‘ec’ are the income elasticity, grain price elasticity and oil price elasticity respectively for per capita grain demand. ey, ec ≥ 0; eg < 0.
.
D=
δ N q
δt .
1
N q,
.
N =δ N
δt .
1
N ,
.y =
δ y
δt .
1
y,
.
pg =
δ p g
δt .
1
p g
and . p
c =
δ pc
δt .
1
pc
.
.
D,.
N,.y,
.
Pg and .
Pc are the time growth rates of total demand for grains, population, per capita real income, composite grain price and crude oil pricerespectively.
Relation 6 represents the new situation where demand for grains is alsodependent on oil prices. In addition to the subsidy effect which facilitated alimited demand for fuel use of corn, rising oil prices generate a much larger demand for ethanol and corn. The grain demand can now increase even when
population and income are both constant. Even if
.
N, and
.
y are both zero,the total demand for grains will still increase if ‘
.
Pc’ is positive; the extent of this increase is determined by the cross-price elasticity ‘ec’. US crude pricesincreased by 330.6 per cent between 2001/2 and 2008/9 while the demand for corn by the ethanol industry rose by 276.7 per cent. The increase in thedemand for corn fuel feed is also influenced by a rise in income which inturn raises the number of vehicles or vehicular miles run in the economy.However, since the number of vehicles rose by only 8.69 per cent in this
period, it seems safe to conclude that the bulk of the increase in fuel feed
demand was due to the rise in crude oil prices.20
The linkages between the different end use markets for grains will ensure
8/10/2019 Banerjee Food, feed and fuel. Transforming the competition for grains
prices. The negative own price effect as represented by ‘eg’ will consequentlyreduce demand for food and animal feed even when real income rises. Thegrowth rate of real income will also be dampened additionally by the risinggrain prices, thereby also reducing the expansion of grain demand via theincome effect.
In the grain market from now on, the food and animal feed prices willincrease even without any rise in demand via intrinsic changes in humandietary patterns, but due to ‘external’ developments such as price surges inthe oil markets. Thus, there is a distinct ‘externalization’ of the grain-useequilibrium. Oil prices, which earlier ‘pushed’ grain prices upwards from theinput-cost side only, will henceforth also ‘pull’ grain prices to higher levelsfrom the demand side. The role of bio-fuels in the recent global food crisishas been noted by several authors (e.g., Keyzer et al., 2008; Mitchell, 2008;Rosegrant, 2008). That corn prices acted as the leader among the differentgrain prices during this crisis is evident from Figure 5.21 The average farm
prices for wheat and sorghum moved exactly in tandem with corn priceswhile barley and oats prices were also pushed up by the surging corn price.
8/10/2019 Banerjee Food, feed and fuel. Transforming the competition for grains
On the other hand, when oil prices slide, grain prices will also need to come down in order to maintain the viability of the ethanol indus-try. When crude prices crashed near the end of 2008 with the financial
meltdown, grain prices responded immediately, either being pushed down-wards or at least having their upward trends halted. The oil price seemsto act as a kind of magnet to which grain prices stick, rising or falling in
parallel.In fact, grain prices may not always react quite so closely to declining
oil prices due to other factors in the market, especially the increasing roleof speculative activities in the commodity exchange markets (FAO, 2008a;Ghosh, 2010; UN, 2008). In cases where grain prices remain high evenwhen oil prices fall, there will be significant pressures on the margins of the
ethanol industry via high feedstock prices. However, with a large part of theUS ethanol industry now under the control of a few major players like ADMand Cargill, which have a significant presence in the commodity markets,speculative activities in food grains are also likely to become more tethered to oil prices in future.
Does this transformation imply that income has no role in generatingdemand for fuel use of grains, in the way that it has for food and animalfeed? As mentioned earlier, income will become a causal factor in the fueluse demand when, as a result of incremental earnings, more people purchase
cars or drive more miles. However, this is subject to the condition that oil prices are significantly high, making gasohol a viable alternative fuel. Incomelevels will essentially play a secondary role as prices have the potential tochange much more sharply than income.
The growth in animal feed demand occurs gradually as it takes time for themiddle classes to expand and change their food consumption patterns. Evenfor fast growing countries, these changes may take a couple of decades tooccur. The growth rate of grain use as animal feed and the overall cereal usehas been generally constrained by demand. While cereal use can face short-
term supply constraints in years when production levels are poor, the major long-run constraint is in the demand for grains. This is largely corroborated
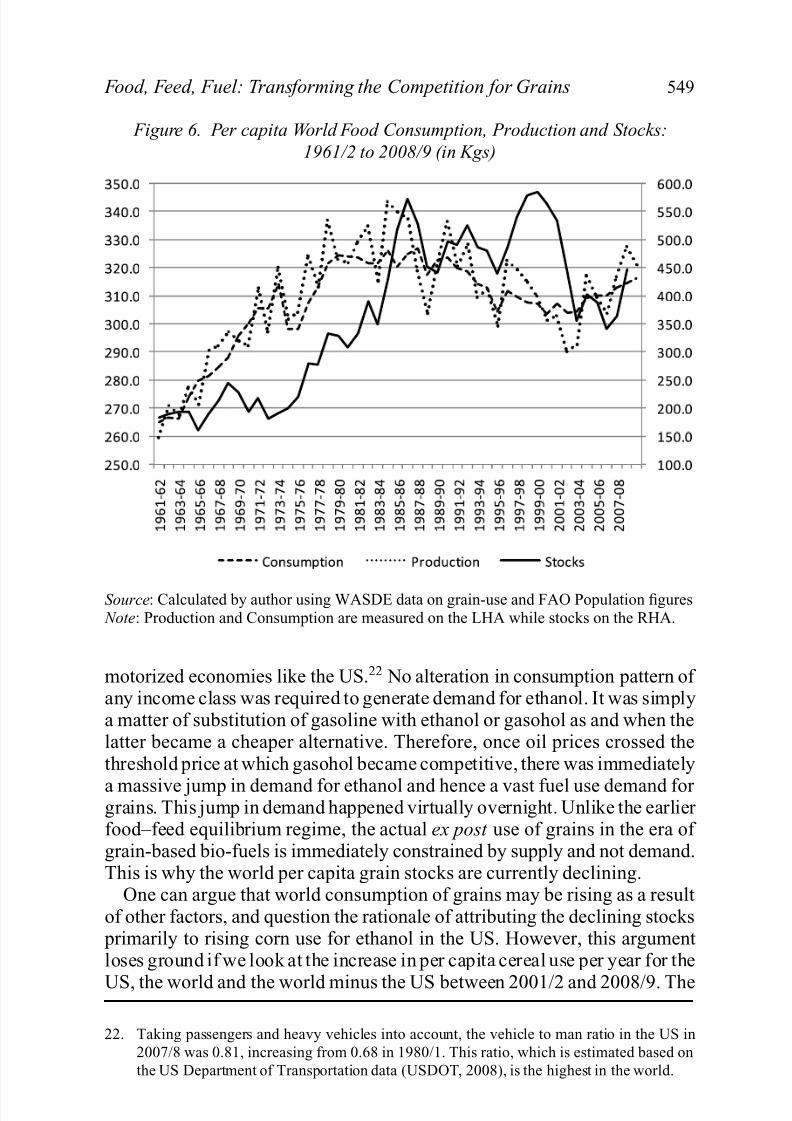
by the historical experience of the food economy after World War II. Sincethe late 1960s, when food consumption was rising, the world per capita food stocks have also grown significantly (Figure 6), as production rose faster than consumption. When cereal production started declining in the mid-1980s, the situation was salvaged by a corresponding decline in per capitaconsumption of grains (1985 to 2000) brought about by mass-deflationary
policies, particularly in the global South. The normative food stocks were
broadly maintained at a high level through declining consumption until theturn of the century. It is only since 2000 that world food stocks have exhibited
8/10/2019 Banerjee Food, feed and fuel. Transforming the competition for grains
Food, Feed, Fuel: Transforming the Competition for Grains 549
Figure 6. Per capita World Food Consumption, Production and Stocks:
1961/2 to 2008/9 (in Kgs)
Source: Calculated by author using WASDE data on grain-use and FAO Population figures Note: Production and Consumption are measured on the LHA while stocks on the RHA.
motorized economies like the US.22 No alteration in consumption pattern of any income class was required to generate demand for ethanol. It was simplya matter of substitution of gasoline with ethanol or gasohol as and when thelatter became a cheaper alternative. Therefore, once oil prices crossed thethreshold price at which gasohol became competitive, there was immediately
a massive jump in demand for ethanol and hence a vast fuel use demand for grains. This jump in demand happened virtually overnight. Unlike the earlier food–feed equilibrium regime, the actual ex post use of grains in the era of grain-based bio-fuels is immediately constrained by supply and not demand.This is why the world per capita grain stocks are currently declining.
One can argue that world consumption of grains may be rising as a resultof other factors, and question the rationale of attributing the declining stocks
primarily to rising corn use for ethanol in the US. However, this argumentloses ground if we look at the increase in per capita cereal use per year for the
US, the world and the world minus the US between 2001/2 and 2008/9. The
8/10/2019 Banerjee Food, feed and fuel. Transforming the competition for grains
figures stand at 149.9 kg, 8.9 kg and 2.8 kg, respectively (USDA WASDE).The per capita corn use per year for ethanol in the US rose by an even higher 245.9 kg in this period.
The supply-constraint character is also vindicated by the fact that even after the more than five-fold increase in ethanol production in the US between2000 and 2008, it accounted for barely 6 per cent of the total motor fuelconsumed (i.e. ethanol plus gasoline use) in the economy. In countries likethe US, where the per capita per day gasoline use was astronomically high at4890 litres in 2002, precisely the time when the surge in ethanol productionstarted (Worldwatch, 2007: 351, Appendix 1), it is hardly surprising thatthere is great demand for ethanol as a gasoline substitute. This reinforces the
point that the arrival of fuel use of grains relegates to a secondary sphere the
linkages of grain competition with income levels, and gives primacy instead to linkages with the oil price.
Transforming the Grain-use Equilibrium
Apart from the enhanced role of oil prices in determining food prices, theadvent of corn-based ethanol has led to a number of transformations in thegrain-use equilibrium. With the dramatic rise in fuel feedstock demand, the
long-run dynamics of food and feed demand based on income distributionamong the population are disrupted. Even with increases in per capita in-come, the food and feed demand move in the opposite direction. This is of crucial significance for the low-income classes of the population. We havealready seen how the animal feed component of grain demand and the largelivestock herd acted as a buffer, helping to maintain direct food intakes (rel-atively larger for the poor) in the case of occasional grain supply shortfalls.This adjustment process is technically possible as animal products can besubstituted by direct consumption of grains in the human diet. The same is
not true for fuel use of grains. Even if corn prices rise and drive up ethanol prices, there will be no reduction in ethanol and fuel feedstock consumptionuntil the price of ethanol exceeds that of gasoline. This is because the directconsumption of grains is not a technical substitute for ethanol in the diet of the vehicles.
Not only is fuel use unable to play any cushioning role, but as the shareof fuel use in total grain utilization increases and the share of animal feed decreases, this undermines the capacity of animal feed to act as a shock-absorber in case of supply shortfalls. The share of fuel feed in total grain
use in the US in 2008/9 was already 29.9 per cent. Correspondingly, theshare of feed use declined from 65.7 per cent in 2000/1 to 47.6 per cent
8/10/2019 Banerjee Food, feed and fuel. Transforming the competition for grains
Food, Feed, Fuel: Transforming the Competition for Grains 551
Dried Distillers Grain (DDG).23 After adjusting for DDG, the ex post feed use still declined by 0.1 per cent annually. Thus, the voracious demand for fuel use of grains not only crowds out food use in the US, but also causes a
stagnation of feed use.The use of grains as animal feed has not declined by much when we account
for the double-use of grains, i.e. first as fuel feedstock and then in the formof DDG used as animal feed. The middle-income classes which consumesignificant amounts of grain indirectly in the form of animal products are thushit to a lesser extent. However, with arrested feed use and higher animal feed
prices, there will be a re-direction of feed towards the higher value livestock products away from the low-quality and cheaper meat products that arean important part of the diet of lower-middle income classes in the US. In
other words, there is growing competition for animal feed within the differentsegments of the livestock industry and it is only through higher subsidies thatcheaper meat products can be made available for the population. On the other hand, there is a clear reversal of the increasing trends in food use (or directconsumption) of grains that was witnessed between 1980 and 2000. Thelow-income classes are bound to be adversely hit as a result of this process.
There is some difference of opinion as to whether there is any incidenceof hunger currently in the US.24 If the lowest decile of the US population isindeed food-insecure, as some commentators suggest, the crowding out of
food use will certainly have aggravated that situation and is likely to have pushed more people into vulnerability in times of rising grain output. Evenif we accept that, by international monitoring standards, the incidence of hunger in the US is negligible, the negative trend of food use of grains islikely to have derailed the nutritional transition that Americans have beenexperiencing over the past couple of decades. The shift towards processed cereals/foods and pasta–grain diets by the average American consumer,driven by concerns over a healthy diet and lifestyle diseases, is seriouslyconstrained by the demand for grains for bio-fuels.
CONCLUSION: SOME WIDER IMPLICATIONS
We have traced various dimensions of the transformation in the grain-useequilibrium and their implications for the different income classes in the US.
23. A tonne of corn used for ethanol production returns around 286 kg of DDG, of which roughly
90 per cent is used in the US domestic feed market as high protein concentrates (based on
information on ethanol co-products from the National Corn Growers Association, USA;
http://ncga.com/coproducts). There are other reusable by-products of ethanol productionwhen wet-milling is used but nearly all ethanol distilleries in the US use the dry-milling
process
8/10/2019 Banerjee Food, feed and fuel. Transforming the competition for grains
There are still some concerns that remain with regard to the effect of thesedevelopments on the rest of the world. Another crucial issue is the futuretrajectory of the bio-fuel industry and what that implies for development at
large. It would be useful to briefly touch upon these two issues by way of summary.
It is clear that any replication of the US corn-based ethanol industry in other parts of the world, particularly in developing countries which continuouslygrapple with undernutrition, would be disastrous. Even in the absence of such replications, corn-based ethanol production in the US still has seriousramifications for developing countries given the US’s near monopoly over global corn exports. In a globalized world system with increased food trade,the dynamics of grain use extends beyond national boundaries and also
reaches into the realm of trade policies. It is possible, for instance, for theUS to cut down on corn exports in order to prevent a fall in the domesticfood and animal feed supply. While the experience of the US economy inrecent years suggests that, notwithstanding adjustments to corn exports, theamount of grain used domestically as food and animal feed has declined, inview of the large volumes of corn that the US has historically exported, itis worth examining what has happened in that regard during the past decadeof large-scale ethanol production.
The US share of global corn exports in the 2000s has been 60.3 per cent
(USDA WASDE). Although this is lower than its 68.7 per cent share in the1990s, it is substantial enough to have a strong impact on the world cornmarkets. When corn prices rise in the US, the world export prices for cornwill inevitably go up, preventing poor and middle-income corn-importingnations from procuring their required corn supplies via trade. This was wellillustrated by the political instability and crisis in Mexico in 2007, at thecentre of which lay the high price of corn imports from the US (Bello and Baviera, 2009).
The gradual reduction of US corn exports is already visible. The per capita
US corn export has declined from the decadal average of 190.2 kg in the1980s to 171.3 kg in the 1990s and 166.8 kg in the 2000s. The decline in cornexports creates supply pressures in importing countries and increases pricesof corn and other substitute grains. This inflates the food-import budgets for these countries, and worsens their balance of payments situation. Earlier inhistory, cheap American wheat or corn, which often came as food aid to de-veloping countries, had increased poverty by destroying livelihoods of smallfood-growers in poor countries (Friedman, 1990). In that sense, this increaseof global food prices may cause a long-term restructuring of the domestic
agriculture of developing countries in favour of more food production and thus enhance food self-sufficiency in such countries — although it is difficult
8/10/2019 Banerjee Food, feed and fuel. Transforming the competition for grains
Food, Feed, Fuel: Transforming the Competition for Grains 553
invariably aggravate the problems of hunger and nutrition in the developingcountries which are dependent on food imports.
Using FAO data on trade flows and population figures (FAO, 2005–7),
it is possible to estimate per capita corn imports in the period 2005–7 for the top sixteen importers of US corn. At the peak of the food crisis, whencorn prices reached astronomical levels, nine out of the sixteen countriesexperienced a decline in their per capita corn imports from the US. Amongthese nine countries, four countries experienced a fall in their total per capitacorn imports, while the remaining five were able to procure corn from other exporters, although at high prices.25
The decline of corn exports in the 2000s would have been even larger had it not been for a surge in corn output engineered by the US through the
introduction of transgenic corn in the Midwestern states. While the historicalrate of growth of US corn production over half a century (1961/2 to 2009/10)has been 2.4 per cent, the annual trend growth rate of corn output was anexceptional 4.1 per cent between 2002/3 and 2008/9. Lucrative prices and new technology led to an increase in both acreage (by 13 per cent) and yield (by 19 per cent) in this period.
The important question that arises is whether such a surge in productionis sustainable over a longer period, given the constraints that remain onindefinite expansion of corn acreage as well as the historically observed
uncertain and short-lived nature of transgenic technology. Without sucha phenomenal increase in corn production, the ethanol industry — if itmaintains its current trajectory — is bound to deplete US corn exportssignificantly in the future. This connects us to other issues of sustainabilityof ethanol production from corn in the future. During the financial crisis,when oil prices crashed, the ethanol industry witnessed serious pressures onits margins. This raises the question as to whether the corn-ethanol industryis a sustainable option in the long run or more of a passing phase.
The turnaround of the crude prices in late 2009 restored the viability of
ethanol production. Given current circumstances, the basic condition for anexpansion of the ethanol industry without the assistance of larger subsidiesis that in future, oil prices should remain above the threshold price whichrenders ethanol competitive. Even if there is no reduction in the unit cost of ethanol production as a result of technological developments, the industrywill still expand if the nominal crude price rises faster than the rate at which
25. Between 2005 and 2007, out of the 139 importers of US corn, the top sixteen importers
accounted for 89.7 per cent of total US corn exports. These were Algeria, Canada, Colombia,
Costa Rica, Cuba, Dominican Republic, Egypt, El Salvador, Guatemala, Israel, Japan,Mexico, Morocco, Republic of Korea, Saudi Arabia and Syrian Arab Republic. In 2007,
there was a moderate increase in corn imports from the US for Canada Cuba Saudi Arabia
8/10/2019 Banerjee Food, feed and fuel. Transforming the competition for grains
the price of production in the ethanol industry rises, driven by inflation inthe economy. In other words, the real crude price has to increase over time.The US Energy Information Administration median forecasts indicate that
real crude prices (in 2008 dollars) will increase from US$ 59 per barrel in2009 to US$ 95 per barrel in 2015 and then to US$ 133 by 2035 (US EnergyInformation Administration, 2010: 26, Figure 32). If crude prices stick tothis predicted path, unhindered expansion of US ethanol industry in futureis a distinct possibility.
This raises the more serious question which policy makers in the US and elsewhere will have to tackle in future. Even if we assume that ethanol
production expands no more than the prescribed US targets, it could lead toenormous grain deficits in the US — an ominous development both for the
US and the world. The draft US Biofuels Security Act (BSA) of 2007 had sought to set strenuous targets of producing 30 billion gallons of ethanol
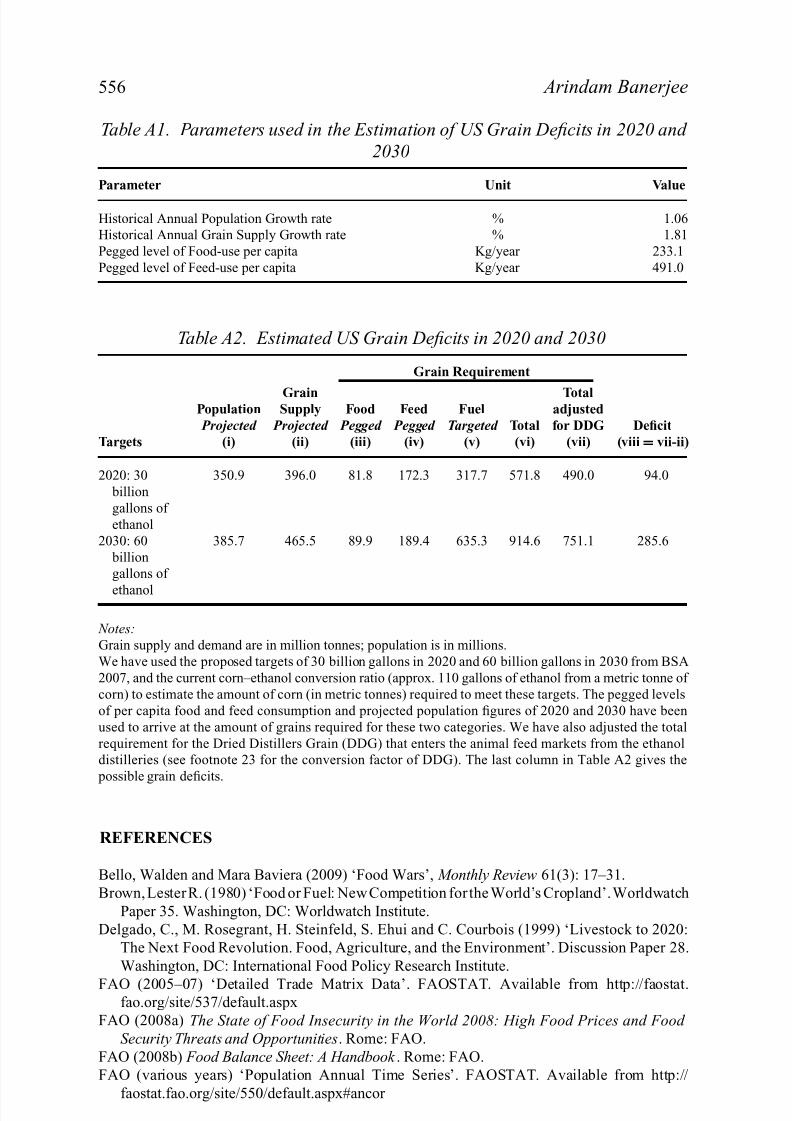
by 2020 and 60 billion gallons by 2030. If the US attempts to meet thesetargets from corn feedstocks alone, it will have to deal with large graindeficits. Assuming that grain supplies and population continue to grow atthe observed historical rates, that per capita food and feed consumption ismaintained at the 2008/9 level, and that technology remains unchanged inthe ethanol industry, the US will face a deficit of some 94 million tonnes of grains in 2020 and a staggering 285.6 million tonnes in 2030.26
American policy makers were well aware of these future ramificationswhich may explain why the bill did not become law. The EISA of 2007suitably modified the targets to avoid this catastrophic situation, mandatingthat of the 36 billion gallon production target for 2022, at least 21 billiongallons has to be produced from non-corn feedstocks. This congressionalmandate is hinged on the fragile expectation that the technology for eco-nomically producing ethanol from cellulosic material, like grass and wood,will enter into commercial operation sometime between 2012 and 2015.Success in this venture could significantly ease the supply constraint for the
ethanol industry, although valid concerns will remain regarding the impactof cellulosic ethanol production on natural resources like habitat and water.
There is very little room for manoeuvre in this regard. If the cellulosictechnology does not become operational by 2015 or is not environmentallysustainable, the bio-fuels targets could lead to precarious situations. Anyattempt to meet the targets from corn-based ethanol would seriously desta-
bilize the food and livestock economy across the globe, given the enormousgrain deficits that would emerge. In such a situation, it would be more pru-dent for the US to suspend or abort the declared ethanol targets, thereby
preventing any man-made social and economic disaster in the future.What might still drive the US to chase the ethanol targets even if the cel-
8/10/2019 Banerjee Food, feed and fuel. Transforming the competition for grains
Food, Feed, Fuel: Transforming the Competition for Grains 555
bio-energy is motivated by the urge to strategically reduce the country’sdependence on fossil fuels; of course, a whole range of economic, politicaland environmental issues are linked to this. The massive consumption of
fuel associated with high levels of motorization in the US (in the larger sense, the high-value consumption baskets that capitalism has encouraged for decades) has taken us to a phase in which competition for resources has
become more intense than ever.The food–feed–fuel regime is characterized by antagonism between
vehicle-owners and the rest of the population. While car owners form ahuge group within the population of the US, at the global level, they forma minority. Portentously, this minority corners large shares of grains thatcould otherwise have provided nutrition to the billions of hungry and under-
nourished in this globe. It is therefore incumbent upon world civilization,and in particular the developed nations, to restrict the motorization of their economies and even to reduce it by developing extensive public transportnetworks with high man/vehicle ratios. Governments might pursue other useful policies such as the Vehicle Quota System, which pre-empts thenumber of new vehicles each year, or Electronic Road Pricing which dis-courages private vehicles from using roads during peak hours — policiesthat Singapore has used effectively for decades. From the global point of view, any sustainable path of development in which the world’s poor are
not ‘crowded out’ in terms of food intake will have to involve developingfeasible lifestyle norms.
APPENDIX. ESTIMATION OF HYPOTHETICAL GRAIN DEFICITS IN USA,2020 AND 2030
Assumption 1: Grain supply and population will grow at historical growthrates witnessed between 1980 and 2008.
Assumption 2: Per capita consumption of food and feed for the averageUS consumers will remain fixed at the 2008/9 level and not experience anydecline from that level.
Assumption 3: Technology will remain unchanged in the corn-based ethanolindustry over time.
The parameters used in the estimation are given in Table A1. All the calcu-lations are based on the WASDE data.
8/10/2019 Banerjee Food, feed and fuel. Transforming the competition for grains
Grain supply and demand are in million tonnes; population is in millions.
We have used the proposed targets of 30 billion gallons in 2020 and 60 billion gallons in 2030 from BSA
2007, and the current corn–ethanol conversion ratio (approx. 110 gallons of ethanol from a metric tonne of
corn) to estimate the amount of corn (in metric tonnes) required to meet these targets. The pegged levels
of per capita food and feed consumption and projected population figures of 2020 and 2030 have been
used to arrive at the amount of grains required for these two categories. We have also adjusted the total
requirement for the Dried Distillers Grain (DDG) that enters the animal feed markets from the ethanoldistilleries (see footnote 23 for the conversion factor of DDG). The last column in Table A2 gives the
possible grain deficits.
REFERENCES
Bello, Walden and Mara Baviera (2009) ‘Food Wars’, Monthly Review 61(3): 17–31.
Brown, Lester R. (1980) ‘Food or Fuel: New Competition for the World’s Cropland’.Worldwatch
Paper 35. Washington, DC: Worldwatch Institute.
Delgado, C., M. Rosegrant, H. Steinfeld, S. Ehui and C. Courbois (1999) ‘Livestock to 2020:
The Next Food Revolution. Food, Agriculture, and the Environment’. Discussion Paper 28.
Washington, DC: International Food Policy Research Institute.
FAO (2005–07) ‘Detailed Trade Matrix Data’. FAOSTAT. Available from http://faostat.fao.org/site/537/default.aspx
FAO (2008a) The State of Food Insecurity in the World 2008: High Food Prices and Food
8/10/2019 Banerjee Food, feed and fuel. Transforming the competition for grains
Magdoff, Fred and Brian Tokar (2009) ‘Agriculture and Food in Crisis: An Overview’, Monthly
Review 61(3): 1–16.
Mitchell, Donald (2008) ‘A Note on Rising Food Prices’. Policy Research Working Paper No.
4682. Washington, DC: The World Bank Development Prospects Group.Page, Louise and Berta Friend (1978) ‘The Changing United States Diet’, BioScience 28(1):
192–7.
Popkin, Barry M. (1993) ‘Nutritional Patterns and Transitions’, Population and Development
Review 19(1): 138–57.
Popkin, Barry M., Anna Maria Seiga-Riz and Pamela S. Haines (1996) ‘A Comparison of Dietary
Trends among Racial and Socioeconomic Groups in the United States’, The New England
Journal of Medicine 335(10): 716–22.
Rosegrant, Mark W. (2008) ‘Bio-Fuels and Grain Prices: Impacts and Policy Responses’. Tes-
timony for the US Senate Committee on Homeland Security and Governmental Affairs (7
May). http://www.ifpri.org/publication/biofuels-and-grain-prices (accessed 10 July 2009).
United Nations (2008) ‘Comprehensive Framework for Action’. Prepared by High-level Task Force on the Global Food Security Crisis, July. New York: United Nations.
Warnock, John W. (1987) The Politics of Hunger: The Global Food System. Toronto: Methuen.
World Bank ‘World Development Indicators’ database. http://data.worldbank.org/data-catalog/world-development-indicators
Worldwatch Institute (2007) Biofuels for Transport: Global Potential and Implications for Sus-
tainable Energy and Agriculture. London: Earthscan.
Yotopoulos, Pan A. (1985) ‘Middle-Income Classes and Food Crises: The “New” Food–Feed
Competition’, Economic Development and Cultural Change 33(3): 463–83.
Arindam Banerjee is a consultant at Research and Information Systemfor Developing Countries, New Delhi, India, where his research focus is onagrarian change, food security and poverty. His contribution ‘From Agrarian
Crisis to Global Economic Crisis: Neoliberalism and the Indian Peasantry’will shortly be published in The Global Crisis and Transformative Social
8/10/2019 Banerjee Food, feed and fuel. Transforming the competition for grains