39
October 2017 Bangkok Dusit Medical Services (BDMS) Investor Presentation 2Q17 Results

October 2017
Bangkok Dusit Medical Services (BDMS)
Investor Presentation 2Q17 Results

Important Notice
The information contained in this presentation is for information purposes only and does not constitute an offer or invitation to sell or the solicitation of an offer or invitation to purchase or subscribe for share in Bangkok Dusit Medical Services Public Company Limited (“BDMS” and shares in BDMS, ”shares”) in any jurisdiction nor should it or any part of it from the basis of , or be relied upon in any connection with, any contract or commitment whatsoever.
This presentation may include information which is forward-looking in nature. Forward-looking information involve known and unknown risks, uncertainties and other factors which may impact on the actual outcomes, including economic conditions in the markets in which BDMS operates and general achievement of BDMS business forecasts, which will cause the actual results, performance or achievements of BDMS to differ, perhaps materially, from the results, performance or achievements expressed or implied in this presentation.
This presentation has been prepared by the BDMS. The information in this presentation has not been independently verified. No representation, warranty, express or implied, is made as to, and no reliance should be placed on, the fairness, accuracy, completeness or correctness of the information and opinions in this presentation. None of the BDMS or any of its agents or advisors or any of their respective affiliates, advisors or representatives, shall have any liability ( in negligence or otherwise) for any loss howsoever arising from any use of this presentation or its contents or otherwise arising in connection with this presentation.
This presentation is made, furnished and distributed for information purposes only. No part of this presentation shall be relied upon directly or indirectly for any investment decision-making or for any other purposes.
This presentation and all other information, materials or documents provided in connection therewith, shall not, either in whole or in part, be reproduced, redistributed or made available to any other person, save in strict compliance with all applicable laws.
2
Contents
Overview
Operational Statistics
Healthcare Industry
Financial Highlights
3

4
Overview
4
5
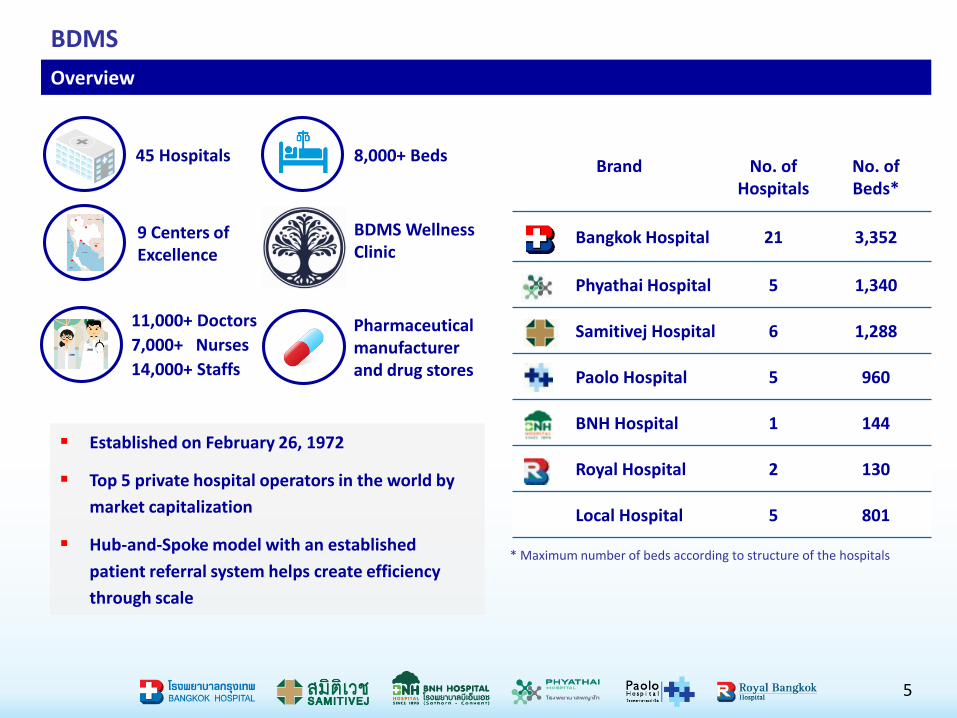
BDMS
Overview
Brand No. of Hospitals
No. of Beds*
Bangkok Hospital 21 3,352
Phyathai Hospital 5 1,340
Samitivej Hospital 6 1,288
Paolo Hospital 5 960
BNH Hospital 1 144
Royal Hospital 2 130
Local Hospital 5 801
* Maximum number of beds according to structure of the hospitals
45 Hospitals 8,000+ Beds
11,000+ Doctors
7,000+ Nurses
14,000+ Staffs
Established on February 26, 1972
Top 5 private hospital operators in the world by
market capitalization
Hub-and-Spoke model with an established
patient referral system helps create efficiency
through scale
9 Centers of Excellence
BDMS Wellness Clinic
Pharmaceutical manufacturer and drug stores

Diversification of Patient Mix
6
Medical Sophistication
Secondary Tertiary Super Tertiary
Targ
et P
atie
nts
/ P
urc
has
ing
Po
we
r
Inte
rnat
ion
al
Pat
ien
tsH
igh
-In
com
e
Pat
ien
tsM
idd
le-I
nco
me
P
atie
nts
Soci
al
Secu
rity
P
atie
nts

BDMS Future Plan
Key Strategies
7
2017
2025
Increase utilization of ramping-up hospitals
Improving operational efficiencies
Centers of excellence
International medical affiliation
Completed continuum of healthcare
Top referral hospitals in Asia Pacific
Hospitals in Pipeline
Focus on Margin
Expansion
Long-term Target
2018 2019 2020
45 Hospitals ~ 50 hospitals
8,015 beds ~ 8,500 beds
Paolo Kaset(162 beds)
Bangkok Surat(150 beds)
o BDMS Wellness Clinic (4Q17)
o Bangkok Chiangrai(80 beds)
o Chiva Transitional Care (52 beds)
o Phoenix Project (175 beds)
o International Hospital (100 beds)

5,635 10,724 15,981 18,885 21,652 21,974 24,051 37,371 47,862 51,407 56,607 63,655 68,844 34,539
18.4%
20.6%
23.1% 23.4% 23.1% 22.9% 23.1% 23.2% 23.3% 21.3%22.4% 22.1%
21.4%20.7%
2004 2005 2006 2007 2008 2009 2010 2011 2012 2013 2014 2015 2016 6M17
Successful Track Record of Expansion Through M&A and Greenfield Projects
BDMS has developed 14 new hospitals and acquired a total of 30 hospitals to date
Total Revenue (THB mm)and EBITDA margin (%)
Solid Revenue Growth Over the Past Decade (2004-2016 CAGR of 24.7%) with Resilient EBITDA margin
# Number of hospitals in the network post-acquisitionGreen font indicates Greenfield projects Brown font indicates acquisitions
Source: Derived from BDMS’ financial statements
Strong Share Price Performance Backed by a Successful Expansion Track RecordShare Price (THB)
* Transfer of business to our new facility, Royal Phnom Penh** Rebrand from Bangkok Chinatown to Samitivej Chinatown in Oct 2017
8
2015
• Muang Petch
• Sri-Rayong
• Dibuk
• Samitivej Chonburi
• Muangraj
0
5
10
15
20
25
30
Jan-04 Jan-05 Jan-06 Jan-07 Jan-08 Jan-09 Jan-10 Jan-11 Jan-12 Jan-13 Jan-14 Jan-15 Jan-16 Jan-17
182013
• Samitivej Thonburi
• Bangkok Phitsanulok
31
29
2011
• Bangkok Hua Hin
• Bangkok Pakchong
• Health Network (8 Phyathai & Paolo hospitals) 2012
• Bangkok Udon
28
2007
• Royal Angkor International (Cambodia)
• Royal Rattanak (Cambodia) *
16
2006
• Increase in stake of Bangkok Pattaya, Bangkok Chanthaburiand Samitivej Sriracha (became subsidiaries)
• Bangkok Ratchasima
2005
• BNH
• Wattanosoth
10
2004
• Bangkok Heart
• Bangkok Samui
• Bangkok Phuket
• Samitivej Sukhumvit and Samitivej Srinakarin
12
37
2014
• Bangkok Chiangmai
• Royal Phnom Penh (Cambodia)
• Samitivej Chinatown **
• Bangkok Khon Kaen
• Sanamchan & Thepakorn
• Phuket International
422016
• Paolo Rangsit
43
45
2017
• Paolo Kaset
• Bangkok Surat
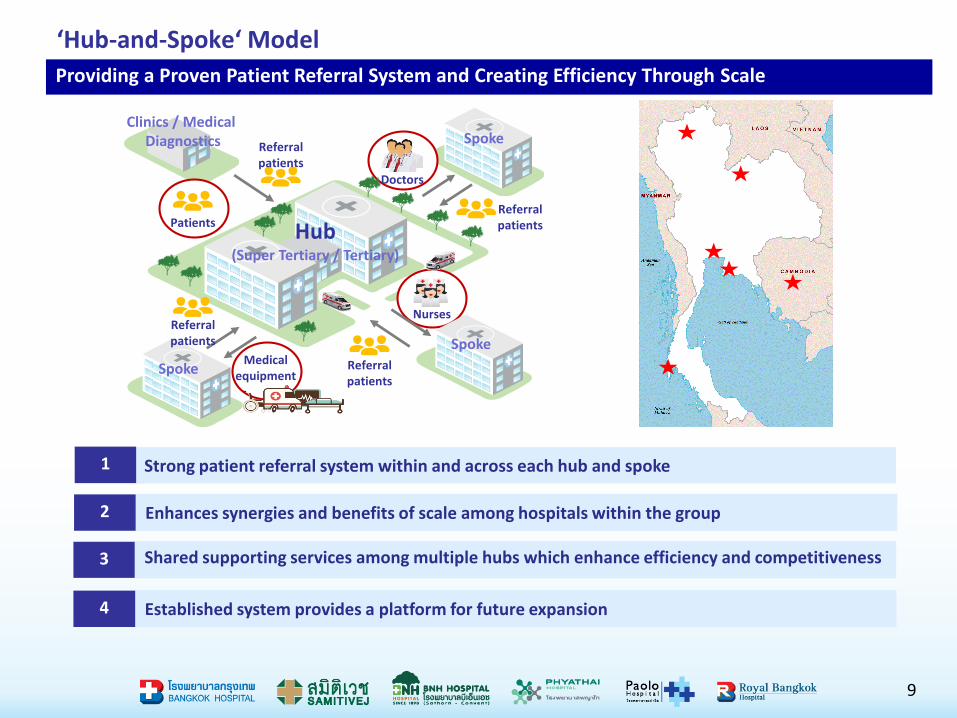
‘Hub-and-Spoke‘ Model
Strong patient referral system within and across each hub and spoke1
Enhances synergies and benefits of scale among hospitals within the group2
Shared supporting services among multiple hubs which enhance efficiency and competitiveness 3
Hub(Super Tertiary / Tertiary)
Referralpatients
Referralpatients
Referralpatients
Referralpatients
Medicalequipment
Nurses
Doctors
Clinics / Medical Diagnostics
Spoke
Spoke
Spoke
Patients
9
Providing a Proven Patient Referral System and Creating Efficiency Through Scale
Established system provides a platform for future expansion4
10
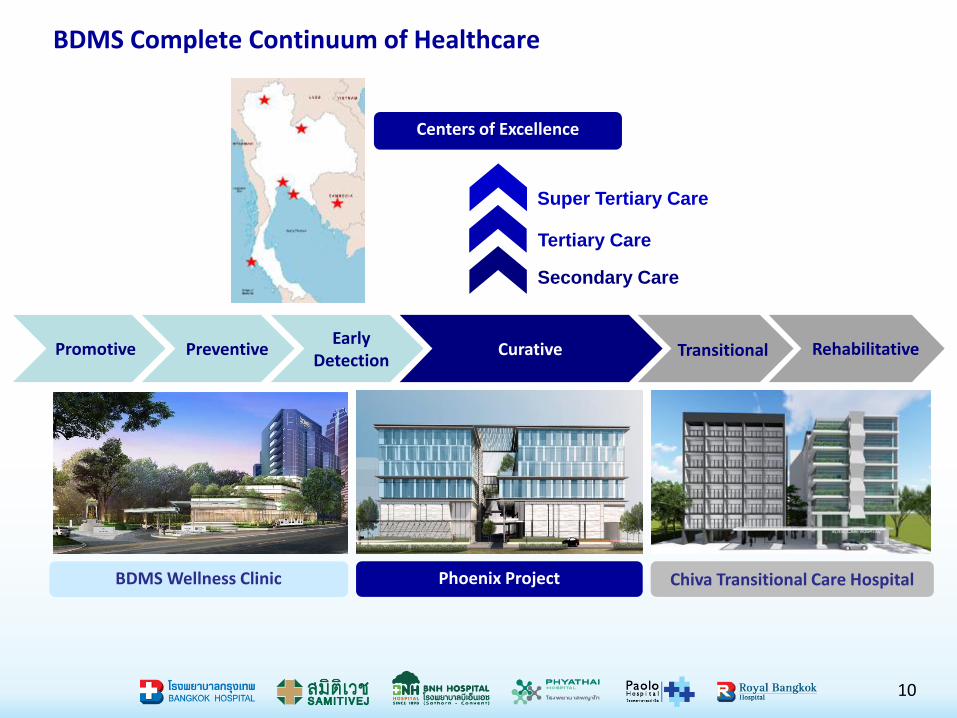
BDMS Complete Continuum of Healthcare
BDMS Wellness Clinic
Early Detection
Curative
Chiva Transitional Care Hospital
Secondary Care
Tertiary Care
Super Tertiary Care
Centers of Excellence
Phoenix Project
TransitionalPreventivePromotive Rehabilitative

BDMS Centers of Excellence Network
Bangkok Headquarter
Samitivej Sukhumvit
Phyathai 2
Bangkok Phuket
Bangkok Pattaya
Bangkok Chiangmai
Bangkok Udon
Royal Phnom Penh
BDMS Medical CoE (Phoenix)
Samitivej Srinakarin
9
1
2
3
4
5
8
7
6
11
Upgrading Existing 9 Hospitals to Become Centers of Excellence with the Focus on International Patients
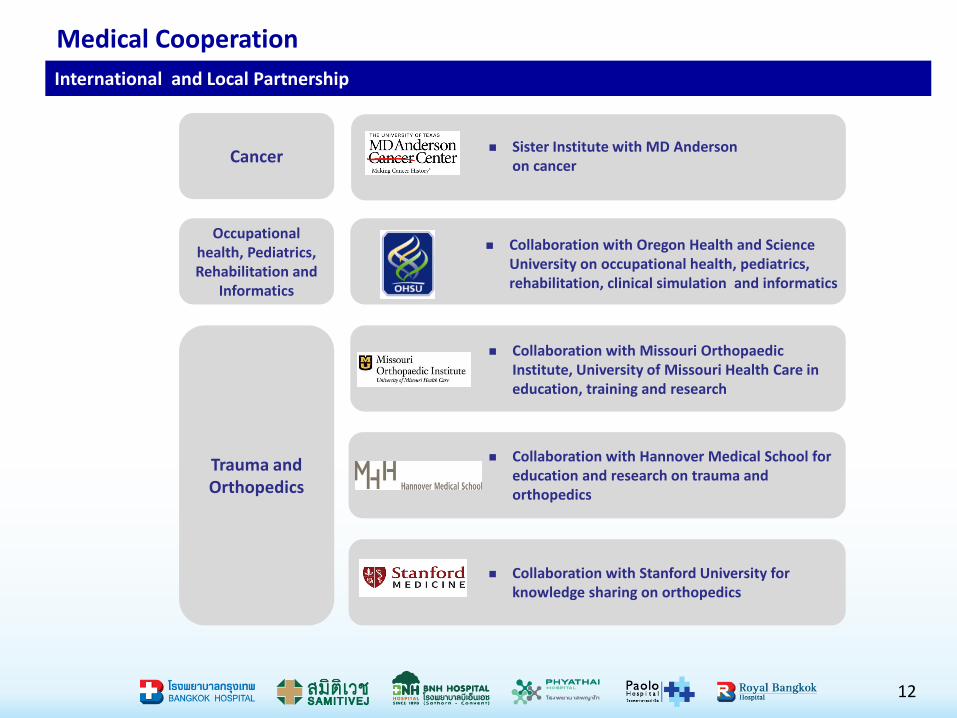
International and Local Partnership
Medical Cooperation
Cancer
Trauma and Orthopedics
Occupational health, Pediatrics, Rehabilitation and
Informatics
Sister Institute with MD Anderson on cancer
Collaboration with Oregon Health and Science University on occupational health, pediatrics, rehabilitation, clinical simulation and informatics
Collaboration with Stanford University for knowledge sharing on orthopedics
Collaboration with Missouri OrthopaedicInstitute, University of Missouri Health Care in education, training and research
Collaboration with Hannover Medical School for education and research on trauma and orthopedics
12
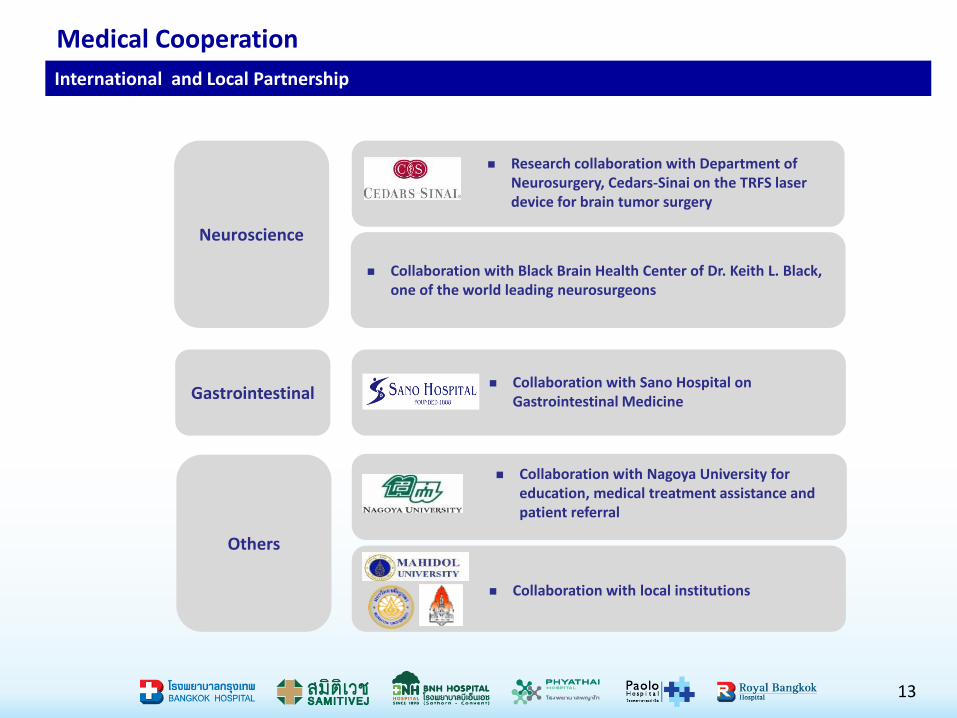
International and Local Partnership
Medical Cooperation
Neuroscience
Collaboration with Black Brain Health Center of Dr. Keith L. Black, one of the world leading neurosurgeons
Research collaboration with Department of Neurosurgery, Cedars-Sinai on the TRFS laser device for brain tumor surgery
Gastrointestinal Collaboration with Sano Hospital on
Gastrointestinal Medicine
Others
Collaboration with Nagoya University for education, medical treatment assistance and patient referral
Collaboration with local institutions
13
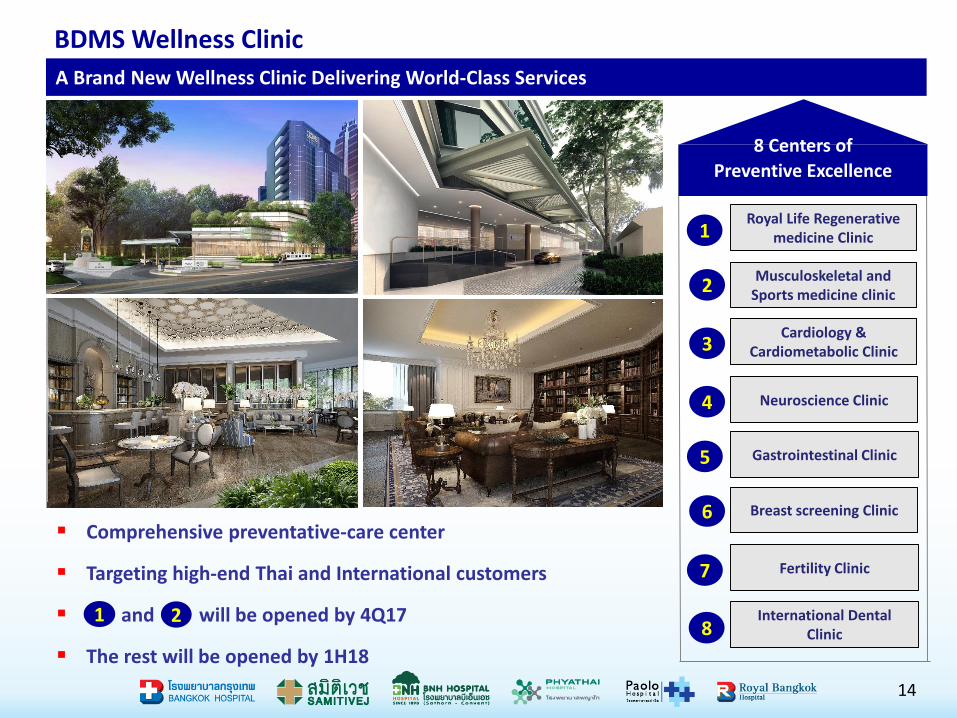
BDMS Wellness Clinic
Comprehensive preventative-care center
Targeting high-end Thai and International customers
1 and 2 will be opened by 4Q17
The rest will be opened by 1H18
Breast screening Clinic
Fertility Clinic
International Dental Clinic
Cardiology & Cardiometabolic Clinic
Neuroscience Clinic
Musculoskeletal and Sports medicine clinic
Royal Life Regenerative medicine Clinic
8 Centers of
Preventive Excellence
Gastrointestinal Clinic
1
2
3
4
5
6
7
81 2
14
A Brand New Wellness Clinic Delivering World-Class Services
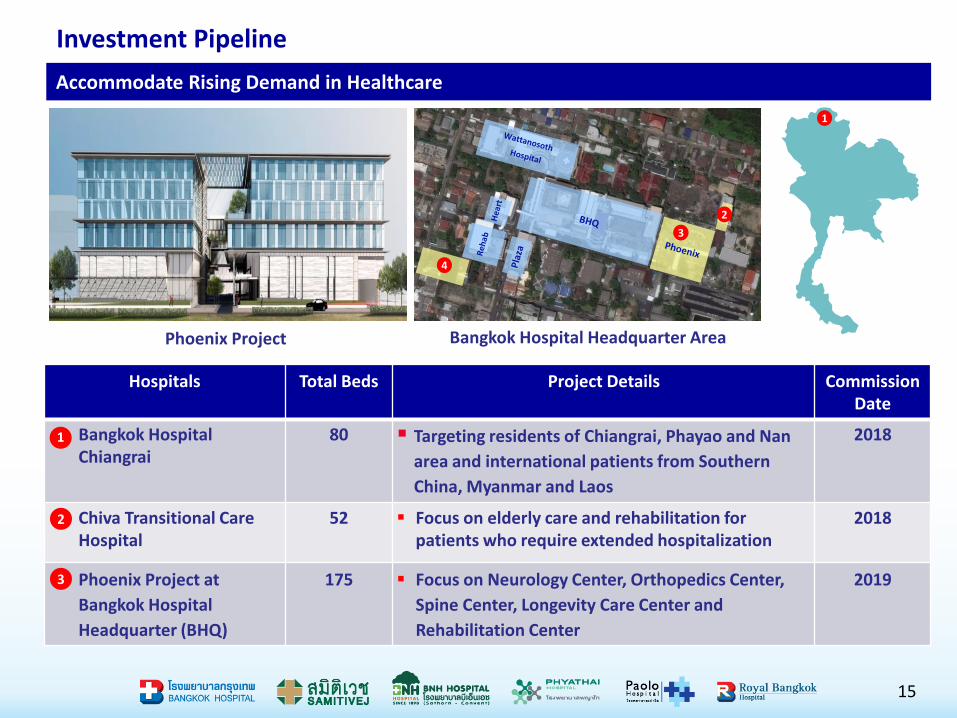
Investment Pipeline
Accommodate Rising Demand in Healthcare
Hospitals Total Beds Project Details Commission Date
Bangkok Hospital Chiangrai
80 Targeting residents of Chiangrai, Phayao and Nan
area and international patients from Southern
China, Myanmar and Laos
2018
Chiva Transitional Care Hospital
52 Focus on elderly care and rehabilitation for patients who require extended hospitalization
2018
Phoenix Project at
Bangkok Hospital
Headquarter (BHQ)
175 Focus on Neurology Center, Orthopedics Center,
Spine Center, Longevity Care Center and
Rehabilitation Center
2019
1
2
15
3
2
4
Phoenix Project
3
1
Bangkok Hospital Headquarter Area

Accommodate Rising Demand in Healthcare
Hospitals Total Beds
Project Details Commission Date
International Hospital 100 7- storey building consisted of 2 buildings,
dedicated to international patients
Relocated international clinics:- Japan, Arabic,
CLMV, China and Bangladesh from Wattanosoth
hospital
2019
Expansion of Samitivej
Sukhumvit Hospital
45 Focus on Japanese patients, liver and
Gastrointestinal
Located near Samitivej Sukhumvit Hospital on
the land of 1 Rai
2019
4
Expansion of Samitivej Sukhumvit Hospital
Investment in Pipeline
16
5
International Hospital

Investments
Non- Hospital Strategic Investments *
Investments in Other Hospitals : - Listed Companies
Ramkhamhaeng Hospital PCL 38.24%
Bumrungrad Hospital PCL 20.50%
Pharmaceutical Business
A.N.B. Laboratories 100% Sterile pharmaceutical product manufacturer & distributor
Save Drug Center 100% Drugstore
The Medicpharma 87% Generic pharmaceutical product manufacturer
General Hospital Products PCL 46% Sterile pharmaceutical product manufacturer
Other Complimentary Business
National Healthcare Systems 100% Central lab, central supply chain, procurement & other shared services
Greenline Synergy 100% Shared IT services
Bangkok Premier Life Insurance
Broker
100% Health & life insurance broker
Bangkok Helicopter Services 100% Transportation of patients via helicopter services
* Not included all BDMS’ investments
17
2,595 2,749
2015 2016
+6%
Non-Hospital RevenuesTHB mm

Market Capitalization (USD mm) Revenue (USD mm)
EBITDA Margin Net Profit Margin
Global Hospital Rankings
Remark: - Market capitalization as of 9 October 2017
- Financial performance (excluding non-recurring items) for year ended December 2016 except Ramsay for the year ended June 2017
18
19
Healthcare Industry

Population growth, aging demographics and rising income will drive demand for Thai healthcare
Thai healthcare spending is expected to grow 5-6% p.a. in the next 3 years *
Key Trend for Thai Healthcare Industry
20
Supportive Demographic and Economic Trends
Favorable Government Policies
Changing Behavior and Opportunities
Increase health conscious and greater affordability driven a growing demand on preventive care
Thailand’s attractiveness as travel destination, convenient infrastructure & facility and value for money help support medical tourism
Expanding visa for medical tourist from CLMV and China to 90 days
Thai Government recently approved tax break on premiums paid for health insurance. This should benefit private hospitals as it could boost healthcare demand
* Source: EIC SCB
Health Tech
Still small; mostly in searching for doctor and personal health information
Support existing healthcare service rather than replacement
Mobile health apps would increase health conscious and preventive care
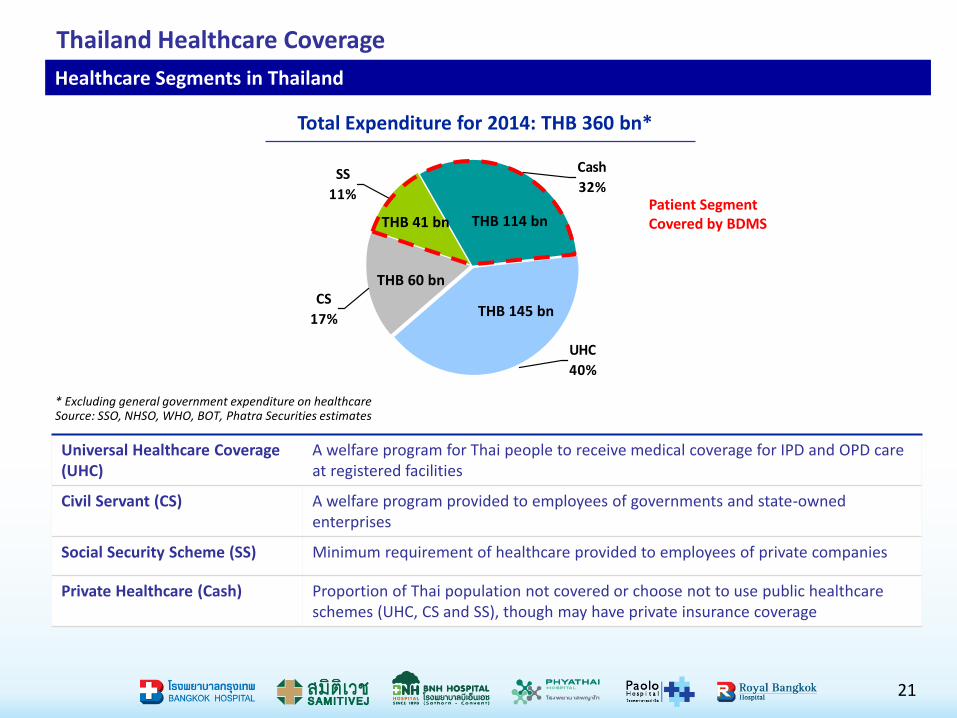
Thailand Healthcare Coverage
Healthcare Segments in Thailand
* Excluding general government expenditure on healthcareSource: SSO, NHSO, WHO, BOT, Phatra Securities estimates
Universal Healthcare Coverage (UHC)
A welfare program for Thai people to receive medical coverage for IPD and OPD care at registered facilities
Civil Servant (CS) A welfare program provided to employees of governments and state-owned enterprises
Social Security Scheme (SS) Minimum requirement of healthcare provided to employees of private companies
Private Healthcare (Cash) Proportion of Thai population not covered or choose not to use public healthcare schemes (UHC, CS and SS), though may have private insurance coverage
UHC
40%
Cash
32%SS
11%
CS
17%
THB 114 bn
THB 145 bn
THB 41 bn
THB 60 bn
Total Expenditure for 2014: THB 360 bn*
Patient Segment Covered by BDMS
21
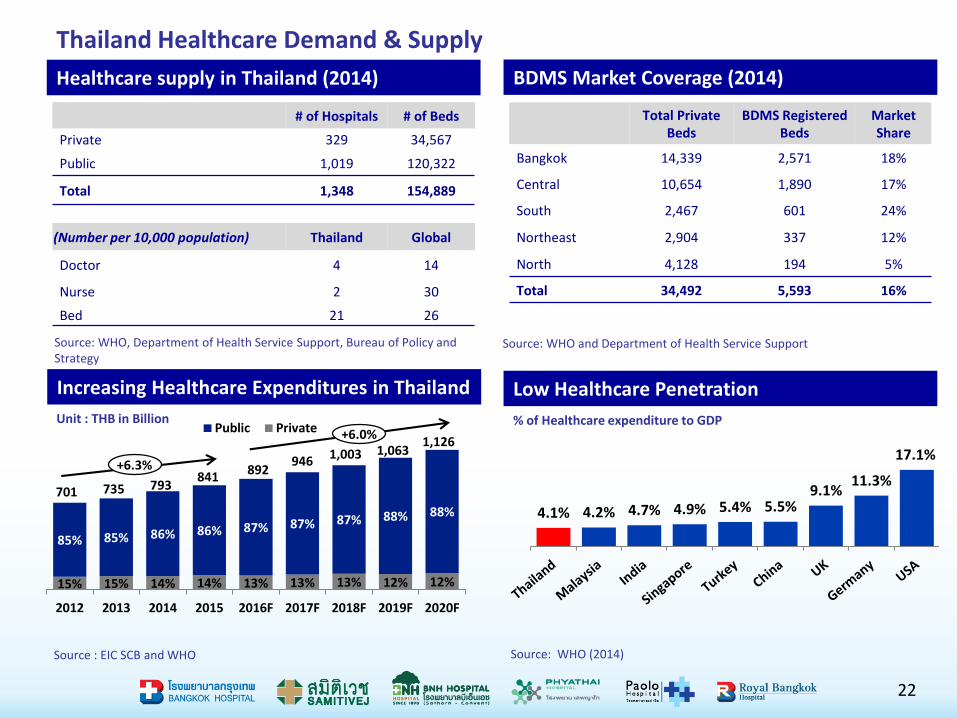
# of Hospitals # of Beds
Private 329 34,567
Public 1,019 120,322
Total 1,348 154,889
(Number per 10,000 population) Thailand Global
Doctor 4 14
Nurse 2 30
Bed 21 26
Thailand Healthcare Demand & Supply
Increasing Healthcare Expenditures in Thailand
% of Healthcare expenditure to GDP
Source: WHO and Department of Health Service Support
Healthcare supply in Thailand (2014)
Total Private Beds
BDMS RegisteredBeds
MarketShare
Bangkok 14,339 2,571 18%
Central 10,654 1,890 17%
South 2,467 601 24%
Northeast 2,904 337 12%
North 4,128 194 5%
Total 34,492 5,593 16%
Source: WHO (2014)
BDMS Market Coverage (2014)
22
4.1% 4.2% 4.7% 4.9% 5.4% 5.5%9.1%
11.3%
17.1%
Source : EIC SCB and WHO
Unit : THB in Billion
Low Healthcare Penetration
15% 15% 14% 14% 13% 13% 13% 12% 12%
85% 85% 86% 86% 87% 87% 87% 88% 88%
2012 2013 2014 2015 2016F 2017F 2018F 2019F 2020F
Public Private
841892
946 1,003 1,0631,126
793735701
+6.3%
+6.0%
Source: WHO, Department of Health Service Support, Bureau of Policy and Strategy
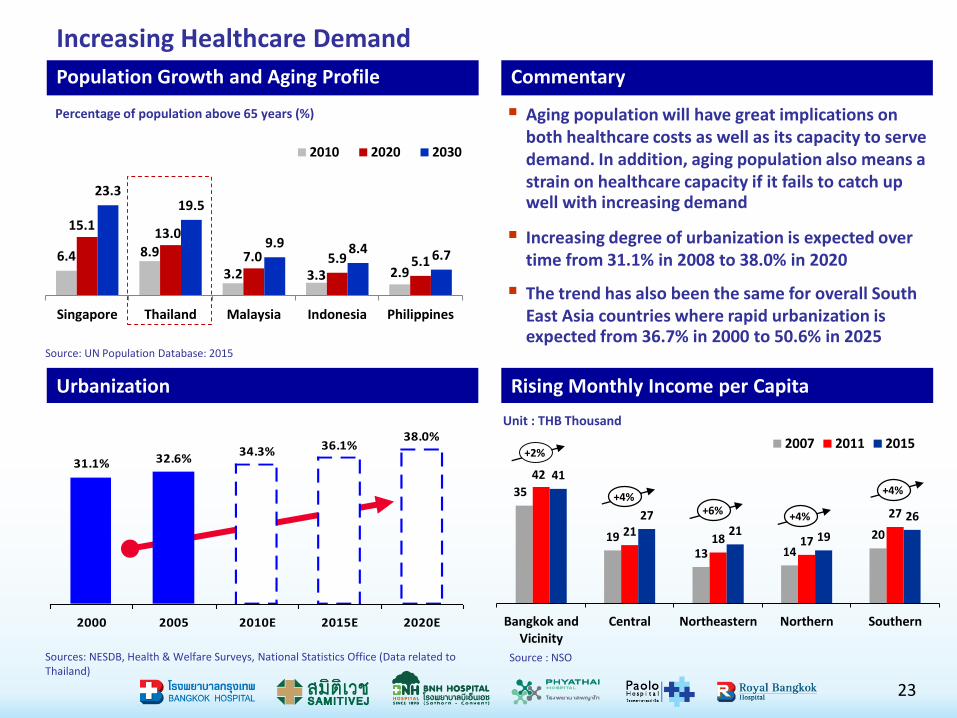
Increasing Healthcare Demand
Aging population will have great implications on both healthcare costs as well as its capacity to serve demand. In addition, aging population also means a strain on healthcare capacity if it fails to catch up well with increasing demand
Increasing degree of urbanization is expected over time from 31.1% in 2008 to 38.0% in 2020
The trend has also been the same for overall South East Asia countries where rapid urbanization is expected from 36.7% in 2000 to 50.6% in 2025
38.0%36.1%34.3%
32.6%31.1%
2000 2005 2010E 2015E 2020E
Sources: NESDB, Health & Welfare Surveys, National Statistics Office (Data related to Thailand)
6.4 8.9
3.2 3.3 2.9
15.113.0
7.0 5.9 5.1
23.319.5
9.9 8.4 6.7
Singapore Thailand Malaysia Indonesia Philippines
2010 2020 2030
Percentage of population above 65 years (%)
Source: UN Population Database: 2015
Population Growth and Aging Profile Commentary
Urbanization Rising Monthly Income per Capita
23
Source : NSO
Unit : THB Thousand
35
19
13 14
20
42
2118 17
27
41
2721 19
26
Bangkok andVicinity
Central Northeastern Northern Southern
2007 2011 2015+2%
+4%+6% +4%
+4%

Source: EIC, SCB and Ministry of Commerce
Procedures ( In USD) USA Singapore Thailand Malaysia India
Coronary Artery Bypass Graft 88,000 54,500 23,000 20,800 14,400
Valve Replacement with Bypass 85,000 49,000 22,000 18,500 11,900
Hip Replacement 33,000 21,400 16,500 12,500 8,000
Knee Replacement 34,000 19,200 11,500 12,500 7,500
Spinal Fusion 41,000 27,800 16,000 17,900 9,500
Gastric Bypass 18,000 13,500 12,000 8,200 6,800
Source: “Patient Beyond Border” 3rd edition by Josef Woodman (2015)
4.64.2
3.93.6
3.33.02.8
2.52.22.0
1.41.4
2008 2009 2010 2011 2012E 2013E 2014F 2015F 2016F 2017F 2018F 2019F
Medical Tourism
Million People
Increasing trend of international patient visits
Medical Tourism as a Rising Phenomenon
24
25
Operational Statistics
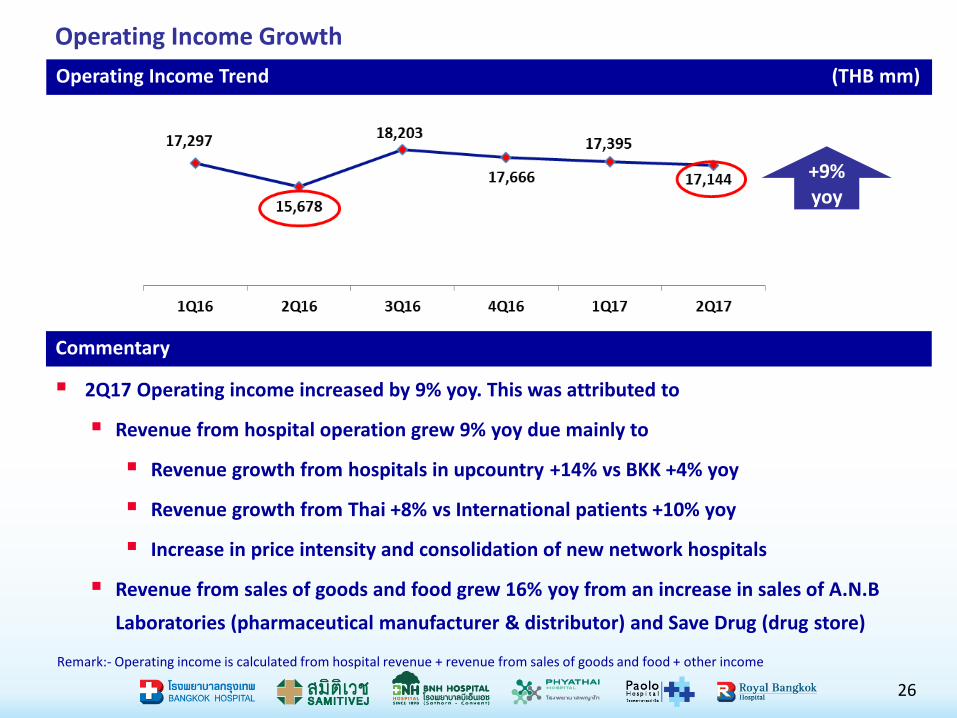
Operating Income Growth
Operating Income Trend (THB mm)
Remark:- Operating income is calculated from hospital revenue + revenue from sales of goods and food + other income
26
2Q17 Operating income increased by 9% yoy. This was attributed to
Revenue from hospital operation grew 9% yoy due mainly to
Revenue growth from hospitals in upcountry +14% vs BKK +4% yoy
Revenue growth from Thai +8% vs International patients +10% yoy
Increase in price intensity and consolidation of new network hospitals
Revenue from sales of goods and food grew 16% yoy from an increase in sales of A.N.B
Laboratories (pharmaceutical manufacturer & distributor) and Save Drug (drug store)
Commentary
+9% yoy

Operating Income Growth
Operating Income Trend (THB mm)
Remark:- Operating income is calculated from hospital revenue + revenue from sales of goods and food + other income
27
Commentary
6M17 Operating income increased by 5% yoy. This was attributed to
Increase in price intensity and complexity cases
However, volume growth was impacted by significant declining in influenza and dengue fever
cases in Thailand during 1Q17
Revenue growth from hospitals in upcountry +8% vs BKK +1% yoy
70%
30% 31%
69%71%72% 72% 72% 71%
28% 29%28% 29%28%
2012 2013 2014 2015 2016 6M16 6M17
Thai International
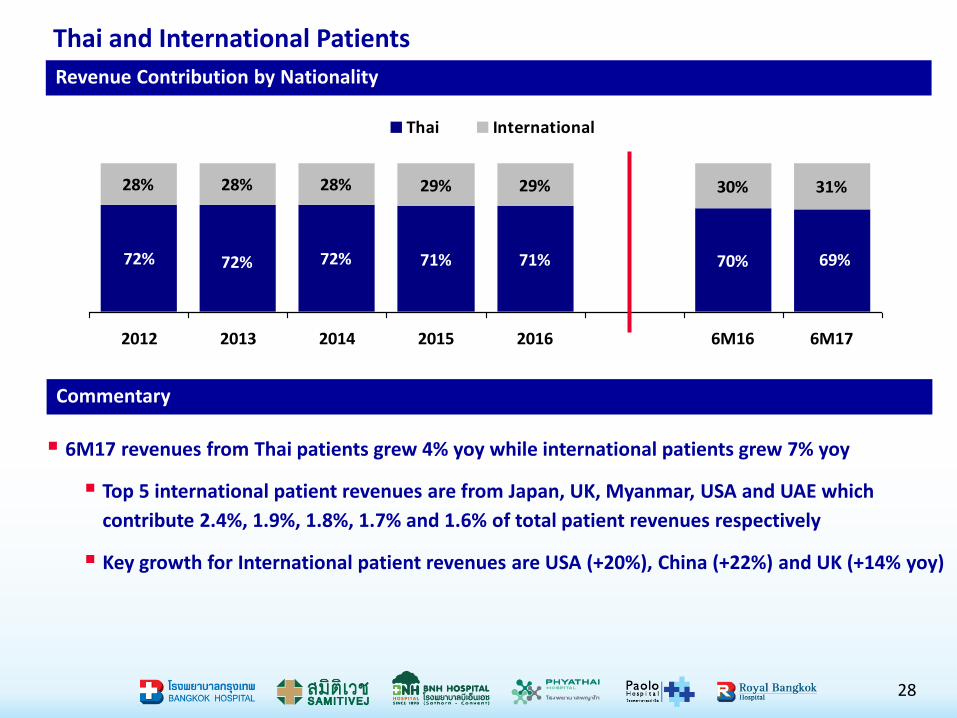
Thai and International Patients
Revenue Contribution by Nationality
Commentary
28
6M17 revenues from Thai patients grew 4% yoy while international patients grew 7% yoy
Top 5 international patient revenues are from Japan, UK, Myanmar, USA and UAE which
contribute 2.4%, 1.9%, 1.8%, 1.7% and 1.6% of total patient revenues respectively
Key growth for International patient revenues are USA (+20%), China (+22%) and UK (+14% yoy)
46% 47%
54% 53%
45%45%45%45% 46%
55% 55%55% 54%55%
2012 2013 2014 2015 2016 6M16 6M17
OPD IPD Others
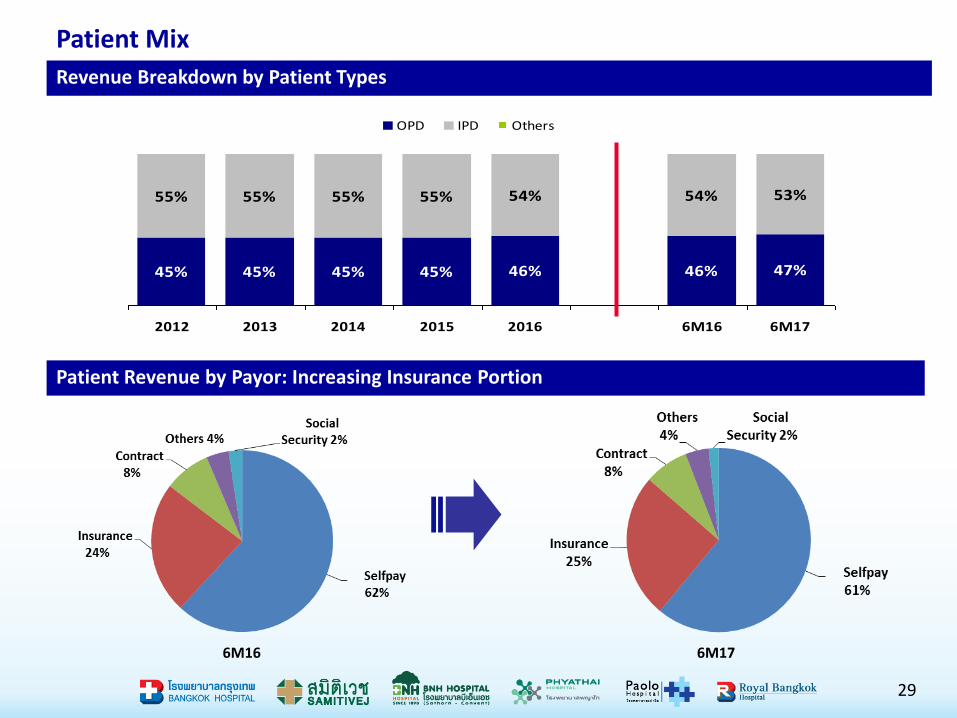
Patient Mix
Revenue Breakdown by Patient Types
29
Patient Revenue by Payor: Increasing Insurance Portion
6M16 6M17

Patient VolumeNumber of OPD Visits per Day
Average Daily Census ( ADC )
Remarks: - Including social security
30

Utilization of Beds
Average Length of Stay (days)
Utilization Based on Available Beds
Remarks:- Including social security patients
31

32
Financial Highlights
Diversified Sources of Revenues and Profitability
Commentary
33
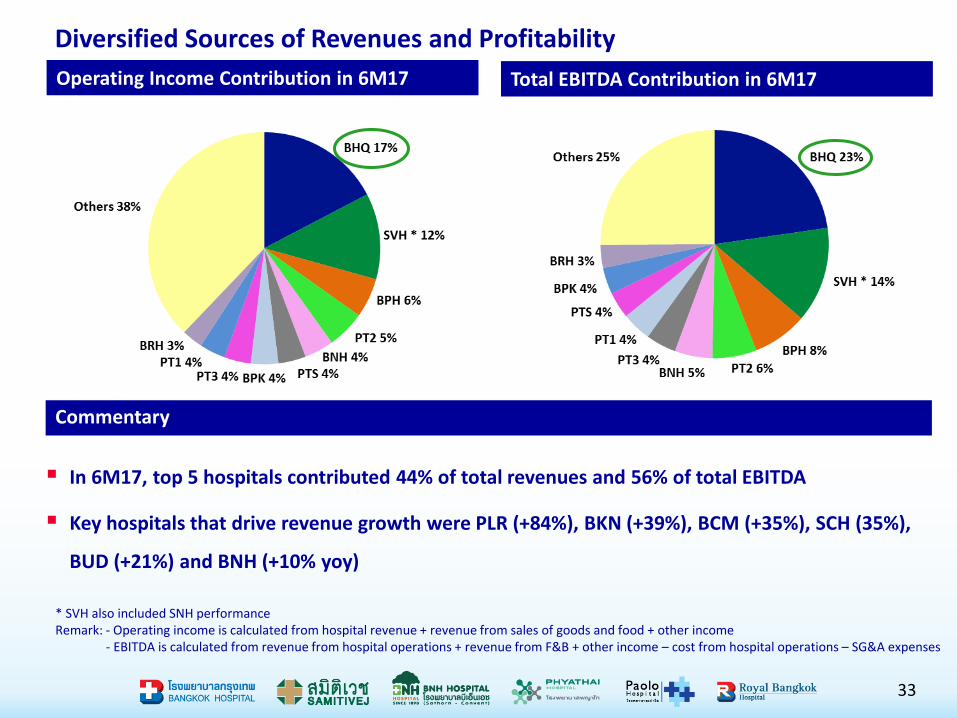
* SVH also included SNH performanceRemark: - Operating income is calculated from hospital revenue + revenue from sales of goods and food + other income
- EBITDA is calculated from revenue from hospital operations + revenue from F&B + other income – cost from hospital operations – SG&A expenses
Operating Income Contribution in 6M17 Total EBITDA Contribution in 6M17
In 6M17, top 5 hospitals contributed 44% of total revenues and 56% of total EBITDA
Key hospitals that drive revenue growth were PLR (+84%), BKN (+39%), BCM (+35%), SCH (35%),
BUD (+21%) and BNH (+10% yoy)

EBITDA & EBITDA Margin (THB mm)
Profitability Trend
34
EBIT & EBIT Margin * (THB mm)
Remarks: - Excluding non-recurring items
Profitability Trend
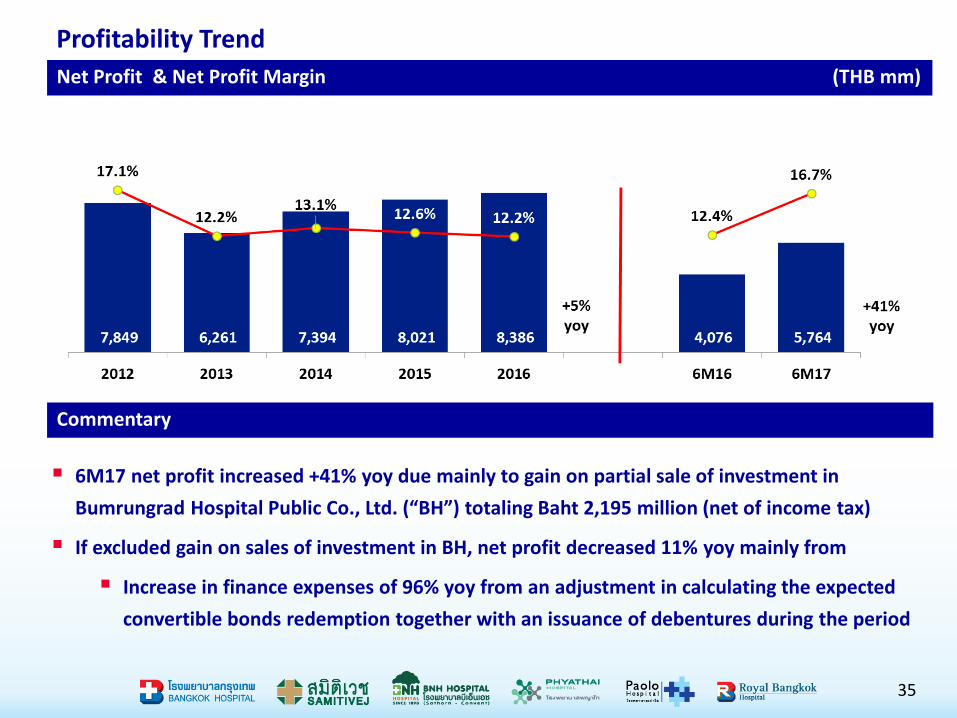
Net Profit & Net Profit Margin (THB mm)
35
6M17 net profit increased +41% yoy due mainly to gain on partial sale of investment in
Bumrungrad Hospital Public Co., Ltd. (“BH”) totaling Baht 2,195 million (net of income tax)
If excluded gain on sales of investment in BH, net profit decreased 11% yoy mainly from
Increase in finance expenses of 96% yoy from an adjustment in calculating the expected
convertible bonds redemption together with an issuance of debentures during the period
Commentary

Capital Management
36
Capital Structure as of June 2017 Dividend Payment & Payout Ratio
Gearing Ratios: Well Within Covenants Interest Coverage
1.7
2.2
1.7
1.9
2.5
0.4 0.6 0.5 0.5 0.6
2013 2014 2015 2016 6M17
Net Debt/EBITDA Net Debt/Equity
Net debt / EBITDA covenant < 3.25x
Net debt / equity covenant < 1.75x
11.413.0 12.5
16.7
9.3
2013 2014 2015 2016 6M17
Interest coverage covenant > 4.0x

37
Sustainability Development
Environmental Friendly
Encouraged reductions of energy use without reducing the quality of care and raised awareness on efficient energy consumption
Employee Well-Being and
Human Rights
Fully committed to support diversity and human rights in term of gender and cultural differences
Good Corporate Governance
Practiced good Corporate Governance to ensure long-term growth and sustainability
Social and Community
Development
Encouraged donation of medical supplies and equipment to unfortunate person
Provided health check-up to promote health and well-being of communities
Your Trusted Healthcare Network
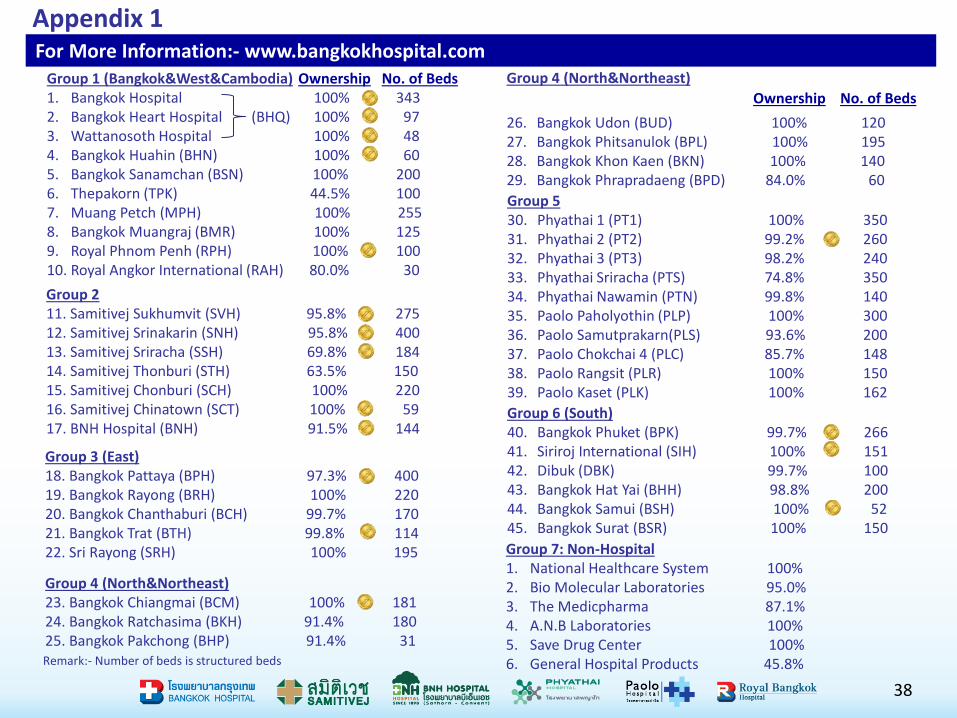
For More Information:- www.bangkokhospital.com
Remark:- Number of beds is structured beds
Appendix 1
Group 2 11. Samitivej Sukhumvit (SVH) 95.8% 27512. Samitivej Srinakarin (SNH) 95.8% 40013. Samitivej Sriracha (SSH) 69.8% 18414. Samitivej Thonburi (STH) 63.5% 15015. Samitivej Chonburi (SCH) 100% 22016. Samitivej Chinatown (SCT) 100% 5917. BNH Hospital (BNH) 91.5% 144
Group 1 (Bangkok&West&Cambodia)1. Bangkok Hospital 100% 3432. Bangkok Heart Hospital (BHQ) 100% 973. Wattanosoth Hospital 100% 484. Bangkok Huahin (BHN) 100% 605. Bangkok Sanamchan (BSN) 100% 2006. Thepakorn (TPK) 44.5% 1007. Muang Petch (MPH) 100% 2558. Bangkok Muangraj (BMR) 100% 1259. Royal Phnom Penh (RPH) 100% 10010. Royal Angkor International (RAH) 80.0% 30
Ownership No. of Beds
Group 7: Non-Hospital1. National Healthcare System 100%2. Bio Molecular Laboratories 95.0%3. The Medicpharma 87.1%4. A.N.B Laboratories 100%5. Save Drug Center 100%6. General Hospital Products 45.8%
Group 3 (East)18. Bangkok Pattaya (BPH) 97.3% 40019. Bangkok Rayong (BRH) 100% 22020. Bangkok Chanthaburi (BCH) 99.7% 17021. Bangkok Trat (BTH) 99.8% 11422. Sri Rayong (SRH) 100% 195
Group 6 (South)40. Bangkok Phuket (BPK) 99.7% 26641. Siriroj International (SIH) 100% 15142. Dibuk (DBK) 99.7% 10043. Bangkok Hat Yai (BHH) 98.8% 20044. Bangkok Samui (BSH) 100% 5245. Bangkok Surat (BSR) 100% 150
Group 5 30. Phyathai 1 (PT1) 100% 35031. Phyathai 2 (PT2) 99.2% 26032. Phyathai 3 (PT3) 98.2% 24033. Phyathai Sriracha (PTS) 74.8% 35034. Phyathai Nawamin (PTN) 99.8% 14035. Paolo Paholyothin (PLP) 100% 30036. Paolo Samutprakarn(PLS) 93.6% 20037. Paolo Chokchai 4 (PLC) 85.7% 14838. Paolo Rangsit (PLR) 100% 15039. Paolo Kaset (PLK) 100% 162
Group 4 (North&Northeast)
26. Bangkok Udon (BUD) 100% 12027. Bangkok Phitsanulok (BPL) 100% 19528. Bangkok Khon Kaen (BKN) 100% 14029. Bangkok Phrapradaeng (BPD) 84.0% 60
Ownership No. of Beds
38
Group 4 (North&Northeast)23. Bangkok Chiangmai (BCM) 100% 18124. Bangkok Ratchasima (BKH) 91.4% 18025. Bangkok Pakchong (BHP) 91.4% 31

Source: Summary of the information from Thailand Securities Depository Company Limited (TSD)* Consisted of Bangkok Airways PCL and Bangkok Airways Holding Co., Ltd** Consisted of Miss Noppamas Ladpli, Mrs. Atinuch Malakul Na Ayudhaya and Mr. Parameth Ladpli
Shareholding Structure (As of 16 March 2017)
39
% of Shareholding
1 Mr. Prasert Prasarttong-Osoth, M.D. and family 23.3%
2 Mr. Wichai Thongtang and family 8.3%
3 Bangkok Airways* 7.8%
4 The Viriyah Insurance Co., Ltd. 6.1%
5 Thai NVDR Co., Ltd. 3.8%
6 Social Security Office 3.0%
7 Mr. Chirotchana Suchato, M.D. and family 2.7%
8 Ladpli family** 2.3%
9 Mr. Chuladej Yossundharakul, M.D. and family 1.9%
10 The Bank of New York Mellon 1.9%
Total 61.2%
Appendix 2


