23
Bangladesh
Bangladesh
Country Synthesis Report on
Urban Air Quality Management
Bangladesh
Discussion Draft, December 2006
© 2006 Asian Development Bank and the Clean Air Initiative for Asian Cities (CAI-Asia) Center.
All rights reserved. Published 2006 by the Asian Development Bank (ADB).
Printed in the Philippines.
ADB facilitated this study through its Regional Technical Assistance 6291: Rolling Out Air Quality Management in Asia.
The Study was led by the CAI-Asia Secretariat and the information contained in this report was developed by the CAI-Asia Secretariat with inputs by a range of organizations and air quality
experts from across Asia and elsewhere.
The views expressed in this report are those of the authors and do not necessarily refl ect the views of ADB or its Board of Governors or the Governments they represent.
ADB does not guarantee the accuracy of the data included in the publication and accepts no responsibility for any consequence of their use.
The term “country” does not imply any judgment by ADB to the legal or other status of any territorial entity.

Tables and Figures ivAbbreviations vAcknowledgments vi
General Information 1Geography and Climate 1Urbanization and Population 1Industry and Economy 2Energy 2Transport 2
Sources of Air Pollution 4Emissions Inventory 4Source Apportionment 4
Status of Air Quality 6Air Quality Monitoring 6Air Quality Data 6Reporting of AQ Information 8
Impacts of Air Pollution 9Air Quality Management 10
Legislation and Mandate 10Ambient AQ Standards 10Management of Mobile Sources 10Management of Stationary Sources 11Public/Nongovernment/Development Agency
Participation 12Conclusion 13
References 14
Table of Contents
Tables and Figures
Tables2.1 Average Mass Contribution to Particulate Pollution
in Dhaka, 1993–1994 (%) 43.1 Results of Ambient Air Quality Analysis at Various
Areas in Chittagong (μg/m3) 83.2 TSP Concentrations in Some Major Cities in
Bangladesh 83.3 Proposed AQI for Bangladesh 85.1 Updated (2005) Bangladesh National Ambient Air Quality Standards vs. WHO Guideline Values
and US EPA Standards 11
Figures1.1 Registered Motor Vehicle Mix in Bangladesh
and Dhaka, 2005 32.1 Emissions Inventory of Mobile Sources in Dhaka 43.1 Annual Average PM10 and PM2.5 in Dhaka 73.2 Seasonal Variations in PM10 and PM2.5
Concentrations 73.3 Seasonal Variations in NO2 Concentrations
in Dhaka 73.4 Monthly Concentrations of Sulfur Dioxide
in Dhaka 7
ADB Asian Development BankAQ air qualityAQM air quality managementAQMP Air Quality Management ProjectBAEC Bangladesh Atomic Energy CommissionCAMS continuous air quality monitoring stationCO Carbon monoxide DOE Department of EnvironmentGDP gross domestic productHC hydrocarbonkm2 square kilometer NAAQS National Ambient Air Quality StandardsNO2 Nitrogen dioxideO3 ozonePb leadPbB blood lead (level)PM10 particulate matter with a diameter of not
more than 10 micronsPM2.5 particulate matter with a diameter of not
more than 2.5 micronsppb parts per billionppm parts per millionSAMS Satellite Air Quality Monitoring StationSO2 Sulfur dioxide μg/dL micrograms per deciliter μg/m3 micrograms per cubic meterWHO World Health Organization
Note: “$” means “US dollar” in this publication.
Abbreviations
Th is series of country reports is the fi rst time that a com-prehensive overview of urban air quality management (AQM) at the country level has been prepared in Asia. Research compilation for this country synthesis report (CSR) on Urban Air Quality Management was led by the Clean Air Initiative for Asian Cities (CAI-Asia) Secretariat with inputs by a range of organizations and air quality experts from across Asia and elsewhere and facilitated by the Asian Development Bank (ADB) through its Regional Technical Assistance No. 6291: Rolling Out Air Quality Management in Asia. Th e primary authors of the reports are Ms. Aurora Fe Ables, Ms. May Ajero, Mr. Herbert Fabian, and Ms. Ninette Ramirez, all from CAI-Asia, under the supervision of Mr. Cornie Huizenga, Head of Secretariat, CAI-Asia.
Th e CSRs were prepared with assistance from volunteer authors from the diff erent countries and facilitated by CAI-Asia local networks in Nepal (Clean Air Network-Nepal), Pakistan (Pakistan Clean Air Network), Philippines (Partnership for Clean Air [PCA]), the People’s Republic of China (PRC) (CAI-Asia Project Offi ce), Sri Lanka (Clean Air Sri Lanka), and Viet Nam (Viet Nam Clean Air Partnership). CAI-Asia local networks have also organized in the respective countries a development partners meeting on clean air where initial draft s of the CSRs were presented to local AQM stakeholders.
Acknowledgments
For the Bangladesh Country Synthesis Report, CAI-Asia is grateful to Mr. Mohammad Nasimul Islam of ADB, Dr. Amjad Uddin Ahmed of Mawts Institute of Technology, and Mr. Hasibul Hasan Hasib and Dr. Mohammad Nasiruddin of the Air Quality Management Project Offi ce in the Bangladesh Department of Environment for providing comments to the report.
CAI-Asia would like to thank ADB for facilitating the research and Mr. Masami Tsuji, Senior Environment Specialist, Dr. David McCauley, Senior Environmental Economist, and Mr. Nessim Ahmad, Director—all from the Environment and Social Safeguard Division, Regional and Sustainable Development Department—for providing guidance. Ms. Glynda Bathan, Mr. Michael Co, Ms. Agatha Diaz, and Ms. Gianina Panopio of CAI-Asia are also acknowledged for their logistical and technical support for the CSR team.
CAI-Asia and the respective country Ministries of Environments reviewed the volume—with technical review inputs from Prof. Frank Murray of Murdoch University—which Ms. Agnes Adre and Ms. Ma. Th eresa Castillo copyedited. Mr. Segundo dela Cruz, Jr. handled the graphic design and layout.

Geography and Climate Bangladesh, with an area of about 147,570 square kilometers (km2), is located in the tropics between 20o34’ and 26o38’ north latitudes and 88o1’ and 92041’ east longitudes in South Asia, is bounded by India on the west, the north, and northeast, and Myanmar on the southeast. It is one of the largest deltas in the world formed by the congruence of three Himalayan rivers with a long coastline along the Bay of Bengal. Floodplains (80%), terraces (8%), and hills (12%) cover the land area. Dhaka is the capital city of Bangladesh. It covers an area of 360 km2 and is one of six municipalities in the middle of the Dhaka Metropolitan Area known as the Capital Development Authority. Th e city is situated in the populous and fl ood-prone Ganges-Brahmaputra delta. Dhaka is in eff ect an island within the delta, especially during fl oods in the wet season (Asian Development Bank [ADB] 2001).
Th e country has a subtropical monsoon climate characterized by high temperature and heavy rainfall, and oft en with very high humidity. Th e three seasons are distinct—mild winter (November to February), hot, humid summer (March to June), and humid, warm rainy monsoon (June to October). Bangladesh is coldest in late December and early January with temperatures dipping as low as an average of 4 to 7oC. Temperatures then increase toward April where it varies from 27 to 30oC in most parts of the country, except for some areas such as the Rajshahi and Kushtia districts where the maximum temperature rises up to 40oC or more (Asiatic Society of Bangladesh 2006).
Dhaka has an annual average temperature of 25ºC and monthly means varying from 18ºC in January and 29ºC in August. Approximately 80% of the annual average rainfall of 1,854 mm occurs between May and September. Chittagong has a complete tropical monsoon climate with hot, wet summer and dry, cool winter seasons. Th e average maximum temperatures are between 29oC and 35oC and average
General Information» Part One
minimum temperatures are between 12oC and 17oC. Th e total annual rainfall throughout the city varies generally between 2, fully 159 mm (85 inches) and 3,048 mm (120 inches). On the average, approximately 80% of the yearly rainfall occurs during the May to September monsoon.
Urbanization and PopulationAs of mid-2005, 137 million people live in Bangladesh. Th e population is growing at an annual rate of 1.4%. Th e population density of 928 persons per km2 is also among the highest in the world. Urban population share is 25.1% and grows at 3.0% annually (ADB 2006).
In 2000, Dhaka had a population of approximately 12 million. Th e city also has one of the highest annual population growth rates in the Asian Region as projected by the United Nations. From 1992 to 1999, the city’s population grew at an annual rate of 6.4% (United Nations Development Program [UNDP] and World Bank 2002). Th e port city of Chittagong is the second largest city in the country. Other major cities include Khulna, Rajshahi, Barisal, and Sylhet. Th ese six cities also correspond to the main centers of the country’s six administrative regions.
Dhaka is the center of economic, political, and cultural activities in Bangladesh. Th e city’s urban infrastructure is the most developed in the country and has seen in recent years, the modernization of its transport, communication, and public works sectors. As the city attracts more industries, the capital is facing severe challenges such as pollution, congestion, and supply shortages. Chittagong is the second biggest city in Bangladesh, next to Dhaka.
2 COUNTRY SYNTHESIS REPORT ON URBAN AIR QUALITY MANAGEMENT
Industry and EconomyIn the past few years, the Bangladesh gross domestic product (GDP) has been growing at an average of 5.5%.1 In 2005, GDP growth rate was 5.8%. Th e main contribution came from the services sector (54.5%), industry (26.3%), and agriculture sector (19.2%). Of these three sectors, the industry sector showed the highest growth at 8.5%, while the agriculture sector barely grew at 0.3% (ADB 2006). Although the services sector generates more than half of GDP share, the agriculture sector provides nearly two-thirds of employment in the country (Central Intelligence Agency [CIA] 2006).
Dhaka is a major, cultural, and manufacturing center. Th e common types of industries in and around the periphery of Dhaka are ready-made garment manufacturing, jute, tanneries, textile, tea processing, fertilizer, cement, paper and pulp, chemicals and pesticides, food and sugar, pharmaceuticals, petroleum refinery, distillery, rubber, plastics, and brick manufacturing, assembling buses, trucks, and motorcycles, assembling radios and televisions (Malé Declaration 2000).
Chittagong’s status as a port city has attracted signifi cant industrial development. Most industries have been built near the Bay of Bengal and the Karnaphuli River. Industries include shipbreaking, steel production, food processing, textile, petroleum products, chemical manufacturing, and many others. Th e Department of Environment (DOE) has classifi ed industrial premises into four categories, ranging from clean to highly polluting. Th e areas to the north and east of Chittagong contain a good number of brickfi elds. Th e kilns use coal, rubber tires, oil, and other products for fuel, resulting in signifi cant emissions and potential impacts on air quality (AQ) in the city.
Energy Bangladesh is rich in natural gas resources, which supplies most of its energy requirements. Th e natural gas available in Bangladesh has low sulfur content. As of 2005, Bangladesh had a proven gas reserve of 440 billion cubic meters, of which only about 14.2 billion (3.2%) were produced for energy use (British Petroleum [BP] 2006). Bangladesh has small oil reserves.
1 Based on annual GDP growth rates 2000–2005 from ADB 2006. Key Indicators 2006.
The country consumed about 17.4 million tons of oil equivalent in 2005, which is 5.9% higher than 2004. Energy demand in 2005 was supplied mainly by indigenous natural gas (73.1%) and oil (22.9%). Th e remainder is produced by coal and hydroelectric power (BP 2006).
Major consumption of petroleum is in the transport sector (50%), followed by domestic (18%), agriculture (16%), power (10%), and industry (6%). Majority of natural gas is consumed in homecooking, electricity generation, and as a fuel in CNG vehicles (ADB 2005).
Bangladesh has 18 power stations with a total installed power generation capacity of 3.6 gigawatt (GW) fueled mostly by natural gas (94%). Th e commercial sector consumes most of this electricity.
Access to and availability of electricity is very poor in the country. Only 20% of the population has access to electricity (25% of urban areas and 10% in rural areas). Demand for electricity oft entimes signifi cantly exceeds supply (or production), particularly during summer, so load shedding is regularly practiced in the country. The low supply is oft entimes due to low gas pressures. Lack of electricity supply has resulted in the suspension of industrial production and operations.
Bangladesh is considering the use of alternative sources of energy to provide power to those not covered by conventional grid electricity (ADB 2005). Th e Government has draft ed a renewable energy policy promoting the use of wind power, biomass, and solar energy. Pilot projects demonstrating the use of wind power for pumping, drinking, and irrigation water have been established in the areas around Chittagong. Biomass is a major source of fuel for cooking in the rural areas of Bangladesh but is not used extensively in urban areas.
TransportTh e ratio of vehicles to people in Bangladesh is lower when compared with other developing countries in Asia. As of end of 2005, there were only about 850,000 vehicles in Bangladesh, about 45% of which are registered in Dhaka. However, it is also important to note that the registered vehicles are only about 25–50% of the actual vehicles plying the roadways due to a limited enforcement of registration regulations
BANGLADESH 3
(Intercontinental Consultants and Technocrats Pvt [ICTP] 2001).
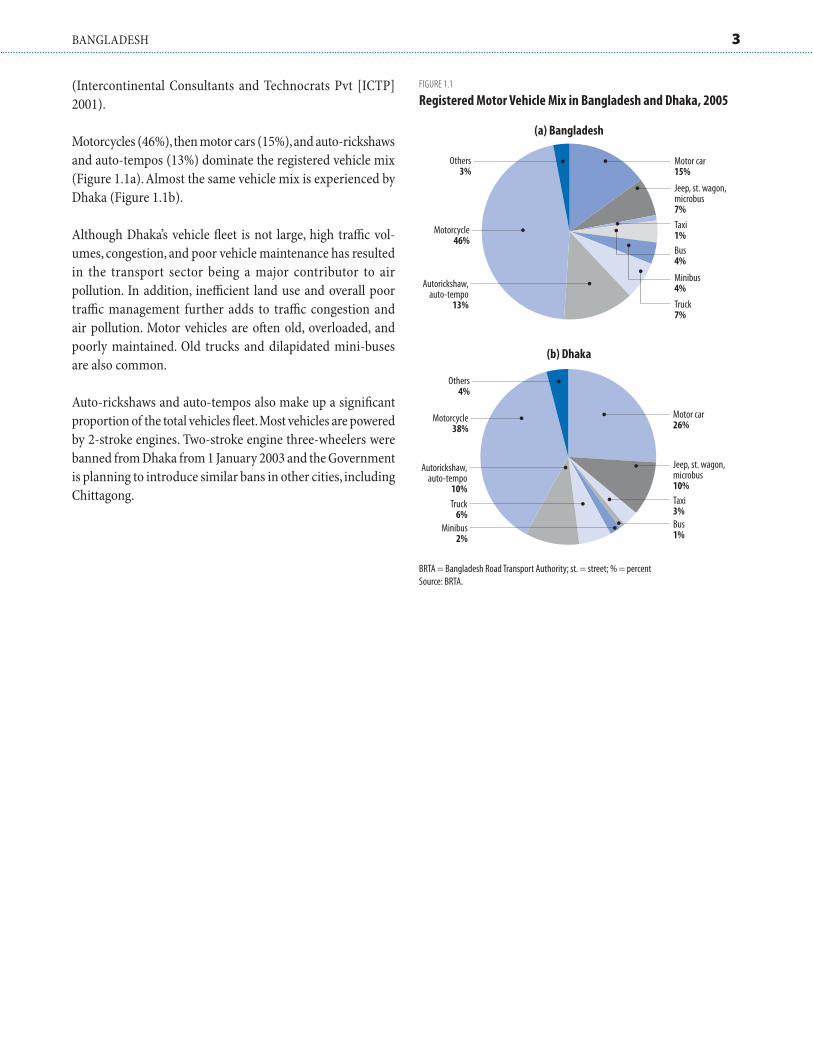
Motorcycles (46%), then motor cars (15%), and auto-rickshaws and auto-tempos (13%) dominate the registered vehicle mix (Figure 1.1a). Almost the same vehicle mix is experienced by Dhaka (Figure 1.1b).
Although Dhaka’s vehicle fl eet is not large, high traffi c vol-umes, congestion, and poor vehicle maintenance has resulted in the transport sector being a major contributor to air pollution. In addition, ineffi cient land use and overall poor traffi c management further adds to traffi c congestion and air pollution. Motor vehicles are oft en old, overloaded, and poorly maintained. Old trucks and dilapidated mini-buses are also common.
Auto-rickshaws and auto-tempos also make up a signifi cant proportion of the total vehicles fl eet. Most vehicles are powered by 2-stroke engines. Two-stroke engine three-wheelers were banned from Dhaka from 1 January 2003 and the Government is planning to introduce similar bans in other cities, including Chittagong.
FIGURE 1.1
Registered Motor Vehicle Mix in Bangladesh and Dhaka, 2005
BRTA = Bangladesh Road Transport Authority; st. = street; % = percent
Source: BRTA.
����������� ������ �����
� � ��������
�����
��� ����������� �����
���
��������
������
����������������
� � ���������
����������� ������ �����
� � �������
��� ������������ �����
��
��������
������
� � ���������
�������
��������
�����
(a) Bangladesh
(b) Dhaka

Sources of Air Pollution
Emissions InventoryVery limited information on emissions inventory and source apportionment is available. Efforts to compile emissions inventories are mostly limited to mobile sources. Th ere is no national emissions inventory.
Emissions inventory of mobile sources in Dhaka show that contributions of diff erent vehicles dominate certain types of pollutants (Figure 2.1). Petrol-fueled light-duty vehicles (cars/vans) and auto-rickshaws contribute 85% Carbon monoxide (CO), while diesel-fueled buses and trucks contribute 84%—most of total Nitrogen oxides (NOx). Two- and three-wheeled auto-rickshaws contribute about half of the total hydrocarbon (HC) emissions, while particulate matter (PM) emissions come mostly from diesel buses and trucks (45%), and auto-rickshaws (40%).
» Part Two
Source ApportionmentTh e Bangladesh Atomic Energy Commission (BAEC) studied the trace element composition of samples particulate matter with a diameter of not more than 10 microns (PM10) and particulate matter with a diameter of not more than 2.5 microns (PM2.5) in Dhaka during 1993–1994, using the positive matrix factorization method (PMF) (Biswas et al. 2000). Th e results showed that approximately 55% of the particles with diameter not more than 10 microns (PM10) are attributed to resuspended soil and motor vehicle with the latter having a 31% contribution. Fine particulates or particles with diameter not more than 2.5 microns (PM2.5) were mostly attributed to motor vehicles (29%) and natural gas/ diesel burning (46%). Table 2.1 presents the complete results showing the eight identifi ed sources.
Source Type Coarse (PM10
) Fine (PM2.5
)
Resuspended Soil 54.7 ± 2.4 8.88 ± 5.04
2-stroke engine 6.07 ± 1.8 2.03 ± 3.24
Construction works 7.09 ± 3.36
Motor vehicles 31.2 ± 6.1 29.1 ± 4.6
Sea salt 0.22 ± 3.69 4.11 ± 2.48
Refuse burning 0.74 ± 5.96
Natural gas/diesel burning 45.7 ± 8.3
Metal smelting 10.2 ± 8.1
TABLE 2.1
Average Mass Contribution to Particulate Pollution in Dhaka,
1993–1994 (%)
PM10
= particulate matter with a diameter of not more than 10 microns; PM2.5
= particulate matter
with a diameter of not more than 2.5 microns; % = percent
Source: Biswas et al., 2000.
FIGURE 2.1
Emissions Inventory of Mobile Sources in Dhaka
CO = Carbon monoxide; HC = hydrocarbon; NOX = Nitrogen oxide; PM = particulate matter;
% = percent
Source: Nasiruddin (2006).
���!"��� ��� �#��� ���!����� ������$
%&
'$
(&
)$
*&
+$,����� -�� �������������� ������.������������/01
2�3��4 �

BANGLADESH 5
In a follow-up study using the same methodology in 2000 to 2002, BAEC conducted source apportionment in a hot spot and a semi-residential site in Dhaka. Th e results showed that motor vehicles account for a substantial part of fi ne particulates for both the hot-spot (43%) and semi-residential sites (38.2%). Th e results also show that soil dust or resuspended soil account
for almost half of the total coarse particulates for the hot-spot site, as well as the semi-residential site. For stationary sources, biomass burning and/or brick kiln manufacturing have a high percentage in the total fi ne particulates in the hot spot. Th is can be directly attributed to the number of brick kiln manufacturing areas in Dhaka.
Status of Air Quality
Air Quality MonitoringUntil recently, ambient AQ monitoring in Bangladesh was conducted on intermittent and project basis. In the past, most AQ monitoring eff orts were undertaken in the capital city of Dhaka. With support from the World Bank and DOE, Bangladesh now has some capacity to monitor AQ using continuous AQ monitors. DOE has set up four monitoring stations in four divisional towns namely, Dhaka, Chittagong, Khulna, and Bogra. Th e parameters measured are PM, Sulfur oxides (SO), NOx, and CO.
Other institutions such as BAEC and the Bangladesh University of Engineering and Technology (BUET) still conduct monitoring of ambient AQ for research purposes. Data from these institutions are published in the form of thesis or publications in international and national journals, which are available for further studies. Some data are also published in leading newspapers and magazines aimed at generating awareness among the citizens (Malé Declaration 2000).
In 2002, a continuous air quality monitoring station (CAMS) was established at the premises of the national Parliament Building, the Jatiyo Sangsad, located at the heart of the capital city, Dhaka, under the World Bank-fi nanced Air Quality Management Project (AQMP). Continuous monitors—meeting United States Environmental Protection Agency (US EPA) Federal Reference Method specifi cations—measures NOx, CO, SOx, ozone [O3]), and methane and non-methane hydrocarbons (NMHCs) continuously for 24 hours. Th e data are recorded as hourly averages from which 8-hour, 24-hour, and other averaging periods can be generated. Th e equipment used to measure PM is the PM10 inlet equipped high volume sampler for PM10 and the Partisol sampler for PM2.5. Th e equipment’s performance was validated against the GENT air sampler, for size fractionated air PM used by BAEC (Akhter et al. 2003).
» Part Three
In 2006, another CAMS was set up at the premises of Bangladesh Television Center in the port city of Chittagong. Th e station also monitors criteria pollutants like SOx, NOx, CO, O3, NMHC, PM10, and PM2.5. Similar CAMS will be set up in Rajshahi and Khulna towns and an additional CAMS in Dhaka at hot spots within 2007.
Air Quality DataAQ data in the country is available for the capital city, Dhaka. Results of monitoring in other cities are still limited. Since AQ monitoring data has only been consistently gathered at constant locations only for fi ve years in Dhaka, it is insuffi cient to indicate long-term trends in the AQ of the city, but can only provide indications of tendencies. It has provided enough data, however, to determine variations in AQ based on seasonal changes.
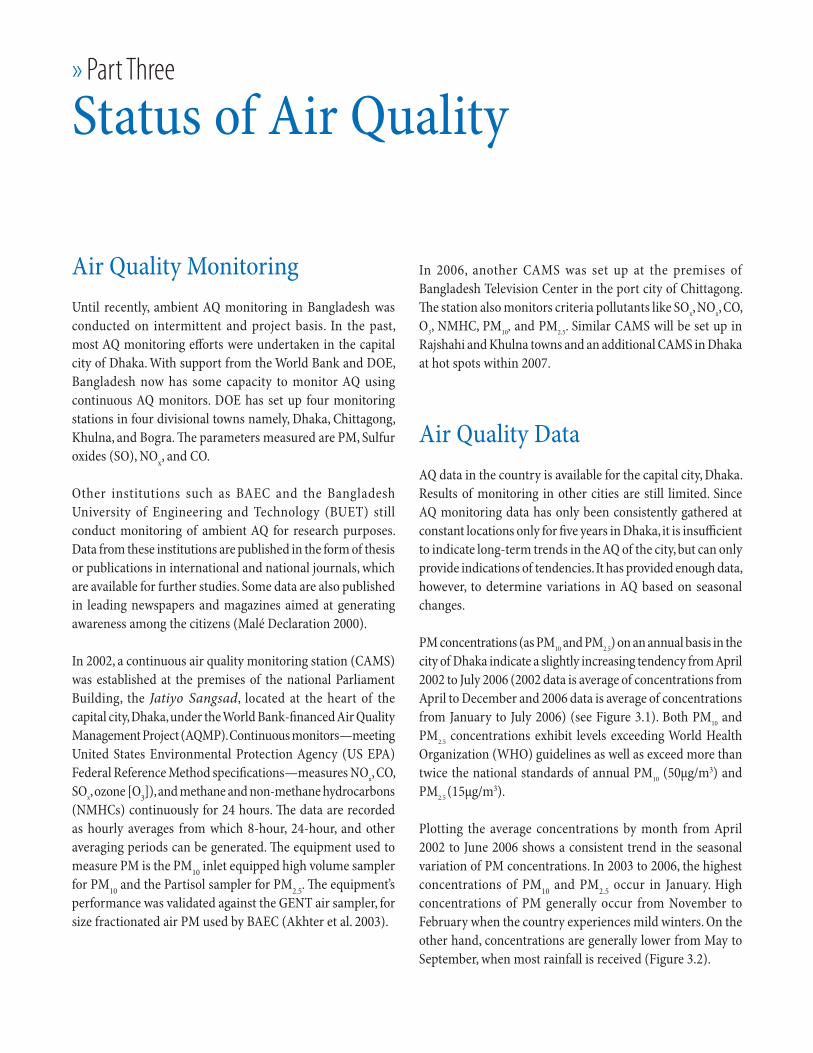
PM concentrations (as PM10 and PM2.5) on an annual basis in the city of Dhaka indicate a slightly increasing tendency from April 2002 to July 2006 (2002 data is average of concentrations from April to December and 2006 data is average of concentrations from January to July 2006) (see Figure 3.1). Both PM10 and PM2.5 concentrations exhibit levels exceeding World Health Organization (WHO) guidelines as well as exceed more than twice the national standards of annual PM10 (50μg/m3) and PM2.5 (15μg/m3).
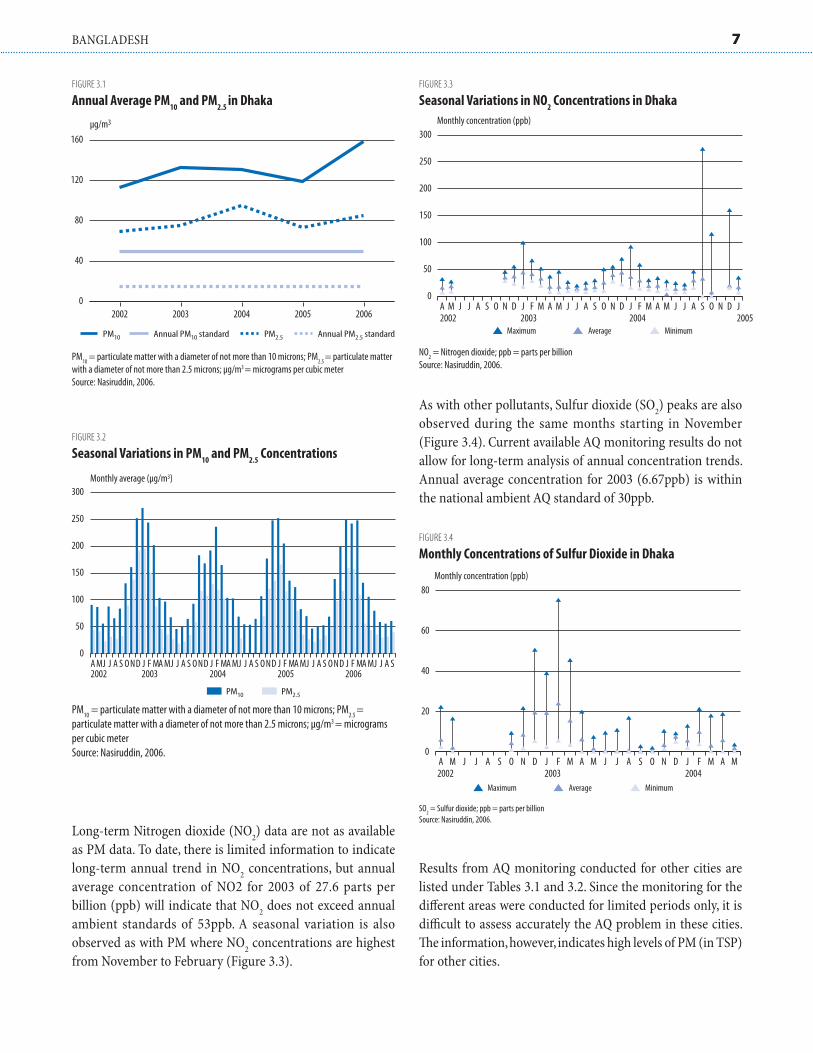
Plotting the average concentrations by month from April 2002 to June 2006 shows a consistent trend in the seasonal variation of PM concentrations. In 2003 to 2006, the highest concentrations of PM10 and PM2.5 occur in January. High concentrations of PM generally occur from November to February when the country experiences mild winters. On the other hand, concentrations are generally lower from May to September, when most rainfall is received (Figure 3.2).
BANGLADESH 7
Long-term Nitrogen dioxide (NO2) data are not as available as PM data. To date, there is limited information to indicate long-term annual trend in NO2 concentrations, but annual average concentration of NO2 for 2003 of 27.6 parts per billion (ppb) will indicate that NO2 does not exceed annual ambient standards of 53ppb. A seasonal variation is also observed as with PM where NO2 concentrations are highest from November to February (Figure 3.3).
As with other pollutants, Sulfur dioxide (SO2) peaks are also observed during the same months starting in November (Figure 3.4). Current available AQ monitoring results do not allow for long-term analysis of annual concentration trends. Annual average concentration for 2003 (6.67ppb) is within the national ambient AQ standard of 30ppb.
FIGURE 3.1
Annual Average PM10
and PM2.5
in Dhaka
PM10
= particulate matter with a diameter of not more than 10 microns; PM2.5
= particulate matter
with a diameter of not more than 2.5 microns; μg/m3 = micrograms per cubic meter
Source: Nasiruddin, 2006.
5�!�'
6$$6 6$$' 6$$( 6$$& 6$$)$
($
7$
%6$
%)$
2�%$ �������2�%$�����8��8 2�6& �������2�6&�����8��8
FIGURE 3.2
Seasonal Variations in PM10
and PM2.5
Concentrations
PM10
= particulate matter with a diameter of not more than 10 microns; PM2.5
=
particulate matter with a diameter of not more than 2.5 microns; μg/m3 = micrograms
per cubic meter
Source: Nasiruddin, 2006.
� �������.������/5�!�'1
��� � � , �39 � : ���� � � , �39 � : ���� � � , �39 � : ���� � � , �39 � : ���� � � ,$
&$
%$$
%&$
6$$
6&$
'$$
2�%$ 2�6&
6$$6 6$$' 6$$( 6$$& 6$$)
FIGURE 3.3
Seasonal Variations in NO2 Concentrations in Dhaka
NO2 = Nitrogen dioxide; ppb = parts per billion
Source: Nasiruddin, 2006.
� ������� ��������� ��/���1
� � � � � , � 3 9 � : � � � � � � , � 3 9 � : � � � � � � , � 3 9 �$
&$
%$$
%&$
6$$
6&$
'$$
6$$6 6$$' 6$$( 6$$&������� �.����� �������
Results from AQ monitoring conducted for other cities are listed under Tables 3.1 and 3.2. Since the monitoring for the diff erent areas were conducted for limited periods only, it is diffi cult to assess accurately the AQ problem in these cities. Th e information, however, indicates high levels of PM (in TSP) for other cities.
FIGURE 3.4
Monthly Concentrations of Sulfur Dioxide in Dhaka
SO2 = Sulfur dioxide; ppb = parts per billion
Source: Nasiruddin, 2006.
� ������� ��������� ��/���1
� � � � � , � 3 9 � : � � � � � � , � 3 9 � : � � �$
6$
($
)$
7$
������� �.����� �������
6$$6 6$$' 6$$(

8 COUNTRY SYNTHESIS REPORT ON URBAN AIR QUALITY MANAGEMENT
Reporting of AQ InformationBangladesh has adopted an AQ index system to be used for raising the awareness of the public on the quality of air that they breathe. Th e AQ index for Bangladesh is primarily based on US EPA’s system. Ideally, AQI should be made public on a daily manner, however, due to lack of infrastructure and equipment, DOE will initially present the AQI three times a week (Islam 2003).
AQMP reviewed US EPA’s AQI system and has recommended this for adoption in Dhaka with some modifi cations. Th e number of categories has been reduced from six to four to make the AQI simpler and easily understood. In addition, appropriate Bengali terms were used to describe the AQI categories (AQMP 2003). AQI categories are presented in Table 3.1. Th ese categories are being revised again.
NOx = Nitrogen oxide; SO2 = Sulfur dioxide; TSP = total suspended particulates; μg/m3 =
micrograms per cubic meter
Source: ADB, 2005.
TABLE 3.1
Results of Ambient Air Quality Analysis at Various Areas in
Chittagong (μg/m3)
Place Date TSP SO2
NOx
Chandgaon residential area 25/02/2003 208.4 20.2 28.3
02/09/2002 172.6 18.9 20.2
Khulshi residential area 12/03/2003 308.4 42.2 54.8
14/02/2002 213.1 51.3 60.2
16/01/2003 312.5 81.6 92.4
19/11/2002 282.8 46.7 54.4
10/10/2002 317.8 58.5 61.9
Nasirabad industrial area 11/03/2003 904.0 120.0 128.0
Agrabad commercial area 09/04/2003 804.0 111.0 115.0
District TSP range (μg/m3) Year/ Period of AQ Monitoring
Bogra 170–531 2003–2004
Rajshahi 329–680 2004
Sirajganj 400–420 2003
Pabna 500–829 2004
TSP = total suspended particulates; μg/m3 = micrograms per cubic meter
Source: ADB, 2005.
TABLE 3.2
TSP Concentrations in Some Major Cities in Bangladesh
AQI Range Category Color
0 to 100 Good Green
101 to 200 Unhealthy Orange
201 to 300 Very Unhealthy Purple
>301 Extremely Unhealthy Red
TABLE 3.3
Proposed AQI for Bangladesh
AQI = air quality index
Source: Air Quality Management Project , 2003.
Impacts of Air Pollution
HealthA number of studies have assessed the impacts of air pollution on the health of people in Bangladesh. Most of them, however, were conducted in the capital city of Dhaka.
Air pollution is estimated to be responsible for approximately 3,580 premature deaths, 10 million restricted activity days and 87 million respiratory symptom days per annum. Th e economic loss associated with these health problems could range from a low estimate of $60 million to a high estimate of $270 million, equivalent to 1.7 to 7.5% of the city’s gross product. If added with traffi c congestion, global warming, soiling of materials, and aesthetic degradation, the total cost of air pollution would be substantially larger (Xie et al. 1998).
In 1997, a study conducted by the Health Economics Unit of the Ministry of Health and Family Welfare found that the concentration of lead in blood (PbB) among the residents of the metropolis has reached alarming levels. Blood samples of 39 people that were analyzed under the survey were all above the maximum tolerable limit of 10 micrograms per deciliter (μg/dL) recommended by WHO. Th e concentration levels ranged from a minimum of 13 μg/dl to a maximum of 132 μg/dL. Th e survey also found that Pb levels in the blood of 12 professionals who attend offi ces in the Motijheel Commercial Area averaged 55.8 μg/dL. Th e blood of one motor vehicle
» Part Four
driver gave a reading of 86 μg/dL, 6 rickshaw-pullers averaged 46.3 μg/dL, and 11 auto-rickshaw drivers averaged 44.6 μg/dL. In addition, three outdoor laborers had an average of 79.3 μg/dl, one traffi c police offi cer 77 μg/dL, one homemaker 49 μg/dL, two indoor workers 25 μg/dL, and one student 13.6μg/dL (Th e Independent 1998).
In February 2000, another study determined the PbB levels of children at fi ve primary schools in Dhaka and evaluated the sources of environmental exposure, and potential risk factors for lead poisoning. Selected schools represented a range of geographic and socioeconomic strata. A total of 779 students 4–12 years of age participated. Th e mean PbB level was 15.0 μg/dL (range 4.2–63.1 μ/dL). Most students (87.4%) had PbB levels above the WHO guideline (10 μg/dL). Among other correlations, elevated PbB levels correlated with children living close to major roads (odds ratio = 2.30; 95% CI, 1.23–4.29. PbB levels measured were similar to those in other countries that use leaded gasoline. Combustion of leaded gasoline is the main source of lead exposure in Dhaka, resulting in ubiquitous contamination of the environment (Kaiser et al. 2001).
In addition, it has been found that Dhaka city has volatile organic compounds (VOCs) exceeding tolerable limits. Emissions from 2-stroke auto-rickshaws were found to contain four to seven times the maximum permissible levels of VOC (DOE 2001).
Air Quality Management
Legislation and Mandate Th e primary legislation instituted to mitigate air pollution is the 1995 Bangladesh Environmental Conservation Act (ECA) and the 1997 Environmental Conservation Rules (ECR) (DOE 1997, DOE 2002). DOE, under the Ministry of Environment and Forestry, is the key institution primarily responsible for AQ monitoring and management in Bangladesh. DOE’s air pollution responsibilities include the control and analysis of ambient AQ, the identifi cation of polluting industries, and providing support for the implementation of pollution prevention and control. Other core functions and activities of DOE include policy analysis, planning and evaluation of environmental requirements, monitoring and evaluation, compliance and enforcement, and environmental clearances and processing of environmental impact assessments (DOE 2005).
Bangladesh does not have a clean air act or law that specifi cally addresses air pollution and its management and control. Th ere are no clear indications whether one will be legislated in the coming years. A number of sector-specifi c policies (e.g., transport and industry sectors) and regulations that impact on air pollution, however, have been adopted.
City-specifi c action plans, such as the Action Plan to Improve Air Quality developed under the 2001 ADB-funded Urban Transport Environment Improvement Project, have also helped improve the AQM framework in the cities.
Ambient AQ StandardsTh e fi rst set of ambient AQ standards for Bangladesh was defi ned in the Environment Conservation Rules of 1997. Th ese 1997 standards were recently replaced by a new set in July 2005 based on the proposal of the World Bank-funded
» Part Five
AQM Project which reviewed the old standards. Th e new standards for PM (PM10, PM2.5), NO2, SO2, CO, and ozone (O3) are the same as the ambient AQ standards set by US EPA and the standard for Pb is equivalent to the guideline value set by WHO. Bangladesh is the only country in South Asia which set PM2.5 in its National Ambient Air Quality Standards (NAAQS). Th e standards for CO, NO2, SO2, and O3 are seen to be more lenient than the guidelines set by WHO. Table 5.1 details the updated ambient AQ standards for Bangladesh.
Management of Mobile SourcesTh e Bangladesh Road Transport Authority has a legal mandate to ensure gross polluting vehicles do not operate on the road network. However, its capacity to carry out this mandate is limited.
Despite this lack of capacity, Bangladesh has relatively made some progress in reducing emissions from vehicles. Management of mobile sources of air pollution in the country is outlined in ECR of 1997. Th e rules included adoption of emissions standards for gasoline, diesel, and CNG-fueled vehicles. Th e 1997 standards were reviewed in 2000 under the World Bank-fi nanced Dhaka Urban Transport Project (DUTP). Th e recommendations of the review were incorporated in the amendments made on the emissions standards gazetted in 2005. Th e emissions standards for gasoline and CNG vehicles in the country are now equivalent to Euro 2 standards and diesel vehicles to Euro 1 standards.
In response to a heightened awareness of the dangers of lead pollution, the Ministry of Energy reduced Pb content from 0.8g/l to an average of 0.4g/l. Th e initial plan of banning leaded fuel for 1999 was achieved a year earlier, again due to growing public pressure (DOE 2001). Bangladesh was the fi rst country in South Asia to ban leaded fuel (UNDP/World Bank 2002).

BANGLADESH 11
CO = Carbon monoxide; NOx = Nitrogen oxide; O
3 = ozone; Pb = lead; PM
10 = particulate matter with a diameter of not more than 10 microns; PM
2.5 = particulate matter with a diameter of not more than
2.5 microns; SO2 = Sulfur dioxide; S.R.O. = US EPA = United States Environmental Protection Agency; TSP = total suspended particulates; WHO = World Health Organization; μg/m3 = micrograms per cubic
meter; ppm = parts per million; – = no value
Source: a S.R.O. No: 220-Law, 2005; b WHO, 2005; c WHO, 2000; and d US EPA, 2006.
TABLE 5.1
Updated (2005) Bangladesh National Ambient Air Quality Standards vs. WHO Guideline Values and US EPA Standards
Pollutant Averaging Period Bangladesh Standardsa WHOb Guideline Values (μg/m3) US EPA Standards (μg/m3) d
CO 8-hour 10,000 μg/m3 (9 ppm) 10,000 c 10,000
1-hour 40,000 μg/m3 (35 ppm) 30,000 c 40,000
Pb Annual 0.5 μg/m3 0.5 –
NOx
Annual 100 μg/m3 (0.053 ppm) – –
TSP 8-hour 200 μg/m3 – –
PM10
Annual 50 μg/m3 20 revoked
24-hour 150 μg/m3 50 150
PM2.5
Annual 15 μg/m3 10 15
24-hour 65 μg/m3 25 35
O3
1-hour 235 μg/m3 (0.12 ppm) – 235
8-hour 157 μg/m3 (0.08 ppm) 100 157
SO2
Annual 80 μg/m3 (0.03 ppm) – 78
24-hour 365 μg/m3 (0.14 ppm) 20 365
In Dhaka, the Government was also successful in reducing air pollution when 2-stroke baby taxis were banned within city limits in January 2003. Some AQ monitoring results have measured decreases in PM10 and PM2.5 levels in the city aft er the ban.
Although mandated by law to conduct vehicle testing as a requirement for issuance of fi tness certifi cates, the Bangladesh Road Transport Authority (BRTA) has failed to optimize the use of the fi ve computerized vehicle testing centers (VTCs) that were set up in 2000. Two VTCs built for Dhaka and one each for Khulna, Chittagong, and Rajshahi failed to issue any fi tness certifi cate due to the failure of the contractors and suppliers to hand over the facilities to the Government. BRTA is planning to revive the centers through an ADB loan of 3.5 Taka (Tk) crore ($0.502 million)1 (Daily Star 2006).
Other intervention measures to reduce air pollution coming from vehicles include the ban on the plying of trucks older
1 Taka, abbreviated as Tk is the currency of Bangladesh. One crore is equivalent to 10 million. Conversion is based on rate of 1 US Dollar = 69.78 Bangladeshi Taka from Oracle GL Daily Rates for 6 August 2006. Available: http://forex.asiandevbank.org:8030/fx_rate/forex.jsp.
than 25 years and buses older than 20 years, promotion of CNG-fueled vehicles, as well as the establishment of standards for lubricants used for two- and three- wheelers.
Management of Stationary SourcesIndustrial pollution is a major issue in the major industrial cities of Bangladesh (especially Dhaka and Chittagong). Some monitoring data have already indicated that PM2.5 and PM10 exceed ambient standards near many industrial stack emissions. In Dhaka and Chittagong, the major source of TSP and other heavy metal pollutants are from brick kilns and cement manufacturing. In Dhaka, over 300 tanneries in a residential area (Hazaribagh) potentially emit signifi cant TSP that may also contain heavy metals like Chromium (ADB 2005).
Even before the enactment of the Environment Conservation Law in 1995, Bangladesh has already established a Brick

12 COUNTRY SYNTHESIS REPORT ON URBAN AIR QUALITY MANAGEMENT
Burning Control Act (1989 and 1992) to mitigate emissions from brick kilns (DOE 2001). Th e 1997 ECR also provided standards for gaseous discharge from industries.
Th e monitoring of stack emissions and ambient AQ monitoring near an industry, however, is a task not fully implemented due to lack of technical capacity in DOE. Lack of AQ information (emissions and concentration levels) hampers DOE from eff ectively enforcing industrial regulations.
Public/Nongovernment/Development Agency ParticipationTh e role of nongovernment institutions such as the academe, international development agency partners, and even the private sector in the improvement of the AQM system of the
country is important, especially in raising the awareness and understanding of the public on air pollution. Pressure from the public has helped facilitate the banning of leaded gasoline in the country as well as the removal of 2-stroke baby taxis in the city of Dhaka. Th e projects funded by development partners have also helped build the technical capacity of the government (e.g., DOE and BRTA) in carrying out its AQM responsibilities.
Academic institutions like BUET, Dhaka University, and Jahangirnagar University that have the capacity for AQ monitoring and analysis help improve the scientifi c knowledge base of air pollution in the country.
Organizations such as the Forum of Environmental Journalists, Bangladesh Paribesh Andolon, Bangladesh Environmental Lawyers’ Association, and the Society for Urban Environment Protection help raise awareness among the people on environ-mental issues including air pollution through conferences, reports, and ad campaigns.
Conclusion
Based on AQ monitoring results, PM is the main pollutant of concern in Bangladesh, especially in the cold winter months. Motor vehicles and resuspension of soil and road dust are major sources of these particulates as supported by research on source apportionment. Th e current levels of PM in Dhaka and in other locations are very high and clearly have adverse impacts on the health of the population. Th e major achievements of Bangladesh in reducing emissions from mobile sources include the ban of leaded gasoline, introduction of lubricant standards, switching to CNG fuel, and banning of baby taxis, old trucks, and buses—especially in Dhaka.
A countrywide AQM system, however, is still lacking in Bangladesh. Although the capacity to manage AQ has greatly improved in the past few years, and a large number of AQ-related activities in diff erent sectors (especially mobile sources) are happening, including the revision of ambient and vehicle emissions standards, an integrated framework for AQM still remains to be a task ahead. AQ monitoring and the compilation of emissions inventories remain as weaknesses.
» Part Six
It is important to expand and improve the AQ monitoring system in the country. Establishing one CAMS in a large city like Dhaka is still insuffi cient to assess the status of the quality of air fully as well as to monitor the impact of reduction measures in emissions. Th e lack of information on the positive impacts of measures may undermine the eff orts of the Government to improve the quality of air in the country. Th ere is also a need to conduct further studies to understand the impacts of air pollution on health and the environment, to guide policy development.
Although most projects and activities are focused in Dhaka, they have greatly infl uenced national policy making (i.e., revision of ambient AQ standards and vehicle emissions standards). AQMP in Dhaka is an important initiative that has made signifi cant improvements in the institutional capacity of DOE and BRTA and its expansion to other cities may be expected to make the same positive impact in these cities.
References
Asian Development Bank (ADB). 2001. Urban Indicators for Managing Cities (Cities Data Book). Eds. Matthew Westfall and Victoria A. de Villa. References. ADB, Manila.
Available at: www.adb.org/Documents/Books/Cities_Data_Book/default.asp.
———. 2005. Final Report: South Asian Subregional Economic Cooperation (SASEC) Countries for Regional Air Quality Management. Available at: www.cleanairnet.org/caiasia/1412/article-70581.html.
———. 2006. Key Indicators. ADB. Manila. Available at: www.adb.org/documents/books/key_indicators/2006/default.asp.
Akhter, S., S.M.A. Quadir, and A. Khan. 2003. Trends in Ambient Air Quality in Dhaka City. Paper presented in the Poster Session of the Better Air Quality Workshop. 17–19 December. EDSA Shangri-La Hotel, Manila: Philippines.
Air Quality Management Project (AQMP). 2003. Inter-Ministerial Committee Meeting. Working Paper 3 – Pro-posed Air Quality Indes (AQI) for Dhaka. Department of Environment. August. Bangladesh.
Asiatic Society of Bangladesh, 2006. Banglapedia. Available at: http://banglapedia.search.com.bd/HT/C_0288.htm.
Biswas, S.K., A. Islam, S.A. Tarafdar, and M. Khaliquzzaman. 2000. Monitoring of Atmospheric Particulate Matter (APM) in Bangladesh. Presented at the Joint UNDP/RCA/IAEA Project Conference on Sub Project: Air Pollution and its Trends. Manila: Philippines. 13–15 November.
British Petroleum, 2006. 2005 BP Statistical Review of World Energy. Available at: www.bp.com/statisticalreview.
Central Intelligence Agency (CIA). 2006. World Factbook – Bangladesh. Available at: www.cia.gov/cia/publications/factbook/print/bg.html.
Core J. 2003. An Action Plan for Dhaka, Bangladesh. Paper presented in the Better Air Quality Workshop 2003. 17–19 December. EDSA Shangri-La Hotel, Manila: Philippines. Available at: www.cleanairnet.org/baq2003/1496/article-58331.html.
Daily Star. 2006. ADB loans to kick-start vehicle testing centres. 6 August. Available at: www.thedailystar.net/2006/08/06/d60806011310.htm.
Department of Environment (DOE). 1997. Th e Environment Conservation Rules. Department of Environment. Dhaka, Bangladesh. Available at: http://www.doe-bd.org/2nd_part/179-226.pdf.
———. 2001. Bangladesh State of Environment 2001 Department of Environment, Dhaka, Bangladesh
———. 2002. Th e Bangladesh Environment Conservation Act, 1995. Act No.1 of 1995. Unoffi cial English Version. Department of Environment. Dhaka, Bangladesh. Available at: www.doe-bd.org/2nd_part/153-166.pdf.
Intercontinental Consultants and Technocrats Pvt. Ltd., India (ICTP). 2001. Summary Final Report. September. For ADB TA 3297-BAN Urban Transport and Environment Improvement Study. Available at: www.cleanairnet.org/caiasia/1412/articles-36556_BAN_TA3297_Summary_Rpt.pdf.
Islam, Sohel. 2003. Dhaka gets AQI. In Th e Daily Star. Vol. 4, No. 55, 20 July. Available at: www.thedailystar.net/2003/07/20/d30720250278.htm.
BANGLADESH 15
Kaiser, R., A.K. Henderson, W.R. Daley, M. Naughton, M.H. Khan, M. Rahman, S. Kieszak, C.H. Rubin. 2001. Blood lead levels of primary school children in Dhaka, Bangladesh. Environmental _Health Perspectives, 109: 563–566. Available at: http://ehp.niehs.nih.gov/members/2001/109p563-566kaiser/kaiser-full.html.
Malé Declaration. 2000. Baseline Information. Available at: www.rrcap.unep.org/issues/air/maledec/baseline/indexbag.html.
Nasiruddin, M. 2006. Setting Ambient Air Quality and Vehicular Emission Standards: Dhaka’s Experience. Presented during the Pakistan Development Partners Meeting on Clean Air. 14 September. Karachi.
United Nations Development Programme (UNDP)/World Bank. 2002. Bangladesh: Reducing Emissions from Baby-Taxis in Dhaka. United Nations Development Programme/ World Bank Energy Sector Management Assistance Programme. Available: www.worldbank.org/html/fpd/esmap/pdfs/253-02.pdf.
Xie, J., C.J. Brandon, and J.J. Shaj. 1998. Fighting Urban Transport Air Pollution for Local and Global Good: Th e Case of Two-Stroke Engine Th ree-Wheelers in Dhaka. World Bank paper, World Bank: Washington.


